Article

Isolation, Purification, and Antioxidant Activity of Polyphenols from Cynanchum auriculatum Royle ex Wight

by
Mustapha Muhammad Nasiru
1,2,†,
Yue-E Sun
3,†,
Lingyun Zhao
3,
Taing Bunhok
2,
Chuon Mony Roth
2,
Sun Sovath
2,
Hay Pharith
2,
Weidong Wang
3 and
Chunyang Li
1,2,*
1
Institute of Agro-Product Processing, Jiangsu Academy of Agricultural Sciences, Nanjing 210014, China
2
China-Cambodia Joint Laboratory on Detection and Functional Evaluation of Nutritional and Bio-Active Compounds, Phnom Penh 10103, Cambodia
3
School of Food and Biological Engineering, Xuzhou University of Technology, Xuzhou 221018, China
*
Author to whom correspondence should be addressed.
These authors contributed equally to this work.
Separations 2024, 11(11), 316; https://doi.org/10.3390/separations11110316
Submission received: 10 October 2024 / Revised: 25 October 2024 / Accepted: 28 October 2024 / Published: 1 November 2024

Abstract

:
Cynanchum auriculatum Royle ex Wight (CA) is a traditional medicinal and edible plant in China. This study aimed to isolate and characterize the phenolic compounds of C. auriculatum to identify its main antioxidant constituents. Polyphenols were extracted using an ultrasound-assisted ethanol extraction method, followed by partitioning with ethyl acetate. The ethyl acetate extract was then purified through thin-layer chromatography, silica gel column chromatography, and reverse-phase silica gel column chromatography. Three monomeric compounds—cynandione A (I), 2,5-dihydroxyacetophenone (II), and radix piperacanthone (III)—were identified through their physical and chemical properties, UV and IR spectra, and liquid chromatography–mass spectrometry (LC-MS/MS). Vitamin C (VC) and 2,4-dihydroxyacetophenone were used as controls to evaluate the antioxidant potential of the two most abundant monomers. Antioxidant assays demonstrated that 2,5-dihydroxyacetophenone and cynandione A exhibited strong antioxidant activity at lower concentrations, whereas 2,4-dihydroxyacetophenone showed significantly weaker activity. Furthermore, cynandione A displayed superior cellular antioxidant activity compared to 2,5-dihydroxyacetophenone, indicating its potential as a promising bioactive compound. In conclusion, this study provides valuable insights into the phenolic composition of C. auriculatum and highlights cynandione A as a key antioxidant, paving the way for future research on its therapeutic applications.

1. Introduction

Baishouwu is a plant of the genus Asclepiadaceae in the Cynanchum L. family, which is derived from Cynanchum bungei Decne (CB), Cynanchum auriculatum Royle ex Wight (CA), and Cynanchum wilfordii (Maxim.) Hemsl. (CW). The root of CA is a well-known Chinese herbal medicine and has been used as local food in Binhai County, Jiangsu Province, China, for more than 100 years [1,2]. In China, 95% of the CA variety of Baishouwu is produced in Binhai, Jiangsu, which is famously known as the “hometown of Baishouwu”. Modern pharmacological research has demonstrated that CA exhibits a range of biological activities, including antioxidant [3,4,5], antitumor [6,7], anti-inflammatory [8], anti-aging, anti-hypoxia, and immune-regulating effects [9,10]. Current research has mainly concentrated on steroidal glycosides, phospholipids, phenylpropanoids, and polysaccharides found in CA, while studies on its polyphenolic compounds and their bioactivities are scarce [11,12,13]. The phenolic hydroxyl groups, known for their potent antioxidant activity, can effectively neutralize free radicals responsible for diseases such as tumors, cardiovascular conditions, and hypertension, thereby making polyphenolic compounds a focal point of scientific interest.
In addition to traditional extraction methods such as hot water, organic solvents, and alkaline solutions, novel techniques like ultrasound-assisted and microwave-assisted extraction have increasingly been applied to the extraction of phenolic compounds. Thin-layer chromatography (TLC), column chromatography, and preparative liquid chromatography are commonly used for the separation and purification of natural products. Ultraviolet–visible (UV–Vis) spectroscopy offers a simple and effective means of identifying flavonoids and polyphenolic compounds by analyzing the position and intensity of absorption peaks, which allows for a preliminary inference of the substance’s structure [14]. Infrared (IR) spectroscopy provides information on the skeletal structure, functional groups, and bonding patterns of compounds by analyzing their absorption of specific infrared wavelengths. Liquid chromatography–mass spectrometry (LC-MS) is used to analyze characteristic ion fragments and fragment peaks, and after determining the molecular weight, the compound’s structure can be more reliably identified by combining these data with nuclear magnetic resonance (NMR) hydrogen and carbon spectra.
Although substantial research has explored the pharmacological effects of steroidal glycosides and phospholipids in CA, the polyphenolic compounds, known for their antioxidant properties, have received comparatively little attention. To address this gap, this study focuses on isolating these polyphenols and evaluating their antioxidant potential, thereby enhancing our understanding of the bioactive components in CA. The extraction process began with ethanol to obtain the polyphenols, followed by partitioning the ethanol extract with ethyl acetate. The ethyl acetate extract was then fractionated using silica gel column chromatography and further purified via RP-C18 silica gel column chromatography. The isolated bioactive compounds were identified using LC-MS and NMR techniques, revealing the primary antioxidant components of CA and confirming their antioxidant activity.

2. Materials and Methods

2.1. Plant Material

Yancheng Guolao Shouwu Technology Co., Ltd. (Yancheng, China) provided the powder of CA. The plant was harvested in Binhai County, Yancheng City, Jiangsu Province (33°43′–34°23′ N latitude and 119°37′–120°20′ E longitude) around November 2020.

2.2. Materials and Reagents

Rutin, gallic acid, ascorbic acid, and 2’,4’-dihydroxyacetophenone were sourced from Sinopharm Chemical Reagent Co., Ltd. (Shanghai, China); ABTS, 1,1-diphenyl-2-picrylhydrazyl (DPPH), DMSO, penicillin–streptomycin solution, and DCFH-DA were supplied by Sigma-Aldrich (Merck, Darmstadt, Germany); HepG2 cell line (passages 20–40) was obtained from the China Center for Type Culture Collection (CCTCC); HBSS was provided by Thermo Fisher Scientific (Waltham, MA, USA); Folin–Ciocalteu reagent, potassium persulfate, and potassium ferricyanide were supplied by Shanghai Macklin Biochemical Co., Ltd. (Shanghai, China); silica gel for chromatography (200–300 mesh) and silica gel for thin-layer chromatography (TLC, 10–12 mesh) were purchased from Qingdao Marine Chemical Factory; octadecylsilane (ODS) bonded silica gel (specifications pending) was provided by YMC Co., Ltd. (Kyoto, Japan); ethyl acetate was provided by Nanjing Chemical Reagent Co., Ltd. (Nanjing, China); methanol, anhydrous ethanol, sodium hydroxide, sodium nitrite, aluminum nitrate, trichloroacetic acid, and ferric chloride, all of analytical grade, were sourced from Sinopharm Chemical Reagent Co., Ltd.; ferrous sulfate heptahydrate, 30% hydrogen peroxide (H2O2), and ABAP were purchased from Shanghai Aladdin Biochemical Technology Co., Ltd. (Shanghai, China); and double-deionized water was used for all experiments.

2.3. Preparation of Ethanol Extract

A precise amount of 1600 g of dried CA powder was weighed. The powder was subjected to ultrasonic-assisted extraction using 90% ethanol solution at a material-to-liquid ratio of 1:20, with ultrasonic conditions set at 40 °C for 30 min. The extractions were carried out three times independently and each experiment was repeated three times. The effects of each factor on the amount of extraction were analyzed by polar analysis, the optimal process conditions were finally determined, and the mean value of total polyphenol content of 6.68 mg/g was measured by three validation tests. The resulting extract was then vacuum-filtered to obtain the crude ethanol extract of CA. Meanwhile, the remainder was the solid plant material that was not dissolved or extracted.

2.4. Preparation of Ethyl Acetate Extract

The crude ethanol extract of CA was concentrated by rotary evaporation to remove ethanol, yielding approximately 0.4 kg of extract concentrate. The concentrate was dissolved in 1.5 L of distilled water to form a suspension, which was then repeatedly extracted with ethyl acetate until the extract solution turned colorless. The combined ethyl acetate layers were concentrated by rotary evaporation and then vacuum-dried, yielding approximately 39.72 g of ethyl acetate extract.

2.5. Separation and Purification of Ethyl Acetate Extract

The ethyl acetate extract was mixed with 200–300 mesh silica gel and packed into a column. Gradient elution was performed with a petroleum ether–ethyl acetate system (20:1–1:1, v:v) and a chloroform–methanol system (10:1–1:1, v:v), and fractions were collected every 250 mL. The collected components were analyzed by thin layer chromatography (TLC), and the same components were combined to obtain 6 components (Fr.A1~Fr.A6).
Component 3 (Fr.A3) was then eluted with an RP-C18 column in a methanol–water system (10:90~70:30) gradient, and fractions were collected every 100 mL of eluent. TLC detected the collected components, and the same components were used for color development with ferric chloride solution. Two components were obtained by combining the same components (FR.A3-1~A3-2). Compound 1 (43.8 mg) was obtained by repeated recrystallization of Fr.A3-1.
Component 5 (Fr.A5) was then eluted with RP-C18 silica gel column in a methanol–water system (10:90~70:30) gradient, and fractions were collected from every 100 mL of eluent. TLC detected the collected components, and the same components were used for color development with ferric chloride solution, and two components were obtained by combining the same components (FR.A5-1~A5-2). Fr.A5-1 was purified by reverse-phase silica gel column again, and compound 2 (15.3 mg) was collected.
Component 6 (Fr.A6) was then treated with RP-C18 silica gel column as above; TLC detected the collected components, and the same components were combined to obtain 2 components (FR.A6-1~A6-2). The color was developed with a ferric chloride solution, and the Fr.A6-2 components were recrystallized repeatedly to obtain compound 3 (2.5 mg).

2.6. Compound Structure Identification
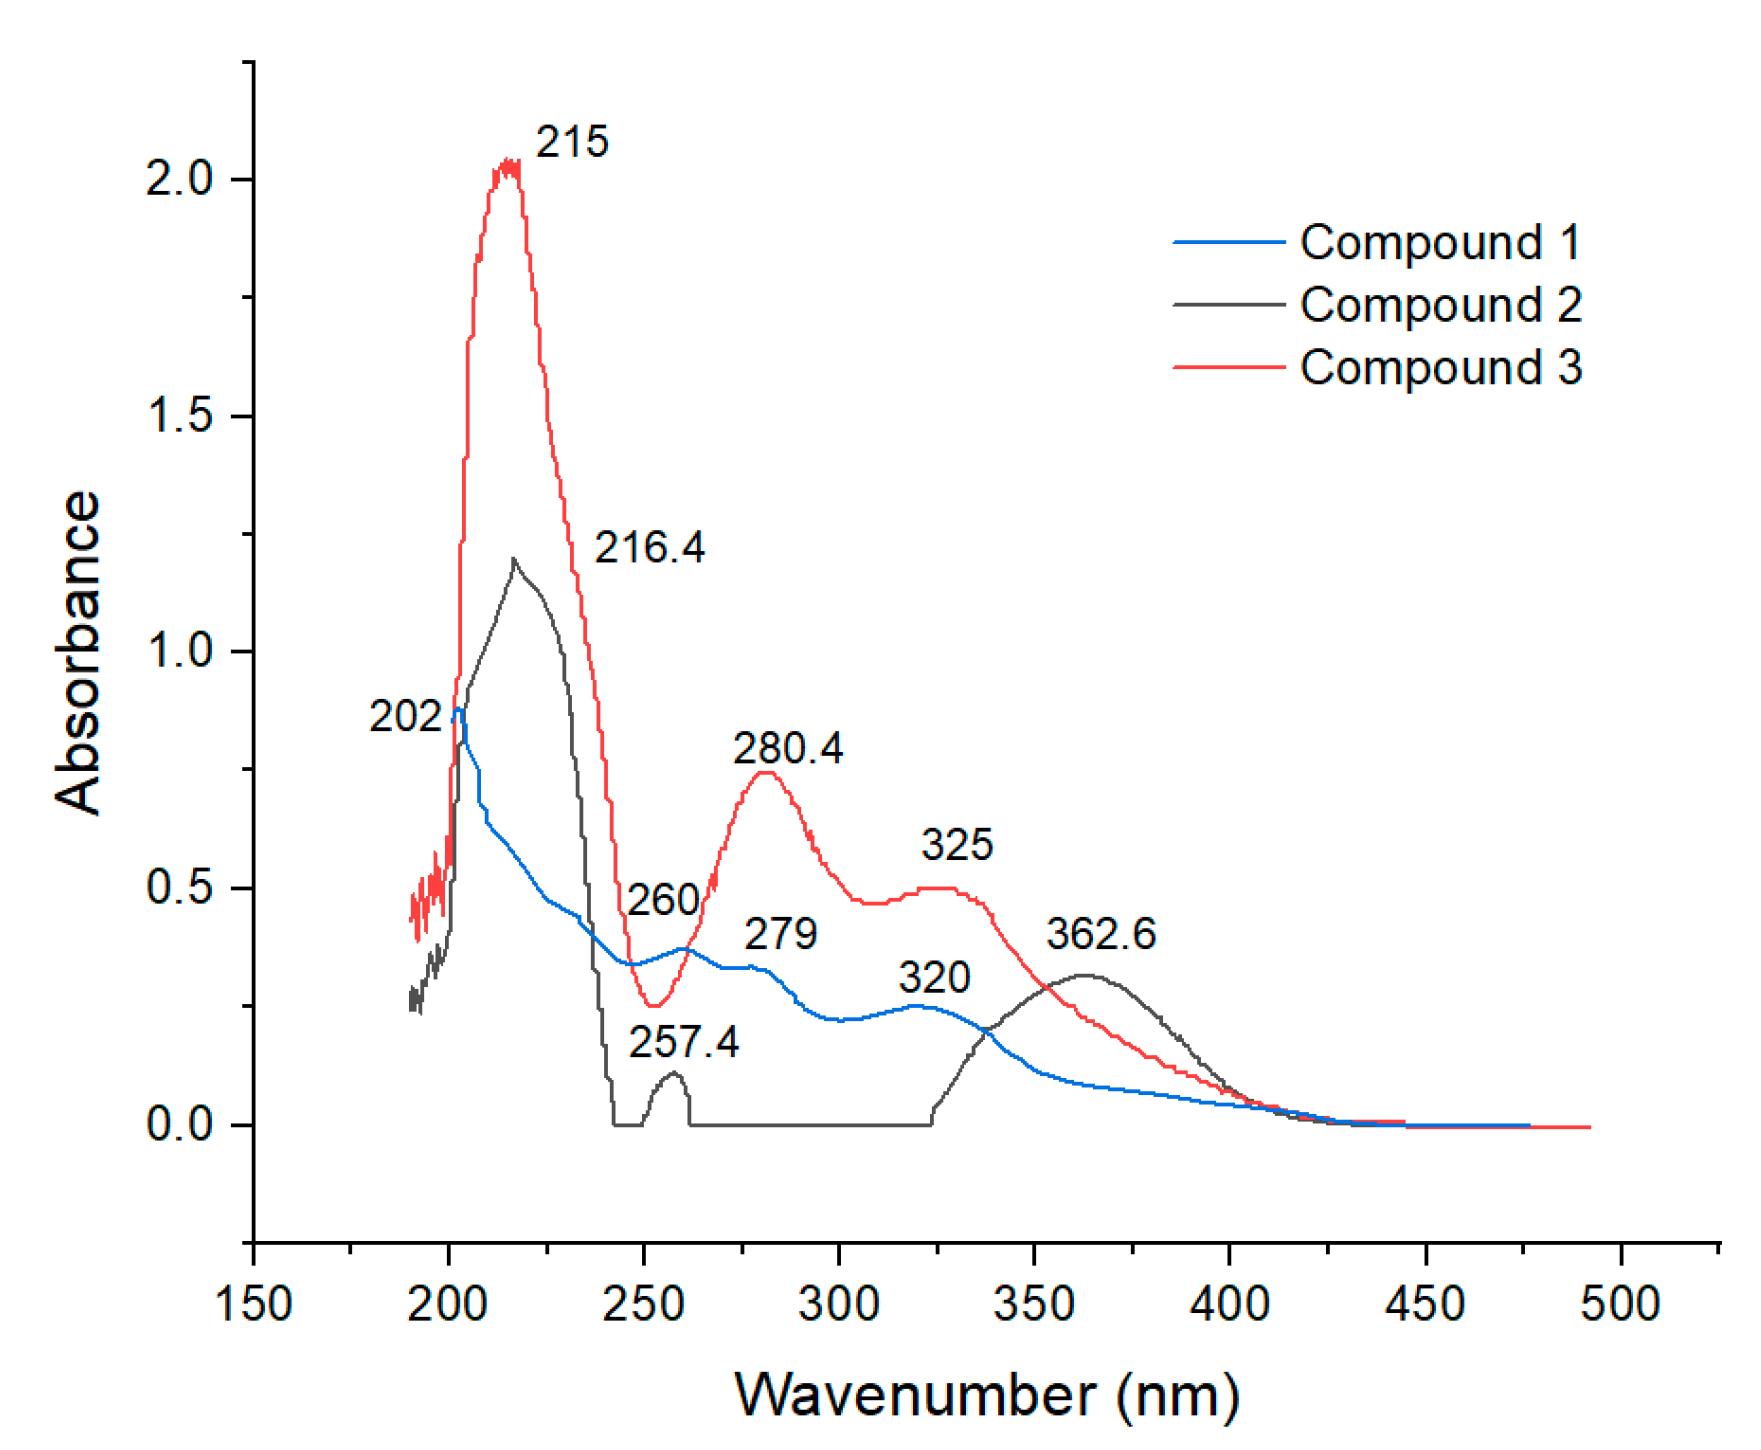
2.6.1. UV Analysis

Approximately 1 mg of the purified and dried compound was dissolved in 10 mL of methanol. Methanol was used as a blank for zero calibration, and the compound was scanned over the wavelength range of 200–500 nm using an EU-2600R UV-Vis spectrophotometer. The resulting wavelength scan spectrum was recorded.

2.6.2. Infrared Spectroscopy Analysis

Approximately 2 mg of the purified and dried compound was mixed with about 0.5 g of potassium bromide (KBr), ground to a fine powder, and pressed into a pellet. The sample was then scanned in the range of 1000–4000 cm−1 using a Nicolet iS50 Fourier-transform infrared spectrometer. The infrared spectrum was analyzed in conjunction with the mass spectrum and nuclear magnetic resonance (NMR) spectrum (described in the Section 2.6.4) to determine the molecular structure of the compound [15].

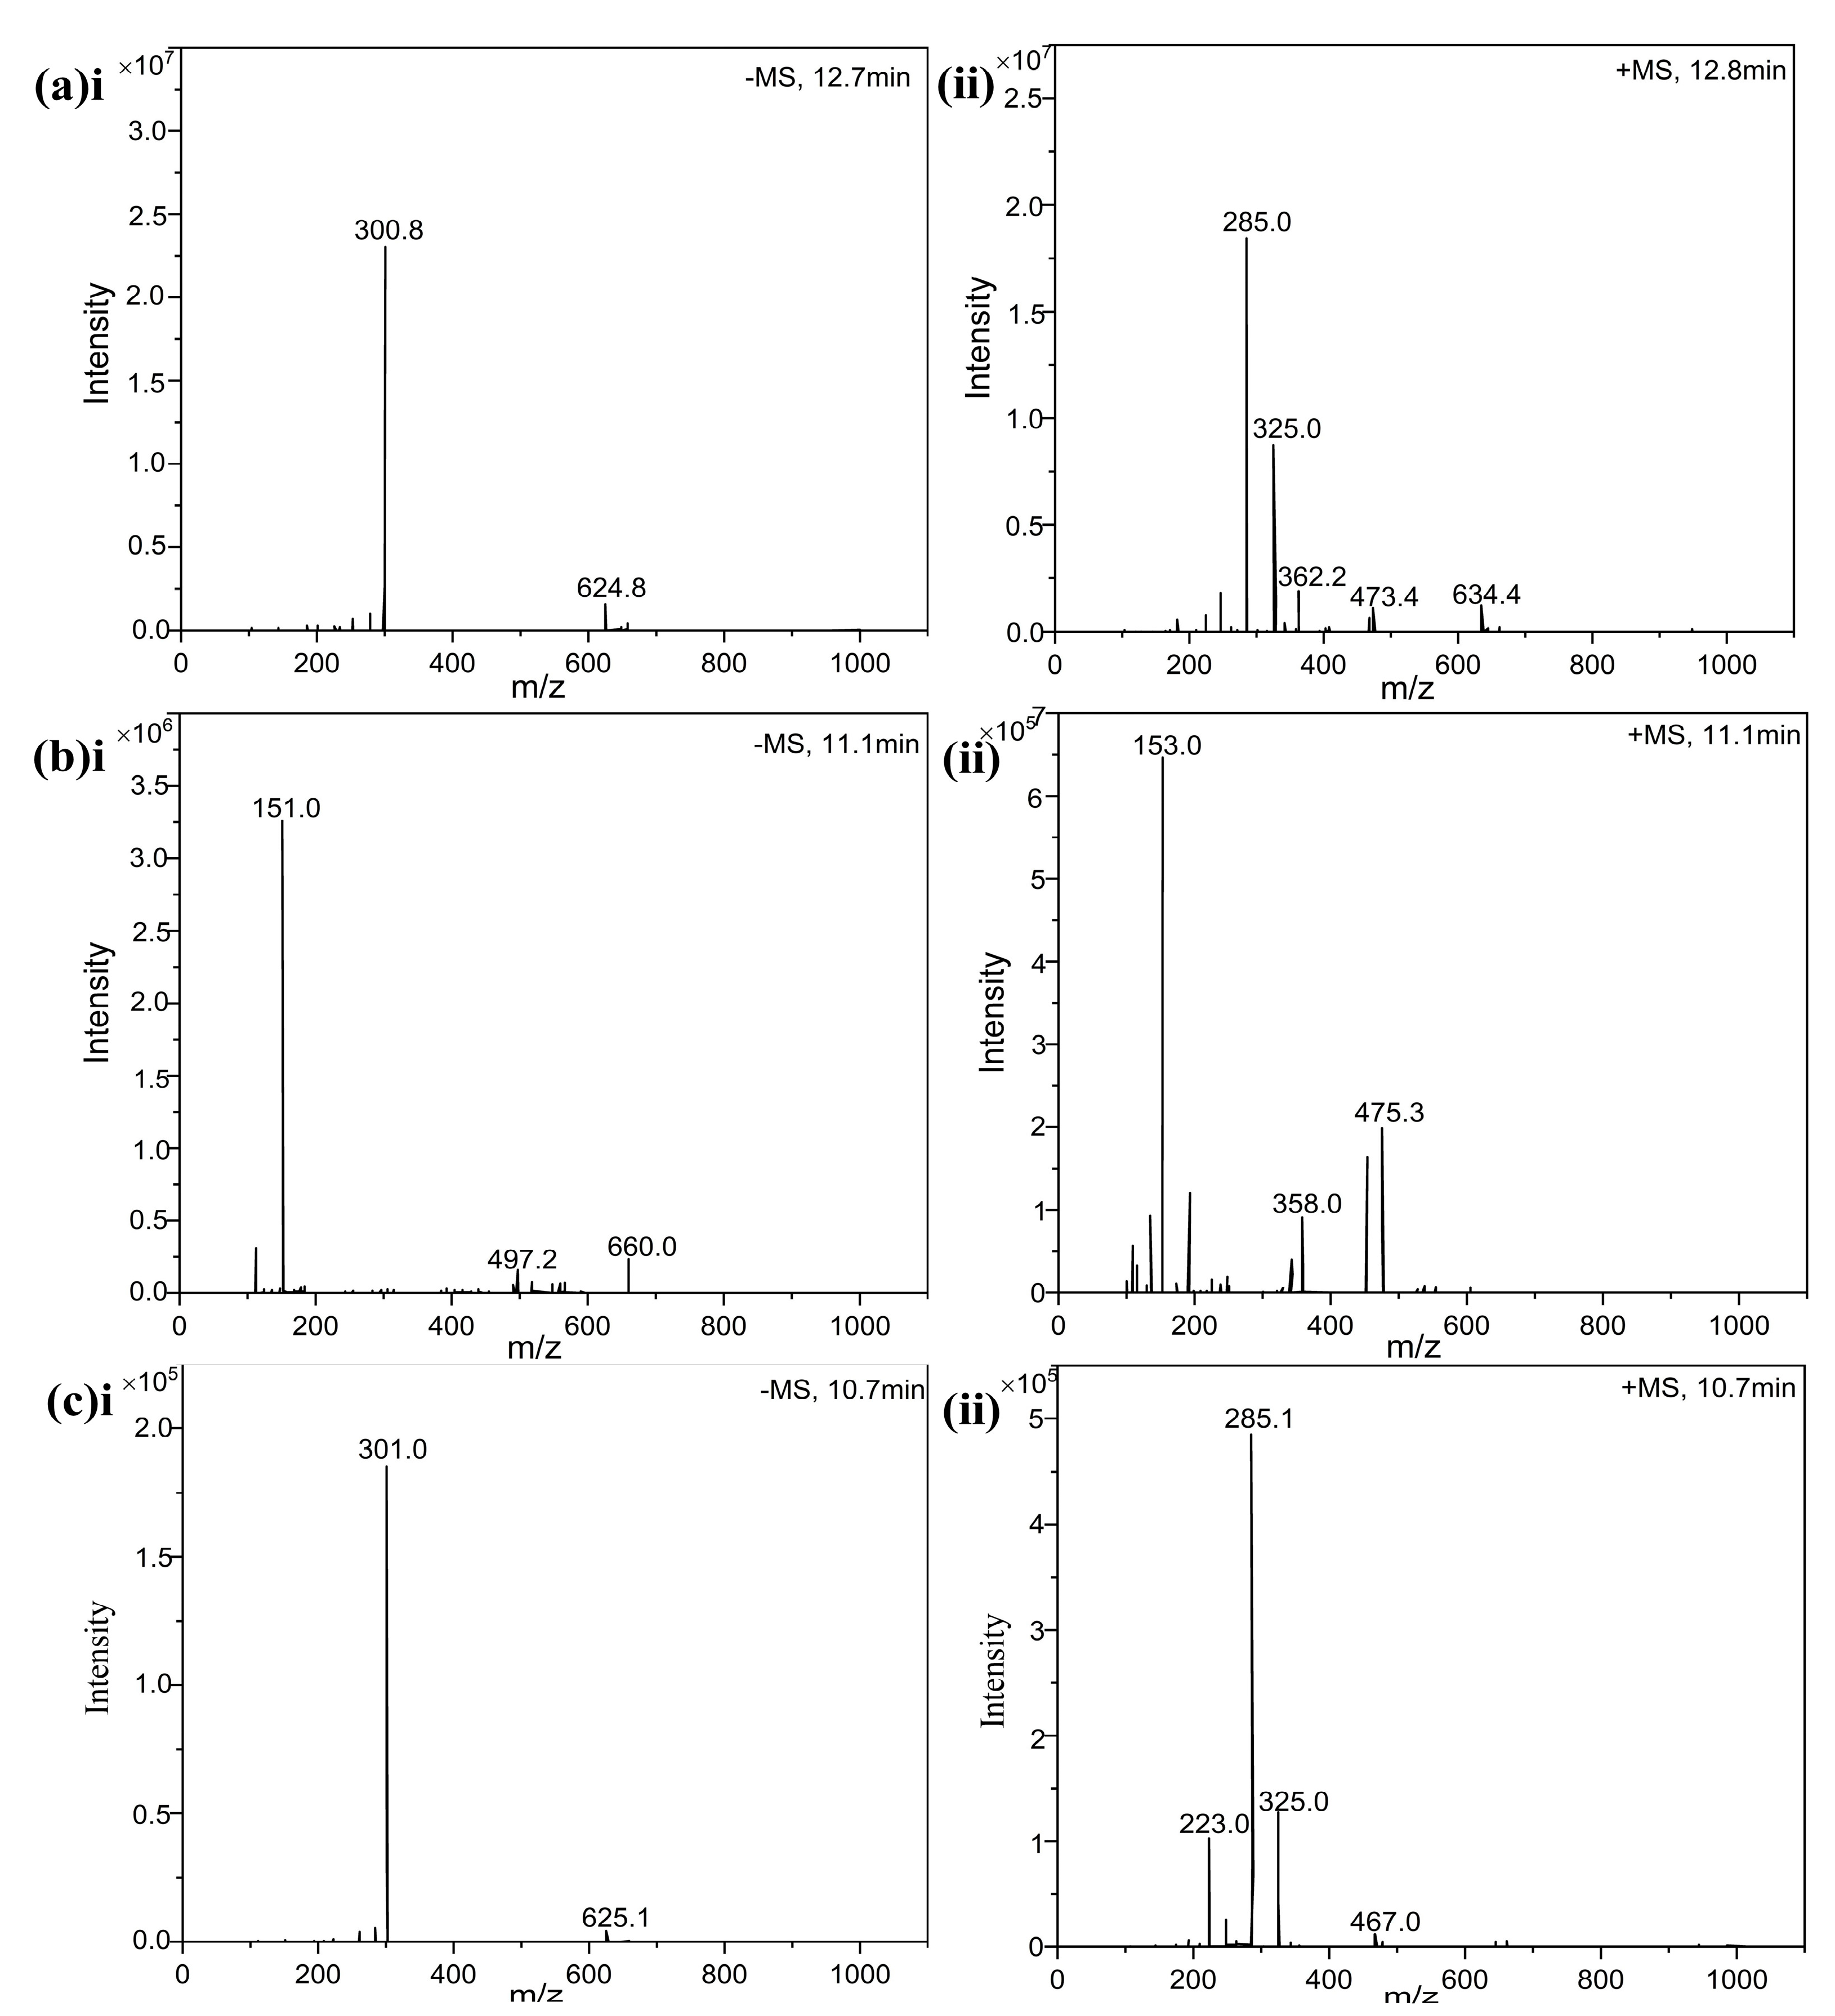
2.6.3. Liquid Chromatography–Mass Spectrometry (LC-MS) Analysis

Approximately 0.0005 g of each purified and dried compound was dissolved in 1 mL of 30% methanol, filtered through a 0.22 μm organic microporous membrane, and directly injected for analysis.
Liquid Chromatography Conditions: An Agilent Poroshell 120 EC-C18 column (3.0 × 50 mm, 2.7 μm) was used. The mobile phase consisted of an aqueous solution containing 0.4% formic acid (A) and methanol (B). The flow rate was set at 0.3 mL/min, with the column temperature maintained at 35.0 °C and an injection volume of 5.0 μL. Gradient elution was performed as follows: 0–15 min, 20–70% B; 15–17 min, 70% B; and 17–20 min, 70–20% B. The UV data collection range was 190–400 nm, with a detection wavelength of 360 nm.
Mass Spectrometry Conditions: The mass spectrometer was operated using an electrospray ionization (ESI) source. In negative ion mode, the capillary voltage was set to 3500 V, the desolvation temperature to 350 °C, the gas flow rate to 10 L/min, and the spray gas pressure to 45 psi. In positive ion mode, the capillary voltage was set to 4000 V, with the desolvation temperature at 350 °C, gas flow rate at 10 L/min, and spray gas pressure at 45 psi. The scanning range was set to m/z 100–1000.

2.6.4. Nuclear Magnetic Resonance Analysis (NMR)

The compounds were dissolved with deuterated methanol and moved into the nuclear magnetic tube, and the sample was measured using Bruker AVANCE NEO 500M Nuclear magnetic resonance (NMR, Bruker Biospin GmbH, Karlsruhe, Germany) in deuterated reagents. All the samples were identified by 1H NMR and 13C NMR. Chemical shift values (δ) were given in parts per million (ppm) and the coupling constant (J) in Hz. Signal multiplicities were described as follows: s (singlet), d (doublet), dd (doublet of doublets), t (triplet), m (multiplet), and br s (broad singlet). The data were processed by phase correction and baseline correction using MestReNova software (MestReNova 14.3.1, Mestrelab Research S.L., Santiago de Compostela, A Coruña, Spain).

2.7. Antioxidant Activity Determination

2.7.1. DPPH Test

Totals of 100 μL of varying concentrations of cynandione A, 2,5-dihydroxy acetophenone, and 2,4-dihydroxy acetophenone solutions were added to a 96-well plate, along with 100 μL of 0.1 mmol/L DPPH-ethanol solution. The mixture was thoroughly mixed and incubated in a 37 °C water bath in the dark for 30 min. Ascorbic acid was used as the positive control, and the absorbance was measured at 517 nm [16,17]. The DPPH radical scavenging rate was calculated using the following formula:
S c a v e n g i n g   r a t e % = A 1 A 2 A 3 × 100
where “A1” represents the absorbance of the DPPH–ethanol solution mixed with the sample solution; “A2” represents the absorbance of the anhydrous ethanol mixed with the sample solution; and “A3” represents the absorbance of the mixture of DPPH–ethanol solution and 80% ethanol solution.

2.7.2. Hydroxyl Free Radical Test

The hydroxyl free radical scavenging test was performed in a polystyrene microplate, as described by Zhang [18]; in each well, 50 μL of 9 mmol/L FeSO4 solution and 8.8 mmol/L H2O2 solution were added to 25 μL of various concentrations of cynandione A, 2,5-dihydroxy acetophenone, and 2,4-dihydroxy acetophenone solutions. We mixed thoroughly and allowed the reaction to stand for 10 min. Then, we added 50 μL of 9 mmol/L salicylic acid–ethanol solution, mixed well, and incubated it in the dark at 37 °C for 30 min. The absorbance at 510 nm was measured. Ascorbic acid (VC) was used as a positive control. The hydroxyl free radical scavenging rate was calculated using the following formula:
O H   S c a v e n g i n g   r a t e % = 1 A 1 A 2 A 3 × 100
where A1 represents the absorbance of the sample group, A2 represents the absorbance of the control group, and A3 represents the absorbance of the blank group.

2.7.3. ABTS Test

A 7 mmol/L ABTS+ solution was mixed with a 2.45 mmol/L K2S2O8 solution in a 1:1 ratio and allowed to react in the dark at room temperature for 12–16 h, forming a blue-green ABTS+ stock solution. This stock solution was then diluted 20–30 times with 95% ethanol until the absorbance at 734 nm was 0.70 ± 0.02, creating the ABTS+ working solution. In a 96-well plate, 4 μL of various concentrations of cynandione A, 2,5-dihydroxy acetophenone, and 2,4-dihydroxy acetophenone solutions were added, followed by 196 μL of the ABTS+ working solution. After reacting for 10 min in a 37 °C water bath, the absorbance at 734 nm was measured [19]. Three replicate wells were used, and the average value was calculated. Ascorbic acid (VC) served as a positive control. The ABTS radical scavenging rate was calculated using the following formula:
S c a v e n g i n g   r a t e % = A 1 A 2 A 3 × 100
In the formula, A1 represents the absorbance of the solution containing the extract; A2 represents the absorbance of the background (without the extract); and A3 represents the absorbance of the blank solution.

2.7.4. Total Reducing Power Measurement

Following the method described in the literature [20], 1 mL of different concentrations of cynandione A, 2,5-dihydroxy acetophenone, and 2,4-dihydroxy acetophenone solutions were each mixed with 0.2 mL of 0.2 mol/L phosphate buffer (pH 6.6) and 0.5 mL of 1% potassium ferricyanide solution. The mixtures were incubated in a 50 °C water bath for 20 min. The reaction was then terminated by adding 1.0 mL of 10% trichloroacetic acid solution, followed by centrifugation at 4000 r/min for 10 min. The supernatant (1.5 mL) was transferred to a test tube, where 0.2 mL of 1% ferric chloride solution and 3 mL of deionized water were added. The mixture was shaken and allowed to react for 8 min. Absorbance was measured at 700 nm. Three parallel measurements were performed, and the average value was taken. Ascorbic acid (VC) was used as a positive control to evaluate the total reducing power.

2.8. Statistical Analysis

Data were processed and analyzed using Microsoft Excel (Office 2016), Origin 8.0 software, and SPSS Statistics 23. All experiments were conducted in triplicate. Data were expressed as mean ± standard deviation (SD). Statistical significance was determined using one-way ANOVA followed by Tukey’s post hoc test for multiple comparisons. A p-value of <0.05 was considered statistically significant.

3. Results and Discussion

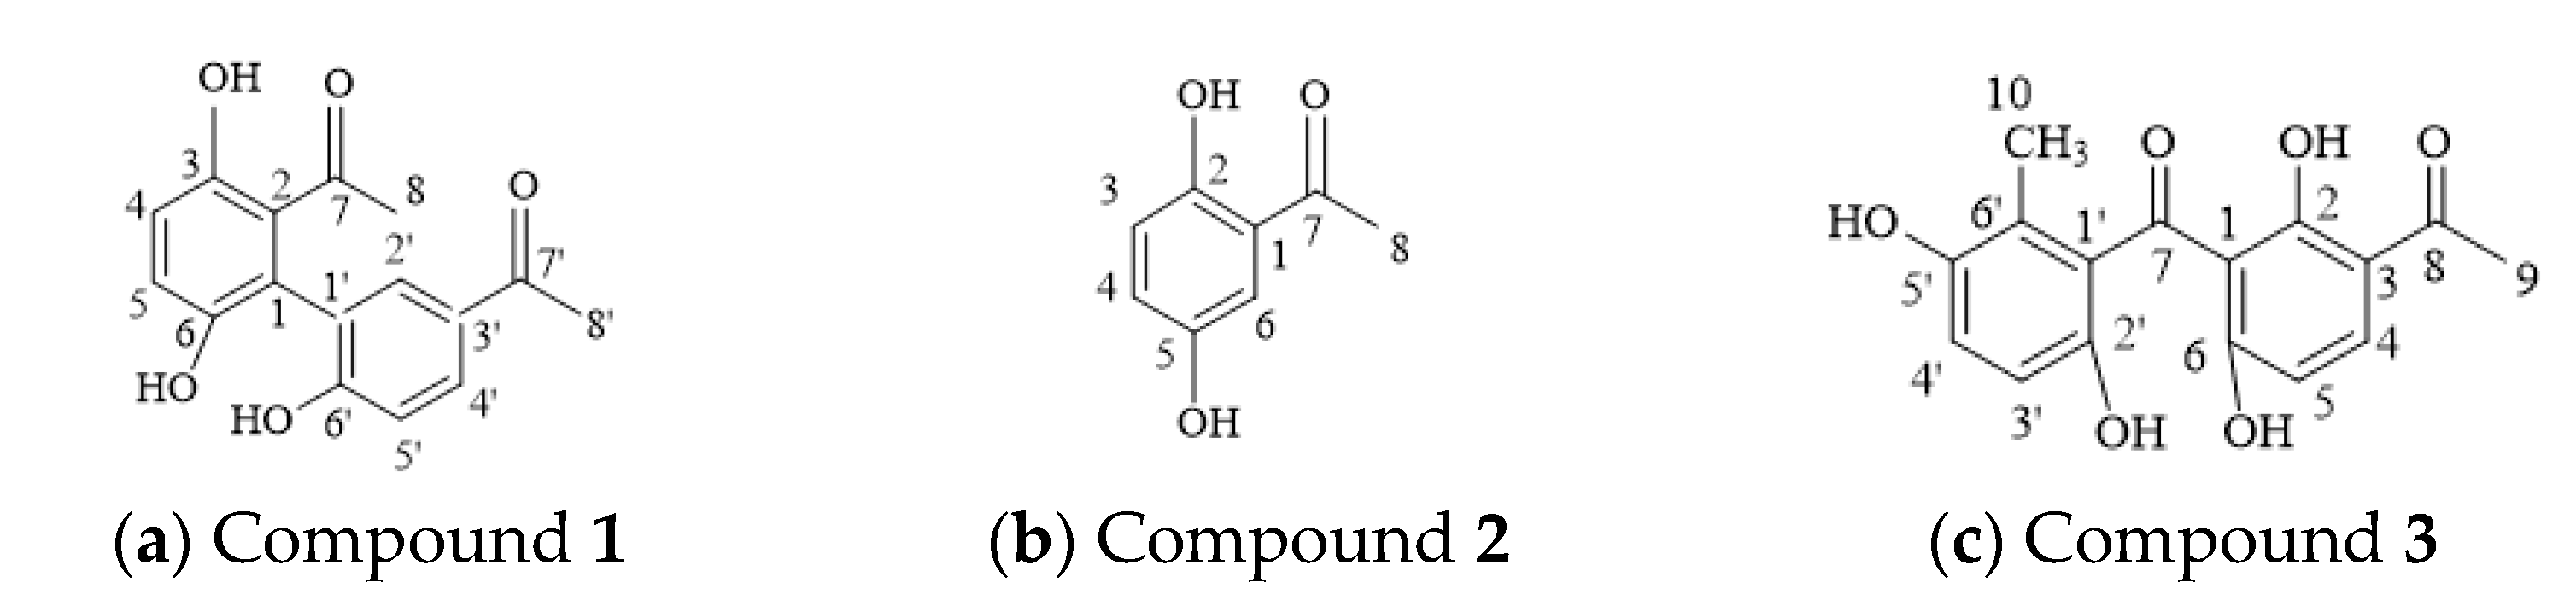
3.1. Chemical Structure Identification

3.1.1. Purified Compound 1

As shown in Figure 1, within the wavelength range of 200–500 nm, the UV spectrum of compound 1 displays characteristic absorption peaks at 202 nm, 260 nm, 279 nm, and 320 nm, with the strongest absorption at 202 nm. This peak likely corresponds to the E absorption band of aromatic compounds, while the peaks at 260 nm and 279 nm are B absorption bands, suggesting that compound 1 may contain a benzene ring. As shown in Figure 2a, the infrared (IR) spectrum of compound 1 displays characteristic absorption peaks at 3530 cm−1 (associated OH), 3329.5 cm−1 (OH), 3095 cm−1 (associated OH), 1694 cm−1 (C=O), 1625 cm−1 (C=O), 1603 cm−1, and 1502 cm−1 (skeletal vibrations of the benzene ring).
The LC-MS analysis of compound 1 reveals that, at a detection wavelength of 254 nm using a DAD detector, the HPLC chromatogram displays a single peak, as shown in Figure 3. Using the HPLC peak area normalization method, the purity of compound 1 is calculated to be 96%. From the mass spectrum in Figure 4, the quasi-molecular ion peak [M-H] in negative ion mode (Figure 4ai) has a mass-to-charge ratio (m/z) of 300.8, while in positive ion mode (Figure 4aii), the [M-H2O+H]+ peak has an m/z of 285. This indicates that the molecular weight of compound 1 is 302 (Figure 4a).
Based on the comprehensive analysis of the UV spectrum, IR spectrum, and LC-MS spectrum, compound 1 is identified as cynandione A. The proton and carbon NMR data are generally consistent with those reported in the literature [20,21], confirming the identification of compound 1 as cynandione A, with the molecular formula C16H14O6 and a molecular weight of 302.0790. The molecular structure is shown in Figure 5a.

3.1.2. Purified Compound 2

The UV spectrum of compound 2 shows characteristic absorption peaks at 216 nm, 257 nm, and 363 nm, with the strongest absorption at 216 nm (Figure 1). The peaks at 216 nm and 257 nm are associated with the E band and B band, respectively, which are typical of a benzene ring, indicating that compound 2 may contain a benzene ring.
The IR spectrum of compound 2 (Figure 2b) shows characteristic absorption peaks at 3232 cm−1 (associated OH), 2929 cm−1 (OH), 1642 cm−1 (C=O), 1614 cm−1, and 1496 cm−1 (skeletal vibrations of the benzene ring).
The LC-MS analysis of compound 2, as shown in Figure 4b, reveals that it displays a single peak in high-performance liquid chromatography (HPLC) at a detection wavelength of 254 nm using a DAD detector. The HPLC peak area normalization method determined that the purity of compound 2 is 95%. The mass spectrum shows that the quasi-molecular ion peak [M-H] in negative ion mode (Figure 4bi) has a mass-to-charge ratio (m/z) of 151, while in positive ion mode (Figure 4bii), the [M+H]+ peak has an m/z of 153 (Figure 4b). This indicates that the molecular weight of the compound 2 is 152.
Compound 2 is identified as 2,5-dihydroxyacetophenone, with its proton and carbon NMR data matching the literature reports (Table 1) [22]. Therefore, compound 2 is confirmed as 2,5-dihydroxyacetophenone, with the molecular formula C8H8O3 and a molecular weight of 152.1470. Its molecular structure is shown in Figure 5b.

3.1.3. Purified Compound 3

The UV spectrum of compound 3 shows characteristic absorption peaks at 215 nm, 280 nm, and 325 nm, with the strongest absorption at 215 nm (Figure 1). This peak is likely the characteristic absorption peak of a benzene ring, suggesting that compound 3 may contain a benzene ring.
The IR spectrum of compound 3 exhibits characteristic absorption peaks at 3525 cm−1 (associated OH), 3329 cm−1 (OH), 3110 cm−1 (associated OH), 2922 cm−1 (OH), 1694 cm−1 (C=O), 1626 cm−1 (C=O), 1605 cm−1, and 1501 cm−1 (skeletal vibrations of the benzene ring) (Figure 2c).
The LC-MS analysis of compound 3 shows that, at a detection wavelength of 254 nm using a DAD detector, high-performance liquid chromatography (HPLC) displays a mostly single peak. The HPLC peak area normalization method determined the purity of compound 3 to be 94% (Figure 3). The mass spectrum indicates that the quasi-molecular ion peak [M-H] in negative ion mode (Figure 4ci) has a mass-to-charge ratio (m/z) of 301, while in positive ion mode (Figure 4cii), the [M-H2O+H]+ peak has an m/z of 285 (Figure 4c). This suggests that the molecular weight of compound 3 is 302.
Compound 3 is inferred to be a diphenyl ketone derivative from CA, with its proton and carbon NMR data consistent with the literature reports (Table 1) [23]. Consequently, compound 3 is identified as this diphenyl ketone, with the molecular formula C16H14O6 and a molecular weight of 302.0790. The molecular structure is shown in Figure 5c.
In this experiment, three monomeric compounds were isolated from the ethyl acetate fraction of CA: cynandione A, 2,5-dihydroxy acetophenone, and a diphenyl ketone derivative from CA. These substances are all polyphenolic compounds and belong to the acetophenone class. The experimental results confirm the presence of polyphenolic compounds in Binhai CA. Polyphenolic compounds have been demonstrated to possess antioxidant, anti-inflammatory, antitumor, and hypoglycemic effects, with anti-inflammatory properties being widely applied in clinical treatments. Thus, polyphenolic compounds have significant potential for medicinal and health-related applications, and their biological activities merit further research.
Due to the limited quantity of the diphenyl ketone derivative obtained, it is not easy to perform subsequent activity tests on this compound. Since cynandione A is structurally composed of 2,5-dihydroxyacetophenone and 2,4-dihydroxyacetophenone, subsequent in vitro antioxidant activity tests will focus on 2,5-dihydroxyacetophenone, 2,4-dihydroxyacetophenone, and cynandione A to explore the relationship between antioxidant activity and their chemical structures.

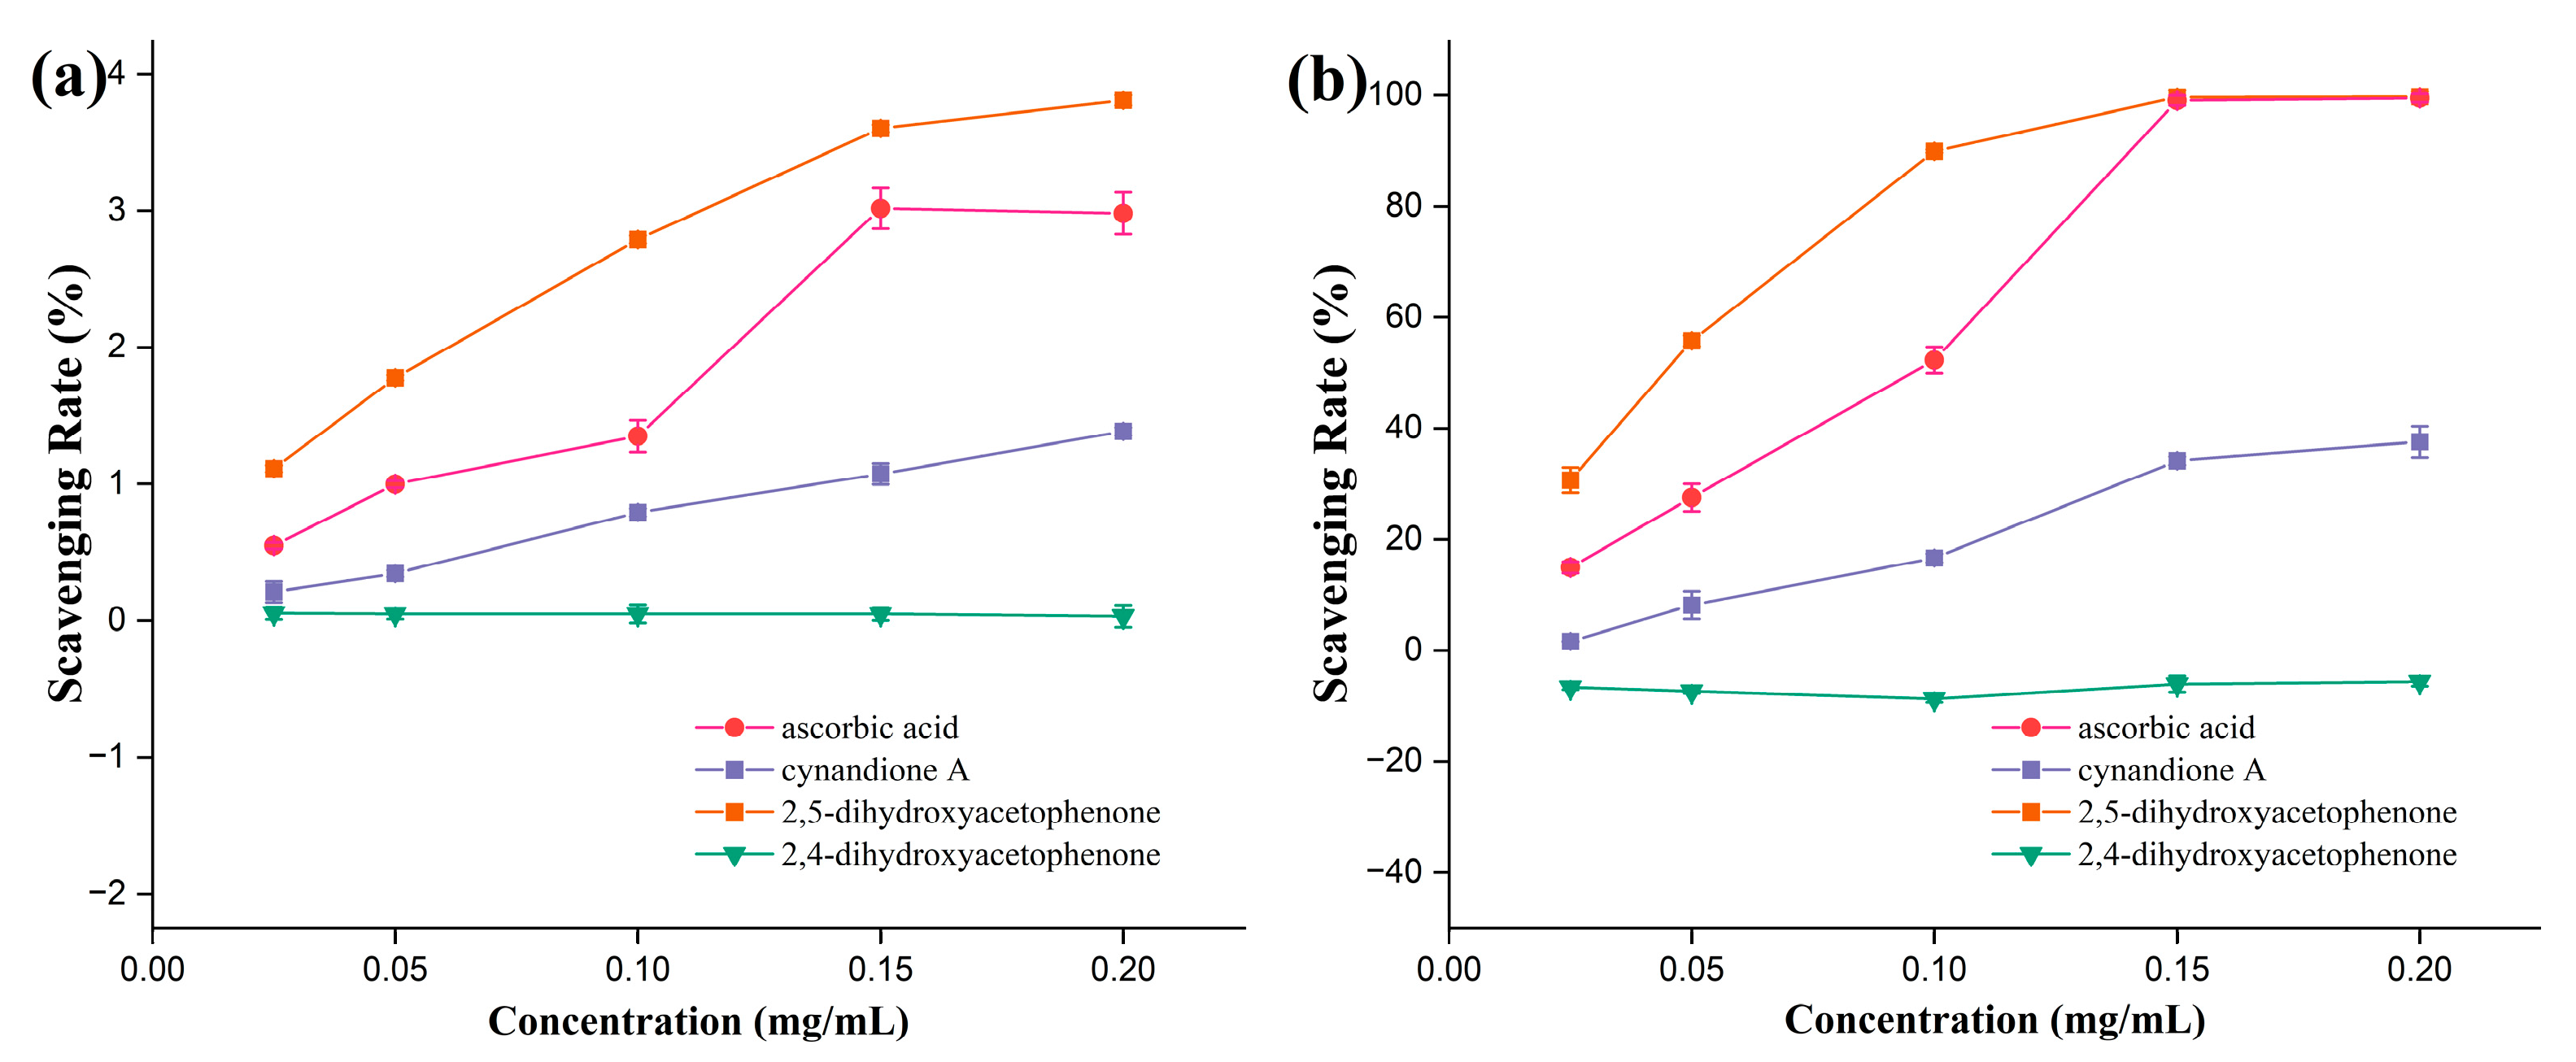
3.2. Antioxidant Activity

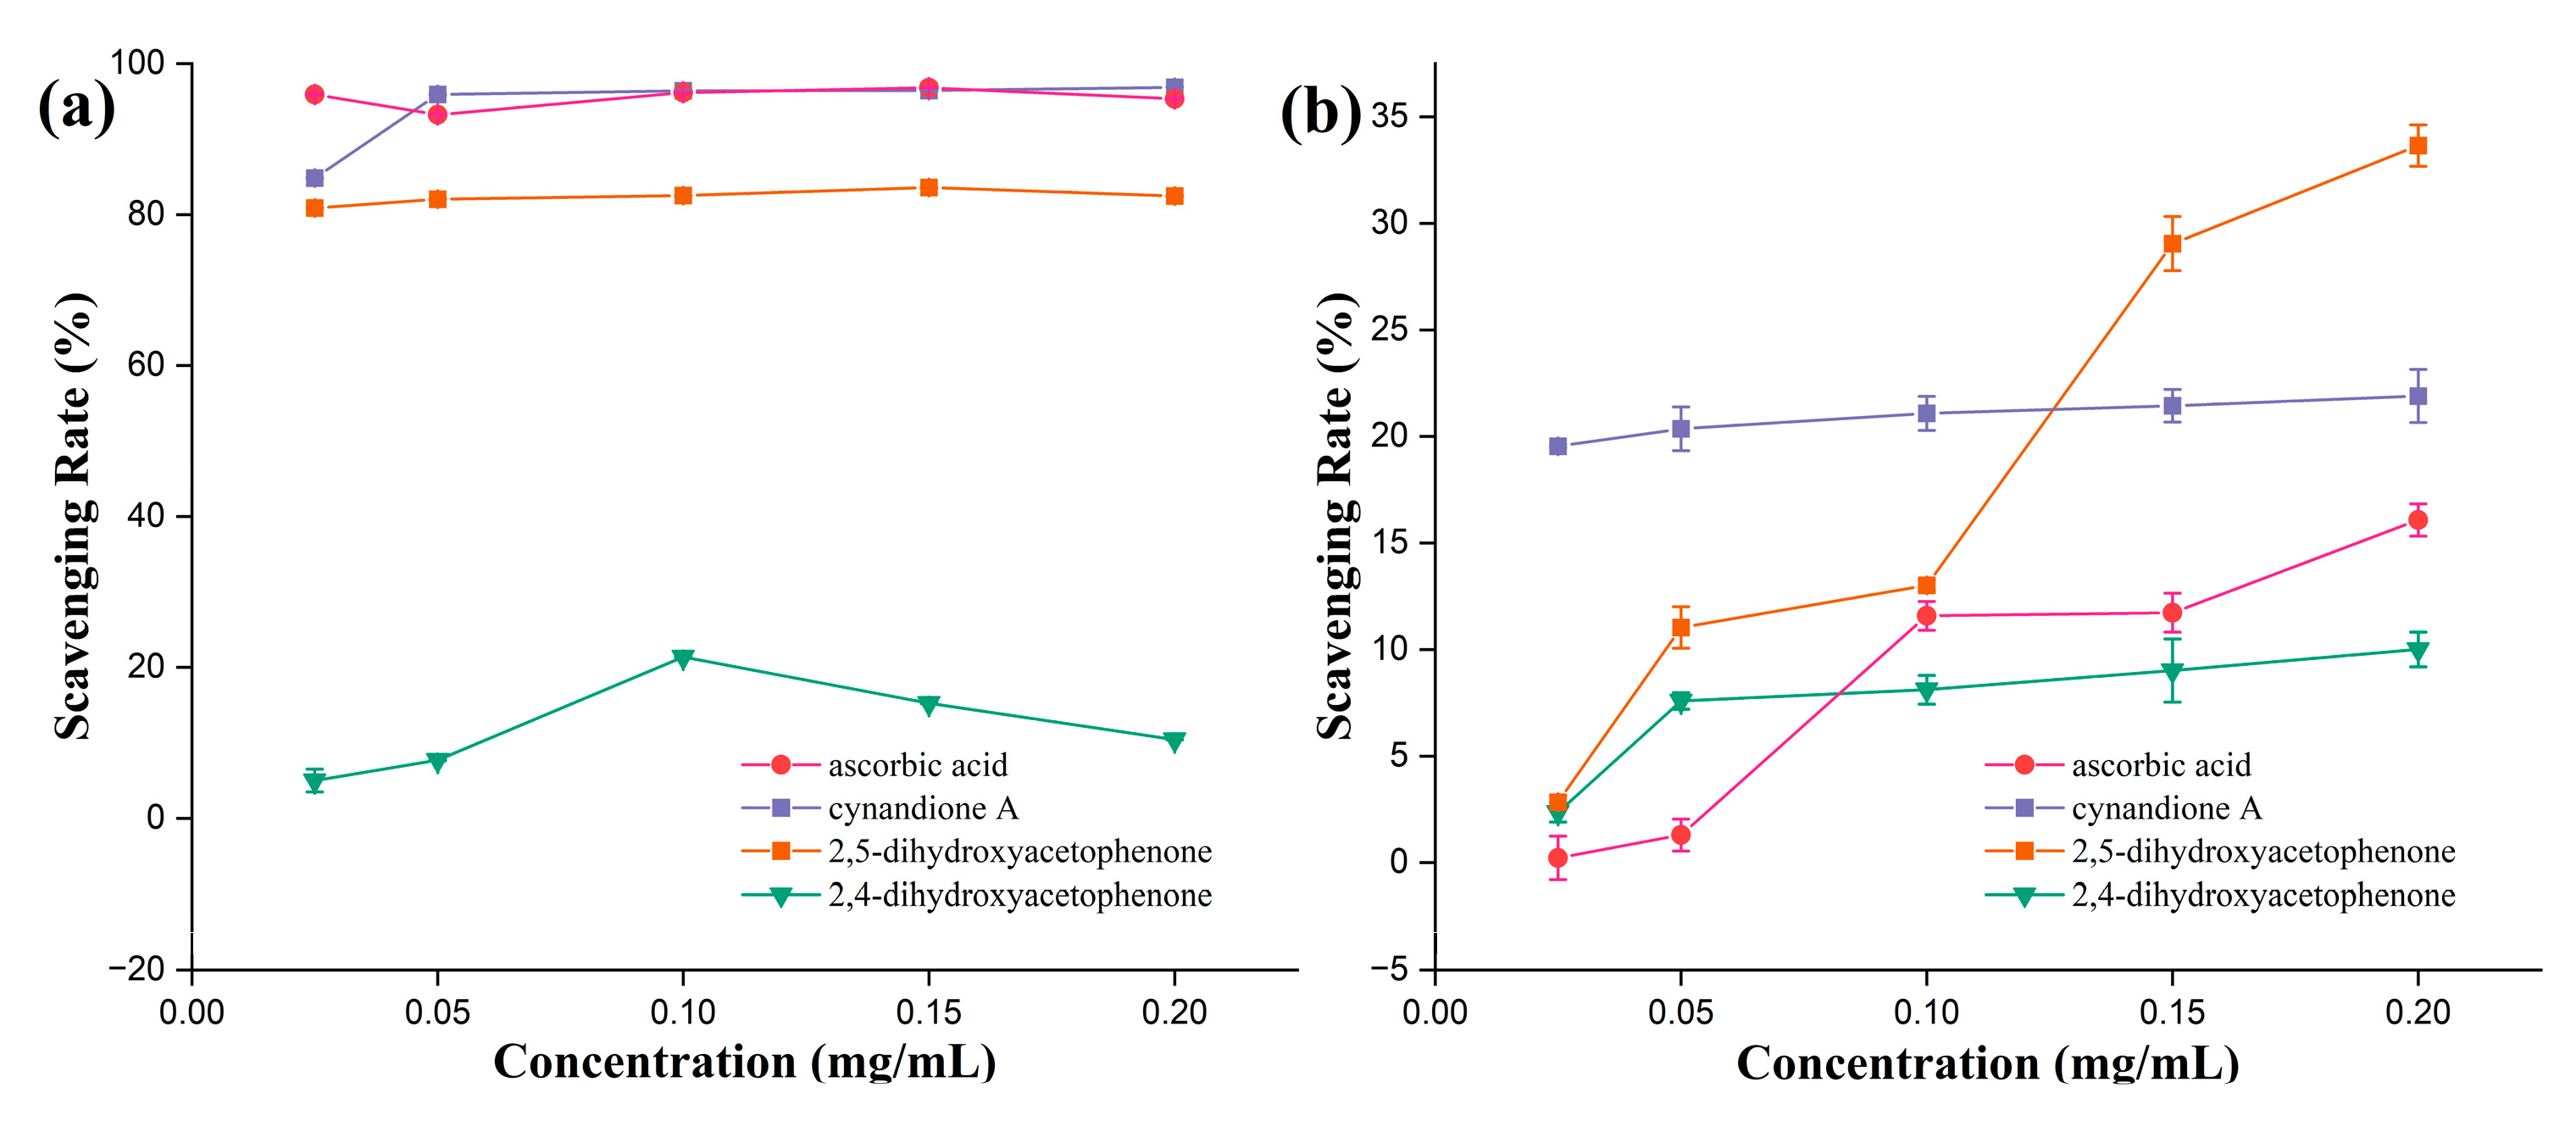
3.2.1. ABTS Radical Scavenging Activity

The total reducing power results for each compound are illustrated in Figure 6a. The total reducing power of cynandione A, ascorbic acid, and 2,5-dihydroxy acetophenone increased at doses ranging from 0 to 500 g/mL. In contrast, 2,4-dihydroxyacetophenone exhibited a consistently low total reducing power across this concentration range without a discernible dose–response relationship.
Figure 6a shows a similar curve at doses ranging from 0 to 200 g/mL to Figure 6b. Two figures clearly show that the total reducing power ranks in the following order: 2,5-dihydroxy acetophenone> ascorbic acid > cynandione A > 2,4-dihydroxy acetophenone.

3.2.2. DPPH· Radical Scavenging Ability

The DPPH· radical scavenging rates for the various compounds are shown in Figure 7a. As the figure indicates, within the mass concentration range of 0.025–0.2 mg/mL, the scavenging rate of cynandione A for DPPH· radicals increases with concentration up to 0.05 mg/mL, after which it levels off and shows little further change. The scavenging rates of ascorbic acid and 2,5-dihydroxyacetophenone show only a slight downward trend. Throughout this range, 2,4-dihydroxy acetophenone consistently exhibits low scavenging activity against DPPH· radicals, whereas cynandione A, ascorbic acid, and 2,5-dihydroxy acetophenone demonstrate higher scavenging activities. It is evident from the figure that the order of scavenging effectiveness is as follows: ascorbic acid > cynandione A > 2,5-dihydroxy acetophenone > 2,4-dihydroxy acetophenone. This suggests that within the 0.025–0.2 mg/mL concentration range, cynandione A is more effective at scavenging DPPH· radicals than one of its components, 2,5-dihydroxy acetophenone, while the other component, 2,4-dihydroxy acetophenone, shows relatively weak scavenging activity.

3.2.3. Hydroxyl Radical Scavenging Activity

The hydroxyl radical scavenging rates of the tested compounds are illustrated in Figure 7b. Within the mass concentration range of 0.025–0.20 mg/mL, all three compounds and ascorbic acid exhibited an increase in scavenging activity with increasing concentration, with 2,4-dihydroxy acetophenone demonstrating the lowest scavenging ability within this range. The figure indicates that at 0.20 mg/mL, 2,5-dihydroxyacetophenone achieved the highest scavenging rate, while 2,4-dihydroxyacetophenone had the lowest. Furthermore, the IC50 values for hydroxyl radical scavenging ranged from 0.288 to 2.55 mg/mL, with the scavenging efficiency ranking as follows: 2,5-dihydroxy acetophenone (0.288 mg/mL) > ascorbic acid (0.558 mg/mL) > cynandione A (2.55 mg/mL) > 2,4-dihydroxy acetophenone (2.683 mg/mL). Compared to the scavenging of DPPH· and ABTS radicals, the hydroxyl radical scavenging capacity of these samples was relatively lower, likely due to the extremely strong oxidative potential of ·OH radicals combined with the relatively low concentrations of the samples, making them less susceptible to antioxidant activity.

4. Conclusions

This study identifies three polyphenolic compounds from C. auriculatum, with cynandione A and 2,5-dihydroxyacetophenone exhibiting significant antioxidant activity. Both cynandione A and 2, 5-dihydroxy acetophenone demonstrated strong scavenging activity against DPPH· and ABTS radicals and exhibited significant total reducing power, showing a certain dose–response relationship with the sample concentration. However, their scavenging effect on ·OH radicals was not significant. The number and position of hydroxyl groups are important structural features that influence the antioxidant activity of phenolic compounds. The results of this study show that the antioxidant activity of 2,4-dihydroxyacetophenone is significantly lower than that of 2,5-dihydroxyacetophenone, indicating that the para-dihydroxyl group position enhances antioxidant activity more effectively than the meta-dihydroxyl group position. Cynandione A is structurally composed of both 2,5-dihydroxy acetophenone and 2,4-dihydroxy acetophenone, but cynandione A exhibited stronger scavenging activity against DPPH· radicals than 2,5-dihydroxy acetophenone, while its scavenging rate for ·OH radicals, ABTS radicals, and total reducing power was weaker than those of 2,5-dihydroxy acetophenone. These results suggest that the antioxidant activities of cynandione A and 2,5-dihydroxy acetophenone are complex and require further systematic investigation.

Author Contributions

Conceptualization, Y.-E.S. and M.M.N.; writing the original draft, Y.-E.S. and M.M.N.; formal analysis, Y.-E.S. and M.M.N.; investigation, L.Z.; resources, L.Z., T.B., C.M.R., S.S. and H.P.; data validation, L.Z., T.B., C.M.R., S.S. and H.P.; project administration, T.B., C.M.R., S.S. and H.P.; supervision, C.L. and W.W.; funding acquisition, C.L. and W.W.; reviewing and editing, C.L. and W.W. All authors have read and agreed to the published version of the manuscript.

Funding

This work was financially supported by the Researchers Supporting Project, King Saud University, Riyadh, Saudi Arabia, which funded this work through project number (RSP-2023R437).

Data Availability Statement

The original contributions presented in this study are included in the article; further inquiries can be directed to the corresponding author.

Conflicts of Interest

The authors declare no conflicts of interest.

References

  1. Chen, W.H.; Zhang, Z.Z.; Ban, Y.F.; Rahman, K.; Ye, B.Z.; Sun, X.L.; Tan, H.Y.; Zheng, X.H.; Liu, H.Y.; Xu, L.C.; et al. Cynanchum bungei Decne and its two related species for “Baishouwu”: A review on traditional uses, phytochemistry, and pharmacological activities. J. Ethnopharmacol. 2019, 243, 112110. [Google Scholar] [CrossRef] [PubMed]
  2. Li, J.F. Industrial development status and countermeasures of Binhai Baishou Aconite. S. China Agric. 2019, 13, 120–121. [Google Scholar]
  3. Chai, Z.; Huang, W.Y.; Zhao, X.; Wu, H.; Zeng, X.X.; Li, C.Y. Preparation, characterization, antioxidant activity and protective effect against cellular oxidative stress of polysaccharide from Cynanchum auriculatum Royle ex Wight. Int. J. Biol. Macromol. 2018, 119, 1068–1076. [Google Scholar] [CrossRef] [PubMed]
  4. Wu, C.D.; Zhang, M.; He, M.T.; Gu, M.F.; Lin, M.; Zhang, G. Selection of solvent for extraction of antioxidant components from Cynanchum auriculatum, Cynanchum bungei, and Cynanchum wilfordii roots. Food Sci. Nutr. 2019, 7, 1337–1343. [Google Scholar] [CrossRef]
  5. Zhang, M.; Wang, D.; Chen, C.L.; Li, B.C. Influence of steroidal glycosides from Cynanchum auriculatum on antioxidant indicators in H2O2-damaged PC12 cells. Pak. J. Pharm. Sci. 2022, 35, 1379–1384. [Google Scholar]
  6. Wang, X.J.; Li, Z.L.; Lv, X.H.; Zuo, Q.Y.; Zhao, Y.M.; Ding, Y.F.; Pu, S.B.; Qian, S.H.; Peng, Y.R. Antitumor evaluation and multiple analysis on different extracted fractions of the root of Cynanchum auriculatum Royle ex Wight. J. Sep. Sci. 2017, 40, 3054–3063. [Google Scholar] [CrossRef]
  7. Peng, Y.R.; Li, Y.B.; Liu, X.D.; Zhang, J.F.; Duan, J.A. Antitumor activity of C21 steroidal glycosides from Cynanchum auriculatum Royle ex Wight. Phytomedicine 2008, 15, 1016–1020. [Google Scholar] [CrossRef]
  8. Jeong, S.; Lee, S.W.; Choi, W.J.; Sohn, U.D.; Kim, W. The Effect of Polyphenols Isolated from Cynanchi wilfordii Radix with Anti-inflammatory, Antioxidant, and Anti-bacterial Activity. Korean J. Physiol. Pharmacol. 2015, 19, 151–158. [Google Scholar] [CrossRef]
  9. Jang, M.; Lim, T.G.; Lee, E.; Hong, H.D.; Rhee, Y.K.; Lee, Y.J.; Lee, J.H.; Cho, C.W. Immunostimulatory Activities of a High Molecular Weight Fraction of Cynanchum auriculatum Royle ex Wight Root Obtained by Ultrafiltration. Pharmacogn. Mag. 2020, 16, 493–498. [Google Scholar]
  10. Wang, Y.L.; Han, J.; Yue, Y.; Wu, Y.Z.; Zhang, W.Q.; Xia, W.; Wu, M.Q. Purification, structure identification and immune activity of a neutral polysaccharide from Cynanchum auriculatum. Int. J. Biol. Macromol. 2023, 237, 124142. [Google Scholar] [CrossRef]
  11. Hu, B.; Zhang, C.S.; Hu, Y.L.; Cheng, H.Y.; Liu, T.; Liu, Y.; Xu, T.Q.; Shu, Q.; Zhou, G.X. Two new pregnane glycosides from the root of Cynanchum auriculatum. J. Asian Nat. Prod. Res. 2023, 25, 1184–1190. [Google Scholar] [CrossRef] [PubMed]
  12. Niu, J.M.; Lv, B.X.; Zhao, J.H.; He, W.B.; Li, Y.Q.; Xiao, Y.L. Study on pharmacokinetic of Baishouwu benzophenone in rats after intragastric administration the extract of Cynanchum bungei Decne. J. Taishan Med. Coll. 2020, 41, 349–352. [Google Scholar]
  13. Jiang, H.W.; Lin, J.; Wang, G.M.; Zhang, J.J.; Gu, S.S.; Cao, L.; Chen, Y.; Wang, L.; Jiao, H.; Zhu, W.L.; et al. Acetophenone derivatives from the root bark of Cynanchum wilfordii as potential neuroprotective agents. Phytochem. Lett. 2018, 24, 179–183. [Google Scholar] [CrossRef]
  14. Kong, L.Y. Natural Medicinal Chemistry, 1st ed.; The Medicine Science and Technology Press of China: Beijing, China, 2015; pp. 266–268. [Google Scholar]
  15. Wang, S.M.; Fu, Y.; Liu, D.; Wang, Y.F.; Li, L.G.; Huo, C.H.; Li, Y.; Liu, J.; Zhang, M.L.; Shi, Q.W. Historical story on natural medicinal chemistry: Review on the application of the UV, IR, MS and NMR spectra in the structure elucidation of natural products. CHM 2016, 47, 2779–2796. [Google Scholar]
  16. Males, I.; Maric, T.; Vladimir-Knezevic, S.; Dragovic-Uzelac, V.; Dobrincic, A.; Skroza, D.; Males, Z.; Jerkovic, I. Determination of Phenolic Content and DPPH Radical Scavenging Activity of Functional Fruit Juices Fortified with Thymus serpyllum L. and Salvia officinalis L. Extracts. Croat. Chem. Acta 2023, 96, 51–57. [Google Scholar] [CrossRef]
  17. Zheng, Y.; Li, Y.; Wang, W.D. Optimization of ultrasonic-assisted extraction and in vitro, antioxidant activities of polysaccharides from Trametes orientalis. Carbohydr. Polym. 2014, 111, 315–323. [Google Scholar] [CrossRef]
  18. Zhang, L.Y.; Yu, J.L.; Xu, Q.; Zhu, J.Y.; Zhang, H.; Xia, G.Q.; Zang, H. Evaluation of total phenolic, flavonoid, carbohydrate contents and antioxidant activities of various solvent extracts from Angelica amurensis root. Nat. Prod. Res. 2021, 35, 4084–4088. [Google Scholar] [CrossRef]
  19. Dinh, T.V.; Saravana, P.S.; Woo, H.C.; Chun, B.S. Ionic liquid-assisted subcritical water enhances the extraction of phenolics from brown seaweed and its antioxidant activity. Sep. Purif. Technol. 2018, 196, 287–299. [Google Scholar] [CrossRef]
  20. Qin, B.; Liao, S.; Liu, S.Y.; Pan, C.L.; He, Z.W.; Song, J.L. In vitro antioxidant capability of white tea ethanol extracts. Sci. Technol. Food Ind. 2018, 39, 39–43. [Google Scholar]
  21. Wolfe, K.L.; Liu, R.H. Cellular antioxidant activity (CAA) assay for assessing antioxidants, foods, and dietary supplements. J. Agric. Food Chem. 2007, 55, 8896–8907. [Google Scholar] [CrossRef]
  22. Li, H.; Xu, L.; Wang, X.; Li, J.; Yang, P.; Yang, B. Separation and Preparation of acetophenones from Radix Aconitum Rhizome by silica gel column chromatography combined with high speed countercurrent chromatography. Chin. Mod. Tradit. Chin. Med. 2016, 18, 956–959, 973. [Google Scholar]
  23. Sun, X.; Guo, L.; Kang, Y. A study on the chemical kinetics of Polygonum multiflorum concoction. Propr. Chin. Med. 1988, 7, 20. [Google Scholar]
Figure 1. UV spectra of compound.
Separations 11 00316 g001
Figure 2. (a) Infrared spectra of compound 1; (b) infrared spectra of compound 2; and (c) infrared spectra of compound 3.
Separations 11 00316 g002
Figure 3. (a) HPLC chromatogram of compound 1; (b) HPLC chromatogram of compound 2; and (c) HPLC chromatogram of compound 3.
Separations 11 00316 g003
Figure 4. (a) LC-MS spectrum of compound 1; (b) LC-MS spectrum of compound 2; and (c) LC-MS spectrum of compound 3.
Separations 11 00316 g004
Figure 5. (a) Compound 1 as identified in the LC-MS analysis; (b) Compound 2 as identified in the LC-MS analysis; (c) Compound 3 as identified in the LC-MS analysis.
Separations 11 00316 g005
Figure 6. (a) Total reducing power and (b) scavenging rate of ABTS radicals.
Separations 11 00316 g006
Figure 7. (a) DPPH· radical scavenging rates and (b) hydroxyl radical scavenging rates.
Separations 11 00316 g007
Table 1. 1H NMR and 13C NMR spectral data of compound 1 to 3.
1 (CD3OD)2 (CD3OD) 3 (CD3OD)
CδCδHMultiplicity;
J (Hz)
δCδHMultiplicity;
J (Hz)
δCδHMultiplicity;
J (Hz)
1127.7 126.3 111.3
2120.3 152.7 162.9
3152.2 115.86.781H; d; 8.9112.6
4118.26.791H; d; 8.8121.87.001H; dd; 8.9; 3.0 133.17.831H; d; 8.9
5121.76.931H; d; 8.9151.2 108.06.821H; d; 8.8
6149.0 7.221H; d; 3.0162.4
7207.4 200.1 204.2
830.82.173H; s26.32.583H; s203.2
9 29.92.583H; s
10 25.6
1’114.4 119.2
2’163.7 148.1
3’113.1 118.16.541H; d; 8.8
4’133.97.781H; d; 8.9 122.66.971H; d; 8.7
5’108.86.491H; d; 8.9 153.1
6’163.7 123.92.223H; s
7’204.6
8’26.32.563H; s
Disclaimer/Publisher’s Note: The statements, opinions and data contained in all publications are solely those of the individual author(s) and contributor(s) and not of MDPI and/or the editor(s). MDPI and/or the editor(s) disclaim responsibility for any injury to people or property resulting from any ideas, methods, instructions or products referred to in the content.

