Article

The Competitive Adsorption of Water and Methanol on a Hybrid Silica Stationary Phase in Supercritical Fluid Chromatography

by
Muhamad Yahia Kazmouz
1 and
Attila Felinger
1,2,3,*
1
Department of Analytical and Environmental Chemistry, Szentágothai Research Center, University of Pécs, Ifjúság Útja 6, H-7624 Pécs, Hungary
2
MTA-PTE Molecular Interactions in Separation Science Research Group, Ifjúság Útja 6, H-7624 Pécs, Hungary
3
Institute of Bioanalysis, Medical School, University of Pécs, Szigeti út 12, H-7624 Pécs, Hungary
*
Author to whom correspondence should be addressed.
Separations 2023, 10(9), 492; https://doi.org/10.3390/separations10090492
Submission received: 22 November 2022 / Revised: 23 August 2023 / Accepted: 29 August 2023 / Published: 11 September 2023
(This article belongs to the Topic Advances in Chemistry and Chemical Engineering)

Abstract

:
This study investigates the adsorption of methanol, water, and their mixture in a hybrid silica stationary phase with supercritical carbon dioxide as a mobile phase in supercritical fluid chromatography (SFC). The adsorption isotherms of methanol and water were determined by two dynamic methods: the elution by characteristic point (ECP) method and the inverse method (IM). Both the single-component and competitive bi-Langmuir models were pre-selected for the inverse method. The initial parameters of the single-component isotherm for both methanol and water were estimated with the ECP method by fitting the experimental data to the bi-Langmuir isotherm model. Then, using the inverse method, we refined the single-component isotherm parameter values, which were then further used for determining the competitive isotherm of the methanol–water mixture. The elution profile of the (methanol–water) mixture sample was calculated by the equilibrium-dispersive (ED) model. The results indicated that there is a good agreement between the experimental band profile and the calculated band profile, which was obtained from the parameters of the competitive bi-Langmuir isotherm model, revealing a competition between methanol and water to reach the adsorption sites. Furthermore, the saturation capacity of the adsorption sites in the stationary phase decreased in the case of the mixture sample compared to those for the single-component sample.

Graphical Abstract

1. Introduction

It is known in nonlinear chromatography that the separation process and the migration rate of sample components through a porous stationary phase are highly influenced by the adsorption isotherms of each component. For a system that contains more than one component at a sufficient concentration (multicomponent system), their adsorption in the stationary phase will be influenced by each other, so it is important to determine their isotherms in a competitive form, which are called ‘competitive isotherms’, whereas the single-component isotherm is a useful tool to give information about the adsorption in a single-component system. The suitable choice of the isotherm model and obtaining the adsorption data in a wide range of concentrations of the studied components allow the possibility of prediction of the elution band profiles for the optimization of the separation process [1].
In case of overloading the chromatographic column with a high concentration of a binary mixture, the separation process occurs in the nonlinear range of the adsorption isotherms, and the molecules will interfere with each other for adsorption in the stationary phase [2]. The same phenomenon in SFC is expected to occur between the modifier and the additive molecules as a consequence of using a ternary mobile phase (CO2 + modifier + additive) for the separation of polar solutes. Our work is considered an attempt to elucidate the adsorption process of the mixture of modifier and additive on a polar stationary phase in SFC because there is still a lack of information in describing the adsorption behavior of their mixture.
Over the last decade, greater interest has emerged in SFC-related studies dealing with adsorption isotherm determination [3,4,5,6,7,8]—on the one hand, for the purpose of comparison between the used methods for the isotherm determination, and on the other hand, for the adsorption study of the binary mobile phase in different stationary phases. Most of the equilibrium isotherm measurements in liquid chromatography have been made using dynamic methods, which are more accurate and faster than static methods. For those reasons, the same strategy will be followed with SFC [3].
Enmark et al. [4] compared the results of adsorption isotherm determinations of antipyrine on a Kromasil silica column using CO2–methanol as eluent. The data were calculated by the methods of elution by characteristic points (ECP), retention time method (RTM), inverse method (IM), and perturbation peak (PP) method. They concluded that they could not predict the elution profile of the studied compound with the isotherm data obtained via the PP method.
Glenne et al. [5] used the tracer pulse method and the elution by the characteristic point method to calculate the adsorption isotherms of the most often used co-solvents in SFC (methanol, acetonitrile, 2-propanol, and ethanol) using 100% CO2 as eluent on different chemistries of the stationary phase Kromasil Diol, Kromasil Silica, and Princeton 2-ethylpyridine (2-EP).
In chiral SFC separations, Kamarei et al. [6] applied five dynamic methods to calculate the adsorption isotherms of the naproxen enantiomers using mixtures of CO2 and methanol or ethanol on the chiral column Kromasil Whelk-O1. They found that the inverse method produced the best agreement between the experimental and calculated elution profiles. Kamarei et al. [7] chose the frontal analysis method to measure the equilibrium data of S-naproxen on the Whelk-O1 column with a modified SFC system (they reduced the large dead volume of tubing, connections, and the mixer volume). The results of the adsorption isotherm estimation improved significantly compared to the original system. Rédei et al. were able to show the displacement effect of methanol as a sample solvent on the elution of alkylbenzenes by determining the adsorption isotherms on the alkylamide C18 ABZ+plus column for methanol and the concerned components of the sample [8]. Recently, Kazmouz et al. measured the surface excess isotherm of methanol on end-capped reversed stationary phases under subcritical and supercritical conditions using the minor disturbance peak method. They found very small differences in the surface excess adsorption isotherm for methanol between the two conditions, and they found that the methanol excess adsorption in the stationary phase embedded with amide (polar group) is higher than on the C18 column without functional groups [9]. The variation of methanol (modifier) adsorption on a Kromasil diol column with temperature and pressure was studied by Glenne et al., showing that the adsorption was higher at low pressure (110 bar) and high temperature 55 °C than at high pressure (310 bar) with the same temperature [10].
In packed column SFC, the possibility of employing water as a mobile phase additive is limited by its miscibility with carbon dioxide, which is very low (∼0.1%, w/w) in supercritical CO2 [11], although the solubility can be increased using alcohol-modified carbon dioxide.
There have not been many applications for the use of water as an additive in the modified mobile phase in SFC compared to bases or acids because, in most cases, the use of additives is usually required for the separation of analytes with basic or acidic forms. The use of water with methanol-modified CO2 was introduced by Salvador et al. to elute monosaccharides and polyols from silica and trimethylsilyl (TMS)-bonded silica stationary phases in SFC [12]. Ashraf-Khorassani et al. showed that water was rather useful and superior to formic acid to elute water-soluble nucleobases from polar stationary phases with sharp peaks using a gradient mode of alcohol-modified CO2 [13]. Even though these practical improvements of adding water to the mobile phase in SFC are clearly demonstrated, their role in the elution process still needs a dedicated study.
The objective of this work is to figure out how water would influence the methanol adsorption on a hybrid silica column in SFC. For that purpose, two approaches of isotherm adsorption determination were studied: the single-component adsorption isotherm of both methanol and water and the competitive adsorption isotherm of the water–methanol mixture. The mixture composition imitates modifiers and additives that could be used together in the CO2 mobile phase. Furthermore, the band profiles of the studied compounds have been calculated using the parameters acquired from the calculated single-component adsorption isotherms of methanol and water and those parameters obtained from the competitive adsorption isotherm of the water–methanol mixture.

2. Theory

2.1. Adsorption Isotherms

The study of an equilibrium isotherm, which represents the relationship between the amount of a solute in the stationary phase and that in the mobile phase at an equilibrium, has garnered great interest in the investigation of the chromatographic retention process. From the adsorption isotherm data, it is possible to obtain information about the extent of heterogeneity of the adsorbent, the interactions or the forces involved in adsorption between the adsorbed molecule and the adsorbent, as well as the adsorption capacity of each kind of site [14]. The main feature that characterizes nonlinear chromatography is the nonlinear adsorption isotherm of the solute, which exhibits different curve shapes (convex, concave, or a combination of them). In turn, the curvature of the isotherm is an important indicator of the chromatographic process or the retention mechanism. In the simplest case of the chromatographic process, when solute retention is caused only by adsorption on the adsorbent surface, a Langmuir-type isotherm will form, and the corresponding chromatographic peak with increased concentrations elutes at earlier times with increased tailing of the peak [1,15]. Thus, the data acquired from the adsorption isotherms study of the studied components can provide information about the possible interactions between these components and the stationary phase, as well as adsorbate–adsorbate interactions [16].
In our study, the adsorption of a single-component sample was represented by the bi-Langmuir equation, assuming the chemical heterogeneity of the surface, which leads to energetic heterogeneity of the adsorbent surface; therefore, two independent and non-cooperative adsorption sites with energetic differences have been presumed. The bi-Langmuir model equation is written as follows:
q i = a 1 C i 1 + b 1 C i + a 2 C i 1 + b 2 C i
where q i and C i are concentrations of component i in the stationary and mobile phases, respectively, a 1 is the initial slope of the isotherm, b 1 is the equilibrium constant for site one, and a 2 and b 2 are the same parameters for the other sites, respectively. Those parameters give the saturation capacities q s , 1 , q s , 2 for site 1 and site 2 when calculating the ratio a i / b i . For the multicomponent sample, a more complex model is needed than that in Equation (1), so the competitive bi-Langmuir isotherm model is employed to represent the competition between the molecules of components to occupy the adsorption sites.
The competitive bi-Langmuir isotherm model is given by the following formula:
q i = a i , 1 C i 1 + b A , 1 C A + b B , 1 C B + a i , 2 C i 1 + b A , 2 C A + b B , 2 C B
where C A and C B are concentrations of components A and B in the mobile phase [1].

2.2. Determination of the Adsorption Isotherm Using the Inverse Method (IM)

The inverse method (IM) is one of the dynamic methods for the adsorption isotherm determination. It is a fast and low-cost method compared to the plateau methods (frontal analysis or perturbation peak). It determines the isotherm parameters from overloaded profiles; it has been widely applied to determine the liquid–solid equilibrium isotherms in HPLC [4,17,18,19,20].
The IM method comprises the following steps:
  • Recording the overloaded band profiles of each studied component;
  • Selecting an a priori model for the adsorption isotherm, which is able to represent the distribution of a solute between the two phases accurately. The isotherm model is usually predictable (whether it is convex, concave, or S-shaped) from the shape of the recorded overloaded band profile;
  • Calculating the chromatograms using the initial estimated values of the isotherm parameters (the initial values were determined using the elution by characteristic point ECP method) and an appropriate model of the chromatography process, we used the equilibrium-dispersive (ED) model in the calculation (the properties of this model will be mentioned in somewhere in Section 2.2);
  • Use the following formula to compare the experimental and calculated profiles:
min i r i 2 = min i C i s i m C i m e a s 2
where C i s i m and C i m e a s are calculated and measured concentrations at a point i and r i is their difference;
5.
Optimizing the isotherm parameter values by obtaining the minimum of the residual sum of squares (SSR) between the experimental and calculated curves using an optimization routine [21].
The equilibrium-dispersive model of nonlinear chromatography [1] assumes a constant equilibrium between the stationary and the mobile phases; also, the chromatographic column has a finite efficiency caused by the effect of an apparent axial dispersion coefficient D a that accounts for the dispersive phenomena (molecular and eddy diffusion), which results in the band-broadening phenomenon. The mass balance equation for each component is written as follows:
C i z , t t + F q i z , t t + u C i z , t z = D a 2 C i z , t z 2
where q i and C i are the concentrations of component i in the stationary and mobile phases, respectively, z is the length, t the time, u the mobile phase linear velocity, and F the phase ratio, F = 1 ε t / ε t where ε t is the total porosity of the column. The axial dispersion coefficient D a is related to the column efficiency (theoretical plates, N), which can be determined by an analytical injection:
D a = u L 2 N
where L is the column length.
The initial condition at t = 0 represents the equilibrium state of the stationary phase with a pure mobile phase, and the concentration of solute in both phases is zero C i z , 0 = 0 . The boundary conditions used are the classical Danckwerts-type for each component, which is written as follows:
C i 0 , t = C i 0           0 < t t p
where C i 0 is the concentration of the component i in the sample, and t p is the duration of the sample injection [21].
Regarding the mobile phase compressibility in SFC, it should be taken into account because it is able to change the linear velocity of the mobile phase within the column while Equation (4) neglects the compressibility effect; so to estimate the elution profile accurately, the actual volumetric flow rate of the mobile phase should be estimated using the actual mass flow rate with the density value of mobile phase [22].
The advantage of the inverse method is the use of the ED model to estimate the band profile of the studied component. In addition, the usefulness of that model comes from considering the effects of the axial dispersion and the mass transfer resistance during the compound migration along the column. As a result, the solution of the chromatographic problem has smaller errors and is more accurate to simulate the band profile [17].
For the isotherm determination using the IM method, we must use the concentration profiles (concentration vs. time) instead of the absorbance profile (absorbance vs. time) in the calculation process. Since each component has a different response from the detector, this transformation from absorbance to concentration calls for detector calibration, which can be performed by the following steps:
The amount of the injected sample can be obtained by integrating the elution profile:
m = C V d V = F ¯ v C t d t
In the range of linear detector response, the absorbance is proportional to concentration, and the relation of the absorbance with sensitivity factor k can be expressed as follows:
A t = k C t
A T = A t d t
A T = k C t d t = k m F ¯ v
k = A T F ¯ v m
where A T is the peak area, F ¯ v is the mean volumetric flow rate, and m is the amount of the injected sample. By calculating k from Equation (11), we can obtain the concentration profiles from the raw chromatographic data (absorbance vs. time):
C t = A ( t ) k
Those steps are applied to transform the elution profile of each studied sample (methanol, water, and the mixture) with different UV response factors to obtain the concentration profiles (concentration vs. time).

2.3. Elution by the Characteristic Point Method

The elution by characteristic point (ECP) method was used to estimate the initial approximate values of the adsorption isotherm parameters of methanol and water on the Viridis BEH column. The adsorption isotherm data points are derived by integrating the rear part of an overloaded elution profile of the solute studied, which starts from the tail endpoint ( C = 0 ) until the characteristic point. Thus, the amount adsorbed on the column packing can be obtained by the following equation:
q C = 1 V a 0 c V ( C ) V 0 d C
where q C is the amount of solute adsorbed in the stationary phase when it is in equilibrium with concentration C , V a is the volume of the adsorbent, V ( C ) is the retention volume of the point at the rear part of the band profile at concentration C or characteristic point, and V 0 is the hold-up volume of the column [1]. The ECP method is applicable to a system with very high column efficiency because of the amount q C is derived from the ideal model of chromatography (that neglects the band broadening effects), which presumes unlimited efficiency of the column. Also, a systematic error arises since the ECP method needs a rectangular pulse injection, but a rectangular injection can not be carried out in a practical situation. This error can be reduced by injecting smaller amounts, but at the same time, we will not be able to measure the adsorption isotherm over a wide concentration range due to the lower column load [4]. Although this method is not very accurate, it gives an approximate estimation for the isotherm parameters.
To calculate the adsorption isotherm accurately, the injection profile, which represents the boundary conditions for the partial differential Equation (4), should be accurately determined, and it should have a rectangle shape, but in the chromatographic experiments, as the dispersion effect is present as the result of connecting tubes before the column, we would not obtain a rectangular pulse, and so the best way to make the injection profile is replacing the column with a zero-volume connector [21].

3. Experimental Section

3.1. Chemicals

Carbon dioxide (99.5% from Linde, Répcelak, Hungary), HPLC grade methanol, water, and pentane (VWR International, Fourtenay-sous-Bois, France) were used in this study.

3.2. Instruments

The SFC system used in this study was a Waters UPC2 system (Waters Corporation, Milford, MA, USA). The system was controlled by Empower v.3 software from Waters as well. The instrument includes a carbon dioxide pump, a modifier pump, an autosampler with a 10 μL sample loop, a 3-column temperature-controlled compartment, a back-pressure regulator, and a diode array UV/VIS detector, which all are in the default configuration. All measurements were performed on a hybrid silica Viridis BEH column (3 × 50) mm packed with 1.7 µm spherical particles, 130 Å pore size from Waters; this Bridged-Ethylene Hybrid (BEH) stationary phase is synthesized by reacting two organosilanes, tetraethoxysilane (TEOS), and 1,2-bis(triethoxysilyl) ethane (BTEE) [23], as shown in Figure 1.
A mini-CORI-FLOW mass flow meter from Bronkhorst High-Tech B.V. (Ruurlo, The Netherlands), Model No. M13-ABD-11-0-S was used for measuring CO2 mass flow. The inlet and outlet pressures of the column were measured with an external digital pressure meter (OMEGA Engineering, Norwalk, CT, USA). The density of the mobile phase was calculated using the REFPROP software Ver. 8 from the National Institute of Standards and Technologies (NIST).

3.3. Experimental Conditions

The chromatographic experiments were carried out at 1 mL/min, 26 ° C, and 150 bar of flow rate, column temperature, and the set value of back pressure, respectively. The injection volume was 1 μL of each pure methanol, pure water, and (10:90 v/v, MeOH:H2O). We chose a high percentage of water with respect to methanol because the corresponding intensity of the water signal of the detector was very small compared to the methanol signal, which was recorded at 195 n m wavelength. The volume occupied by the mobile phase inside the column is called void volume V0 = 0.242 mL was calculated by determining the retention time of pentane as an unretained solute using 100% CO2, and this retention time was corrected by deducting the required time of the injection profile tsys = 0.07 min.

3.4. Estimation of the Actual Volumetric Flow Rate

The mass flow rate along the chromatographic system is constant under stationary conditions (pressure and temperature). As a result of CO2 compressibility in SFC—in contrast to the mobile phase in liquid chromatography, which has very limited compressibility—it is necessary to take into account the variation of the volumetric flow rate, which can be substituted by measuring the actual mass flow rate using a Coriolis mass flow meter, which is installed at some point after the CO2 pump outlet and before the mobile phase mixer. We considered the actual and set flow rates of methanol to be the same. The pressure at the inlet and outlet of the column was measured with an external pressure meter; the values were 184.57 and 154.3 bar, respectively. The density of the mobile phase inside the column was estimated by the REFPROP software Ver. 8 from the National Institute of Standards and Technologies (NIST) at the set temperature of the column 26 ° C and the measured pressure values of the inlet and the outlet. Using Equation (14), the value of the measured mass flow rate of the mobile phase is F m = 0.943 g/min, and the calculated density of the mobile phase is ρ = 0.89891 and 0.87466 g/cm3 for the inlet and outlet of the column, respectively. We can obtain the average of the two volumetric flow rates as F v = 1.065 mL/min, which is used as the actual volumetric flow rate [22].
F v = F m / ρ
The maximum density of a mobile phase was recorded with 10% methanol in CO2. The percent of density variation along the column was 2.7%. The density of the 100% CO2 mobile phase under the subcritical (26 °C, 145 bar) and the supercritical (40 °C, 250 bar) conditions were 0.875 and 0.887 g/cm3, respectively.

4. Results and Discussion

4.1. Estimation of the Initial Adsorption Isotherm Parameters

The elution profiles of methanol and water recorded at 195 nm wavelength are shown in Figure 2. The peaks exhibit behavior consistent with the Langmuir adsorption isotherm type. The ECP method has been used to determine the initial parameters of adsorption isotherm for the single component of methanol and water, where the isotherm can be derived from the diffuse part of the elution profile, each point of the rear profile gives one point of the isotherm. The bi-Langmuir Equation (1) has been employed in the ECP method as an adsorption model. The parameter values of the adsorption isotherm of methanol resulting from the ECP method were used as initial values for later calculations. However, the ECP method failed to estimate the isotherm parameters for water adsorption due to the baseline issues with the recorded chromatogram.

4.2. Estimation of the Single-Component Isotherms Using the Inverse Method

The inverse method was applied to the overloaded profiles of both methanol and water eluted from the hybrid silica stationary phase using 100% CO2 to calculate their single-component adsorption isotherms. As we mentioned in Section 2.2, the (ED) model was used to calculate the elution profiles. The solution of the (ED) model Equation (4) was calculated using the Rouchon algorithm [24,25]. Using the initial bi-Langmuir isotherm parameters obtained by ECP, introducing the column parameters, the overloaded profiles, and the injection profiles in the algorithm, we can simulate the elution profiles. The inverse method can optimize the adsorption isotherm parameters of both studied components using the super-modified simplex algorithm to minimize the differences between the experimental and the calculated elution band profiles.
The simulated and experimental concentration profiles of 1   μ L sample of both methanol and water are overlaid in Figure 2. From the comparison of the band profiles, we notice a very good agreement between the two profiles at the front part, and even though the late part of the tail does not exhibit a full agreement, the bi-Langmuir model is still a suitable choice to model the adsorption for methanol and water on the hybrid silica column. The single-component bi-Langmuir isotherms determined with the inverse method for both methanol and water are plotted in Figure 3. The results of the isotherm parameters are summarized in case 1 of Table 1. The SSR values are an indicator of the goodness of fit.
The preliminary results showed that one of the two adsorption sites of the adsorbent has a large saturation capacity for methanol, and the other site also has a large capacity for water, where the curvature of the corresponding isotherms was not observed within the used concentration of the injected sample; hence, it is more feasible to assume those adsorption sites are characterized with a linear isotherm (the parameters b 1 for methanol and b 2 for water are negligible).
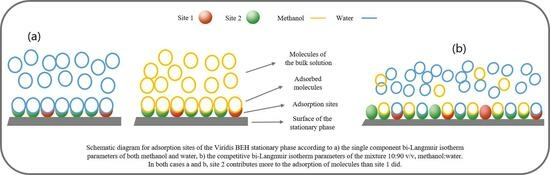
The best-fit parameters of the single-component bi-Langmuir isotherm show that the methanol adsorbs strongly on site 2 with a contribution of 79.5% of the total adsorption (which might be the reason for the tailing peak shape of methanol elution from the column), whereas the site 1 did not reach to the saturation limit, while the adsorption site 1 contributes for retention of water only 16.3%.
Also, it is obvious from the isotherm parameters that the water molecules bind to the site that has a large amount in the stationary phase more than the binding of methanol molecules ( a 2 ,   w a t e r > a 1 ,   m e t h a n o l ). For the sake of comparison, case 2 (in Table 1) was suggested, where sites 1 and 2 for water are switched to find out how the simulated band profile in Figure 5 would be affected if the two linear adsorption sites for a studied compound were swapped.

4.3. Competitive Data

We used the inverse method to calculate the adsorption isotherm of the binary mixture of methanol and water on the hybrid silica stationary phase with 100% CO2; it is assumed that each component of the mixture competes to reach the adsorption sites. It has been discussed that the optimization process of the IM to optimize the adsorption isotherm parameters of both methanol and water requires a concentration profile that can be calculated from the absorbance profile using the linear calibration Equation (12), as we discussed earlier in Section 2.2.
The recorded data fitted well to the competitive bi-Langmuir model Equation (2), which assumes a heterogeneous surface with two types of non-cooperative independent adsorption sites. The results of fitting the competitive bi-Langmuir model to the experimental chromatogram are summarized in Table 1. The competitive bi-Langmuir isotherms are shown in Figure 4.
The results of the competitive isotherm values showed a similar trend to that obtained with the single-component isotherm case, but the saturation capacities ( q s , 2 m e t h a n o l ,   q s , 1 w a t e r ) have decreased for the adsorption of both methanol and water in the mixture compared to the single-component sample; hence, this result confirmed the competition between methanol and water to adsorb on the same site.
By comparing the values of the isotherm parameter a 1 (which corresponds to the adsorption site, which has a linear isotherm) for methanol in Table 1 (7.58, 2.85), we find that the amount of methanol adsorbed in the stationary phase decreases in the presence of water, resulting in a less steep slope (see site 1 in Figs. 3 and 4 (methanol)), which means that the presence of water influences the reduction of methanol adsorption for that site, whereas the slope of the linear adsorption isotherm of water on site 2 did not change notably.

4.4. Prediction of a Band Profile

It is worth performing a simulation of the experimental elution profile to investigate whether the isotherm calculations are reliable. The chromatographic simulation process was carried out with the use of the (ED) model and with the isotherm parameters obtained from (i) the bi-Langmuir isotherm of a single component of methanol and water and (ii) the competitive bi-Langmuir isotherm of the mixture for predicting the elution profile of the (10:90 v/v, methanol:water) mixture sample.
The measured and calculated overloaded band profiles are overlaid in Figure 5. The simulated band profile, which used the parameter values of the competitive bi-Langmuir isotherm (blue curve), produced remarkably better agreement with the experimental profile (black curve) than those obtained from the parameter values of the single-component isotherms (red and green curves). Although there is a good agreement between the measured and simulated profiles, the rear diffuse part of the calculated band profile has less conformity with the measured profile compared to the front part of the profile.
Figure 6A,B represent the simulated concentration profiles of the individual components of the methanol–water mixture, which corresponds to the simulated absorbance profiles in Figure 5 with blue and red curves, respectively. It can be noticed from Figure 6A,B that the concentration peaks of water are larger than methanol peaks, which is contrary to the absorbance peaks in Figure 5. This might be explained by the different responses of the detector for the two components of the mixture, as it was shown through the detector calibration that we obtained different values of the sensitivity factors: k methanol = 0.208, k water = 0.0048 (see Equation (11)).

5. Conclusions

The adsorption study of both the single-component and the competitive isotherms for methanol and water on a hybrid silica column can be successfully conducted with the inverse method, which requires one sample (injection) for the calculation of each adsorption isotherm in SFC. The (ECP) method was applied to predict the approximate adsorption isotherm parameters value of the studied compounds, wherein it could result in a good estimation for methanol, but it could not give an estimation for water adsorption on the studied column.
The bi-Langmuir model was able to account for the adsorption behavior of the single-component sample of both methanol and water. Also, the competitive bi-Langmuir model was able to represent the adsorption of methanol–water mixture occurring at the equilibrium, which emphasizes the competition between the components of the sample to adsorb on the adsorption sites in the stationary phase resulting in a contribution in the retention process.
The competition occurring between methanol and water of the mixture sample to adsorb on the same adsorption site was clear through the saturation capacity of adsorption sites for the multicomponent system ( q s , 2 m e t h a n o l , q s , 1 w a t e r ), which are lower than those for the single-component system.
For calculating the band profile of a mixture sample, we found that employing the parameters of competitive adsorption isotherm in the (ED) model produced a better agreement with the experimental band profile than the parameters of single-component adsorption isotherm.
Understanding the adsorption of methanol and water in a hybrid silica stationary phase from a neat CO2 mobile phase may offer a means for chromatographers to separate hydrophilic compounds using an SFC system in a similar way to hydrophilic interaction liquid chromatography (HILIC) conditions with reduced use of the organic solvents.

Author Contributions

M.Y.K.: investigation, writing—original draft preparation, and visualization; A.F.: conceptualization, writing—review and editing, supervision, and funding acquisition. All authors have read and agreed to the published version of the manuscript.

Funding

This research was funded by NKFIH OTKA grant K143916.

Data Availability Statement

Not applicable.

Acknowledgments

This work was sponsored by the Stipendium Hungaricum Program, Tempus Public Foundation. We are thankful to Abhijit Tarafder and Waters Corporation (Milford, MA, USA) for the long-term generous loan of the ACQUITY UPC2 equipment.

Conflicts of Interest

The authors declare no conflict of interest.

References

  1. Guiochon, G.; Shirazi, D.G.; Katti, A.M.; Felinger, A. Fundamentals of Preparative and Nonlinear Chromatography, 2nd ed.; Academic Press: Boston, MA, USA, 2006. [Google Scholar]
  2. Firoz, D.; Horváth, C. Gradient elution in non-linear preparative liquid chromatography. J. Chromatogr. A 1989, 484, 1–27. [Google Scholar]
  3. Guiochon, G.; Tarafder, A. Fundamental challenges and opportunities for preparative supercritical fluid chromatography. J. Chromatogr. A 2011, 1218, 1037–1114. [Google Scholar] [CrossRef] [PubMed]
  4. Enmark, M.; Forssén, P.; Samuelsson, J.; Fornstedt, T. Determination of adsorption isotherms in supercritical fluid chromatography. J. Chromatogr. A 2013, 1312, 124–133. [Google Scholar] [CrossRef] [PubMed]
  5. Emelie, G.; Leek, H.; Klarqvist, M.; Samuelsson, J.; Fornstedt, T. Systematic investigations of peak deformations due to co-solvent adsorptionin preparative supercritical fluid chromatography. J. Chromatogr. A 2017, 1496, 141–149. [Google Scholar]
  6. Kamarei, F.; Tarafder, A.; Gritti, F.; Vajda, P.; Guiochon, G. Determination of the adsorption isotherm of the naproxen enantiomers on (S,S)-Whelk-O1 in supercritical fluid chromatography. J. Chromatogr. A 2013, 1314, 276–287. [Google Scholar] [CrossRef]
  7. Kamarei, F.; Gritti, F.; Guiochon, G.; Burchell, J. Accurate measurements of frontal analysis for the determination of adsorption isotherms in supercritical fluid chromatography. J. Chromatogr. A 2014, 1329, 71–77. [Google Scholar] [CrossRef]
  8. Rédei, C.; Felinger, A. Modeling the competitive adsorption of sample solvent and solute in supercritical fluid chromatography. J. Chromatogr. A 2019, 1603, 348–354. [Google Scholar] [CrossRef]
  9. Kazmouz, M.Y.; Rédei, C.; Felinger, A. The adsorption of methanol on reversed phase stationary phases in supercritical fluid chromatography. J. Chromatogr. A 2021, 1653, 462386. [Google Scholar] [CrossRef]
  10. Glenne, E.; Les, M.; Samuelsson, J.; Fornstedt, T. Impact of Methanol Adsorption on the Robustness of Analytical Supercritical Fluid Chromatography in Transfer from SFC to UHPSFC. Anal. Chem. 2020, 92, 15429–15436. [Google Scholar] [CrossRef]
  11. Allen Dupree King, C.R.C. Solubility of water in compressed carbon dioxide, nitrous oxide, and ethane. Evidence for hydration of carbon dioxide and nitrous oxide in the gas phase. J. Am. Chem. Soc. 1971, 93, 1857–1862. [Google Scholar] [CrossRef]
  12. Salvador, A.; Herbreteau, B.; Lafosse, M.; Dreux, M. Subcritical fluid chromatography of monosaccharides and polyols using silica and trimethylsilyl columns. J. Chromatogr. A 1997, 785, 195–204. [Google Scholar] [CrossRef]
  13. Ashraf-Khorassani, M.; Taylor, L.T. Subcritical fluid chromatography of water soluble nucleobases on various polar stationary phases facilitated with alcohol-modified CO2 and water as the polar additive. J. Sep. Sci. 2010, 33, 1682–1691. [Google Scholar] [CrossRef] [PubMed]
  14. Fornstedt, T. Characterization of adsorption processes in analytical liquid–solid chromatography. J. Chromatogr. A 2010, 1217, 792–812. [Google Scholar] [CrossRef] [PubMed]
  15. Jonsson, J.A. Chromatographic Theory and Basic Principles; CRC Press: New York, NY, USA, 1987. [Google Scholar]
  16. Jacobson, J.; Frenz, J.; Horváth, C. Measurement of adsorption isotherms by liquid chromatography. J. Chromatogr. A 1984, 316, 53–68. [Google Scholar] [CrossRef] [PubMed]
  17. Felinger, A.; Cavazzini, A.; Guiochon, G. Numerical determination of the competitive isotherm of enantiomers. J. Chromatogr. A 2003, 986, 207–225. [Google Scholar] [CrossRef] [PubMed]
  18. Leśko, M.; Poe, D.P.; Kaczmarski, K. Modelling of retention in analytical supercritical fluid chromatography for CO2—Methanol mobile phase. J. Chromatogr. A 2013, 1305, 285–292. [Google Scholar] [CrossRef]
  19. Kamarei, F.; Vajda, P.; Gritti, F.; Guiochon, G. The adsorption of naproxen enantiomers on the chiral stationary phase (R, R)-whelk-O1 under supercritical fluid conditions. J. Chromatogr. A 2014, 1345, 200–206. [Google Scholar] [CrossRef] [PubMed]
  20. Bartó, E.; Prauda, I.; Kilár, F.; Kiss, I.; Felinger, A. Investigation of retention mechanism of resorcinarene based cavitands by linear and nonlinear chromatography. J. Chromatogr. A 2016, 1456, 152–161. [Google Scholar] [CrossRef]
  21. Felinger, A.; Zhou, D.; Guiochon, G. Determination of the single component and competitive adsorption isotherms of the 1-indanol enantiomers by the inverse method. J. Chromatogr. A 2003, 1005, 35–49. [Google Scholar] [CrossRef]
  22. Kamarei, F.; Vajda, P.; Guiochon, G. Comparison of large scale purification processes of naproxen enantiomers by chromatography using methanol–water and methanol–supercritical carbon dioxide mobile phases. J. Chromatogr. A 2013, 1308, 132–138. [Google Scholar] [CrossRef]
  23. Walter, T.H. Hybrid Particle Columns: The First Twenty Years. LC-GC N. Am. 2019, 37, 436–442. [Google Scholar]
  24. Rouchon, P.; Schonauer, M.; Valentin, P.; Guiochon, G. Numerical simulation of band propagation in nonlinear chromatography. Sep. Sci. Technol. 1987, 22, 1793–1833. [Google Scholar] [CrossRef]
  25. Felinger, A.; Guiochon, G. Rapid simulation of chromatographic band profiles on personal computers. J. Chromatogr. A 1994, 658, 511–515. [Google Scholar] [CrossRef]
Figure 1. Caption. Schematic representation of the synthesis of hybrid silica particles. On the right, the upper layer represents the surface and the lower layer the internal structure of the particle.
Separations 10 00492 g001
Figure 2. Caption. The experimental and simulated concentration profiles for the single component sample of both methanol and water elution from the hybrid silica column with 100% CO2 mobile phase at 1 mL/min, 26 °C, 150 bar back pressure and 195 nm detection.
Separations 10 00492 g002
Figure 3. The single-component bi-Langmuir isotherms determined by IM for the adsorption of both methanol and water on the hybrid silica column with 100% CO2 as the mobile phase. The best isotherm parameters are presented in case 1 of Table 1.
Separations 10 00492 g003
Figure 4. The competitive bi-Langmuir isotherms determined by IM for adsorption of the mixture (10:90 v/v, methanol:water) on the hybrid silica column with 100% CO2 as mobile phase.
Separations 10 00492 g004
Figure 5. Overlay of the experimental and simulated absorbance profiles of (10:90 v/v, methanol:water) mixture on the VIRIDIS BEH column. The simulated profiles are obtained using three cases of the adsorption isotherm parameters as follows: Blue: The mixture profile simulated using competitive bi-Langmuir isotherm parameters; Red: The mixture profile simulated using single-component bi-Langmuir isotherm parameters—case 1 (see Table 1); Green: The mixture profile simulated using single-component bi-Langmuir isotherm parameters—case 2 (see Table 1); Black: The experimental profile of the mixture sample.
Separations 10 00492 g005
Figure 6. Overlay of the simulated concentration profiles of the individual components of the (10:90 v/v, methanol:water) mixture on the hybrid silica column, (A) using best-fit parameters of the competitive bi-Langmuir isotherm, (B) using best-fit parameters of the single-component bi-Langmuir isotherm, determined by IM.
Separations 10 00492 g006
Table 1. Best-fitting parameters of the isotherms for the single component of both methanol and water and the competitive (mixture) cases determined by the inverse method.
Single-Component bi-Langmuir Isotherm Parameters
Case 1 (One of the Adsorption Sites Is Linear for Methanol, and the Other Site Is Linear for Water)
a1b1 (L/g)qs,1 (g/L)a2b2 (L/g)qs,2 (g/L)SSR
Methanol
* N = 1700
7.58Negligible__29.480.3975.590.76
Water
N = 2700
6.810.6810.0135Negligible__1.38
Case 2 (the sites 1 and 2 for water in reverse order compared to case 1)
Methanol
N = 1700
7.58Negligible__29.480.3975.590.76
Water
N = 2700
35Negligible__6.810.6810.011.38
Competitive bi-Langmuir Isotherm Parameters
Methanol
N = 3000
2.85Negligible__34.10.7247.360.824
Water
N = 3000
9.091.36.9935.77Negligible__
* N values refer to the column efficiency, which is used in the simulation program.
Disclaimer/Publisher’s Note: The statements, opinions and data contained in all publications are solely those of the individual author(s) and contributor(s) and not of MDPI and/or the editor(s). MDPI and/or the editor(s) disclaim responsibility for any injury to people or property resulting from any ideas, methods, instructions or products referred to in the content.

