Abstract
This study focused on the clarification of real blanching wastewaters from the industrial processing of cardoon, a plant rich in polyphenols and belonging to the artichoke family (Cynara cardunculus). The aim of this study was to evaluate the performance of ultrafiltration (UF) as an initial clarification step prior to a subsequent nanofiltration treatment for the recovery and fractionation of polyphenols from these wastewaters. In this UF process, three commercial UF membranes with different pore sizes: 3 kDa, 15 kDa, and 50 kDa. The assessment of the clarification process was based on two key factors: permeate flux and the concentration of phenolic compounds. The membrane with a MWCO of 3 kDa was excluded as a potential UF membrane due to its limited performance in terms of permeate flux. The 15 kDa membrane showed comparable results in terms of cumulative flux to the 50 kDa membrane. However, further evaluation based on fouling index and water permeability recovery favored the 15 kDa membrane, indicating better performance. To gain insights into the flux decline mechanisms and understand membrane fouling, a study was conducted on the 15 kDa and 50 kDa membranes. The analysis revealed that the cake filtration model provided the best fit for both membranes. The study highlights the potential of UF membranes, specifically the 15 kDa membrane, for the clarification of cardoon blanching wastewater.
1. Introduction
Cardoon, also known as thistle or Spanish cardoon, is a plant that has been used since ancient times in the preparation of traditional dishes in certain countries of the Mediterranean basin, such as Spain, Italy, and Greece [1,2,3,4]. The enlarged stalks of cardoon are the edible part of the plant after undergoing a blanching process that enhances the tenderness and flavor of the product [3].
Botanically, cardoon is an herbaceous plant that can reach up to 3 m in height and a diameter of 1.5 m. This perennial plant is sown in the spring and harvested during the winter season. Taxonomically, cardoon belongs to the Asteraceae family, which includes the cultivated cardoon (Cynara cardunculus var. altilis DC.), as well as other species such as globe artichoke (Cynara cardunculus var. scolymus L. or Cynara scolymus L.), and wild or non-cultivated cardoon (Cynara cardunculus var. sylvestris Lamk). Genetic studies have shown that both cultivated species, cardoon and globe artichoke, have evolved from wild cardoon [2]. These three species share characteristics such as their prevalence and ability to survive in regions with low and irregular rainfall, basically in countries of the Mediterranean basin [1,5].
In terms of commercial and food use, globe artichoke represents the most extensively cultivated species within the Cynara genus and has the highest production yield. In 2019, global globe artichoke production reached approximately 1700 kTon, with Italy being the leading producer, followed by Egypt and Spain, accounting for over 50% of the total production [6]. In comparison, the cultivated cardoon has a smaller cultivation area and production. For example, in 2019, Spain produced approximately 19.4 kTon [7], which is about ten times less than the production of globe artichokes. However, despite these figures, cultivated cardoon is gaining interest as an edible vegetable due to its health benefits, similar to those found in globe artichokes. Furthermore, new non-food applications are being developed, such as the use of cultivated cardoon as biomass for biofuel and biodiesel production due to its significant content of lignocellulosic compounds and oil seeds [1]. It is also utilized as fodder for livestock feed, in the manufacture of activated carbon as an adsorbent material [8], and even as a source of bioactive compounds with pharmacological, nutraceutical, and cosmetic potential [1].
Regarding its use as a vegetable, the market for cultivated cardoon is mainly focused on the production of canned cardoon. This industry generates wastewater, with a significant portion originating from the blanching of the stalks. Similar to the case of globe artichoke processing, the bleaching wastewater from cultivated cardoon contains bioactive compounds with high environmental, economic, and health potential when recovered. The recovery of these compounds aligns with the principles and objectives of the Sustainable Development Goals (SDGs) outlined in The 2030 Agenda for Sustainable Development, which was adopted by all United Nations Member States in 2015 [9]. In particular, it is aligned with SDG-12, which focuses on ensuring sustainable consumption and production patterns. Therefore, it is necessary to study methods to recover these bioactive compounds from the wastewater produced during the cardoon blanching process for potential use.
Bioactive compounds are of great importance due to their antimicrobial, antioxidant, anticancer, anti-inflammatory, and phytotoxic properties [10]. In Cynara plants, these highly valued properties are directly linked to the presence of phenolic compounds, mainly mono- and di-caffeoylquinic acids [11,12], terpenoids, flavones, as well as inulin and vitamin C [10,13].
Membrane technology has emerged as one of the most widely utilized separation techniques for recovering, fractionating, and concentrating liquid streams in agricultural and food products and by-products. Numerous studies have reported successful applications of membrane technology in various matrices and for diverse processing purposes. In the past five years, several comprehensive reviews have been published, providing insights into the recent advancements in this field [14,15,16,17,18].
Significant attention has been devoted to investigating integrated membrane systems employed in diverse liquid wastewater and processing streams. Typically, an integrated membrane system involves multiple pressure-driven operations. The process initiates with a clarification step, such as microfiltration or ultrafiltration, followed by nanofiltration to facilitate fractionation and, in certain cases, concentration of valuable compounds. Furthermore, some studies incorporate reverse osmosis to produce purified water that can be recycled within the process alongside a concentrated stream of the desired compounds [19,20,21,22,23].
Membrane technology is a separation technique that offers competitive advantages compared with more traditional technologies. It operates at low pressure and temperature, does not require the presence of other substances (chemical or biological), and exhibits high selectivity for specific substances depending on the membrane used in the process [20]. However, membrane fouling is a major challenge as it reduces the lifetime of the membrane, requiring the development of cleaning protocols.
This study aims to use ultrafiltration as a clarification step prior to a subsequent nanofiltration treatment for the recovery and fractionation of polyphenols from blanching wastewater generated by a canned cardoon industry. Three membranes with different cut-offs were employed to determine the membrane that provides the best performance in terms of permeate flux and the concentration of bioactive compounds. The mechanisms responsible for flux decline were investigated to gain a better understanding of membrane fouling.
2. Materials and Methods
2.1. Blanching Wastewater
In this study, genuine industrial blanching wastewater provided by Gvtarra-The Real Green Food Co., Ltd., located in Navarra, Spain, was utilized. Gvtarra is a prominent company known for its production of various canned vegetables, including canned cardoon. The company generously sent us three different and separate samples of blanching wastewater, with each sample consisting of 25 L. The three independent samples were received in our laboratory the day after their generation. The 25 L-samples were collected during three different companies’ production process days and were carefully shipped under refrigerated conditions.
Upon receiving each sample of wastewater, a prefiltration process was performed in two stages. Firstly, a 60 μm polypropylevne filter was employed, followed by the passage of the filtered solution through a 5 μm polypropylene filter. In both cases, the wastewater was pumped using a peristaltic pump. An aliquot of the three filtered blanching wastewaters was collected and stored at −20 °C for subsequent analysis. The remaining filtered wastewater was also stored at −20 °C until it underwent membrane treatment.
2.2. Ultrafiltration System
For the ultrafiltration (UF) treatment of the three prefiltered cardoon wastewaters, it was used an ultrafiltration system (Figure 1) that consisted of a tubular module from Tami Industries (Nyons, France) housing UF membranes (25 mm of external diameter and 600 mm of length). The temperature was achieved and controlled using a liquid cooler (Frigedor, J.P. Selecta, Abrera, Spain). Transmembrane pressure (TMP) was monitored using pressure gauges. The feed flow rate was determined by a flowmeter. The retentate and permeate streams were collected separately.
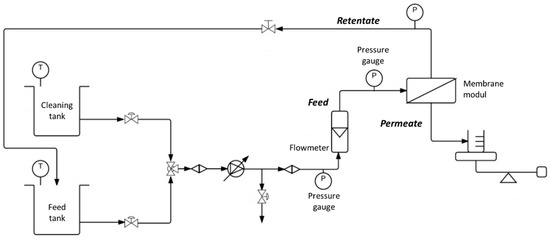
Figure 1.
Scheme of the ultrafiltration plant.
The flux of permeate was determined gravimetrically on-line by means of a scale connected to a computer and calculated according to Equation (1).
where J, is the permeate flux (L·h−1·m−2); dV, is the weight difference (g) between two operation moments (it can be assumed that permeate flux presents the water density), and dt, is the time difference (h).
2.2.1. Ultrafiltration Membranes
Three ceramic membranes (Inside ceram) from Tami Industries (Nyons, France) with different molecular weight cut-offs (MWCO) (3, 15, and 50 kDa) were used. These membranes share similar physico-chemical characteristics: TiO2 material; tubular configuration; membrane surface area of 0.06 m2; maximum operating pressure of 1000 kPa (10 bar); maximum operating temperature of 350 °C and a pH range of 0–14.
Membranes were characterized in terms of water permeability, which was measured before and after the wastewater treatment and the subsequent membrane cleaning. For the determination of water membrane permeabilities, osmotized water was used, and the steady-state water flux at different TMPs (0.5, 1.0, 2.0, and 3.0 bar) was represented (Equation (2)). The temperature was maintained at a constant 17 ± 1 °C, and the flow rate was set at 250 L·h−1.
where L is the water permeability (L·h−1·m−2·bar−1), Jw is the permeate water flux (L·h−1·m−2), and TMP is the transmembrane pressure (bar).
2.2.2. Membrane Evaluation
To assess the performance of the three UF membranes, the system was operated in a concentration mode: the retentate was continuously returned to the feed tank while the permeate was collected seperately and on-line weighted with time.
Operational conditions were carefully controlled and kept constant throughout the experiments (flow rate = 250 L·h−1; T = 20 ± 1 °C; TMP = 4 bar). At the end of each concentration process (lasting 8.8–10.0 h), samples of the final retentate and permeate were taken and stored at −20 °C for subsequent analysis. After each concentration experiment, the membrane was rinsed with osmotized water for 30 min, and water permeability was measured (L1). Afterwards, an alkaline cleaning step using a 0.2% NaOH solution at 40 °C for 1 h was performed, followed by another 30-min rinsing with osmotized water and the measurement of the water permeability (L2). The values of L1 and L2 were then compared with the initial water permeability of the membrane (L0).
The performance of membranes was evaluated based on two key factors: (i) permeate flux decline due to membrane fouling, determined by the normalized flux (J/J0), where J is the permeate flux and J0 is the initial permeate flux; (ii) rejection index (R), that quantifies the percentage of a specific compound that is retained by the membrane during the filtration process and was calculated by using Equation (3), where CP and CF are the concentrations of a specific compound in the permeate and feed solutions, respectively.
2.3. Fouling and Flux Decline Study
For the analysis of fouling in all membranes, Hermia’s mechanisms were employed [24,25]. In brief, Hermia’s mechanisms involve the evaluation of flux decline over time. By taking derivatives of Equation (1) and transforming them, Equation (4) is obtained, where α is a constant and n defines the type of flux decline.
However, it has been observed that in certain cases, the pure models described by Hermia (Equations (5)–(8)) are insufficient to explain membrane flux decline [26,27,28]. This is likely due to the involvement of multiple fouling mechanisms. To address this, some authors have proposed combined mechanisms based on Hermia’s pure models to describe the flux fouling (Equations (9)–(13)) [26,27,28]. Table 1 lists both the pure and combined Hermia’s mechanisms models, along with the corresponding describing equations and fitted parameters that characterize these models.

Table 1.
Hermia’s fouling mechanisms and their combinations (adapted from [25,26,27,28]).
2.4. Analytical Determinations
2.4.1. Chemicals
All chemicals used in this work were obtained from Sigma-Aldrich (Sigma-Aldrich, Madrid, Spain).
2.4.2. Polyphenol Content
The polyphenol content was quantified using the total polyphenol index (TPI), which was determined in the sample by direct measurement of the absorbance at 280 nm [29]. A calibration curve was constructed using gallic acid as a standard, allowing the results to be expressed in mg of gallic acid equivalents (GAE) per liter (mg GAE/L = GAE ppm).
2.4.3. Phenolic Acids
The content of phenolic acids (PhA) in the samples was determined following the method described by Spigno et al. [30]. In brief, 0.25 mL of the sample was added to a test tube, followed by the addition of 0.25 mL of a 0.1% solution of hydrochloric acid in ethanol (95%). Furthermore, 4.55 mL of a 2% hydrochloric acid solution was added. The mixture was stirred and allowed to stand for 15 min at room temperature. The reactive mixtures were then spectrophotometrically measured at 320 nm. A calibration curve was obtained using caffeic acid as the standard, and the results were expressed in mg of caffeic acid equivalents (CAE) per liter (mg CAE/L = CAE ppm).
2.4.4. Phenolic Composition
For the determination of the phenolic composition, 10 µL of each extract were analyzed using a HPLC system (Waters Alliance 2695, Milford, MD, USA) equipped with a quaternary pump, vacuum degasser, termostatized column compartment, autosampler, and a photodiode array detector (PAD model 2996 Waters). The Empower 2 Chromatography Data Software was used for data collection (Water Corporations, Milford, Ireland). Separation was accomplished using a Luna C18 column (Phenomenex) (RP-C18, 25 × 0.4 cm, 5 µm particle size).
The mobile phase consisted of 0.1% formic acid in water (solvent A) and HPLC-grade acetonitrile (solvent B). A linear gradient was employed with the following conditions: min 0, 90% A, and 10% B; 30 min, 50% A, 50% B; 35 min 100% B, at a flow rate of 1 mL/min. The analysis was stopped after 40 min. The system was equilibrated for 10 min using the initial mobile phase composition between different runs. The photodiode array detector (PAD) was set to detect wavelengths ranging from 200 to 600 nm.
2.5. Statistical Analysis
The polyphenol content and the phenolic acid content were measured in triplicate, and the results are presented as their average. To study the fouling mechanisms, the experimental flux data were fitted to various models listed in Table 1 (Equations (5)–(13)) using the Solver tool in the MS Excel program. The goodness of fit was evaluated based on both the regression coefficient (r2fit) and the sum of square errors (SSE).
3. Results and Discussion
3.1. Composition of Cardoon Blanching Wastewaters
In each ultrafiltration experiment, a distinct 25 L sample of blanching wastewater collected on different production days was utilized. The analysis of these three feed solutions revealed noticeable variability among them, with the TPI ranging from 161.2 ± 8.1 to 407.7 ± 31.9 mg GAE/L and the PhA ranging from 104.4 ± 7.8 to 192.7 ± 10.3 mg CAE/L.
HPLC analysis of the three feed samples demonstrated a similar polyphenol profile, characterized by the presence of seven main peaks in all cases. Figure 2 displays the chromatographic profile obtained for the feed solution used with the 50 kDa membrane.
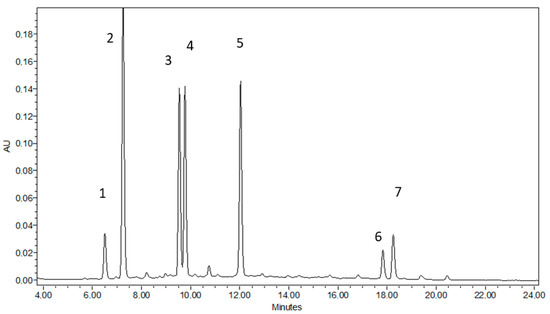
Figure 2.
HPLC chromatographic profile for the feed solution used in the UF treatment with the 50 kDa membrane. Peak 1: unknown isomer; Peak 2: 5-O-caffeoylquinic acid; Peak 3: 3-O-caffeoylquinic acid; Peak 4: 4-O-caffeoylquinic acid; Peak 5: 1,5-dicaffeoylquinic acid; Peak 6: 1,5-dicaffeoylquinic acid; Peak 7: unknown isomer.
Four of these peaks were successfully identified by injecting pure standards: peak 2 corresponds to 5-O-caffeoylquinic acid, peak 3 corresponds to 3-O-caffeoylquinic acid (chlorogenic acid, CGA), peak 5 corresponds to 1,3-dicaffeoylquinic acid (cynarin), and peak 6 corresponds to apigenin-7-O-glucoside. However, based on previous studies focused on the identification and quantification of polyphenols from Cynara spp. [4,31], it is plausible to suggest that peak 4 could be a 4-O-caffeoylquinic acid isomer, while peak 7 could be a 1,5-di-O-caffeoylsuccinylquinic acid isomer [32]. Notably, luteolin, which has been reported by some authors [33,34,35,36], was not detected in our samples.
Peaks 2–5 exhibited the highest chromatographic areas, and the ratio of individual compound area to the total area yielded similar values for each feed solution, ranging as follows: peak 2: 27.0–29.3%, peak 3: 17.7–20.7%, peak 4: 17.9–19.9%, and peak 5: 13.8–19.2%. These polyphenols (peaks 2–5) accounted for approximately 82% of the total and belong to the chemical family of caffeoylquinic acids.
3.2. Permeate Flux Performance
3.2.1. Membrane Characterization
Figure 3 shows, among others, the initial water permeabilities (L0) for the three membranes under study. The values obtained were 4.97 (1.38 × 10⁻⁶), 12.07 (3.35 × 10⁻⁶), and 25.92 (7.20 × 10⁻⁶) L·h−1·m−2·bar (m/s·bar) for the 3 kDa, 15 kDa, and 50 kDa membranes, respectively. As expected, the water permeability is strongly dependent on the MWCO. A second-grade polynomial equation with a fitting goodness of 0.99 was established, relating the MWCO of the membrane to its initial permeability.
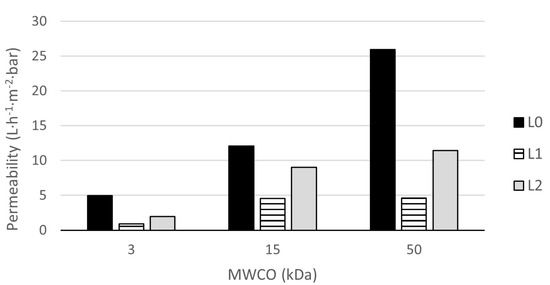
Figure 3.
Water permeabilities for three UF membranes depending on their MWCO (Experimental conditions: T = 17 °C; Q = 250 L·h−1). L0, initial water permeability; L1, permeability after the ultrafiltration treatment; L2, membrane permeability after the alkaline cleaning.
3.2.2. Evolution of the Permeate Flux
The treatment of cardoon wastewater was conducted using three distinct samples collected on different production days. It was found that the initial permeate fluxes (J0) followed a similar trend to the initial water permeabilities: 50 kDa > 15 kDa > 3 kDa. Specifically, the initial permeate fluxes were measured as 28.92 (8.03 × 10⁻⁶), 23.22 (6.45 × 10⁻⁶), and 4.09 (1.14 × 10⁻⁶) L·h−1·m−2 (m/s) for the 50 kDa, 15 kDa, and 3 kDa membranes, respectively (Figure 4a).
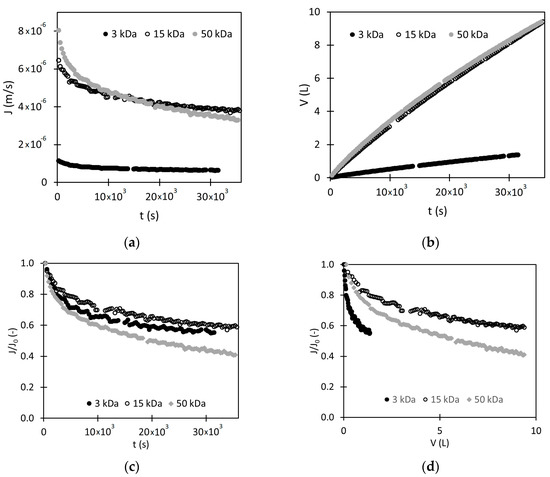
Figure 4.
Flux performance of the three UF membranes: (a) flux as a function of processing time; (b) cumulative volume of permeate as a function of processing time; (c) normalized flux as a function of processing time; (d) normalized flux as a function of cumulative volume of permeate (Experimental conditions: T = 20 ± 1 °C; Q = 250 L·h−1 and TMP = 4 bar).
In all cases, the initial flux quickly decreased at short times until reaching a sort of pseudo-steady state situation at longer times, in which the flux slightly decreased. This pseudo-steady state was more evident for 3 kDa and 15 kDa membranes, while for the 50 kDa membrane, the asymptotic flux was not reached at the end of the experiment.
The comparison of the three membranes revealed distinct performance characteristics. The 3 kDa membrane exhibited significantly lower fluxes throughout the treatment process, indicating its limited performance. In contrast, the 15 kDa and 50 kDa membranes displayed similar flux values initially, with the 50 kDa membrane showing a higher initial flux. However, over time, the flux of the 15 kDa membrane remained higher than that of the 50 kDa membrane. This is further supported by the volume of permeate collected during the UF treatment (Figure 4b), where the 3 kDa membrane yielded approximately 1.4 L in 8.8 h, while the 15 kDa and 50 kDa membranes reached volumes of 8.4 L and 8.6 L, respectively, meaning 6.11 and 6.22 folds the volume obtained by the 3 kDa membrane, respectively. The volume profiles for the 15 kDa and 50 kDa membranes nearly overlapped over time.
The decrease in normalized flux (J/J0) for all membranes (Figure 4c) followed a similar trend, with two distinguishable zones. Initially, there was a sharp decrease in flow, followed by a more gradual decline. It was noticeable that despite the fact that the 50 kDa membrane presented both the highest water permeability and initial flux, this membrane exhibited the highest flux decline at the end of the process, at about 60% of the initial flux. However, for the 15 kDa and 3 kDa membranes, the flux decline was about 40%. The same fouling differences among the membranes of 15 and 50 kDa were reported by Cifuentes-Cabezas et al. [37]. In their work, different ceramic membranes were tested for the clarification of olive oil washing wastewater.
The differences in flux decline among these 3 membranes can be attributed to different fouling mechanisms, and the large flux decay for the 50 kDa membrane may also be due to a blockage of the pores by substances with similar size to that of the membrane pores, which directly affects the selectivity of the membrane [37,38].
Thus, the 50 kDa membrane allowed the passage of higher molecular weight particles. These foulants likely attached to the internal pore surface, reducing the permeate passage and increasing flow resistance. In contrast, access to the 15 kDa membrane may have been more limited, resulting in a smaller relative decrease in permeate flux. The 3 kDa membrane’s smaller pore size prevented the passage of high molecular weight particles, and the gel layer added extra resistance. The observed decrease in flow is likely attributed to the low permeability through both layers (membrane + fouling).
The fouling index (If) (Equation (14)) [39,40] relates the water permeability of the membrane after the UF treatment (L1) to its initial water permeability (L0) (Figure 3), which is directly related to the membrane fouling.
The calculated If values were 81.4% (3 kDa), 62.1% (15 kDa), and 82.3% (50 kDa), indicating that the 15 kDa membrane exhibited better performance in terms of fouling, which was aligned with the previous observations and assumptions. Additionally, the water permeability recovery (WPR) [22,41], which compares water permeabilities after alkaline cleaning (L2) to the initial state (L0) (Figure 3), yielded values of 39.3% (3 kDa), 74.6% (15 kDa), and 44.1% (50 kDa). These results indicated that the 15 kDa UF membrane exhibited the lowest amount of irreversible fouling after an alkaline cleaning, which is in concordance with what has been found by other authors [37].
Figure 5 represents a semi-qualitative scheme of the entire procedure, including the membrane treatments and characterizations, with a qualitative time axis and a quantitative flux variable. Sections A, C, and D are of shorter duration (30 min), while Section B is of longer duration (10 h). This representation allows for a visual comparison of the different stages and their associated flux values. Sections A, C, and D refer to the expected water flux for each membrane at the TMP used in the feed solution treatment (4 bar) and were calculated from the water permeabilities L0, L1, and L2 (Figure 3), respectively. On the other hand, in Section B is shown the flux course for the three membranes during the cardoon wastewater treatment is shown. Figure 5 shows the membrane fouling caused by the cardoon wastewater treatment and the effect of the membrane cleaning on the water flux.
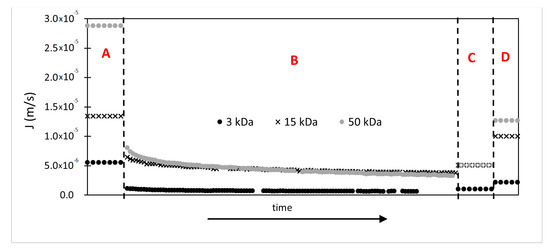
Figure 5.
Scheme of the flux obtained for the 3 kDa, 15 kDa and 50 kDa membranes. Section A: Initial water flux calculated from L0; Section B: Flux evolution during the treatment of the cardoon wastewater; Section C: Water flux calculated after water rinse of the fouled membrane (L1); Section D: Water flux calculated after alkaline cleaning of the membrane (L2).
3.3. Separation of Bioactive Compounds by UF
In the clarification of the cardoon blanching wastewater, all membranes assayed allowed the formation of a clarified permeate and a turbid retentate (Figure 6). As anticipated, the permeates exhibited lower coloration intensity and more transparency compared with the retentates, indicating successful clarification of the feed streams with all membranes. These visual observations confirm that the membranes were able to separate components in the feed.
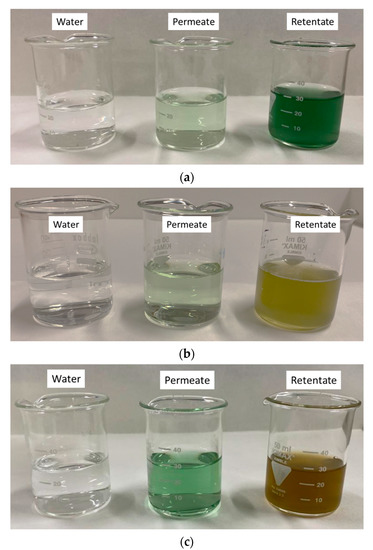
Figure 6.
Visual appearance of the permeate and retentate fractions for: (a) 3 kDa membrane; (b) 15 kDa and (c) 50 kDa membrane (Experimental conditions: T = 20 ± 1 °C; Q = 250 L·h−1 and TMP = 4 bar).
The observed differences in color correspond to two different reasons: the variability in the chemical composition of the three distinct feed samples and the effect of the different MWCO of the membranes. To facilitate a valid comparison of the separation efficiency among the three membranes, the results were evaluated in terms of the rejection index (Equation (3)) (Table 2). In the HPLC analysis, the rejection index was determined using the total area of the chromatograms for the feed and permeate rather than the total concentration.

Table 2.
Rejection indexes for the 3, 15 and 50 kDa membranes (Experimental conditions: T = 20 ± 1 °C; Q = 250 L·h−1 and TMP = 4 bar).
The rejection index for TPI, phenolic acids, and total polyphenols by HPLC exhibited the expected trend, with higher values for the 3 kDa membrane and lower values for the 50 kDa membrane. A second-degree polynomial relationship with a goodness of fit of 0.96 was observed between the rejection index and MWCO of the membranes. This relationship allows for the estimation of the expected rejection index and subsequent determination of the polyphenol concentration in the permeate and retentate under the same treatment conditions employed in this study.
3.4. Flux Decline Mechanims
Based on the factors discussed above, the 3 kDa membrane was discarded as a potential UF membrane for the clarification step of cardoon blanching wastewater. The cumulative volume of permeate obtained with the other two membranes, 15 kDa and 50 kDa, was similar. However, when comparing the fouling index and water permeability recovery values, the 15 kDa membrane performed better. On the contrary, regarding the biocomponent separation, the 15 kDa membrane approximately doubled the rejection index of the 50 kDa membrane. Thus, since there was not clear evidence to select between the 15 kDa and 5 kDa membranes, both will be further studied in terms of flux decline mechanisms.
Different Hermia’s models listed in Table 1 were applied to determine the fitted parameters (Equations (5)–(8)) as well as the statistical values of r2, SSE, and Error (%). SSE represents the sum of squared estimates of errors (Equation (15)), and the Error (%) was calculated using Equation (16).
where m is the number of experimental data points, ye is the experimental data, and yc is the predicted data from models.
In Figure 7, the experimental data for 15 kDa and 50 kDa membranes are represented according to Hermia’s models. In Table 3 are collected the statistic values (r2, SSE, Error) as well as the different fitted parameters for all Hermia’s mechanisms. Moreover, a correlation factor (r2corr) was calculated by comparing the expected values from the CF, IB, SB, and CB models (Equations (5)–(8)) with their corresponding experimental values.
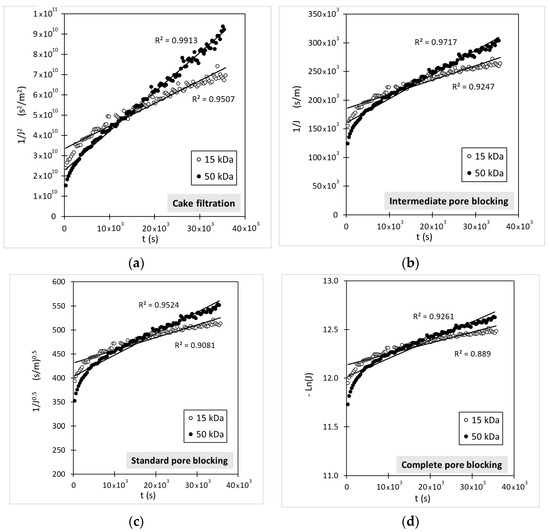
Figure 7.
Application of Hermia’s blocking models to experimental data for selected membranes of 15 kDa and 50 kDa: (a) cake filtration; (b) intermediate pore blocking; (c) standard pore blocking; (d) complete pore blocking. (Experimental conditions: T = 20 ± 1 °C; Q = 250 L·h−1 and TMP = 4 bar).

Table 3.
Fitted and statistic parameters obtained for the Cake filtration (CF), Intermediate pore blocking (IB), Standard pore blocking (SB) and Complete pore blocking (CB) Hermia’s models for the three membranes assayed (Experimental conditions: T = 20 ± 1 °C; Q = 250 L·h−1 and TMP = 4 bar).
Both Figure 7 and Table 3 show that the cake filtration model provides the best fit for the 15 kDa and 50 kDa membranes. However, the fitting parameters (r2fitting, SSE, and Error (%)) were better for the 50 kDa membrane (r2fitting = 0.9913), while the regression index for the 15 kDa membrane was lower (r2fitting = 0.9507). It is interesting to notice that for both membranes, the best fitting parameters are obtained with the lowest values of the n parameter proposed in Hermia’s models (Equation (4) and Table 1), and moreover, the higher the n-parameter, the lower the fitting. The cake filtration assumes that all pores in the UF membrane are blocked, and as new foulants are deposited on other ones, a cake layer is built [23].
As suggested by some authors [26,27,28], fouling can be explained in some cases as a combination of two pure Hermia’s mechanisms, and therefore, combined mechanisms (Equations (9)–(13)) have been assessed to study this possibility as a cause of flux decline. In Figure 8 and Table 4, the results obtained in this evaluation are shown.
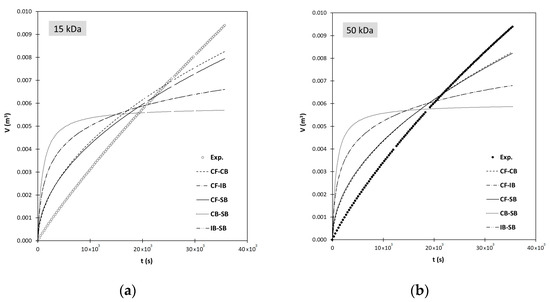
Figure 8.
Application of combined Hermia’s blocking models to experimental data for selected membranes: (a) membrane of 15 kDa; (b) membrane of 50 kDa. CF-CB: Cake filtration and Complete pore blocking; CF-SB: Cake filtration and Standard pore blocking; CF-IB: Cake filtration and Intermediate pore blocking; CB-SB: Complete pore blocking and Standard pore blocking; IB-CB: Intermediate pore blocking and Standard pore blocking. (Experimental conditions: T = 20 ± 1 °C; Q = 250 L·h−1 and TMP = 4 bar).

Table 4.
Fitted and statistic parameters obtained for the membranes of 15 kDa and 50 kDa according to the five combined fouling models. Cake filtration and Complete pore blocking (CF-CB); Cake filtration and Standard pore blocking (CF-SB); Cake filtration and Intermediate pore blocking (CF-IB); Complete pore blocking and Standard pore blocking (CB-SB); Intermediate pore blocking and Standard pore blocking (IB-CB). (Experimental conditions: T = 20 ± 1 °C; Q = 250 L·h−1 and TMP = 4 bar).
Figure 8 illustrates the cumulative volume of permeate expected for each combined model. It is evident that none of the combined models fit the experimental data, and this is reinforced when fitting parameters were calculated, which yield error values from 40.11% to 102.20% for the 15 kDa membrane and 30.33% to 91.98% for the 50 kDa membranes (Table 4).
In light of the results shown in Figure 7 and Figure 8 and Table 4, it is possible to conclude that none of the combined models proposed in Equations (9)–(13) can explain the fouling mechanisms observed in the cardoon blanching wastewaters used in this study. The pure Hermia’s mechanisms, particularly the cake filtration model, provide a better explanation of the membrane fouling.
4. Conclusions
This work was aimed at the assessment of the ultrafiltration process as a preliminary step prior to a subsequent nanofiltration treatment of blanching wastewater from the canned cardoon industry. Three ultrafiltration membranes of different cut-offs (3, 15, and 50 kDa) were studied. All of them effectively reduced the turbidity of the feed solution, but the 3 kDa membrane gave by far the worst performance in both permeate flux and biocompound recovery. The collected volume of permeate was extremely low compared with those obtained by the other studied membranes. In addition, its rejection index determined that a low concentration of phenolics passed through the membrane, obtaining a poor permeate solution, which would limit the use of this permeate in a later nanofiltration step for the separation, fractionation, and concentration of different compounds contained in it. Thus, a membrane of 3 kDa was rejected for the purpose reached.
On the other hand, an in-depth study of the fouling mechanisms was applied to membranes of 15 and 50 kDa. It was found that, especially in the cake filtration model, this was the mechanism that better explained the membrane fouling in both cases, since in this model, all membrane pores are blocked and, as new foulants are deposited on other ones, a cake layer is built. Finally, little differences in permeate flux were found between both membranes; however, it has been found that membranes of 50 kDa responded better to an alkaline cleaning, showing higher water permeability recovery.
Author Contributions
Conceptualization, E.M.G.-C. and A.D.R.-L.; methodology, E.M.G.-C., M.M. and A.D.R.-L.; formal analysis, M.M. and M.R.; investigation, E.M.G.-C., M.M. and A.D.R.-L.; resources, M.I.I.-C. and A.I.-C.; data curation, E.M.G.-C. and A.D.R.-L.; writing—original draft preparation, E.M.G.-C.; writing—review and editing, E.M.G.-C., M.R., M.I.I.-C., A.I.-C. and A.D.R.-L.; supervision, E.M.G.-C. and A.D.R.-L. All authors have read and agreed to the published version of the manuscript.
Funding
This research received no external funding.
Data Availability Statement
Data sharing not applicable.
Acknowledgments
Authors gratefully acknowledge the company Gvtarra-The Real Green Food Co., Ltd. (Navarra, Spain) for providing the real blanching solutions to carry out this work.
Conflicts of Interest
The authors declare no conflict of interest.
References
- Fernandez, J.; Curt, M.D.; Aguado, P.L. Industrial applications of Cynara cardunculus L. for energy and other uses. Ind. Crops Prod. 2006, 24, 222–229. [Google Scholar] [CrossRef]
- Ierna, A.; Mauromicale, G. Cynara cardunculus L. genotypes as a crop for energy purposes in a Mediterranean environment. Biomass Bioenergy 2010, 34, 754–760. [Google Scholar] [CrossRef]
- Barbosa, C.H.; Andrade, M.A.; Vilarinho, F.; Castanheira, I.; Fernando, A.L.; Roizzo, M.R.; Sanches Silva, A. A New Insight on Cardoon: Exploring New Uses besides Cheese Making with a View to Zero Waste. Foods 2020, 9, 564. [Google Scholar] [CrossRef]
- Ferioli, F.; A’Antuono, L.F. Phenolic compounds in local Italian types of cultivated cardoon (Cynara cardunculus L. var. altilis DC) stalks and artichoke (Cynara cardunculus L. var. scolymus L.) edible sprouts. J. Food Compos. Anal. 2022, 106, 104342. [Google Scholar]
- Mañas, P.; Castro, E.; de las Heras, J. Application of treated wastewater and digested sewage sludge to obtain biomass from Cynara cardunculus L. J. Clean. Prod. 2014, 67, 72–78. [Google Scholar] [CrossRef]
- FAOSTAT, Food and Agriculture Organization of the United Nations, Statistics Division. 2020. Available online: http://www.fao.org/faostat (accessed on 12 January 2022).
- MAPA, Ministerio de Agricultura Pesca y Alimentación (Spain). Available online: https://www.mapa.gob.es/estadistica/pags/anuario/2020/TABLAS%20PDF/CAPITULO07/pdfc07_7.5.14.4.pdf (accessed on 12 January 2022).
- Hajji Nabih, M.; El Hajam, M.; Boulika, H.; Chiki, Z.; Ben Tahar, S.; Idrissi Kandri, N.; Zerouale, A. Preparation and characterization of activated carbons from cardoon “Cynara cardunculus” waste: Application to the adsorption of synthetic organic dyes. Mater. Today Proc. 2023, 72, 3369–3379. [Google Scholar] [CrossRef]
- UN, United Nations. Available online: https://sdgs.un.org/goals (accessed on 16 January 2022).
- Pandino, G.; Bonomo, A.; Scavo, A.; Mauromicale, G.; Lombardo, S. Caffeoylquinic acids and flavones profile in Cynara cardunculus L. seedlings under controlled conditions as affected by light and water-supply treatments. Sci. Hortic. 2022, 302, 111180. [Google Scholar] [CrossRef]
- Dias, M.I.; Barros, L.; Barreira, J.C.M.; Alvesa, M.J.; Barracosa, P.; Ferreira, I.C.F.R. Phenolic profile and bioactivity of cardoon (Cynara cardunculus L.) inflorescence parts: Selecting the best genotype for food applications. Food Chem. 2018, 268, 196–202. [Google Scholar] [CrossRef] [PubMed]
- Gerschenson, L.N.; Fissore, E.N.; Rojas, A.M.; Bernhardt, D.C.; Santo Domingo, C. Artichoke. In Nutritional Composition and Antioxidant Properties of Fruits and Vegetables; Jaiswal, A.K., Ed.; Academic Press-Elsevier: London, UK, 2020; Chapter 4; pp. 55–69. [Google Scholar]
- Garcia-Castello, E.M.; Mayor, L.; Calvo-Ramirez, A.; Ruiz-Melero, R.; Rodriguez-Lopez, A.D. Response Surface Optimization of Inulin and Polyphenol Extraction from Artichoke (Cynara scolymus (L.)) Solid Wastes. Appl. Sci. 2022, 12, 7957. [Google Scholar] [CrossRef]
- Castro-Muñoz, R.; Boczkaj, G.; Gontarek, E.; Cassano, A.; Fíla, V. Membrane technologies assisting plant-based and agro-food by-products processing: A comprehensive review. Trends Food Sci. Technol. 2020, 95, 219–232. [Google Scholar] [CrossRef]
- Cassano, A.; Rastogi, N.K.; Basile, A. Membrane technologies for water treatment and reuse in the food and beverage industries. In Advances in Membrane Technologies for Water Treatment; Basile, A., Cassano, A., Rastogi, N.K., Eds.; Woodhead Publishing-Elsevier: Cambridge, UK, 2015; Chapter 18; pp. 551–580. [Google Scholar]
- Galanakis, C.M.; Castro-Muñoz, R.; Cassano, A.; Conidi, C. Recovery of high-added-value compounds from food waste by membrane technology. In Membrane Technologies for Biorefining; Figoli, A., Cassano, A., Basile, A., Eds.; Woodhead Publishing-Elsevier: Cambridge, UK, 2016; Chapter 8; pp. 189–215. [Google Scholar]
- Battacharjee, C.; Saxena, V.K.; Dutta, S. Fruit juice processing using membrane technology: A review. Innov. Food Sci. Emerg. Technol. 2017, 43, 136–153. [Google Scholar] [CrossRef]
- Conidi, C.; Drioli, E.; Cassano, A. Membrane-based agro-food production processes for polyphenol separation, purification and concentration. Curr. Opin. Food Sci. 2017, 17, 149–164. [Google Scholar] [CrossRef]
- Saf, C.; Gondet, L.; Villain-Gambier, M.; Belaqziz, M.; Trebouet, D.; Ouazzani, N. Investigation of the agroecological applications of olive mill wastewater fractions from the ultrafiltration-nanofiltration process. J. Environ. Manag. 2023, 333, 117467. [Google Scholar] [CrossRef] [PubMed]
- Da Silva, S.C.; Santos Amaral Moravia, M.C.; Fonseca Couto, C. Combined process of ultrafiltration and nanofiltration for vinasse treatment with and without pre-coagulation. J. Water Process. Eng. 2020, 36, 101326. [Google Scholar] [CrossRef]
- Sánchez-Arévalo, C.M.; Croes, T.; Van der Bruggen, B.; Vincent-Vela, M.C.; Álvarez-Blanco, S. Feasibility of several commercial membranes to recover valuable phenolic compounds from extracts of wet olive pomace through organic-solvent nanofiltration. Sep. Purif. Technol. 2023, 305, 122396. [Google Scholar] [CrossRef]
- Conidi, C.; Cassano, A.; Garcia-Castello, E. Valorization of artichoke wastewaters by integrated membrane process. Water Res. 2014, 48, 363–374. [Google Scholar] [CrossRef]
- Garcia-Castello, E.M.; Mayor, L.; Chorques, S.; Argüelles, A.; Vidal-Brotóns, D.; Gras, M.L. Reverse osmosis concentration of press liquid from orange juice solid wastes: Flux decline mechanisms. J. Food Eng. 2011, 106, 199–205. [Google Scholar] [CrossRef]
- Cui, Z.F.; Jiang, Y.; Field, R.W. Fundamentals of Pressure-Driven Membrane Separation Processes. In Membrane Technology; Cui, Z.F., Muralidhara, H.S., Eds.; Butterworth-Heinemann-Elsevier: Oxford, UK, 2010; Chapter 1; pp. 1–18. [Google Scholar]
- Hermia, J. Constant pressure blocking filtration laws-application to power law non Newtonian fluids. Inst. Chem. Eng. Trans. 1982, 60, 183–187. [Google Scholar]
- Bolton, G.; LaCasse, D.; Kuriyel, R. Combined models of membrane fouling: Development and application to microfiltration and ultrafiltration of biological fluids. J. Membr. Sci. 2006, 277, 75–84. [Google Scholar] [CrossRef]
- Charfi, A.; Ben Amar, N.; Harmand, J. Analysis of fouling mechanisms in anaerobic membrane bioreactors. Water Res. 2012, 46, 2637–2650. [Google Scholar] [CrossRef]
- Garcia-Castello, E.M.; Rodriguez-Lopez, A.D.; Barredo-Damas, S.; Iborra-Clar, A.; Pascual-Garrido, J.; Iborra-Clar, M.I. Fabrication and Performance of Low-Fouling UF Membranes for the Treatment of Isolated Soy Protein Solutions. Sustainability 2021, 13, 13682. [Google Scholar] [CrossRef]
- Spigno, G.; De Faveri, D.M. Antioxidants from grape stalks and marc: Influence of extraction procedure on yield, purity and antioxidant power of the extracts. J. Food Eng. 2007, 78, 793–801. [Google Scholar] [CrossRef]
- Spigno, G.; Tramelli, L.; De Faveri, D.M. Effects of extraction time, temperature and solvent on concentration and antioxidant activity of grape marc phenolics. J. Food Eng. 2007, 81, 200–208. [Google Scholar] [CrossRef]
- Montesano, V.; Negro, D.; Sonnante, G.; Laghetti, G.; Urbano, M. Polyphenolic Compound Variation in Globe Artichoke Cultivars as Affected by Fertilization and Biostimulants Application. Plants 2022, 11, 2067. [Google Scholar] [CrossRef]
- Ramos, P.A.B.; Santos, S.A.O.; Guerra, A.R.; Guerreiro, O.; Freire, C.S.R.; Rocha, S.M.; Duarte, M.F.; Silvestre, A.J.D. Phenolic composition and antioxidant activity of different morphological parts of Cynara cardunculus L. var. altilis (DC). Ind. Crops Prod. 2014, 61, 460–471. [Google Scholar] [CrossRef]
- Abu-Reidah, I.M.; Arraez-Roman, D.; Segura-Carretero, A.; Fernandez-Gutierrez, A. Extensive characterisation of bioactive phenolic constituents from globe artichoke (Cynara scolymus L) by HPLC-DAD-ESI-QTOF-MS. Food Chem. 2013, 141, 2269–2277. [Google Scholar] [CrossRef]
- Garbetta, A.; Capotorto, I.; Cardinali, A.; D’Antuono, I.; Linsalata, V.; Pizzi, F.; Minervini, F. Antioxidant activity induced by main polyphenols present in edible artichoke heads: Influence of in vitro gastro-intestinal digestion. J. Funct. Foods 2014, 10, 456–464. [Google Scholar] [CrossRef]
- Lutz, M.; Henriquez, C.; Escobar, M. Chemical composition and antioxidant properties of mature and baby artichokes (Cynara scolymus L.), raw and cooked. J. Food Compos. Anal. 2011, 24, 49–54. [Google Scholar] [CrossRef]
- Negro, D.; Montesano, V.; Grieco, S.; Crupi, P.; Sarli, G.; De Lisi, A.; Sonnante, G. Polyphenols compounds in artichoke plant tissues and varieties. J. Food Sci. 2012, 77, C244–C251. [Google Scholar] [CrossRef] [PubMed]
- Cifuentes-Cabezas, M.; Vincent-Vela, M.C.; Mendoza-Roca, J.A.; Álvarez-Blanco, S. Use of ultrafiltration ceramic membranes as a first step treatment for olive oil washing wastewater. Food Bioprod. Process. 2022, 135, 60–73. [Google Scholar] [CrossRef]
- Corbatón-Báguena, M.-J.; Álvarez-blanco, S.; Vincent-Vela, M.C. Cleaning of ultrafiltration membranes fouled with BSA by means of saline solutions. Sep. Purif. Technol. 2014, 125, 1–10. [Google Scholar] [CrossRef]
- Ruby Figueroa, R.A.; Cassano, A.; Drioli, E. Ultrafiltration of orange press liquor: Optimization for permeate flux and fouling index by response surface methodology. Sep. Purif. Technol. 2011, 80, 1–10. [Google Scholar] [CrossRef]
- Forestier, A.; Belguesmia, Y.; Krier, F.; Drider, D.; Dhulster, P.; Firdaous, L. Recovery of nisin from culture supernatants of Lactococcus lactis by ultrafiltration: Flux properties and separation efficiency. Food Bioprod. Process. 2022, 136, 196–210. [Google Scholar] [CrossRef]
- Esteves Costa, C.A.; Rodrigues Pinto, P.C.; Rodrigues, A.E. Lignin fractionation from E. Globulus kraft liquor by ultrafiltration in a three stage membrane sequence. Sep. Purif. Technol. 2018, 192, 140–151. [Google Scholar] [CrossRef]
Disclaimer/Publisher’s Note: The statements, opinions and data contained in all publications are solely those of the individual author(s) and contributor(s) and not of MDPI and/or the editor(s). MDPI and/or the editor(s) disclaim responsibility for any injury to people or property resulting from any ideas, methods, instructions or products referred to in the content. |
© 2023 by the authors. Licensee MDPI, Basel, Switzerland. This article is an open access article distributed under the terms and conditions of the Creative Commons Attribution (CC BY) license (https://creativecommons.org/licenses/by/4.0/).