Article

Diagnostic Strategies for Brain Doping in an Animal Model via Quantitative Analysis of Neurochemicals

1
Doping Control Center, Korea Institute of Science and Technology, Seoul 02792, Republic of Korea
2
Department of Microbiology and Immunology, Brain Korea 21 PLUS Project for Medical Science, Yonsei University College of Medicine, Seoul 03722, Republic of Korea
3
Department of Biotechnology, Yonsei University College of Life Science and Biotechnology, Seoul 03722, Republic of Korea
*
Author to whom correspondence should be addressed.
These authors contributed equally to this work.
Separations 2023, 10(7), 413; https://doi.org/10.3390/separations10070413
Submission received: 14 June 2023 / Revised: 12 July 2023 / Accepted: 18 July 2023 / Published: 19 July 2023
(This article belongs to the Section Bioanalysis/Clinical Analysis)

Abstract

:
Brain doping is a novel form of doping that involves stimulating specific brain regions to enhance sports performance. However, to the best of our knowledge, there is currently no established provision or detection method for it. As brain stimulation ultimately induces alterations in neurochemical concentrations, this study aimed to develop a diagnostic strategy for brain doping. We successfully developed and validated a sensitive simultaneous analysis method for 23 neurochemicals present in urine. Simple derivatization was employed to overcome ionization efficiency, enabling the effective detection of all the target compounds within 5 min. Additionally, we developed an animal model system using rats to replicate brain-doping scenarios and establish a diagnostic strategy. Behavior tests confirmed improved sports performance in the brain stimulation group. By examining changes in the distribution patterns of the target substances in urine samples, we observed that neurochemicals could be used as potential biomarkers for brain-doping diagnosis. The developed method allows the effective simultaneous analysis of multiple neurochemicals in biological samples and is expected to have various applications, including doping control. Thus, changes in the distribution pattern of neurochemicals could serve as a basis for brain-doping diagnosis.

1. Introduction

The use of external factors such as drugs to enhance sports performance is known as doping. Doping violates fair sportsmanship and harms athletes’ health. Thus, the World Anti-Doping Agency classifies substances whose use is prohibited and is leading a global joint movement for doping-free sports [1]. Despite these initiatives, illegal doping drugs are developed and distributed through the black market [2]. Therefore, a sophisticated anti-doping system is warranted as the current analysis method, which only monitors drugs on the prohibited list, has a loophole. Recently, brain doping, a new type of doping, has emerged, which enhances motor skills by stimulating specific areas of the brain using special equipment [3,4,5]. Brain doping maximizes exercise capacity by manipulating signaling systems or secreting neurochemicals and controls the brain to enable the highest extent of exercise possible [6,7,8]. Ski jumpers from the US Ski and Snowboard Association participated in a brain-doping experiment and the results revealed that the coordination and jumping force of the ski jumpers increased by 80% and 70%, respectively, following brain doping [5].
Transcranial direct-current stimulation (tDCS), a noninvasive form of nerve stimulation transmitted through electrodes to modulate cortical excitability and inhibition, is a representative approach to brain doping [9,10,11,12] and has been proposed as a treatment and rehabilitation approach for psychological disorders. Numerous studies have reported that tDCS can induce behavioral or neurophysiological changes in various cognitive and perceptual domains [13,14,15,16]. Representatively, symptoms such as motor disturbance and cognitive impairment are characteristic of Parkinson’s disease and, reportedly, tDCS can be used to enhance motor function [17,18]. Additionally, a study that applied tDCS to athletes or the public reported improvement in mobility, including increased endurance and systolic volume and decreased heart rate [19,20,21,22].
Brain impulses are closely related to neurotransmitters, which are groups of chemical messengers that generally allow communication between neurons in the neuronal synaptic cleft. Brain stimulation triggers depolarization to generate action potentials and potentiate N-methyl-D-aspartate receptor synapses [23,24]. A previous study regarding the neurotransmitter changes in tDCS reported that the neurotransmitter concentrations changed substantially when tDCS was induced in the motor cortex [25,26,27,28]. Awareness regarding the necessity and importance of research on analytical methods that can be used to comprehensively analyze neurochemical substances is continuously increasing as neurotransmitters are biological substances that can transmit responses in the brain, stimulating it.
Early neurochemical studies employed radioenzymatic assays and immunoassays; however, advances in chromatographic separation technology has replaced these techniques with a combination of absorption, fluorescence, and mass spectrometry (MS) detectors and chromatographic instruments [29]. The sample preparation process is relatively simple for liquid chromatography–MS (LC–MS), which is the most widely employed technique, and it is easy to examine trace amounts of substances with the outstanding sensitivity and selectivity of the MS detector [30]. However, it is challenging to separate neurochemicals containing polar substances because of their short retention time in reverse phase columns. Additionally, the ionization efficiency of MS is low because some neurochemicals contain an amino acid with amine-cation and carboxyl-anion groups [31]. Previous studies have used approaches such as performing additional derivatization steps or employing hydrophilic interaction chromatography (HILIC) columns to address this issue [32,33]. In studies using HILIC columns, the ionization efficiency in terms of sensitivity remained low despite the enhanced retention time [34,35]. The substances that react with the target compound require careful selection, and the efficiency of the entire analytical procedure should be considered for further derivatization. Among the reagents for the derivatization of neurochemicals, dansyl chloride or (5-N-succinimidoxy-5-oxopentyl)triphenylphosphonium bromide require high temperatures or a reaction time of >10 min [36,37,38,39]. Conversely, ethyl chloroformate (ECF) reacts rapidly at room temperature and in aqueous solutions, thus rendering it ideal for bio-sampling applications [40,41]. In addition, it was reported that using ECF leads to a low baseline and results in no contamination peaks during instrumental analysis compared with derivatization using N-methyl-bis(trifluoroacetamide) and heptafluorobutyric anhydride [42].
For several years, brain-doping-related cases have been increasing; however, it is impossible to determine whether doping has been attempted as, to the best of our knowledge, no official system has been established. Brain doping leads to a temporary performance improvement without effort, violating the spirit of sports [43,44]. Therefore, many researchers in fields related to doping contend that brain doping ought to be restricted in sports [4]. This study’s aim was to establish a practical brain-doping diagnosis method using analytical approaches. Herein, neurochemicals were analyzed, considering that brain doping, such as tDCS stimulation, ultimately induces changes in neurotransmitter distribution. Neurochemicals are biomaterials that primarily induce brain stimulation and show quantitative changes via signal amplification; hence, they are suitable as brain-doping biomarkers. However, they have analytical limitations owing to low stability and ionization efficiency. To overcome this, the derivatization of target neurochemicals was attempted to enhance the detection sensitivity and separation ability of the analytic technique.
Assuming a brain-doping situation, an in vivo animal model system was developed to identify neurochemical changes following brain stimulation. The primary motor cortex, which is important in planning and executing movements, was selected as the stimulation site [45,46]. The exercise performance induced by the brain stimulation was evaluated using a behavioral test before and after the stimulation. Urine, mainly used as a doping test sample and collected noninvasively, was selected as a biological sample for neurochemical analysis [47]. The samples collected from the animal model system were quantitatively analyzed for neurochemicals using the developed LC–MS method, and statistical analysis was performed. The direction of the developed brain-doping diagnosis system is presented based on the difference in the neurochemical distribution patterns according to the metabolic pathways.

2. Materials and Methods

2.1. Chemicals

Sigma-Aldrich (St Louis, MO, USA) provided tyrosine (Tyr), 3,4-dihydroxy-l-phenylalanine (L-DOPA), dopamine (DA), 3,4-dihydroxyphenyl glycol (DHPG), 3,4-dihydroxyphenylacetic acid (DOPAC), 3-methoxytyramine (3-MT), homovanillic acid (HVA), norepinephrine (NE), epinephrine (EP), normetanephrine (NMN), metanephrine (MN), 3-methoxy-4-hydroxyphenylglycol (MHPG), vanillylmandelic acid (VMA), tyramine (TA), octopamine (OA), kynurenine (Kyn), tryptophan (Trp), 5-hydroxytryptophan (5-HTP), serotonin (5-HT), 5-hydroxyindole-3-acetic acid (5-HIAA), glutamate (Glu), γ-aminobutyric acid (GABA), acetylcholine (ACh), 3,4-dihydroxybenzylamine (DHBA; used as internal standard), ammonium acetate, ethyl chloroformate, pyridine, and sigmatrix urine diluent. The deuterium-labeled d3-5-HTP, d4-DA, d2-GABA, d5-Glu, d6-NE, and d4-ACh employed as internal standard (ISTD) were obtained from CDN isotopes (Pointe-Claire, Quebec, Canada). High-performance liquid chromatography grade methanol, ethanol, acetic acid, acetonitrile, and methyl tert-butyl ether (MTBE) were purchased from JT Baker (Phillipsburg, NJ, USA). The deionized water used in this study was produced using Milli-Q water purification system (Millipore, Bedford, MA, USA).

2.2. Animals

The Institutional Animal Care and Use Committee of the Korea Institute of Science and Technology approved this study (IACUC KIST-2019-071). We obtained 36 7-week-old male Sprague Dawley rats from Orient Bio (Seongnam, Korea). All animals were housed under a relative humidity of 50 ± 5% at 22 ± 2 °C for a 12/12-h light/dark cycle. The temperature, humidity, and pressure in the animal room were managed using an automatic computer system. The animals were single housed in plastic cages with soft bedding materials and raised separately. The cages were distinguished by an identity card with the test number. The animals were provided radiation-sterilized feed purchased from LabDiet (St. Louis, MO, USA) and reverse-osmosis water. After receiving the rats, acclimatization and handling were performed for 6 days. The weight of the rats was individually measured every day, from the first day of training to the stimulation day, using a digital computing scale.

2.3. Animal Model Study

2.3.1. Experimental Design

A complete overview of the animal experiment is presented in Figure 1. The animal experiment comprised three main parts that were performed concurrently to reflect a brain-doping situation: (1) tDCS application; (2) behavior testing; and (3) urine sample collection. Behavior testing and urine sample collection were performed before and after tDCS, respectively. The test group was divided into three subgroups, including the control group (sham), based on the stimulation intensity, and the experimental subjects were randomly assigned. All the animal experiments, including stimulation, behavior testing, and urine sampling, were performed following the guidelines of the Research Animal Resource Center of the Korea Institute of Science and Technology.

2.3.2. tDCS Application

A safe level of single-session tDCS was applied to the primary motor cortex (M1) in accordance with rat safety assessment conditions [48]. As isoflurane has the potential to bind to the GABA Glu receptor, electrode holders for tDCS were attached to the rats 3 days before the stimulation. Anesthesia was induced in the rats via isoflurane inhalation (gas = 70 cc/min and air = 80 cc/min); while maintaining anesthesia, the hair on their scalp was shaved and an electrode holder was attached to the M1 site. On the day of the stimulation, tDCS was performed for 20 min with a pulse duration of 200 μs at 50 Hz and intensities of 0 (sham, n = 10), 0.1 (n = 10), and 0.2 (n = 10) mA using a stimulator from A-M SYSTEMS (Sequim, WA, USA). For anodal tDCS, the electrode to which conductive gel was applied was connected to a pre-attached electrode holder. For cathodal tDCS, an electrode rubber was inserted into the sponge pad, sprayed with saline, and fixed on the abdomen inside the jacket. Following tDCS stimulation, side effects such as seizures were monitored until the end of the behavioral test.

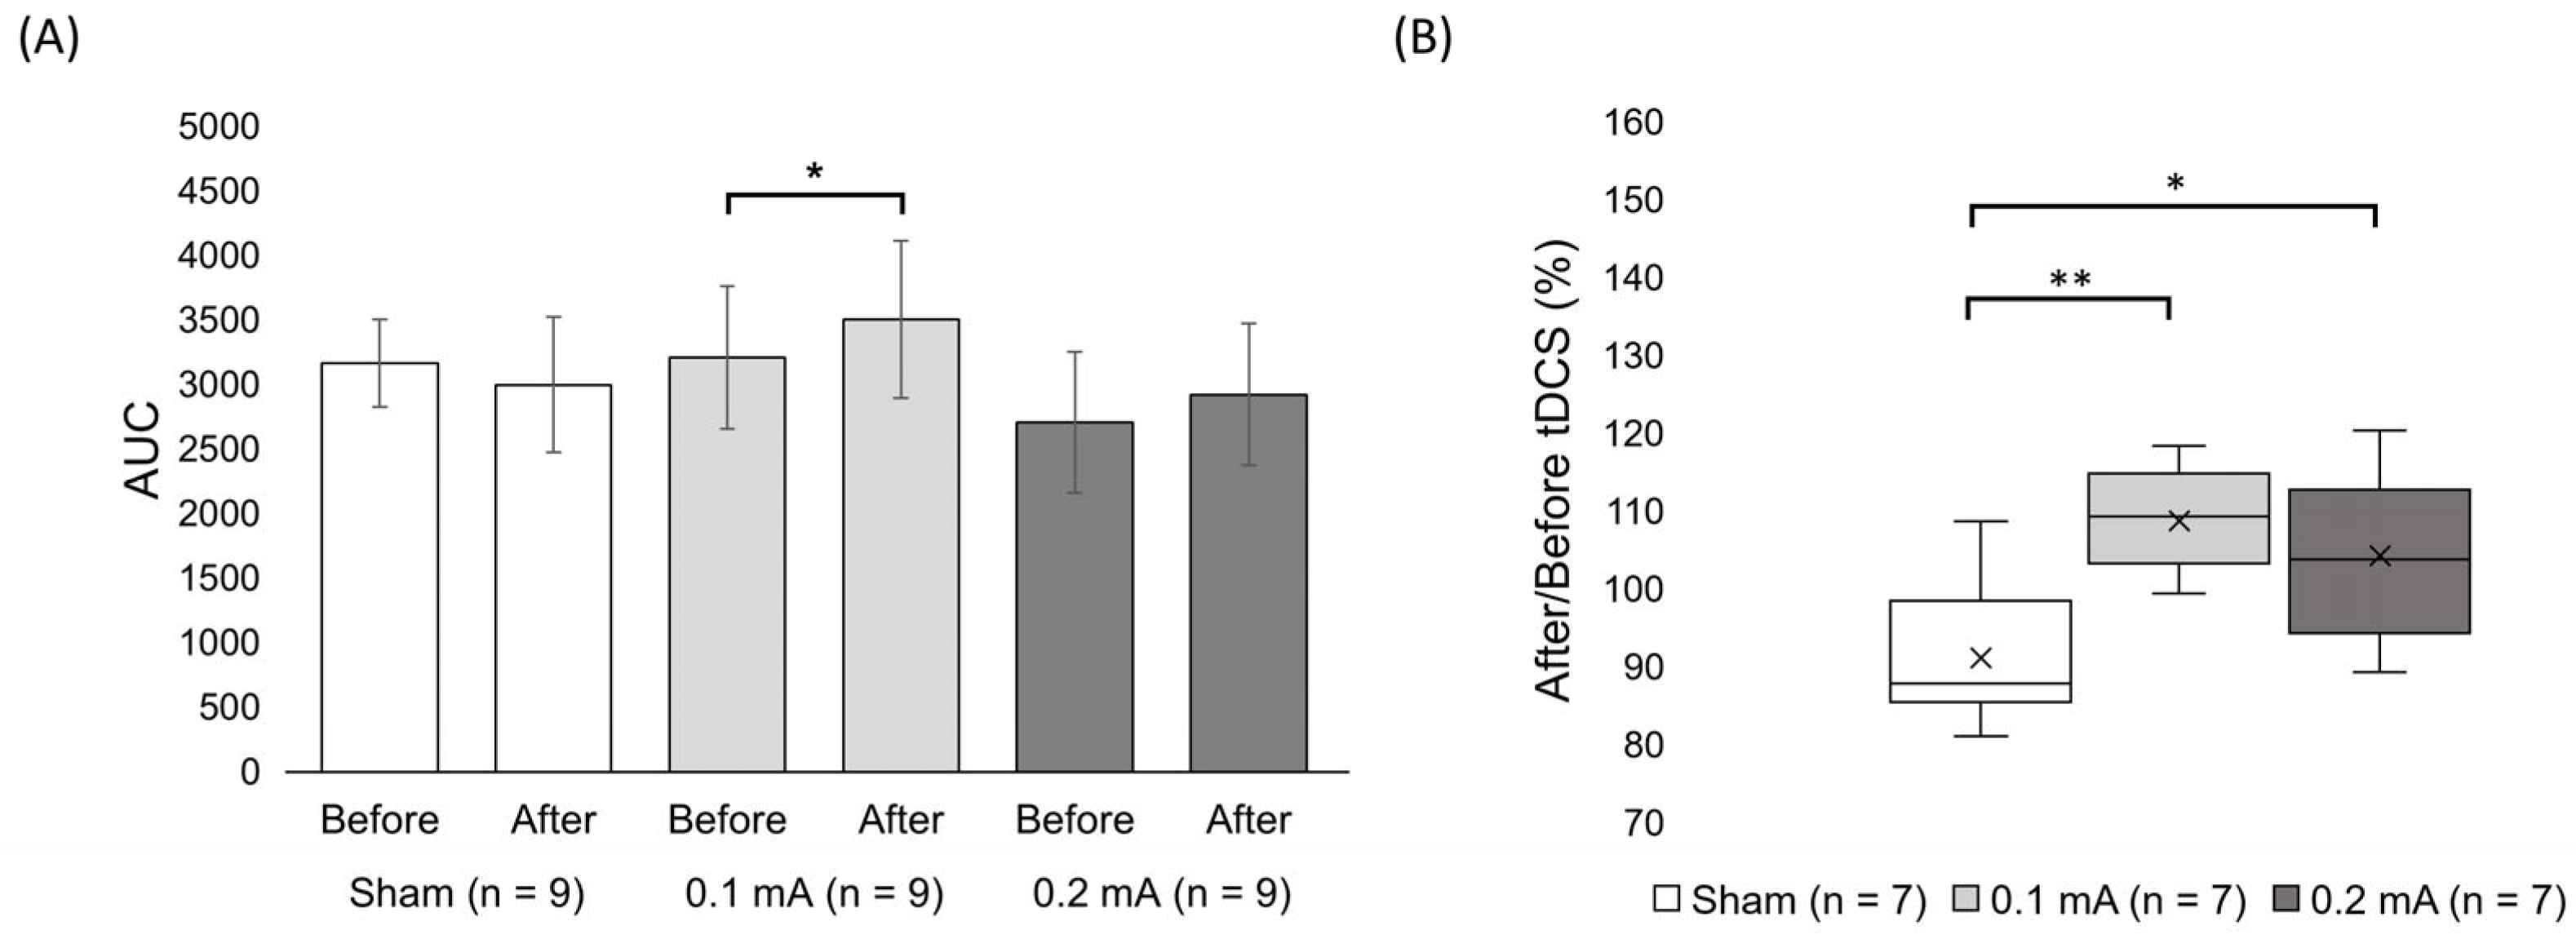
2.3.3. Behavior Test

The behavioral test evaluated sports performance, especially balance and endurance, using the rotarod treadmill (IITC Life Science, Los Angeles, CA, USA). Training sessions for the rotarod test were conducted twice a day for five days, with two trials per session before the stimulation day. Based on the training results, the rotarod test was started at 4 rpm, and the speed was gradually increased to 30 rpm within 300 s (Figure S1). On the day of the tDCS application, four rotarod tests were performed, two before stimulation and two after stimulation, at 30-min intervals. The latency to fall from the equipment was recorded to evaluate the sports performance.

2.3.4. Urine Sample Collection

For neurochemical analysis, biological samples were collected from the animal model system. The urine sampling time was determined according to a previous study, and the neurotransmitter concentrations in the urine were measured following oral and injection administration to the rats [49]. After electrode attachment, the rats were transferred to their respective metabolic cages for individual urine sampling. From Days 13 to 14 of the experimental schedule, the urine samples were collected before tDCS and at 2, 16, and 24 h after tDCS. The collected urine samples were prepared according to the method developed in Section 2.4 and subjected to LC–MS/MS analysis.

2.4. Analytical Method Development

2.4.1. Target Substances and Standard Solutions

The focus in selecting target analytes was on neurotransmitters and their metabolites, which reportedly change or have the potential to be altered via brain stimulation [25,26,27,28,50,51,52,53]. Herein, 23 neurochemicals were analyzed, including catecholamines, tryptophan metabolites, Glu, GABA, and ACh. The overall target neurochemicals and metabolic processes of each substance are illustrated in Figure S2. Each standard and the internal standard compound was dissolved in methanol to prepare a stock solution of 1000 μg/mL; however, L-DOPA, Tyr, and Glu were dissolved using 0.1% formic acid and diluted in methanol to prepare 100 μg/mL. Owing to a difference in the detection sensitivity, the target substances were divided into four groups (A–D) as follows: (A) 3MT, 5HIAA, 5HTP, DA, L-DOPA, and TA; (B) 5HT, DOPAC, DHPG, EP, HVA, Kyn, MN, Tyr, and VMA; (C) GABA, Glu, MHPG, NE, NMN, OA, and Trp; and (D) ACh. To obtain a working solution at several levels just before analysis, stock solutions in the same group were mixed with 0.01% acetic acid and 1 mM ammonium acetate and further diluted.

2.4.2. Sample Preparation

Sample preparation was divided into two primary steps. The first was the process of substituting the structure of a substance via derivatization (Figure S3), and the second was the process of liquid–liquid extraction (LLE) and concentration of the substituted substance injected into the device. Each sample (500 µL) was prepared via appropriate dilution using 0.01% acetic acid and 1 mM ammonium acetate and spiked with 10 µL of the ISTD solution (500 ng/mL). We added 200 µL of a 4:1 solution of ethanol and pyridine and 20 µL of ECF to the sample for derivatization. For ECF, the derivatization reaction was completed within 5 min at room temperature, following which 2 mL of MTBE was added as an extraction solvent and the mixtures were vortexed for 1 min. Then, to separate the solvent and aqueous layer, the mixture was centrifuged at 2500 rpm for 5 min and stored at −35 °C for 2 min. The supernatant was transferred to another tube and evaporated under nitrogen gas. The dried residue was reconstituted in 200 µL of the mobile phase mixture (50% A/50% B, v/v) for LC–MS analysis. Substances that were not derivatized were remained in the aqueous layer, and 200 μL of the aqueous layer was transferred to the vial for analysis.

2.4.3. LC–MS/MS Analysis

LC–MS/MS was performed using the TSQ Altis™ triple quadrupole mass spectrometer from Thermo Scientific coupled with the Thermo Scientific Vanquish™ UHPLC system (Thermo Scientific, San Jose, CA, USA). Chromatographic separation was performed using a Kinetex C18 column (100 mm × 2.1 mm, 2.6 μm; Phenomenex, Torrance, CA, USA) at 35 °C. The mobile phase A comprised water containing 0.01% acetic acid and 1 mM ammonium acetate, and B comprised acetonitrile. Gradient conditions were implemented as follows: the initial composition (5% mobile phase B) for 0.5 min, 5–50% in 0.5 min, maintaining at 50% for 2 min, 50–95% over 0.5 min, holding at 95% for 0.5 min and re-equilibration at 5% for 1 min. The total run time was 5 min and the flow rate was 0.5 mL/min. An electrospray ionization (ESI) source was employed and spray voltage was 4.5 kV in the positive mode. The sheath, auxiliary, and sweep gas flow rates were 50, 15, and 2 (arbitrary units), respectively. The capillary and vaporizer temperatures were 320 °C and 330 °C, respectively. The multiple reaction monitoring (MRM) mode was used for the quantification analysis, and collision energy (CE) was optimized for individual analytes by direct infusion into the ESI source. The ion adduct for detection in analytes was determined as the dominant type of ionization between [M + H]+ and [M + NH4]+. All data were obtained using Xcalibur™ (Thermo Scientific, San Jose, CA, USA), and data processing for quantification was performed using TraceFinder™ (Thermo Scientific, San Jose, CA, USA).

2.4.4. Method Validation

A validation process was performed considering selectivity, linearity, limit of detection (LOD), limit of quantification (LOQ), intraday and interday precision, and the matrix effect to verify the developed procedure. For the calibration curve, blank matrix samples were spiked with standard working solutions for each level and processed with a sample preparation step. To evaluate the selectivity, the samples spiked with substances (positive control) and those not spiked (negative control) were prepared and examined. Linearity on the calibration curve was validated through the coefficient of determination (R2) acquired by six or more points of concentration for each substance. The LOD and LOQ were determined with the lowest concentration as the signal-to-noise (S/N) ratio of >3 and >10, respectively. The intraday (n = 5) and interday (n = 3) accuracy and precision were evaluated by analyzing five replicated quality control samples prepared within the calibration range. The results of precision were determined as the relative standard deviation (%RSD) between responses in the replicate samples. The matrix effect was evaluated by comparing the net increased response in the urine matrix after spiking standard solutions with that of the blank matrix. Purchased synthetic blank urine was employed for the urine matrix.

2.5. Statistical Analysis

The behavioral test and quantitative analysis results of neurochemicals were subjected to data processing and statistical analysis to determine significant differences between the test groups. An analysis of variance (ANOVA) test alongside a post hoc test using Tukey’s honestly significant difference test were performed for behavioral evaluation. To analyze the changes in the patterns of neurotransmitter distribution, statistical processing was conducted using principal component analysis (PCA), a method for chemometrics analysis, via Metaboanalyst 5.0. The data file for PCA employed the results obtained from the quantitative analysis of the neurochemicals. The quantities of the substances were subjected to data scaling: mean-centered and divided by the standard deviation of each variable. Variable principal components were created to reduce the dimensionality of the urine sample values. A two-dimensional (2D) score plot developed using PC1 and PC2 was visualized to determine the stimulation-dependent changes in the quantity and distribution of the target substances.

3. Results and Discussion

3.1. Behavior Test

After a single-session tDCS in the M1 area, an improvement in sports performance of the rats was confirmed via the rotarod test. No severe side effects were detected following the tDCS until the end of behavioral testing. The duration of exercise on the rotarod treadmill was recorded on the stimulation day (Table S1). Given that the rotational speed increases over time, the performance evaluation factor was the area under the rotarod speed curve (Figure S1). Although the rotarod is a device for assessing forced exercise, evaluating sports performance in rats that have learned to fall off the bar during training is not possible. Thus, the subjects whose records showed a latency to fall within 30 s were excluded from the performance evaluation.
When comparing the average values of sports performance based on stimulation between the groups, the sports performance improved by 9.33% and 7.98% in the 0.1 and 0.2 mA groups following stimulation, respectively; however, in the sham group, the sports performance decreased by 5.25% after stimulation (Figure 2A). A paired t-test was conducted with the performance results before and after stimulation within each group, and a considerable difference was found only in the 0.1-mA group. As the test subjects were randomly assigned to the groups without considering the level of sports performance, a substantial variation was observed in the within-group evaluation factor. Therefore, we conducted an ANOVA on the ratio of the sports performance change before and after the stimulation (Figure 2B), the results of which confirmed a statistical significance of variance among the three groups. Using a post hoc test, we identified that significant results were derived between the sham and stimulation groups. No significant differences were observed between the stimulation groups. Compared with that of previous studies using tDCS, a similar result of increased motor ability was obtained with only a single stimulation of the primary motor cortex [54,55]. Considering that the sports performance improved substantially only in the stimulation group, a brain-doping situation was induced by stimulation in our animal model system.

3.2. Sample Preparation

Herein, the sample preparation procedure that was developed comprises derivatization and an LLE process. ECF, which has a fast reaction time at room temperature and can react with hydroxyl and amino groups, was used as a derivatization material for neurochemicals. The optimal volume of the reagent required for derivatization was determined. For ECF, the initial volume was 10 µL, which gradually increased without any significant difference in derivatization efficiency above 20 µL. Ethanol and pyridine were mixed in a 4:1 ratio, and we found that 200 µL of the mixture was sufficient for a stable derivatization reaction. Derivatization employing ECF is performed in an aqueous condition and, as it is a simultaneous analysis, an aqueous buffer for derivatization was searched to obtain sufficient overall sensitivity for entire target compounds. The overall detection intensity was most stable in the condition between pH 4 and 5 by comparing the analysis results according to the pH level of the buffer solution (Figure S4A). A weak acidic buffer containing acetic acid and ammonium acetate was selected as the derivatization solution to obtain a sufficient yield of derivatization considering positive ion formation during the ionization process. The analyses were performed employing reaction times of 5, 10, and 30 min to measure the yield of derivatization according to the reaction time. There was no significant difference at 5, 10, and 30 min, and the reaction time was minimized to 5 min. To extract the derivatized analytes with LLE, various organic solvents such as ether, hexane, ethyl acetate, and MTBE were compared to determine the solvent layer. Thus, it was observed that MTBE provided sufficient extraction efficiency and stable reproducibility for the derivatized substances (Figure S4B), and nonderivatized compounds such as ACh and d4-ACh were present in the aqueous solution layer.

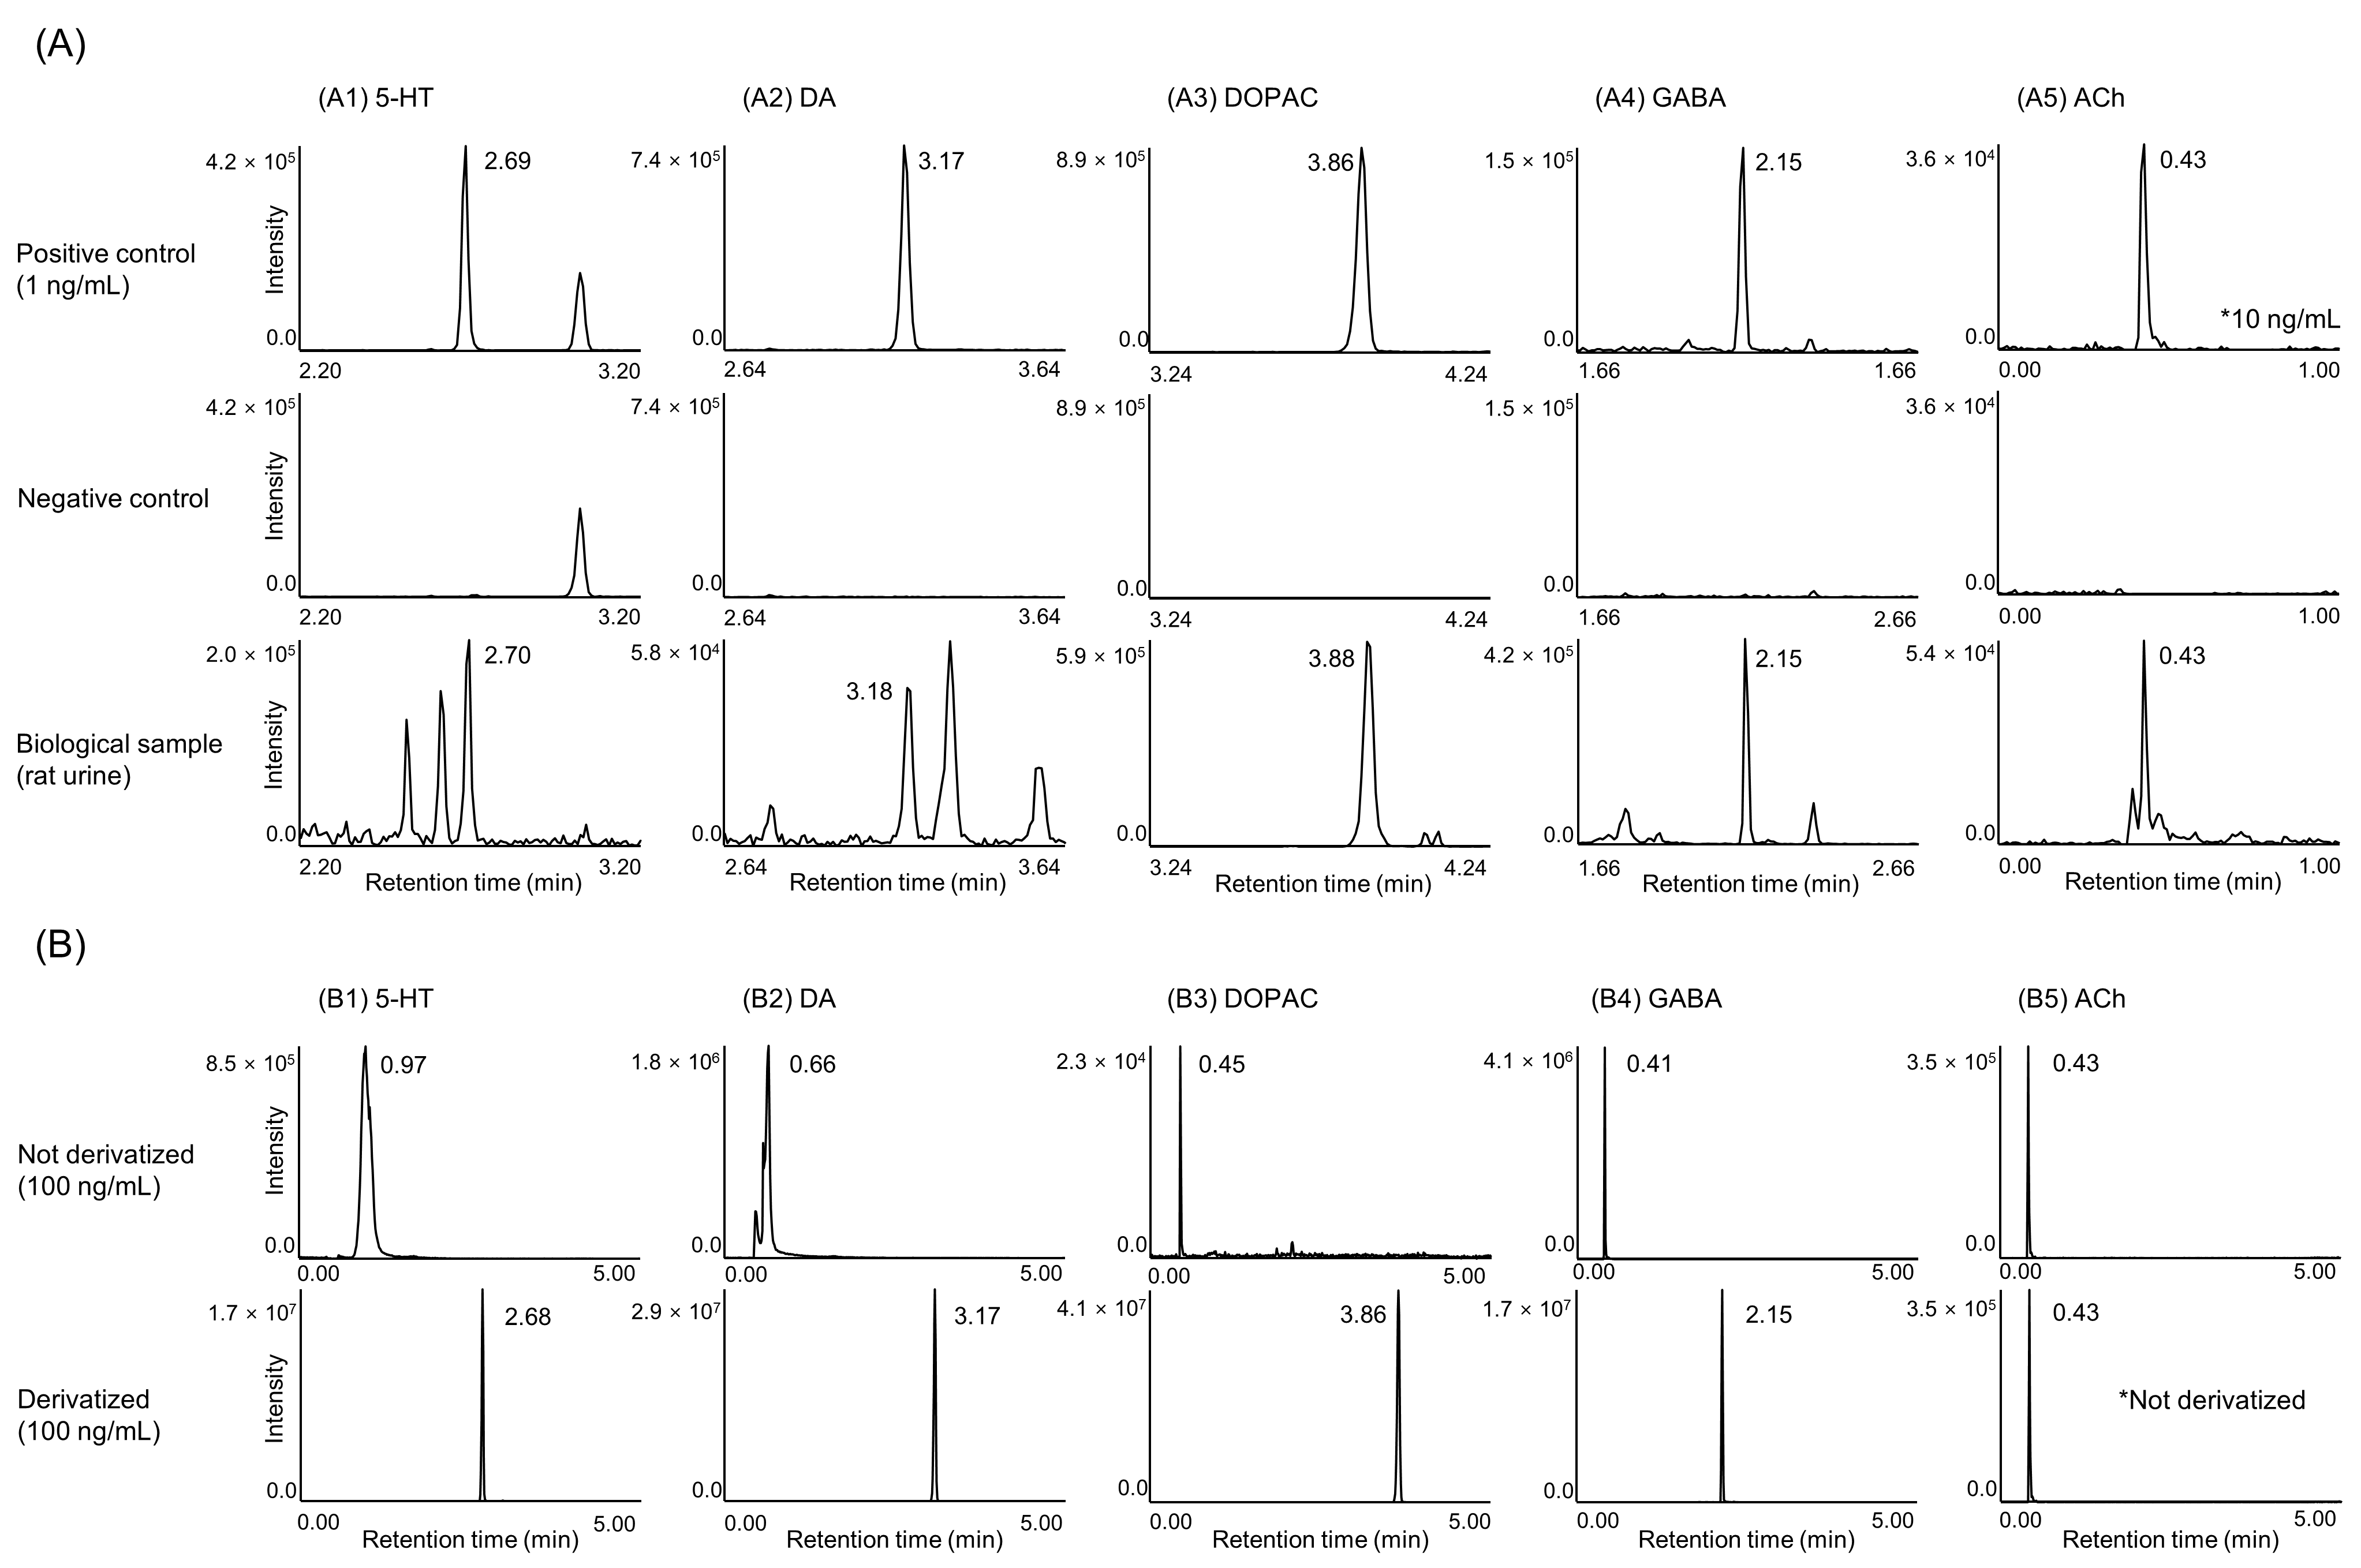
3.3. LC–MS/MS Analysis

For each compound, a standard solution for sample preparation, including derivatization, was directly injected into a mass spectrometer to obtain the m/z of the precursor ion for the derivatized structure, optimal CE, and m/z of the dominant product ion (Table S2). The adduct generated during ionization was selected as the predominant adduct between [M + H]+ and [M + NH4]+ for each material. ACh, which has a structure that does not react with ECF, was observed in the [M]+ form because of its overall net charge of +1. Chromatograms and retention time for each material were acquired through simultaneous LC–MS/MS analysis based on the MRM transitions of the optimization process (Figure 3A and Figure S5).
Within 5 min, the gradient of the mobile phase was adjusted to all the eluted analytes, and all the target substances were independently detected without interference from other materials. The intensity of the neurochemicals increased by more than four times as the quantity of the standard product was measured before and after derivatization under the same analytical conditions. As the retention time in the reversed-phase column and ionization efficiency was increased via derivatization, the analytical sensitivity and selectivity were significantly enhanced (Figure 3B). This method increased the detection limit and reduced the analysis time compared with the conventional LC–MS methods using ECF [40,41]. The increase in detection sensitivity was accompanied by a reduction in the matrix effect by minimizing the amount of biospecimen used for neurochemical detection. In addition, this increased the applicability of the method by including various metabolites of neurotransmitters in the target analytes.

3.4. Method Validation

Table 1 and Table S3 present a summary of the validation results. To examine the selectivity of the developed method, no interference peaks were acquired from the control samples that were not spiked compared with the spiked control samples (Figure 3A and Figure S5). Linear regression analysis was performed and in all cases, the R2 value was >0.995. Table S3 shows the equation and calibration range for each analyte. To measure LOD and LOQ, the working solution was serially diluted up to 10,000-fold and the S/N and %CV values were computed (Table 1). The LOD range was determined to be 2 pg/mL–2 ng/mL and the LOQ range to be 10 pg/mL–10 ng/mL. Three different concentrations of the quality control samples were used for intraday and interday accuracy and precision analysis. The intraday accuracies were 92.1–106.9%, whereas those of interday were 89.6–111.1%. The precision range was evaluated as %RSD value, which was 0.84–13.71% in intraday and 1.87–14.3% in interday, both of which were within 15% for all cases. The matrix effect was observed as 62.7–113.3% in urine.

3.5. Analysis of Neurochemicals

3.5.1. Neurochemicals

The results of neurochemical concentrations in the urine samples using the developed LC–MS/MS method are summarized in Table S4 using the mean and standard deviation at each time point. In the animal model system, it was confirmed that the concentration of neurochemicals, including DA and NE, increased with stimulation and exercise (Figure S6). These results are similar to those of previous studies that observed changes in neurotransmitter distribution in rats following exercise and stimulation [56,57,58]. In particular, changes in neurochemical concentrations were the most prominent in samples obtained in 2 h following stimulation, as in previous studies that observed changes in neurotransmitter concentrations in urine [49]. Therefore, we compared differences in neurochemical distribution between groups in samples collected within 2 h of stimulation. We performed statistical analyses, including ANOVA, on the results of the neurochemical concentrations and observed significant differences between the groups for some substances, although the interindividual variation was considerable (Figure S7). However, a difference was observed in the change of neurochemical distribution between the sham and stimulation groups, thus indicating that brain stimulation affected the regulation of neurochemical secretion.
We conducted a detailed examination of changes in the metabolome of catecholamines, especially DA. The urinary concentrations of neurochemicals in the stimulation group exhibited large increases in EP, MHPG, NE, NMN, and VMA, while exhibiting small increases or decreases in 3-MT and DOPAC compared with the sham group (Figure S7). DA is metabolized by two main pathways depending on the enzyme involved. DA is converted to NE by dopamine β-hydroxylase (DBH), forming metabolites such as EP and VMA. Monoamine oxidase and catechol-O-methyltransferase convert DA to 3-MT, DOPAC, and HVA. In the stimulation group, a relative increase was observed in the conversion of DA to NE and EP, while in the sham group, the conversion of DA to 3-MT or DOPAC was relatively high. In addition to reports that tDCS induced NE release in the cortex [59,60], these significant changes in DA metabolites support that tDCS enhances the activity of the NE metabolic pathway system.

3.5.2. Substance-to-Substance Ratios

We compared the ratios based on distinct catecholamine metabolic pathways that exhibited differences between the groups as a potential strategy for diagnosing brain doping. As there are individual differences in neurochemical secretion, the differences between tests of the groups were compared using the substance-to-substance ratios to minimize the variations. The clinical application of neurochemicals ratios has been well established; for example, the HVA/VMA ratio, an indicator of DBH activation, has been used for diagnosing and monitoring conditions such as neuroblastoma and Menkes disease [61,62].
When comparing the differences in ratios between the groups, statistically significant differences were observed in three substance-to-substance ratios at 2 h following stimulation (Figure 4). Compared with the sham group, EP/NE increased significantly and 3-MT/VMA and DOPAC/MHPG decreased significantly in the stimulated group. Among these, the ratios 3-MT/VMA and DOPAC/MHPG represent the relationship between products from different dopamine metabolism pathways, similar to HVA/VMA. In addition, these ratios indirectly indicate DBH activation. The decrease observed in the 3-MT/VMA and DOPAC/MHPG ratios suggests an increase in DBH activity following stimulation. In addition, the EP/NE ratio may indirectly indicate phenylethanolamine N-methyltransferase (PNMT) activation, and its increase following stimulation suggests increased PNMT activity. These alterations in substance-to-substance ratios suggest that tDCS has a potential impact on DBH and PNMT activity. Herein, we proposed a strategy to diagnose brain stimulation by measuring the 3-MT/VMA, DOPAC/MHPG, and EP/NE ratios of the neurochemicals.

3.5.3. Application to PCA

Statistical analysis was performed by conducting a PCA of three substance-to-substance ratios that were significantly different between the groups: 3-MT/VMA, DOPAC/MHPG, and EP/NE (Figure 5). We observed that these ratios clearly distinguished between the sham and stimulus groups only for the 2 h post stimulus sample. This distribution pattern 2 h after the stimulation suggests that stimulus-induced changes occurred distinctly from exercise-induced changes in the secretion of six neurochemicals. The study confirmed the diagnostic potential of brain doping by applying neurochemical ratios to the samples 2 h following stimulation.
As this study only conducted a single stimulation session, the proposed diagnostic strategy may be time limited. Therefore, when referring to a previous report regarding longer-lasting excitatory effects with repeated tDCS [63], further research is warranted to secure a diagnostic method for brain doping by assessing long-term markers using repeated stimuli.

3.5.4. Correlation between Sports Performance and Neurochemicals

As the changes in EP, NE, and other catecholamines occurred following tDCS and improvements in exercise performance, tDCS appears to affect the autonomic nervous system, particularly the sympathetic nerves [64,65,66]. Numerous studies have explored the relationship between catecholamine secretion, including DA, and athletic performance [67]. Catecholamines activate the sympathetic nervous system and increase the circulating blood volume by increasing heart rate and myocardial contractility. In addition, they increase blood glucose levels, allowing for increased energy storage and endurance. Although the action mechanism underlying tDCS is not fully understood, catecholamine activation may partially account for the improved exercise performance observed following tDCS in this study. Furthermore, the conversion ratio of NE to EP was further increased in the stimulated group, indicating the increased activity of PNMT. Previous reports have shown that PNMT inhibition in rats reduces exercise capacity [68], suggesting that PNMT activity has also influenced exercise capacity in our study. However, owing to the presence of external factors that may affect the evaluation of neurochemicals, such as physical activity and psychological impact, it is not possible to attribute the increase in catecholamines to tDCS conclusively.
While this study identified increased sports performance and neurochemical changes induced by brain stimulation, it could not determine the methods of their regulation. Hence, further investigation is required to explore the underlying mechanism behind the observed neurochemical changes in this study for the diagnosis of brain doping. In addition, based on the results of this study, clinical research is warranted to determine applications in the field of doping.

4. Conclusions

This study was conducted with the aim of developing a diagnostic method for brain doping by examining the comprehensive patterns of neurochemical changes. Brain stimulation can induce changes in the concentration of neurochemicals. Herein, a simultaneous quantitative analysis targeting neurochemicals in urine samples was developed and validated. Thereafter, an animal model system was developed to represent brain doping, followed by an investigation to understand the correlations between stimuli and neurochemicals. The developed analytical method enhanced the LOD level compared with that by conventional methods, and it was possible to simultaneously profile 23 neurochemicals accurately and rapidly. In the animal model system, we confirmed the enhancement of exercise performance and observed changes in neurochemical distribution depending on the stimulation. In particular, we identified the stimulus-specific changes in catecholamines in the urine samples collected within 2 h of stimulation. This is a first step toward developing a diagnostic system for brain doping. Based on the findings of this study, further investigation will be performed using clinical trials to determine changes in specific neurochemicals via brain stimulation. Furthermore, these results are expected to be used in various fields, including basic neuroscience, clinical studies, and brain doping.

5. Patents

  • Simultaneous analysis method of neurotransmitters and metabolites from the same using derivatization, Korea, 10-2340107 (December 2021).

Supplementary Materials

The following supporting information can be downloaded at: https://www.mdpi.com/article/10.3390/separations10070413/s1. Figure S1: Conditions for behavioral testing using a rotarod. Figure S2: Metabolic pathways and chemical structures of the target neurochemicals used in this study. Figure S3: Derivatization reaction scheme for ethyl chloroformate with target substances. Table S1: Latency to fall in the rotarod test for an animal model system. Figure S4: Optimization results of (A) pH conditions and (B) extraction solvent in the sample preparation step. Table S2: MRM conditions for the detection of derivatized target compounds. Figure S5: Chromatograms of 23 target compounds (A1-23) and 7 internal standards (B1-7) obtained by applying the developed method. Table S3: Regression equation and linearity (R2) of neurochemicals for intraday calibration. Table S4: Determination of target neurochemical concentrations in an animal model system. Figure S6: Changes in neurochemical concentrations in urine samples collected over time in the stimulation group. Figure S7: Differences in neurochemical concentrations between groups in samples collected 2 h after stimulation.

Author Contributions

Conceptualization, Y.C., S.J. (Seongeun Jeon) and J.S.; formal analysis, Y.C., S.J. (Seongeun Jeon) and Y.L.; investigation Y.C., S.J. (Seongeun Jeon), Y.L. and H.P.; methodology Y.C., S.J. (Seongeun Jeon), Y.L., H.P. and J.S.; project administration, S.S.Y. and J.S.; resources, Y.X., M.J., S.J. (Sunmi Jung), M.K., A.C. and J.S.; supervision, S.S.Y. and J.S.; validation, Y.C. and S.J. (Seongeun Jeon); writing—original draft, Y.C. and S.J. (Seongeun Jeon); writing—review and editing, Y.C., S.J. (Seongeun Jeon), S.S.Y. and J.S. All authors have read and agreed to the published version of the manuscript.

Funding

This research was funded by the Korea Institute of Science and Technology, grant number 2V06980, 2V08190, and 2V09040.

Institutional Review Board Statement

The Institutional Animal Care and Use Committee of the Korea Institute of Science and Technology approved this study (IACUC KIST-2019-071).

Data Availability Statement

The data presented in this study are available on request from the corresponding author.

Acknowledgments

This work was supported by the Korea Institute of Science and Technology. We would also like to thank June-Seek Choi and Kyeong Im Jo of Korea University for assistance with the animal behavioral tests.

Conflicts of Interest

The authors declare no conflict of interest.

References

  1. World Anti-Doping Agency. World Anti-Doping Code; World Anti-Doping Agency: Montreal, QC, Canada, 2021. [Google Scholar]
  2. Krug, O.; Thomas, A.; Walpurgis, K.; Piper, T.; Sigmund, G.; Schänzer, W.; Laussmann, T.; Thevis, M. Identification of black market products and potential doping agents in Germany 2010–2013. Eur. J. Clin. Pharmacol. 2014, 70, 1303–1311. [Google Scholar] [CrossRef]
  3. Davis, N.J. Neurodoping: Brain stimulation as a performance-enhancing measure. Sports Med. 2013, 43, 649–653. [Google Scholar] [CrossRef] [PubMed]
  4. Pugh, J.; Pugh, C. Neurostimulation, doping, and the spirit of sport. Neuroethics 2021, 14 (Suppl. S2), 141–158. [Google Scholar] [CrossRef] [PubMed]
  5. Reardon, S. “Brain doping” may improve athletes’ performance. Nature 2016, 531, 283–284. [Google Scholar] [CrossRef] [PubMed] [Green Version]
  6. Noakes, T.D. Time to move beyond a brainless exercise physiology: The evidence for complex regulation of human exercise performance. Appl. Physiol. Nutr. Metab. 2011, 36, 23–35. [Google Scholar] [CrossRef] [PubMed]
  7. Noakes, T.D. Fatigue is a brain-derived emotion that regulates the exercise behavior to ensure the protection of whole body homeostasis. Front. Physiol. 2012, 3, 82. [Google Scholar] [CrossRef] [Green Version]
  8. Goodall, S.; Howatson, G.; Romer, L.; Ross, E. Transcranial magnetic stimulation in sport science: A commentary. Eur. J. Sport. Sci. 2014, 14 (Suppl. S1), S332–S340. [Google Scholar] [CrossRef] [Green Version]
  9. Angius, L.; Hopker, J.; Mauger, A.R. The ergogenic effects of transcranial direct current stimulation on exercise performance. Front. Physiol. 2017, 8, 90. [Google Scholar] [CrossRef] [Green Version]
  10. Liebetanz, D.; Nitsche, M.A.; Tergau, F.; Paulus, W. Pharmacological approach to the mechanisms of transcranial DC-stimulation-induced after-effects of human motor cortex excitability. Brain 2002, 125, 2238–2247. [Google Scholar] [CrossRef] [Green Version]
  11. Flöel, A. tDCS-enhanced motor and cognitive function in neurological diseases. Neuroimage 2014, 85, 934–947. [Google Scholar] [CrossRef]
  12. Nitsche, M.A.; Cohen, L.G.; Wassermann, E.M.; Priori, A.; Lang, N.; Antal, A.; Paulus, W.; Hummel, F.; Boggio, P.S.; Fregni, F.; et al. Transcranial direct current stimulation: State of the art 2008. Brain Stimul. 2008, 1, 206–223. [Google Scholar] [CrossRef] [PubMed]
  13. Kim, Y.J.; Ku, J.; Kim, H.J.; Im, D.J.; Lee, H.S.; Han, K.A.; Kang, Y.J. Randomized, sham controlled trial of transcranial direct current stimulation for painful diabetic polyneuropathy. Ann. Rehabil. Med. 2013, 37, 766–776. [Google Scholar] [CrossRef] [PubMed]
  14. Chang, M.C.; Kim, D.Y.; Park, D.H. Enhancement of cortical excitability and lower limb motor function in patients with stroke by transcranial direct current stimulation. Brain Stimul. 2015, 8, 561–566. [Google Scholar] [CrossRef] [PubMed]
  15. Angelakis, E.; Liouta, E.; Andreadis, N.; Korfias, S.; Ktonas, P.; Stranjalis, G.; Sakas, D.E. Transcranial direct current stimulation effects in disorders of consciousness. Arch. Phys. Med. Rehabil. 2014, 95, 283–289. [Google Scholar] [CrossRef]
  16. Floel, A.; Cohen, L.G. Recovery of function in humans: Cortical stimulation and pharmacological treatments after stroke. Neurobiol. Dis. 2010, 37, 243–251. [Google Scholar] [CrossRef] [Green Version]
  17. Benninger, D.H.; Hallett, M. Non-invasive brain stimulation for Parkinson’s disease: Current concepts and outlook 2015. NeuroRehabilitation 2015, 37, 11–24. [Google Scholar] [CrossRef]
  18. Costa-Ribeiro, A.; Maux, A.; Bosford, T.; Aoki, Y.; Castro, R.; Baltar, A.; Shirahige, L.; Moura Filho, A.; Nitsche, M.A.; Monte-Silva, K. Transcranial direct current stimulation associated with gait training in Parkinson’s disease: A pilot randomized clinical trial. Dev. Neurorehabil. 2017, 20, 121–128. [Google Scholar] [CrossRef]
  19. Okano, A.H.; Fontes, E.B.; Montenegro, R.A.; Farinatti, T.; Cyrino, E.S.; Li, L.M.; Bikson, M.; Noakes, T.D. Brain stimulation modulates the autonomic nervous system, rating of perceived exertion and performance during maximal exercise. Br. J. Sports Med. 2015, 49, 1213–1218. [Google Scholar] [CrossRef] [Green Version]
  20. Vitor-Costa, M.; Okuno, N.M.; Bortolotti, H.; Bertollo, M.; Boggio, P.S.; Fregni, F.; Altimari, L.R. Improving cycling performance: Transcranial direct current stimulation increases time to exhaustion in cycling. PLoS ONE 2015, 10, e0144916. [Google Scholar] [CrossRef]
  21. Park, S.B.; Sung, D.J.; Kim, B.; Kim, S.; Han, J.K. Transcranial direct current stimulation of motor cortex enhances running performance. PLoS ONE 2019, 14, e0211902. [Google Scholar] [CrossRef] [Green Version]
  22. Yang, D.-J.; Uhm, Y.H. The Effects of Transcranial Direct Current Stimulation Combined High Intensity Interval Training on Aerobic Exercise Capacity of the Soccer Player. J. Korean Soc. Integr. Med. 2021, 9, 105–117. [Google Scholar]
  23. Priori, A.; Berardelli, A.; Rona, S.; Accornero, N.; Manfredi, M. Polarization of the human motor cortex through the scalp. NeuroReport 1998, 9, 2257–2260. [Google Scholar] [CrossRef] [PubMed]
  24. Stagg, C.J.; Jayaram, G.; Pastor, D.; Kincses, Z.T.; Matthews, P.M.; Johansen-Berg, H. Polarity and timing-dependent effects of transcranial direct current stimulation in explicit motor learning. Neuropsychologia 2011, 49, 800–804. [Google Scholar] [CrossRef] [PubMed] [Green Version]
  25. Stagg, C.J.; Best, J.G.; Stephenson, M.C.; O’Shea, J.; Wylezinska, M.; Kincses, Z.T.; Morris, P.G.; Matthews, P.M.; Johansen-Berg, H. Polarity-sensitive modulation of cortical neurotransmitters by transcranial stimulation. J. Neurosci. 2009, 29, 5202–5206. [Google Scholar] [CrossRef] [PubMed] [Green Version]
  26. Heimrath, K.; Brechmann, A.; Blobel-Lüer, R.; Stadler, J.; Budinger, E.; Zaehle, T. Transcranial direct current stimulation (tDCS) over the auditory cortex modulates GABA and glutamate: A 7 T MR-spectroscopy study. Sci. Rep. 2020, 10, 20111. [Google Scholar] [CrossRef] [PubMed]
  27. Alvarez-Alvarado, S.; Boutzoukas, E.M.; Kraft, J.N.; O’Shea, A.; Indahlastari, A.; Albizu, A.; Nissim, N.R.; Evangelista, N.D.; Cohen, R.; Porges, E.C.; et al. Impact of transcranial direct current stimulation and cognitive training on frontal lobe neurotransmitter concentrations. Front. Aging Neurosci. 2021, 13, 761348. [Google Scholar] [CrossRef]
  28. Yamada, Y.; Sumiyoshi, T. Neurobiological mechanisms of transcranial direct current stimulation for psychiatric disorders; neurophysiological, chemical, and anatomical considerations. Front. Hum. Neurosci. 2021, 15, 631838. [Google Scholar] [CrossRef]
  29. Peaston, R.T.; Weinkove, C. Measurement of catecholamines and their metabolites. Ann. Clin. Biochem. 2004, 41, 17–38. [Google Scholar] [CrossRef] [Green Version]
  30. Dumas, M.E.; Davidovic, L. Metabolic profiling and phenotyping of central nervous system diseases: Metabolites bring insights into brain dysfunctions. J. Neuroimmune Pharmacol. 2015, 10, 402–424. [Google Scholar] [CrossRef] [Green Version]
  31. Bicker, J.; Fortuna, A.; Alves, G.; Falcão, A. Liquid chromatographic methods for the quantification of catecholamines and their metabolites in several biological samples—A review. Anal. Chim. Acta 2013, 768, 12–34. [Google Scholar] [CrossRef]
  32. Khamis, M.M.; Adamko, D.J.; El-Aneed, A. Mass spectrometric based approaches in urine metabolomics and biomarker discovery. Mass. Spectrom. Rev. 2017, 36, 115–134. [Google Scholar] [CrossRef] [PubMed]
  33. Gray, N.; Zia, R.; King, A.; Patel, V.C.; Wendon, J.; McPhail, M.J.; Coen, M.; Plumb, R.S.; Wilson, I.D.; Nicholson, J.K. High-speed quantitative UPLC-MS analysis of multiple amines in human plasma and serum via precolumn derivatization with 6-aminoquinolyl-N-hydroxysuccinimidyl carbamate: Application to acetaminophen-induced liver failure. Anal. Chem. 2017, 89, 2478–2487. [Google Scholar] [CrossRef] [PubMed] [Green Version]
  34. Tufi, S.; Lamoree, M.; de Boer, J.; Leonards, P. Simultaneous analysis of multiple neurotransmitters by hydrophilic interaction liquid chromatography coupled to tandem mass spectrometry. J. Chromatogr. A 2015, 1395, 79–87. [Google Scholar] [CrossRef] [PubMed]
  35. Konieczna, L.; Roszkowska, A.; Niedźwiecki, M.; Bączek, T. Hydrophilic interaction chromatography combined with dispersive liquid-liquid microextraction as a preconcentration tool for the simultaneous determination of the panel of underivatized neurotransmitters in human urine samples. J. Chromatogr. A 2016, 1431, 111–121. [Google Scholar] [CrossRef]
  36. Nirogi, R.; Komarneni, P.; Kandikere, V.; Boggavarapu, R.; Bhyrapuneni, G.; Benade, V.; Gorentla, S. A sensitive and selective quantification of catecholamine neurotransmitters in rat microdialysates by pre-column dansyl chloride derivatization using liquid chromatography-tandem mass spectrometry. J. Chromatogr. B Analyt. Technol. Biomed. Life Sci. 2013, 913–914, 41–47. [Google Scholar] [CrossRef] [PubMed]
  37. Goodwin, K.J.; Gangl, E.; Sarkar, U.; Pop-Damkov, P.; Jones, N.; Borodovsky, A.; Woessner, R.; Fretland, A.J. Development of a quantification method for adenosine in tumors by LC-MS/MS with dansyl chloride derivatization. Anal. Biochem. 2019, 568, 78–88. [Google Scholar] [CrossRef] [PubMed]
  38. Inagaki, S.; Tano, Y.; Yamakata, Y.; Higashi, T.; Min, J.Z.; Toyo’oka, T. Highly sensitive and positively charged precolumn derivatization reagent for amines and amino acids in liquid chromatography/electrospray ionization tandem mass spectrometry. Rapid Commun. Mass. Spectrom. 2010, 24, 1358–1364. [Google Scholar] [CrossRef]
  39. Greco, S.; Danysz, W.; Zivkovic, A.; Gross, R.; Stark, H. Microdialysate analysis of monoamine neurotransmitters—A versatile and sensitive LC-MS/MS method. Anal. Chim. Acta 2013, 771, 65–72. [Google Scholar] [CrossRef]
  40. Park, J.Y.; Myung, S.W.; Kim, I.S.; Choi, D.K.; Kwon, S.J.; Yoon, S.H. Simultaneous measurement of serotonin, dopamine and their metabolites in mouse brain extracts by high-performance liquid chromatography with mass spectrometry following derivatization with ethyl chloroformate. Biol. Pharm. Bull. 2013, 36, 252–258. [Google Scholar] [CrossRef] [Green Version]
  41. van de Merbel, N.C.; Hendriks, G.; Imbos, R.; Tuunainen, J.; Rouru, J.; Nikkanen, H. Quantitative determination of free and total dopamine in human plasma by LC-MS/MS: The importance of sample preparation. Bioanalysis 2011, 3, 1949–1961. [Google Scholar] [CrossRef]
  42. Rose, A.R.; Joshi, M.; Staretz, M.E.; Wood, M.; Brettell, T.A. GC-MS analysis of eight aminoindanes using three derivatization reagents. J. Forensic Sci. 2023, 68, 1148–1161. [Google Scholar] [CrossRef] [PubMed]
  43. Machado, D.G.D.S.; Unal, G.; Andrade, S.M.; Moreira, A.; Altimari, L.R.; Brunoni, A.R.; Perrey, S.; Mauger, A.R.; Bikson, M.; Okano, A.H. Effect of transcranial direct current stimulation on exercise performance: A systematic review and meta-analysis. Brain Stimul. 2019, 12, 593–605. [Google Scholar] [CrossRef] [PubMed]
  44. Loland, S.; McNamee, M.J. The ‘spirit of sport’, WADAs code review, and the search for an overlapping consensus. Int. J. Sport. Policy Pol. 2019, 11, 325–339. [Google Scholar] [CrossRef]
  45. Parma, J.O.; Profeta, V.L.D.S.; Andrade, A.G.P.; Lage, G.M.; Apolinário-Souza, T. TDCS of the primary motor cortex: Learning the absolute dimension of a complex motor task. J. Mot. Behav. 2021, 53, 431–444. [Google Scholar] [CrossRef] [PubMed]
  46. Park, G.; Suh, J.H.; Han, S.J. Transcranial direct current stimulation for balance and gait in repetitive mild traumatic brain injury in rats. BMC Neurosci. 2021, 22, 26. [Google Scholar] [CrossRef]
  47. Marc, D.T.; Ailts, J.W.; Campeau, D.C.A.; Bull, M.J.; Olson, K.L. Neurotransmitters excreted in the urine as biomarkers of nervous system activity: Validity and clinical applicability. Neurosci. Biobehav. Rev. 2011, 35, 635–644. [Google Scholar] [CrossRef]
  48. Liebetanz, D.; Koch, R.; Mayenfels, S.; König, F.; Paulus, W.; Nitsche, M.A. Safety limits of cathodal transcranial direct current stimulation in rats. Clin. Neurophysiol. 2009, 120, 1161–1167. [Google Scholar] [CrossRef]
  49. Lynn-Bullock, C.P.; Welshhans, K.; Pallas, S.L.; Katz, P.S. The effect of oral 5-HTP administration on 5-HTP and 5-HT immunoreactivity in monoaminergic brain regions of rats. J. Chem. Neuroanat. 2004, 27, 129–138. [Google Scholar] [CrossRef]
  50. Shen, Y.; Lu, J.; Tang, Q.; Guan, Q.; Sun, Z.; Li, H.; Cheng, L. Rapid, easy analysis of urinary vanillylmandelic acid for diagnostic testing of pheochromocytoma by liquid chromatography tandem mass spectrometry. J. Chromatogr. B Analyt. Technol. Biomed. Life Sci. 2015, 1002, 92–97. [Google Scholar] [CrossRef]
  51. Veselova, I.A.; Sergeeva, E.A.; Makedonskaya, M.I.; Eremina, O.E.; Kalmykov, S.N.; Shekhovtsova, T.N. Methods for determining neurotransmitter metabolism markers for clinical diagnostics. J. Anal. Chem. 2016, 71, 1155–1168. [Google Scholar] [CrossRef]
  52. Kondziella, D. The top 5 neurotransmitters from a clinical neurologist’s perspective. Neurochem. Res. 2017, 42, 1767–1771. [Google Scholar] [CrossRef] [PubMed]
  53. Kassahun, W.T. Update on the optimal management of patients with vascular extension of pheochromocytoma. Vascular 2015, 23, 297–304. [Google Scholar] [CrossRef] [PubMed]
  54. Yoon, K.J.; Lee, Y.T.; Chae, S.W.; Park, C.R.; Kim, D.Y. Effects of anodal transcranial direct current stimulation (tDCS) on behavioral and spatial memory during the early stage of traumatic brain injury in the rats. J. Neurol. Sci. 2016, 362, 314–320. [Google Scholar] [CrossRef] [PubMed]
  55. Lopes, B.C.; Medeiros, L.F.; Stein, D.J.; Cioato, S.G.; de Souza, V.S.; Medeiros, H.R.; Sanches, P.R.S.; Fregni, F.; Caumo, W.; Torres, I.L.S. tDCS and exercise improve anxiety-like behavior and locomotion in chronic pain rats via modulation of neurotrophins and inflammatory mediators. Behav. Brain Res. 2021, 404, 113173. [Google Scholar] [CrossRef] [PubMed]
  56. Meeusen, R.; Smolders, I.; Sarre, S.; de Meirleir, K.; Keizer, H.; Serneels, M.; Ebinger, G.; Michotte, Y. Endurance training effects on neurotransmitter release in rat striatum: An in vivo microdialysis study. Acta Physiol. Scand. 1997, 159, 335–341. [Google Scholar] [CrossRef] [Green Version]
  57. Hasegawa, H.; Takatsu, S.; Ishiwata, T.; Tanaka, H.; Sarre, S.; Meeusen, R. Continuous monitoring of hypothalamic neurotransmitters and thermoregulatory responses in exercising rats. J. Neurosci. Methods 2011, 202, 119–123. [Google Scholar] [CrossRef] [Green Version]
  58. Tanaka, T.; Takano, Y.; Tanaka, S.; Hironaka, N.; Kobayashi, K.; Hanakawa, T.; Watanabe, K.; Honda, M. Transcranial direct-current stimulation increases extracellular dopamine levels in the rat striatum. Front. Syst. Neurosci. 2013, 7, 6. [Google Scholar] [CrossRef] [Green Version]
  59. Monai, H.; Ohkura, M.; Tanaka, M.; Oe, Y.; Konno, A.; Hirai, H.; Mikoshiba, K.; Itohara, S.; Nakai, J.; Iwai, Y.; et al. Calcium imaging reveals glial involvement in transcranial direct current stimulation-induced plasticity in mouse brain. Nat. Commun. 2016, 7, 11100. [Google Scholar] [CrossRef] [Green Version]
  60. van Boekholdt, L.; Kerstens, S.; Khatoun, A.; Asamoah, B.; Mc Laughlin, M. tDCS peripheral nerve stimulation: A neglected mode of action? Mol. Psychiatry 2021, 26, 456–461. [Google Scholar] [CrossRef]
  61. Barco, S.; Gennai, I.; Reggiardo, G.; Galleni, B.; Barbagallo, L.; Maffia, A.; Viscardi, E.; De Leonardis, F.; Cecinati, V.; Sorrentino, S.; et al. Urinary homovanillic and vanillylmandelic acid in the diagnosis of neuroblastoma: Report from the Italian Cooperative Group for Neuroblastoma. Clin. Biochem. 2014, 47, 848–852. [Google Scholar] [CrossRef]
  62. Lee, T.; Yagi, M.; Kusunoki, N.; Nagasaka, M.; Koda, T.; Matsuo, K.; Yokota, T.; Miwa, A.; Shibata, A.; Morioka, I.; et al. Standard values for the urine HVA/VMA ratio in neonates as a screen for Menkes disease. Brain Dev. 2015, 37, 114–119. [Google Scholar] [CrossRef] [PubMed]
  63. Bastani, A.; Jaberzadeh, S. Within-session repeated a-tDCS: The effects of repetition rate and inter-stimulus interval on corticospinal excitability and motor performance. Clin. Neurophysiol. 2014, 125, 1809–1818. [Google Scholar] [CrossRef] [PubMed]
  64. Clancy, J.A.; Johnson, R.; Raw, R.; Deuchars, S.A.; Deuchars, J. Anodal transcranial direct current stimulation (tDCS) over the motor cortex increases sympathetic nerve activity. Brain Stimul. 2014, 7, 97–104. [Google Scholar] [CrossRef] [PubMed]
  65. Montenegro, R.A.; Farinatti, T.; Fontes, E.B.; Soares, P.P.; Cunha, F.A.; Gurgel, J.L.; Porto, F.; Cyrino, E.S.; Okano, A.H. Transcranial direct current stimulation influences the cardiac autonomic nervous control. Neurosci. Lett. 2011, 497, 32–36. [Google Scholar] [CrossRef] [Green Version]
  66. Tavares, R.F.; Antunes-Rodrigues, J.; de Aguiar Corrêa, F.M. Pressor effects of electrical stimulation of medial prefrontal cortex in unanesthetized rats. J. Neurosci. Res. 2004, 77, 613–620. [Google Scholar] [CrossRef]
  67. Zouhal, H.; Jacob, C.; Delamarche, P.; Gratas-Delamarche, A. Catecholamines and the effects of exercise, training and gender. Sports Med. 2008, 38, 401–423. [Google Scholar] [CrossRef]
  68. Trudeau, F.; Brisson, G.R.; Péronnet, F. PNMT inhibition decreases exercise performance in the rat. Physiol. Behav. 1992, 52, 389–392. [Google Scholar] [CrossRef]
Figure 1. Experimental design of the brain-doping animal model experiment. After a 6-day acclimatization period, the animals underwent 5 days of behavioral assessment training on a rotarod treadmill. On Day 1 of the training period, the electrodes for tDCS application were attached. On the stimulation day (Day 13), urine collection and behavioral assessment were performed simultaneously before and after tDCS. The times shown on Days 13 and 14 are relative to the completion of tDCS.
Separations 10 00413 g001
Figure 2. Results of a behavioral test for the animal model system. (A) Changes in sports performance indicators that set the area under curve of the rotarod speed before and after stimulation. In the sham group, the sports performance decreased by 5.25% after stimulation; however, it increased by 9.33% in the 0.1-mA stimulation group and by 7.98% in the 0.2-mA stimulation group. (B) Change in the ratio of the sports performance with stimulation. The results of the analysis of variance confirmed a statistical significance in the differences between the three groups, and the post hoc test identified these differences between the sham and stimulation groups. Insignificant results were obtained between the stimulation groups. (* p ≤ 0.05, ** p ≤ 0.01).
Separations 10 00413 g002
Figure 3. Chromatograms of five representative target compounds. (A) Analysis results obtained using the developed method for positive control, negative control, and biological samples. (B) The effect of derivatization was depicted for each substance at the same concentration (100 ng/mL). With the exception of ACh, which is not derivatized, the retention time was increased and the detection intensity enhanced by at least four times.
Separations 10 00413 g003
Figure 4. Box plots for three substance-to-substance ratios. Based on the results of samples 2 h after stimulation, the ratio EP/NE significantly increased, whereas the ratios 3-MT/VMA and DOPAC/MHPG significantly decreased in stimulation groups (* p ≤ 0.05).
Separations 10 00413 g004
Figure 5. Two−dimensional (2D) score plots obtained using principal component analysis for the animal model system. The colors in the 2D score plots indicate 95%−confidence regions. Three substance-to-substance ratios, EP/NE, 3−MT/VMA, and DOPAC/MHPG, were applied. Clear separation patterns between the sham and stimulation groups were observed in samples collected 2 h after stimulation.
Separations 10 00413 g005
Table 1. Validation data for the target neurochemicals derived from the developed method.
CompoundLOD *
(ng/mL)
LOQ **
(ng/mL)
Intraday (n = 5)Interday (n = 3)Matrix *** Effect (%)
Accuracy (%)Precision (%RSD)Accuracy (%)Precision (%RSD)
LowMidHighLowMidHighLowMidHighLowMidHigh
3-MT0.0020.01104.7100.598.32.790.842.12109.999.299.04.822.951.9888.3
5-HIAA0.0050.0199.898.499.51.573.553.5092.991.689.613.279.3811.6694.2
5-HT0.020.1100.0102.998.13.961.042.19102.197.898.18.327.054.22100.8
5-HTP0.0050.01102.099.898.73.373.193.80100.692.794.23.996.785.1298.8
DA0.020.0592.5104.1101.78.935.431.20104.5100.3104.012.225.082.6786.2
DHPG0.010.05101.4101.3103.04.224.623.04108.6108.2106.98.788.356.91113.3
DOPAC0.010.196.5101.9100.61.861.322.6298.594.897.53.975.733.51103.4
EP0.050.594.2101.899.3 2.69 2.58 1.75106.298.7102.0 9.99 3.00 3.3580.0
GABA0.55106.7102.2100.011.79 8.9213.66105.4 93.7102.0 9.6911.3014.30109.2
Glu21095.3103.696.0 1.915.29 4.00 95.5101.4100.1 7.15 7.12 6.23102.6
HVA0.010.597.2101.098.9 7.11 2.96 2.46 96.7 95.6 97.613.08 4.68 2.55110.6
Kyn0.050.2104.199.098.8 3.20 1.78 1.23107.1 94.2 94.1 6.21 4.61 4.4499.5
L-DOPA0.020.05102.7100.598.2 6.22 3.21 1.58 99.0 93.6 96.2 8.77 6.45 4.2297.1
MHPG110106.9104.7101.613.71 1.83 5.88 98.5106.3106.312.66 4.47 5.00101.1
MN0.050.2101.7101.198.8 6.63 3.08 1.86106.2 98.8 98.4 7.58 3.03 3.2962.7
NE0.21104.298.499.2 5.03 5.05 5.32105.5 96.6 98.0 5.63 4.16 5.01112.7
NMN0.2299.3101.497.7 3.55 2.80 3.38103.2100.498.4 4.26 2.12 3.85100.1
OA0.52105.599.997.8 4.72 4.80 3.28111.1101.4 99.3 5.71 4.17 4.16100.4
TA0.0020.01103.1102.1 99.1 1.37 2.70 1.36106.3101.0 94.9 3.28 1.87 3.6565.4
Trp0.11105.9102.4 98.71.05 2.61 1.64107.4 97.6 90.4 3.28 5.09 6.9899.7
Tyr0.050.295.8101.6 98.2 2.96 3.49 0.93 99.4 96.5 96.2 5.02 5.19 2.36111.9
VMA0.10.2100.6100.7 99.7 3.54 1.82 3.31103.1 92.1 95.8 7.61 7.43 6.9197.4
ACh1594.1101.0102.3 2.23 1.22 2.18100.8102.1107.8 9.90 2.34 5.25107.9
* limit of detection; ** limit of quantification; *** for rat urine.
Disclaimer/Publisher’s Note: The statements, opinions and data contained in all publications are solely those of the individual author(s) and contributor(s) and not of MDPI and/or the editor(s). MDPI and/or the editor(s) disclaim responsibility for any injury to people or property resulting from any ideas, methods, instructions or products referred to in the content.

