Abstract
Dissolved black carbon (DBC), the particular component of black carbon that can be dissolved in the water, which accounts for ~10% of the organic carbon cycle in the earth’s water body, is an essential member of the dissolved organic matter (DOM) pool. In contrast to DOM, DBC has a higher proportion of conjugated benzene rings, which can more efficiently encourage the degradation of organic micropollutants in the aquatic environment or more rapidly generate reactive oxygen species to photodegrade the organic micropollutants. Therefore, it is of great significance to study the changes and mechanisms of DBC photochemical activity affected by different factors in the water environment. Our work reviewed the main influencing factors and mechanisms of the photochemical activity of DBC. It focuses on the methodologies for the quantitative and qualitative investigation of the photochemical activity of DBC, the impact of the biomass source, the pyrolysis temperature of biochar, and the primary water environmental parameters on the photochemical activity of DBC and the indirect photodegradation of pollutants. Based on this, a potential future study of DBC photochemical activity has been prospected.
1. Introduction
Organic micropollutants, including toxic and harmful chemicals such as endocrine disruptors and antibiotics, are frequently detected in aquatic environments and pose significant environmental risks. Organic micropollutants originate primarily from human activities, such as industrial activities, medical treatment, personal care, livestock and poultry, and large-scale aquaculture emissions [1]. Currently, there are many technologies to remove antibiotics and other organic micropollutants from aquatic environments, including adsorption, the photo Fenton process, photodegradation, and the advanced oxidative degradation of target pollutants with the help of various materials (e.g., biochar, GO-based composite materials, hexaferrite, porous silica-based composite materials, and metal oxide-based materials) [2,3,4,5]. However, the photodegradation pathway of organic micropollutants in natural aquatic environments primarily involves direct photodegradation or indirect photodegradation using other substances (e.g., dissolved black carbon (DBC)).
Black carbon (BC) is generated through the incomplete pyrolysis of common agricultural waste plant tissues (e.g., wheat straw, bamboo, corn straw, and pine needles) or fossil fuels [6], and BC has significant effects on a wide range of earth’s ecosystems and environmental systems including global carbon cycling and climate change [7,8,9]. BC is a typical solid carbon source that is frequently utilized as a soil amendment in agricultural operations to improve soil cation exchange and carbon sequestration capabilities [10,11,12]. The soluble portion of BC, known as DBC, leaches as a result of human activity, surface runoff, and rainfall on exposed BC and has gained significant attention in recent years [13,14].
The structure of aromatic hydrocarbons in organic matter was discovered in the Rio Negro waters [15] and soil pore water [16] using ultra-high resolution mass spectrometry, and this was the first proof of DBC in natural waters. It has been reported that approximately 26.5 Tg of charcoal or BC-derived DBC is released into aquatic environments every year, accounting for approximately 10% of the global river carbon cycle flux [13]. DBC contributes 4% to 20% of the dissolved organic matter (DOM) to estuaries and seas, making it a significant part of the DOM pool [17,18,19]. DBC differs from common DOM in that it has a high-density conjugated aromatic ring with smaller aromatic structures and an abundance of oxygen-containing functional groups [20,21] that allow DBC to undergo quick photosensitization reactions, producing reactive oxygen species (ROS) either directly or indirectly, and this is crucial in the reduction and fate of organic micropollutants in aquatic bodies [22,23]. It has been reported that the unstable structure of DBC encourages its excited triplet state to possess more sensitive photo reactivity than the common DOM triplet state (3DOM*), allowing quicker electron transfer and producing higher quantum yield values for the DBC triplet state (3DBC*) [24]. In addition, DBC can also effectively produce singlet oxygen (1O2) and has a much greater quantum yield than DOM [6,25]. Zhou et al. [26] also found that DBC can degrade triplet-state unstable17β-estradiol more quickly than common DOM.
In general, researchers have been studying the physicochemical properties of DBC and continuously exploring qualitative and quantitative analysis methods for its photochemical activity, as well as the mechanism of indirect photodegradation for organic micropollutants since 2004. Researchers have also found that the content of oxygen-containing functional groups of DBC and its ability to degrade organic micropollutants are also closely related to the biomass source and pyrolysis temperature of the biochar and an aquatic environment. An investigation of the photochemical activity of DBC will aid in understanding its potential to self-transform, its fate, and the ability to photodegrade organic micropollutants in aquatic environments. Therefore, in this study, we review the qualitative and quantitative analysis methods used to investigate the photochemical activity of DBC. We also examine the influence of the biomass source, the BC pyrolysis temperature, and changes in the primary aquatic environmental factors on the photochemical activity of DBC, as well as the influence on the indirect photodegradation of pollutants. On this basis, future DBC photochemical activity research directions are proposed.
2. Quantitative Analysis Methods for the Photochemical Activity of DBC
Pollutant degradation in aqueous environments is greatly affected by DBC-produced ROS, such as 3DBC*, 1O2, hydroxyl radical (·OH), and the superoxide radical (O2−), which is possible due to the aromatic structure, carboxyl group, hydroxyl group, and other functional groups present in DBC. Therefore, it is necessary to perform quantitative and qualitative analyses of the photochemical activity of DBC. Research on the photochemical activity of DBC has primarily focused on characterizing the different physical properties of DBC (e.g., the organic carbon content, group structure, ultraviolet (UV) absorption components, and fluorescence components), as well as the degree of reaction between DBC and chemical probes. The following describes the current qualitative and quantitative methods for photochemical activity investigations of DBC.
2.1. Qualitative Methods
The photochemical activity of DBC is often closely related to its physicochemical structure [14,27,28]. In addition, the detection of the DBC physicochemical structure is also closely related to current instrumental analysis techniques.
A significant portion of the chromophore components in DBC have the potential for photochemical and energy transfer once they capture a certain wavelength of sunlight, and they play a part in photochemical processes in aqueous environments. As a consequence, the qualitative methods related to DBC photochemical activity can be primarily divided into UV-visible spectroscopy analysis, 3D fluorescence spectroscopy analysis, and Fourier transform infrared spectroscopy analysis based on the characteristics of the DBC physicochemical structure.
Previous studies have demonstrated that the spectrum parameters of UV-visible spectroscopy for DBC can potentially be used to evaluate its photochemical activity and structural characteristics because of the absorption characteristics of the photosensitive components [14,24,28,29]. As shown in Table 1, the spectral parameters of commonly used ultraviolet-visible (UV-VIS) spectra are SUVA254 (the ratio of absorbance at 254 nm to the concentration of dissolved organic carbon), and this can be used to evaluate the molecular weight and aromaticity of DBC [28,30]. The absorbance ratio at 254 nm and 365 nm is known as E2/E3, and it is frequently considered to be inversely correlated with the molecular weight of DOM and directly linked to its capacity for electron transfer [28,31]. E4/E6 is the absorbance ratio at 465 nm and 665 nm, which is negatively correlated with the aromatic cluster structure of DOM [14,24]. S275–295 and S350–400 are calculated using linear regression of the logarithmic transformation data at 275 nm to 295 nm and 350 nm to 400 nm, respectively, of which the former reflects the degree of fragmentation of the DOM molecular structure [32], and the latter reflects the aliphatic content of DOM [33]. Moreover, SR is the ratio of S275–295 to S350–400 that is inversely proportional to the molecular weight of DOM [24,34,35] and positively related to the degree of photobleaching for DOM [28,35].

Table 1.
The calculation method and characteristics meaning of different spectral parameters for DBC samples.
For the photochemical activity of DBC, it is crucial to understand the composition and alterations of the chromogenic groups of DBC. A three-dimensional fluorescence spectroscopy analysis may assist in clarifying these changes in functional groups. In accordance with the majority of studies, humus, tyrosine-protein molecules, tryptophan proteins, or phenolic substances all correspond to the unique peak of the three-dimensional fluorescence spectrum [36,37,38,39]. As shown in Figure 1, the ranges of regions I and II are those with excitation wavelengths less than 250 nm and emission wavelengths less than 380 nm, of which the peak of the fluorescence spectrum can be considered to be related to simple aromatic proteins [40,41]. The range of region III is the region with an excitation wavelength of less than 250 nm and an emission wavelength greater than 380 nm, and the primary component of DOM with a three-dimensional fluorescence peak in this region is related to humic acid substances [42]. The region that has an emission wavelength of less than 380 nm and an excitation wavelength greater than 250 nm is recognized as region IV. Infrequently, soluble microbial byproducts are thought to be attached to the primary components of the DOM in the area where the peak of the three-dimensional fluorescence spectrum is in region IV [43,44]. The range of region V includes regions with excitation wavelengths greater than 280 nm and emission wavelengths greater than 380 nm. The primary DOM components with a peak in the three-dimensional fluorescence spectrum located in this region are believed to be related to humic acid organic matter, according to a majority of the literature [45,46].
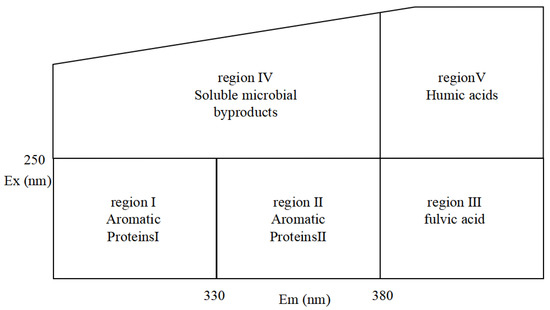
Figure 1.
Characteristic peaks in different areas of the three-dimensional fluorescence spectrum.
Infrared spectroscopy can also be used to analyze the structural changes and chemical characteristics of DBC before and after photochemical reactions [47,48,49]. Table 2 shows the structural characterization corresponding to peak changes in the DOM in different infrared bands. The infrared spectrum peak at 3500–3200 cm−1 in the infrared spectrum indicates that there exists alcohol or phenol in the molecular structure and ─OH in the soluble protein stretch vibration [50,51,52,53]. The characteristic peak changes at 3000–2850 cm−1 often represent the tensile vibrations of aliphatic alkanes ─CH2, aromatic hydrocarbons ─CH, and C─CH3 [53,54]. The infrared spectral peaks at 1800–1600 cm−1 are attributed to the stretching vibration of C═O in carboxylic acids and ketones [47,55,56]. The characteristic peak at 1600–1540 cm−1 indicates the tensile vibration of the aromatic group C═C or N─H of amide I or the tensile vibration of C─N, C═N for amide II [55,57,58]. The characteristic peak change at 1420 cm−1 is believed to be related to the O─H deformation of carboxyl groups within the molecule [49]. The characteristic peak of the infrared spectrum at 1380 cm−1 corresponds to the OH deformation of phenolic hydroxyl groups within the molecule or the C─O stretching deformation of carboxylic acid groups [51,55]. Additionally, the peak changes from 1250–1000 cm−1 are considered to be due to C─O stretching and C─O─P stretching and OH stretching of polysaccharides, alcohols, carboxylic acids, and lipids, or the O─H deformation of carboxyl groups [55,59].
Table 2.
Peak changes in different infrared bands and their corresponding characteristics.
2.2. Quantitative Methods
Quantitative methods to examine the photochemical activity of DBC can also be divided into physical property quantitative methods and chemical property quantitative methods according to the different physicochemical properties of DBC. These include the total organic carbon (TOC) method, the electron-donating capacity (EDC) method, and the ROS production method.
2.2.1. Total Organic Carbon Method
Many studies have found that the photochemical activity of DBC is closely related to the TOC content of the DBC itself [50,60,61]. Zhang et al. [60] found that the TOC value of DBC at lower pyrolysis temperatures was greater than that at higher pyrolysis temperatures, which was correlated to that at lower pyrolysis temperatures (300–400 °C). In addition, the degree of carbonization of the BC was lower, and the content of dissolved substances was higher [61]. When the pyrolysis temperature rose to 500 °C, further decomposition and polymerization of cellulose and lignin led to the production of more stable aromatic substances [61], resulting in a decrease in the TOC value of the DBC.
Quantitative methods for the TOC content for DBC include molecular notation (e.g., the levoglucosan method and the benzene polycarboxylic acid (BPCA) method), the thermal oxidation method, and ultra-high-resolution mass spectrometry (e.g., FT-ICR/MS). The levoglucosan method is applicable to BC produced by combustion at lower temperatures (<250 °C), as natural levoglucosan is primarily produced by biomass combustion below 250 °C, of which the concentration of levoglucosan is quantified using gas chromatography-mass spectrometry. This is multiplied by a conversion coefficient to obtain the DBC content in the sample [62,63]. The principle of the high-temperature oxidation method is to use the high-temperature resistance of black carbon (e.g., soot) and burn the sample in an environment with high temperature (typically 375 °C) and sufficient oxygen for approximately 24 h. Non-black carbon organic matter is oxidized and removed, and then the residual C content was measured using an elemental analyzer, and the residual C is considered black carbon [64,65]. For DBC, it is necessary to concentrate the sample into a solid powder (e.g., freeze-drying or solid-phase extraction) before conducting the determination [66]. However, for this method, there may be organic matter coking during the thermal oxidation process of the sample, resulting in higher measurement values [67]. Fourier transform ion cyclotron resonance mass spectrometry (FT-ICR/MS) can analyze complex compounds and provide detailed composition information of DOM (including DBC) [68]. Ultra-high-resolution mass spectrometry can qualitatively analyze the composition of DBC and semi-quantitatively analyze the DBC concentration. However, due to its high instrument usage cost and long analysis time, it is generally rarely used for large-scale DBC analysis and determination [15,17].
2.2.2. Electron-Donating Capacity Method
The photochemical activity of DBC can also be reflected by the measurement of the electron-donating capacity (EDC) parameters to demonstrate its electron-donating ability between the electron transfer reactions. Based on variations in the current signal of an electrochemical workstation, the EDC value of various DBC samples may be estimated, which is caused by the transfer of electrons from the DBC solution to ABTS+. This is primarily based on direct or indirect electrochemical methods to quantify the redox capacity of DBCs [69,70]. By using an electrochemical analysis, Zheng et al. [29] discovered that the DBC derived from six different types of biochar (soybean, wheat, sorghum, rice, corn, and peanut crop straw) had a higher EDC (2.42–7.10 mmole−·gC−1) and lower EAC (0.40–0.81 mmole−·gC−1) as compared to common DOM. This result was attributed to a high content of phenolic hydroxyl groups.
2.2.3. ROS Production Method
The rate of ROS production due to a DBC irradiation solution can also serve as a reflection of its photochemical activity. To quantitatively analyze DBC-photoproduced ROS formation, a probe is utilized in an experiment under simulated sunlight. The probe photodegradation guided by ROS is often related to the concentration of the probe in the photodegradation system, the steady-state concentration of the corresponding ROS, and the rate constant of the second-order reaction between the probe and the corresponding ROS. In a coexistence system of the probe and ROS, the apparent degradation of the probe conforms to the second-order reaction kinetics:
where kROS, P is the second order reaction rate constants of DBC photoproduced ROS and the corresponding probes in units of M−1 s−1; [ROS]ss is the steady-state concentration of ROS in the DBC irradiated solution in units of M; P is the initial concentration of the probe in units of M; and kP is the apparent degradation rate of the probe in the DBC irradiated solution in units of s−1. Similarly, the reaction between pollutants and ROS can also be applied to the above equation.
−dP/dt = kROS, P [ROS]ss P = kP P,
Furfuryl alcohol (FFA) and deuterium oxide (D2O) are commonly used as capture agents, or N2 is introduced into the DBC photoirradiation solution to study the formation rate of DBC-photoproduced 1O2 [71,72]. The second-order reaction rate constant of FFA and 1O2 (widely valued at 1.2 × 10⁸ M−1 s−1, which can be 1.0 × 10⁸ M−1 s−1 in freshwater) has little dependence on the temperature of the solution and no dependence on the pH of the solution, and it only shows a small increase under high salinity conditions [73]. FFA only reacts with 1O2 in a DBC solution and does not react with other free radicals or oxidants in an irradiated DBC solution [71,74,75]. Regarding D2O, it may take the place of H2O in a DOM-irradiated solution, participating in the production of DOM-photoproduced 1O2, and hence properly calculating the quantitative changes in the photogenerated 1O2 in a DOM solution based on isotope detection [76]. In several studies, the aromatic ketone and quinone groups in DBC are reduced with NaBH4 to examine whether these structures affect the photochemistry of 1O2 in a DBC irradiated solution [21,77].
3DBC* is an important intermediate of ROS in irradiated surface water [14,24,28,78,79]. 2,4,6-trimethylphenol (TMP) and sorbic acid can be used to quantify 3DBC* [21,77]. 3DBC* can react with TMP through the electron transfer pathway [76,80], as well as with sorbic acid, sorbic alcohol, and sorbic amine through the energy transfer pathway [77,80,81]. For the TMP method, different concentrations of TMP probes can be selected and added to different DBC solutions. The formation rate of different 3DBC* (FT, M s−1), the reaction rate constant of the second-order reaction of 3DBC* and TMP (kP, M−1 s−1), and the steady-state concentration of 3DBC* ([T]ss, M) in the electron transfer process between 3DBC* and TMP were explored according to the following equation:
where kTMP is the apparent photolysis rate of TMP in different DBC solutions with simulated sunlight conditions, with the unit of s−1; [TMP]0 is the initial concentration of TMP in the DBC solution with the unit of M; and ks’ is the quenching rate constant of 3DBC* in the DBC irradiation solution with the unit of s−1.
where ks’ included the dissolved oxygen quenching pathway of 3DBC* (kO2 [O2], s−1) and the physical quenching pathway of 3DBC* (kd, s−1):
1/kTMP = [TMP]0/FT + ks’/(FT kP),
ks’ = kO2 [O2] + kd,
The probe for O2− includes 2-methyl-6-[p-methoxyphenyl]-3,7-dihydroimidazolo [1,2-a]pyrazine-3-one (MCLA) as a chemiluminescence probe and is equipped with a flow injection analysis detector system to detect the products of MCLA and superoxide radicals (e.g., dioxocyclopentanone and the UV visible wavelength band 380 nm) [77,81]. Furthermore, O2− can also react with XTT sodium salt resulting in XTT-O2−, and the total amount of O2− produced by a DBC-irradiated solution can be determined by evaluating its change in the UV-visible absorbance at 475 nm [78,79].
For H2O2, the N,N-diethyl-p-phenylened iamine (DPD) method is used for the analysis, and the DPD reagent is prepared by dissolving 0.1 g N,N-diethyl P-Phenylenediamine sulfate in 10 mL 0.1 N H2SO4 [71,82]. The analysis of the irradiated DBC solution involves two measurements, one before sodium bisulfite quenched H2O2 and the other after sodium bisulfite is used. This is conducted to correct the analysis signal of the oxidant from DBC. A total of 50 μL of a 0.5 M phosphate buffer is rapidly mixed with 50 μL of the DPD reagent and added to a 0.5 mL sample. After the rapid mix, 50 μL of 1 mg mL−1 horseradish peroxidase is added and reacted for approximately 30 s. This is then placed in a quartz spectrometer to measure the absorbance of the DPD free radical cation at 551 nm, of which the molar absorption coefficient of the DPD radical cations is 21,000 M−1 cm−1.
With the use of benzene or terephthalic acid probes, the production of ·OH in irradiation solutions containing chromophores can be identified [72,83]. Benzene degrades as a result of the reaction between ·OH and benzene. The degradation rate of benzene, i.e., the generation rate of ·OH, can be determined by matching a high-performance liquid chromatography instrument with a UV detector. The reaction between ·OH and terephthalic acid can generate 2-hydroxyterephthalic acid (2-HTC). 2-HTC can be detected using high-performance liquid chromatography instruments paired with fluorescence detectors [84].
For the photochemistry of DBC in surface water bodies, sunlight or laboratory-simulated light can be selected. Sunlight needs to be calibrated in conjunction with a P-nitroanisole pyridine (PNA-pyr) photometer for experimental data. Similarly, simulated sunlight in the laboratory is also required for the use of a PNA-pyr photometer. The light sources for simulating irradiation in general laboratories are xenon lamps and mercury lamps. To better simulate the natural sunlight of surface water (greater than 290 nm), a 290 nm filter is selected to cut off simulated sunlight from the lamp that is less than 290 nm. Compared with xenon lamps, mercury lamps are often closer to the natural spectral intensity ratio. However, for some difficult-to-degrade organic micropollutants, mercury lamps are often chosen as light sources to explore DOM photochemical activity in order to achieve experimental efficiency and control related variables. This is applicable to the UVB band, and most organic micropollutants that are difficult to degrade can undergo relatively efficient photodegradation or chemical reactions in this band, and the light intensity of mercury lamps in this band is much greater than that of xenon lamps in this band.
The quantum yield is closely related to the irradiance of the surface water environment. For the photochemistry of an aquatic environment, the irradiance of an aquatic environment must be quantified so that the experimental photolysis rate can be explained according to the basic parameters. The commonly used calculation method for the total energy of light irradiation in surface water bodies is the chemical photometer method. The chemical photometer method is a photosensitive chemical solution with known photon absorption and reaction quantum yield, which is the number of moles of reactants lost or products formed per Einstein’s absorption [85]. The two widely used photometry methods are PNA-pyr and P-nitroacetate pyridine (PNAP-pyr) [86]. PNA-pyr is used as an example to describe the calculation of the aquatic environmental irradiance according to a chemical photometer.
As a pseudo-first-order chemical photometer, PNA-pyr uses the peak area of high-performance liquid chromatography (HPLC) to determine the first-order reaction rate constant (k’PNA, s−1). The quantum yield of PNA-pyr (ΦPNA) depends on the initial concentration of pyr. ελ is the molar absorption coefficient of PNA per unit wavelength (M−1 cm−1); z is the length of the optical path in the solution (cm); Δλ is the wavelength of a single unit (1 nm); ρλ is the light intensity ratio; and [pyr] is the concentration of pyr (mol L−1).
Ep, tot0 = (k’PNA [PNA]0 z)/(1000 ΦPNA ∑λ ρλ (1 − 10−ελ z [PNA]0) Δλ),
Ep, λ0 = Ep, tot0 ρλ,
ΦPNA = 0.29 [pyr] + 0.00029,
3. Influence of the Biomass Source and Biochar Pyrolysis Temperature
Considering that DBC primarily originates from water-soluble components in biochar, the special aromatic structure of DBC (containing more oxidizing groups, such as carbonyl and quinone groups, and less reducing groups, such as phenolic hydroxyl) is closely related to the BC biomass source and the BC pyrolysis temperature.
3.1. Biomass Source
For DBC, the biomass raw material is a key factor that affects the content of oxygen-containing functional groups or reducing groups contained in DBC. BC raw materials include agricultural waste, river sludge, industrial waste, and other biomass. Biochar from different biomass sources prepared at the same pyrolysis temperature also generates DBC with different chemical properties (Table 3). Xing et al. [87] discovered that DBC with a 10% sludge-based biochar had greater copper ion affinity than DBC made from pure sewage sludge biochar. Rajapaksha et al. [88] investigated the effect of biomass material on DBC’s photochemical components, including perilla, rice husk, rice bran, garlic stem, and tea waste. They revealed that DBC generated from woody plant biochar had higher levels of protein and tannin components. In a study conducted by Tang et al. [89], DBC derived from soybean straw biochar had the greatest concentration and a relatively high degree of humification as compared to DBC derived from other biochar (e.g., sewage sludge, straw biochar, peanut charcoal, and mushroom residue). In addition, Wei et al. [90] observed that DBC derived from straw biochar had more aromatic components than DBC derived from pine, pig manure, and sewage sludge.
Table 3.
Chemical properties of DBC from different biomass sources.
3.2. Pyrolysis Temperature of Biochar
In addition, the pyrolysis temperature of biochar is also an important factor that indirectly affects the content of oxygen-containing functional groups, such as carbonyl and quinone groups, contained in DBC, as well as the degree of structural damage. For DBC, as the pyrolysis temperature increases (250–600 °C), the lipid content, soluble organic carbon components, and polar acidic functional group content of the DBC will decrease with an increase in the pyrolysis temperature, and the degree of aromatization will continue to increase [91]. In addition, the C─C bond length of biochar decreases as the pyrolysis temperature increases from 500 °C to 700 °C, indicating the conversion of fatty carbon to aromatic carbon during the heating period [92]. Wei et al. [93] found that a high pyrolysis temperature alters the structure and content of DBC, resulting in a decrease in the content of carboxyl groups that neutralize copper ions in DBC. This leads to a decrease in the complexing ability of DBC and copper ions. Xing et al. [87] also observed that a high BC pyrolysis temperature reduces the copper ion chelating ability of DBC derived from sludge-based biochar.
Tu et al. [28] previously studied the photochemical differences of DBC from different biochars at different pyrolysis temperatures. As shown in Table 4, with an increase in pyrolysis temperature, the SUVA254 value of the different DBC samples in the investigation significantly decreased, indicating that low-temperature pyrolysis DBC can absorb more sunlight than high-temperature pyrolysis DBC [28]. These results may have been related to the continuous reduction of aromatic C═C and C═O bonds in DBC derived from biochar with high-temperature pyrolysis [94,95,96]. In addition, the SR value, which is inversely proportional to the molecular weight size, continuously increases with increasing temperature. This also shows that the molecular weight of DBC decreases with an increasing BC pyrolysis temperature, indicating that DBC derived from biochar with low-temperature pyrolysis has a larger molecular weight and stronger absorbance compared to DBC derived from DBC with high-temperature pyrolysis. Our results also indicated that the DBC pyrolyzed at 400 °C had a high E2/E3 value, suggesting that the DBC at this temperature contained aromatic ketones and quinones that were conducive to the generation of oxidizing groups that stimulated the triplet state. Hence, it had a high 3DBC* quantum yield (Figure 2 and Figure 3). As 3DBC* is a precursor of 1O2, the pyrolysis of DBC at 400 °C also had a higher quantum yield of 1O2, and there was a good positive linear correlation between the quantum yield of 3DBC* of DBC and the quantum yield of 1O2 (Figure 4 and Figure 5). The low-temperature pyrolysis DBC had a small SR value, indicating that the DBC was rich in phenolic hydroxyl and other reducing groups, and this was conducive to electron transfer to produce ·OH and O2−.
Table 4.
Characteristics of DBC derived from biochar from different sources and pyrolysis temperatures.
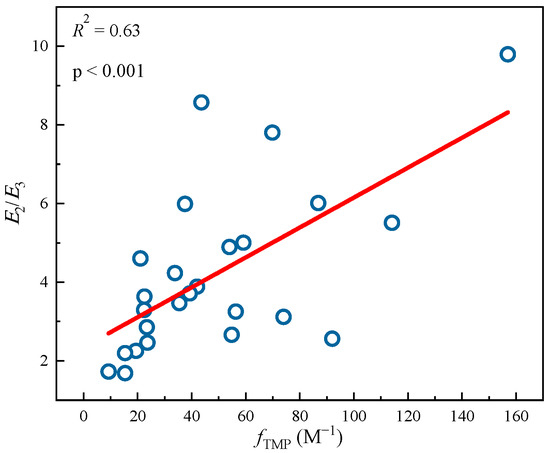
Figure 2.
Linear fitting between 3DBC* quantum yields (fTMP) and optical parameters E2/E3 from different DBC samples. The circle data comes from Tu et al. study [28], and the lines are linear fitting lines of x-axis and y-axis data.
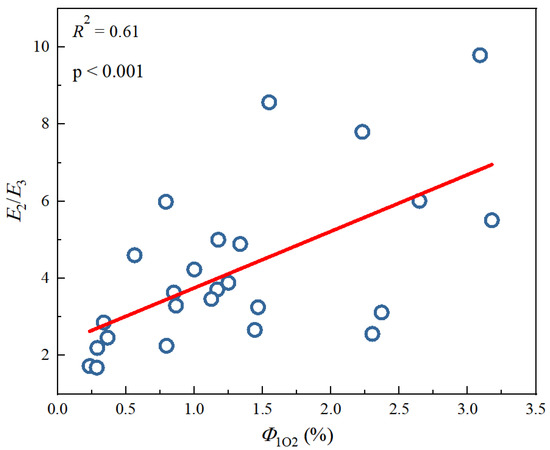
Figure 3.
Linear fitting between 1O2 quantum yields (Φ1O2) and optical parameters E2/E3 from different DBC samples. The circle data comes from Tu et al. study [28], and the lines are linear fitting lines of x-axis and y-axis data.
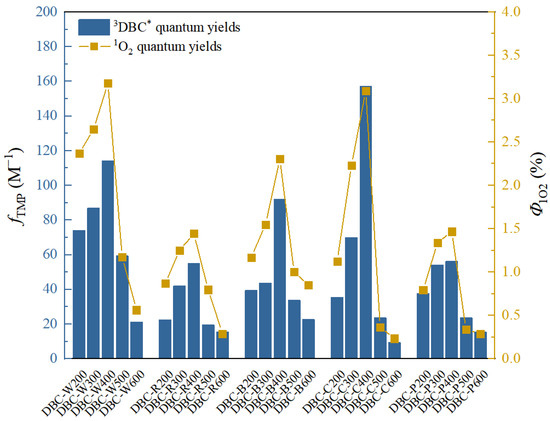
Figure 4.
Quantum yields of 3DBC* (fTMP) and 1O2 (Φ1O2) in DBC with different sources and pyrolysis temperatures under sunlight conditions. The data in the figure are mainly obtained from the research of Tu et al. [28].
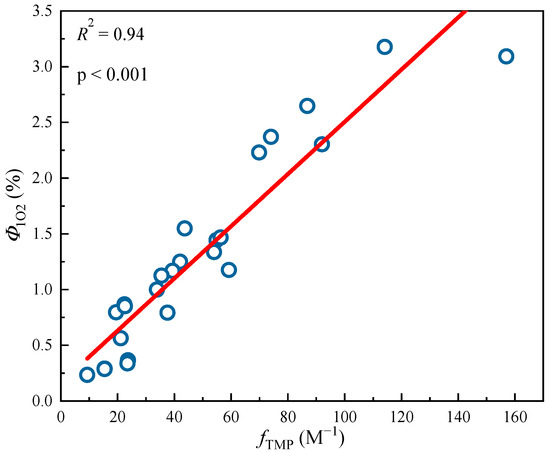
Figure 5.
Linear fitting between 3DBC* quantum yield (fTMP) and 1O2 quantum yield (Φ1O2) from different DBC samples. The circle data in the figure are mainly obtained from the research of Tu et al. [28]. The lines are linear fitting lines of x-axis and y-axis data.
4. Major Aquatic Environmental Factors
In conclusion, as shown in Figure 6, the performance of DBC is affected not only by its own UV/fluorescence absorption components, physical and chemical structure, total organic carbon content, redox capacity, biomass source, and biochar pyrolysis temperature but also by its aquatic environment. Compared to the ideal environment preset in the experiment, the natural water conditions in a natural environment are quite complex. For example, estuaries are transitional areas between rivers and oceans and important ecosystem sites that are rich in halogen ions and other salt components [97,98,99,100]. Halogen ions will not affect the absorption of DBC chromophores but will affect the energy and electron transfer of DBC and further affect the indirect photolysis of organic micropollutants such as carbamazepine and 17β-estradiol [78]. Many researchers have also found that common dissolved ions in water, such as NO3− and SO42−, can significantly inhibit the absorption of photons by DBC or DOM, thereby inhibiting the photolysis of chromophores [101,102]. In addition, the pH value of an aquatic environment also affects the surface activity of DBC and the electron density of organic micropollutants, thereby affecting the photochemical degradation of organic micropollutants when DBC and organic micropollutants coexist [103]. This is consistent with the research results of Li et al., where DOM had the most significant degradation effect on sulfamethoxazole with a pH of 11. This may have occurred because the pH increase promoted the DOM stability and increased the efficiency of DOM-photoproduced ROS [104]. At the same time, the degree of deprotonation of the target pollutant increases with higher pH values, and the electron density increases, making it more vulnerable to attack by ROS. For the coexistence of DBC and halogen ions, our previous research also found that the ionic strength effect of halogen ions inhibited the charge transfer process of 3DBC* in its high/low energy state, and the quantum yield coefficient of 3DBC* decreased, while the quantum yield of 1O2 did not change significantly [78].
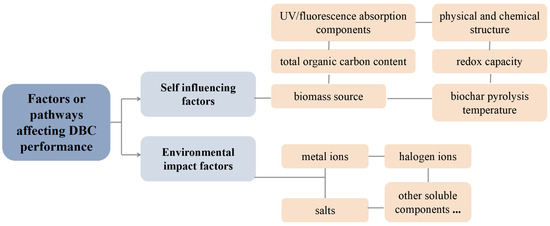
Figure 6.
Related factors or pathways that affect DBC performance.
Furthermore, DBC contains a large number of sites for metal ion binding, and once metal ions form a complex with DBC, it will also affect the photochemical activity of DBC [27,105,106,107]. Some metal ions, such as Na+, Mg2+, Ca2+, and Ba2+, further affect the photochemical behavior of DBC by affecting its aggregation morphology [96]. In addition, some metal ions can undergo redox reactions with specific aromatic groups in DBC, thereby affecting the photochemical activity of DBC. For example, DBC can reduce Cr (VI) to Cr (III) through specific aromatic groups (such as carboxyl, quinones, and phenolic hydroxyl groups) or oxidize As (III) to As (V) [105]. Our previous research found that the complexation reaction between copper ions and DBC leads to a decrease in 3DBC*. However, due to an increase in electron shuttle volume during the reaction between copper ions and DBC, the photo-mediated ·OH content in the DBC increases [79]. With the addition of silver ions, Liu et al. [103] also observed an increase in the electron shuttle in DBC light-irradiated solutions and the rapid photoreduction of silver ions. Therefore, the photochemical activity of DBC is significantly influenced by changes in different aquatic environmental factors.
5. Impact on Pollutants Photodegradation
Under light conditions, DBC’s chromophore absorbs photon energy to form an excited singlet DBC (1DBC*) [79]. 1DBC* transitions to higher vibrational levels through inter-system traversal, becoming 3DBC* [79]. 3DBC* can form important ROS in the photodegradation process of other organic micropollutants in an aquatic environment through energy transfer and electron transfer [22,23]. For example, 3DBC* can generate 1O2 by reacting with O2 by energy transfer, or 3DBC* generates ·OH by reacting with H2O by electron transfer (Figure 7). The ROS generated by DBC under light conditions can efficiently degrade phenols, amines, or refractory organic micropollutants in an aquatic environment. The mechanism of the photo-mediated degradation of organic micropollutants is shown in Figure 7.
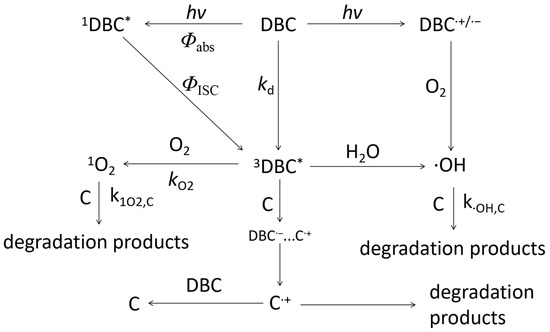
Figure 7.
Mechanism of phototransformation kinetics and photoinduced organic micropollutants degradation of DBC under light conditions. The references for relevant mechanisms and pathways include the research of Tu et al. [28,78,79], Wan et al. [14], Wang et al. [24], Zhou et al. [26], and Tian et al. [27].
Generally, the reaction rate constant of the secondary reaction of organic micropollutants or probes with ROS can be quantified using laser flash technology [108] or competitive kinetics [109,110,111]. Competitive dynamics are relatively simple and widely used, requiring only simple competitive experiments. In brief, a reference compound with a known reaction rate constant of the second-order reaction with ROS is added to a simulated sunlight/sunlight irradiation solution where organic micropollutants or probes coexist with DBC to generate ROS so as to produce a competitive reaction. The relevant equations are as follows:
where in kROS, P is the reaction rate constant of the second-order reaction between ROS and a probe or organic micropollutant; and the unit is M−1 s−1; kROS, R is the second-order reaction rate constant of ROS and a reference compound molecule; with the unit of M−1 s−1; kP is the apparent degradation rate of the probe or organic micropollutant in the solution irradiated by simulated sunlight; with the unit of s−1; and kR is the apparent degradation rate of reference compound molecules in a solution irradiated by simulated sunlight; and the unit is s−1.
kROS, P/kROS, R = kP/kR,
However, 3DBC* has no definite value of its oxidation reduction potential because of the different DBC sources, and 3DBC* is a complex triplet heterozygote, unlike a single reactive oxygen species such as 1O2 or ·OH [112]. Therefore, it was relatively difficult to detect the secondary reaction rate constant of 3DBC* and conventional probes or organic micropollutants.
Table 5 shows the primary ROS for DBC to degrade organic micropollutants and the pseudo-first-order degradation reaction rate constant of organic micropollutants when they coexist. Most of the organic micropollutants underwent indirect photodegradation primarily through DBC-photogenerated 3DBC* and 1O2. Chen et al. [113] summarized the potential mechanisms of DBC photodegradation of organic micropollutants as two pathways, namely direct photodegradation and free radical-driven indirect photodegradation reactions. Previous research has shown that DBC can effectively generate 1O2 under simulated sunlight, with an apparent quantum yield of 4.07 ± 0.19%, which was more than twice that of other DOM [6]. Due to the excellent ability of DBC to generate ROS, its ability to degrade some pollutants under light conditions may be superior to that of DOM. Zhou et al. [26] found that compared with DHS, the apparent quantum yield of DBC-mediated 17β-estradiol photo transformation is approximately six times that of DOM, of which 3DBC* is the active species that plays a major role in the process of 17β-estradiol phototransformation, contributing approximately 91% to indirect photolysis. Wan et al. [14] found that DBC has a higher RS quantum yield than some well-studied dissolved organics that can rapidly degrade atenolol, diphenhydramine, and propyl p-hydroxybenzoate. Tian et al. [27] reported that DBC can significantly promote the photodegradation of carbon tetrachloride in which 3DBC* is the primary reaction intermediate, contributing more than 90% to the photodegradation of total carbon tetrachloride. In addition, the results also showed that the photosensitivity efficiency of DBC increased with a decrease in molecular weight, and DBC with low molecular weight exhibited stronger photosensitivity due to its higher carbonyl compounds. Wang et al. [24] measured the quantum yields of 3DBC* and 1O2 for six different DBC samples and compared them to the natural organic matter (NOM). The results indicated that the average of Φ1O2 for six DBC samples (4.2 ± 1.5%) was greater than the terrestrial NOM (2.4 ± 0.3%) and equivalent to the local NOM (5.3 ± 0.2%). Using TMP as the probe for the oxidation of the triplet state, DBC showed a significantly higher apparent quantum yield coefficient of triplet states than the reference NOM, reflecting that the fTMP value of low-energy 3DBC* was approximately 20 times higher than that of low-energy 3NOM*. Many studies have found that DBC can promote the photodegradation of plasticizers (such as diethyl phthalate) [23], pesticides (such as imidacloprid) [114], personal care products (such as atenolol) [14], sex hormones (such as 17β-estradiol) [26], and other organic pollutants. Zhang et al. [60] explored the effect of DBC generated by two types of biomass at different pyrolysis temperatures on tetracycline degradation. The results demonstrated that DBC had no significant effect on tetracycline concentration under dark conditions, indicating that nonphotochemical processes had no obvious effect on tetracycline degradation. Under simulated sunlight conditions, the presence of DBC significantly increased the photolysis rate of tetracycline (16.3–97.0%), and the promotion effect of high-temperature DBC was stronger. Under the same pyrolysis temperature conditions, the promoting effect of bamboo DBC was higher than that of reed DBC. Moreover, Zhou et al. [26] also reported that bamboo DBC increased the reaction rate constant of the first-order photodegradation of 17β-estradiol by one order of magnitude, which was consistent with the above results of DBC increasing the photodegradation of tetracycline. These results indicated that DBC can promote the photodegradation of organic micropollutants in aquatic environments as an efficient photosensitizer. However, the chromophore of DBC may also compete with the target pollutant due to the light shielding effect, thus inhibiting the photodegradation of the target micropollutant [28]. DBC is prone to occur in areas where biochar is applied more frequently, and its photosensitive properties lead to DBC directly participating in the degradation of organic micropollutants, and its own properties or photogenerated ROS would also be affected by soluble components in an aquatic environment [28,78,79]. Hence, there remains uncertainty regarding the degradation process of organic micropollutants in an aquatic environment that DBC participates.
Table 5.
The main ROS of organic micropollutants degraded by DBC and the pseudo-first-order degradation reaction rate constant of organic micropollutants.
6. Conclusions
DBC is part of BC that can be dissolved in an aquatic environment and accounts for approximately 10% of the organic carbon cycle of the earth’s water bodies. It is an important component of organic matter. DBC differs from common DOM in that it has a high conjugation degree of benzene ring that can more efficiently generate ROS and promote the degradation of organic micropollutants in an aquatic environment. Therefore, the study of the influencing factors of DBC photochemical activity is of great significance. As an important member of DOM, an exploration of the photochemical activity of DBC will assist in understanding its ability to self-transform, its fate in an environment, and its ability to degrade organic micropollutants. The photophysical properties and photochemical activity of DBC vary depending on the source of BC, the BC pyrolysis conditions, and aquatic environmental factors.
Since 2004, numerous researchers have conducted studies on DBC and have gained a certain understanding and mastery of DBC. Currently, people also maintain a relatively unified view of the basic understanding of DBC. They believe that DBC is a soluble component of black carbon with rich oxygen-containing functional groups and high aromaticity. Many researchers have researched the qualitative and quantitative detection, structural detection, transformation, and degradation of DBC, and these studies have resulted in a significant understanding of the behavior and fate of pollutants in the environment using various means.
However, there remain some problems in the research on the photochemical activity of DBC. Photochemical conversion is an important process that affects the environmental fate of organic pollutants in an aquatic environment. However, as an active photosensitizer in water, it is not yet clear what photochemical changes DBC may undergo under different aquatic environmental factors (such as different pH, halogen ions, and other salt ions). Therefore, further exploration of the influencing factors and mechanisms of the changes in DBC photochemical activity under different aquatic environments is required in subsequent research on DBC photochemical activity. Moreover, DBC accounts for 4–20% of the DOM in aquatic environments, and it always coexists with DOM in aquatic environments [13,24]. Subsequent research should also consider the reduction of organic micropollutants under the coexistence of DBC and other DOM systems. This will provide a scientific understanding of the photochemical process of DBC in aquatic environments and is of great significance for the environmental fate of DBC and organic micropollutants in aquatic environments.
Author Contributions
Conceptualization, H.L., Y.T. and W.T.; methodology, H.L., Y.T. and W.W.; validation, W.T. and W.W.; formal analysis, H.L., Y.T. and Y.L.; investigation, Y.T. and W.T.; resources, H.L. and Y.T.; data curation, H.L. and Y.L.; writing—original draft preparation, H.L.; writing—review and editing, Y.T.; visualization, Y.T. and Y.L.; supervision, Y.L. and Y.T.; project administration, Y.T.; funding acquisition, Y.L. All authors have read and agreed to the published version of the manuscript.
Funding
This research was financially supported by the National Natural Science Foundation of China (22266020) and the Yunnan Fundamental Research Projects (202201AT070097).
Data Availability Statement
Data is contained within the article. The data presented in this study are as shown in the article.
Acknowledgments
The authors wish to thank all who assisted in conducting this work.
Conflicts of Interest
The authors declare no conflict of interest.
References
- Bui, X.T.; Vo, T.P.T.; Ngo, H.H.; Guo, W.S.; Nguyen, T.T. Multicriteria assessment of advanced treatment technologies for micropollutants removal at large-scale applications. Sci. Total Environ. 2016, 563–564, 1050–1067. [Google Scholar] [CrossRef]
- Malik, M.; Ibrahim, S.M.; Nazir, M.A.; Tahir, A.A.; Tufail, M.K.; Shah, S.S.A.; Anum, A.; Wattoo, M.A.; Rehman, A. Engineering of a Hybrid g-C3N4/ZnO-W/Cox Heterojunction Photocatalyst for the Removal of Methylene Blue Dye. Catalysts 2023, 13, 813. [Google Scholar] [CrossRef]
- Anum, A.; Nazir, M.A.; Ibrahim, S.M.; Shah, S.S.A.; Tahir, A.A.; Malik, M.; Wattoo, M.A.; Rehman, A. Synthesis of Bi-Metallic-Sulphides/MOF-5@graphene Oxide Nanocomposites for the Removal of Hazardous Moxifloxacin. Catalysts 2023, 13, 984. [Google Scholar] [CrossRef]
- Nazir, M.A.; Najam, T.; Jabeen, S.; Wattoo, M.A.; Bashir, M.S.; Shah, S.S.A.; Rehman, A. Facile synthesis of Tri-metallic layered double hydroxides (NiZnAl-LDHs): Adsorption of Rhodamine-B and methyl orange from water. Inorg. Chem. Commun. 2022, 145, 110008. [Google Scholar] [CrossRef]
- Nazir, M.A.; Najam, T.; Shahzad, K.; Wattoo, M.A.; Hussain, T.; Tufail, M.K.; Shah, S.S.A.; Rehman, A. Heterointerface engineering of water stable ZIF-8@ZIF-67: Adsorption of rhodamine B from water. Surf. Interfaces 2022, 34, 102324. [Google Scholar] [CrossRef]
- Fu, H.; Liu, H.; Mao, J.; Chu, W.; Li, Q.; Alvarez, P.J.J.; Qu, X.; Zhu, D. Photochemistry of dissolved black carbon released from biochar: Reactive oxygen species generation and phototransformation. Environ. Sci. Technol. 2016, 50, 1218–1226. [Google Scholar] [CrossRef]
- Cornelissen, G.; Gustafsson, Ö.; Bucheli, T.D.; Jonker, M.T.O.; Koelmans, A.A.; van Noort, P.C.M. Extensive sorption of organic compounds to black carbon, coal, and kerogen in sediments and soils: Mechanisms and consequences for distribution, bioaccumulation, and biodegradation. Environ. Sci. Technol. 2005, 39, 6881–6895. [Google Scholar] [CrossRef]
- Liang, B.; Lehmann, J.; Solomon, D.; Sohi, S.; Thies, J.E.; Skjemstad, J.O.; Luizão, F.J.; Engelhard, M.H.; Neves, E.G.; Wirick, S. Stability of biomass-derived black carbon in soils. Geochim. Cosmochim. Acta 2008, 72, 6069–6078. [Google Scholar] [CrossRef]
- Masiello, C.A. New directions in black carbon organic geochemistry. Mar. Chem. 2004, 92, 201–213. [Google Scholar] [CrossRef]
- Mao, J.D.; Johnson, R.L.; Lehmann, J.; Olk, D.C.; Neves, E.G.; Thompson, M.L.; Schmidt-Rohr, K. Abundant and stable char residues in soils: Implications for soil fertility and carbon sequestration. Environ. Sci. Technol. 2012, 46, 9571–9576. [Google Scholar] [CrossRef]
- Roberts, K.G.; Gloy, B.A.; Joseph, S.; Scott, N.R.; Lehmann, J. Life cycle assessment of biochar systems: Estimating the energetic, economic, and climate change potential. Environ. Sci. Technol. 2010, 44, 827–833. [Google Scholar] [CrossRef]
- Woolf, D.; Amonette, J.E.; Street-Perrott, F.A.; Lehmann, J.; Joseph, S. Sustainable biochar to mitigate global climate change. Nat. Commun. 2010, 1, 56. [Google Scholar] [CrossRef]
- Jaffe, R.; Ding, Y.; Niggemann, J.; Vähätalo, A.V.; Stubbins, A.; Spencer, R.G.M.; Campbell, J.; Dittmar, T. Global charcoal mobilization from soils via dissolution and riverine transport to the oceans. Science 2013, 340, 345–347. [Google Scholar] [CrossRef] [PubMed]
- Wan, D.; Wang, J.; Dionysiou, D.D.; Kong, Y.; Yao, W.; Selvinsimpson, S.; Chen, Y. Photogeneration of reactive species from biochar-derived dissolved black carbon for the degradation of amine and phenolic pollutants. Environ. Sci. Technol. 2021, 55, 8866–8876. [Google Scholar] [CrossRef]
- Kim, S.; Kaplan, L.A.; Benner, R.; Hatcher, P.G. Hydrogen-deficient molecules in natural riverine water samples—Evidence for the existence of black carbon in DOM. Mar. Chem. 2004, 92, 225–234. [Google Scholar] [CrossRef]
- Hockaday, W.C.; Grannas, A.M.; Kim, S.; Hatcher, P.G. Direct molecular evidence for the degradation and mobility of black carbon in soils from ultrahigh-resolution mass spectral analysis of dissolved organic matter from a fire-impacted forest soil. Org. Geochem. 2006, 37, 501–510. [Google Scholar] [CrossRef]
- Dittmar, T.; Paeng, J. A heat-induced molecular signature in marine dissolved organic matter. Nat. Geosci. 2009, 2, 175–179. [Google Scholar] [CrossRef]
- Mannino, A.; Harvey, H.R. Black carbon in estuarine and coastal ocean dissolved organic matter. Limnol. Oceanogr. 2004, 49, 735–740. [Google Scholar] [CrossRef]
- Masiello, C.A.; Druffel, E.R.M. Black carbon in deep-sea sediments. Science 1998, 280, 1911–1913. [Google Scholar] [CrossRef]
- Zafiriou, O.C.; Joussot-Dubien, J.; Zepp, R.G.; Zika, R.G. Photochemistry of natural waters. Environ. Sci. Technol. 1984, 18, 358A–371A. [Google Scholar] [CrossRef]
- Zhou, H.; Lian, L.; Yan, S.; Song, W. Insights into the photo-induced formation of reactive intermediates from effluent organic matter: The role of chemical constituents. Water Res. 2017, 112, 120–128. [Google Scholar] [CrossRef]
- Chen, N.; Huang, Y.; Hou, X.; Ai, Z.; Zhang, L. Photochemistry of hydrochar: Reactive oxygen species generation and sulfadimidine degradation. Environ. Sci. Technol. 2017, 51, 11278–11287. [Google Scholar] [CrossRef] [PubMed]
- Fang, G.; Liu, C.; Wang, Y.; Dionysiou, D.D.; Zhou, D. Photogeneration of reactive oxygen species from biochar suspension for diethyl phthalate degradation. Appl. Catal. B 2017, 214, 34–45. [Google Scholar] [CrossRef]
- Wang, H.; Zhou, H.; Ma, J.; Nie, J.; Yan, S.; Song, W. Triplet photochemistry of dissolved black carbon and its effects on the photochemical formation of reactive oxygen species. Environ. Sci. Technol. 2020, 54, 4903–4911. [Google Scholar] [CrossRef]
- Li, M.; Bao, F.; Zhang, Y.; Sheng, H.; Chen, C.; Zhao, J. Photochemical aging of soot in the aqueous phase: Release of dissolved black carbon and the formation of 1O2. Environ. Sci. Technol. 2019, 53, 12311–12319. [Google Scholar] [CrossRef]
- Zhou, Z.; Chen, B.; Qu, X.; Fu, H.; Zhu, D. Dissolved black carbon as an efficient sensitizer in the photochemical transformation of 17β-estradiol in aqueous solution. Environ. Sci. Technol. 2018, 52, 10391–10399. [Google Scholar] [CrossRef]
- Tian, Y.; Feng, L.; Wang, C.; Liu, Y.; Zou, J.; Li, R.; Du, Z.; Zhang, L. Dissolved black carbon enhanced the aquatic photo-transformation of chlortetracycline via triplet excited-state species: The role of chemical composition. Environ. Res. 2019, 179, 108855. [Google Scholar] [CrossRef]
- Tu, Y.; Liu, H.; Li, Y.; Zhang, Z.; Lei, Y.; Zhao, Q.; Tian, S. Radical chemistry of dissolved black carbon under sunlight irradiation: Quantum yield prediction and effects on sulfadiazine photodegradation. Environ. Sci. Pollut. Res. 2022, 29, 21517–21527. [Google Scholar] [CrossRef]
- Zheng, X.; Liu, Y.; Fu, H.; Qu, X.; Yan, M.; Zhang, S.; Zhu, D. Comparing electron donating/accepting capacities (EDC/EAC) between crop residue-derived dissolved black carbon and standard humic substances. Sci. Total Environ. 2019, 673, 29–35. [Google Scholar] [CrossRef] [PubMed]
- He, P.; Xue, J.; Shao, L.; Li, G.; Lee, D. Dissolved organic matter (DOM) in recycled leachate of bioreactor landfill. Water Res. 2006, 40, 1465–1473. [Google Scholar] [CrossRef]
- Laszakovits, J.R.; Somogyi, A.; Mackay, A.A. Chemical alterations of dissolved organic matter by permanganate oxidation. Environ. Sci. Technol. 2020, 54, 3256–3266. [Google Scholar] [CrossRef]
- Fichot, C.G.; Benner, R. The spectral slope coefficient of chromophoric dissolved organic matter (S275–295) as a tracer of terrigenous dissolved organic carbon in river-influenced ocean margins. Limnol. Oceanogr. 2012, 57, 1453–1466. [Google Scholar] [CrossRef]
- Du, Z.; He, Y.; Fan, J.; Fu, H.; Zheng, S.; Xu, Z.; Qu, X.; Kong, A.; Zhu, D. Predicting apparent singlet oxygen quantum yields of dissolved black carbon and humic substances using spectroscopic indices. Chemosphere 2018, 194, 405–413. [Google Scholar] [CrossRef] [PubMed]
- Helms, J.R.; Stubbins, A.; Ritchie, J.D.; Minor, E.C.; Kieber, D.J.; Mopper, K. Absorption spectral slopes and slope ratios as indicators of molecular weight, source, and photobleaching of chromophoric dissolved organic matter. Limnol. Oceanogr. 2008, 53, 955–969. [Google Scholar] [CrossRef]
- Zhou, C.; Xie, Q.; Wang, J.; Chen, X.; Niu, J.; Chen, J. Effects of dissolved organic matter derived from freshwater and seawater on photodegradation of three antiviral drugs. Environ. Pollut. 2020, 258, 113700. [Google Scholar] [CrossRef]
- Coble, P.G. Characterization of marine and terrestrial DOM in seawater using excitation-emission matrix spectroscopy. Mar. Chem. 1996, 51, 325–346. [Google Scholar] [CrossRef]
- Coble, P.G.; Green, S.A.; Blough, N.V.; Gagosian, R.B. Characterization of dissolved organic matter in the Black Sea by fluorescence spectroscopy. Nature 1990, 348, 432–435. [Google Scholar] [CrossRef]
- Coble, P.G.; Schultz, C.A.; Mopper, K. Fluorescence contouring analysis of doc intercalibration experiment samples—A comparison of techniques. Mar. Chem. 1993, 41, 173–178. [Google Scholar] [CrossRef]
- Peng, N.; Wang, K.; Tu, N.; Liu, Y.; Li, Z. Fluorescence regional integration combined with parallel factor analysis to quantify fluorescencent spectra for dissolved organic matter released from manure biochars. RSC Adv. 2020, 10, 31502–31510. [Google Scholar] [CrossRef]
- Ahmad, S.R.; Reynolds, D.M. Monitoring of water quality using fluorescence technique: Prospect of on-line process control. Water Res. 1999, 33, 2069–2074. [Google Scholar] [CrossRef]
- Determann, S.; Reuter, R.; Wagner, P.; Willkomm, R. Fluorescence matter in the eastern Atlantic Ocean. Part 1: Method of measurement and near-surface distribution. Deep-Sea Res. Part I Oceanogr. Res. Pap. 1994, 41, 659–675. [Google Scholar] [CrossRef]
- Mounier, S.; Braucher, R.; Benaim, J.Y. Differentiation of organic matter’s properties of the Rio Negro basin by cross-flow ultra-filtration and UV-spectrofluorescence. Water Res. 1999, 33, 2363–2373. [Google Scholar] [CrossRef]
- Ismaili, M.M.; Belin, C.; Lamotte, M.; Texier, H. Distribution and characterisation by fluorescence of the dissolved organic matter within the central Channel waters. Oceanol. Acta 1998, 21, 645–654. [Google Scholar] [CrossRef]
- Reynolds, D.M.; Ahmad, S.R. Rapid and direct determination of wastewater BOD values using a fluorescence technique. Water Res. 1997, 31, 2012–2018. [Google Scholar] [CrossRef]
- Artinger, R.; Buckau, G.; Geyer, S.; Fritz, P.; Wolf, M.; Kim, J.I. Characterization of groundwater humic substances: Influence of sedimentary organic carbon. Appl. Geochem. 2000, 15, 97–116. [Google Scholar] [CrossRef]
- Miano, T.; Sposito, G.; Martin, J.P. Fluorescence spectroscopy of model humic acid-type polymers. Geoderma 1990, 47, 349–359. [Google Scholar] [CrossRef]
- Ding, L.; Luo, Y.; Yu, X.; Ouyang, Z.; Liu, P.; Guo, X. Insight into interactions of polystyrene microplastics with different types and compositions of dissolved organic matter. Sci. Total Environ. 2022, 824, 153883. [Google Scholar] [CrossRef]
- Gui, X.; Liu, C.; Li, F.; Wang, J. Effect of pyrolysis temperature on the composition of DOM in manure-derived biochar. Ecotoxicol. Environ. Saf. 2020, 197, 110597. [Google Scholar] [CrossRef]
- Guo, X.; He, X.; Li, C.; Li, N. The binding properties of copper and lead onto compost-derived DOM using Fourier-transform infrared, UV-vis and fluorescence spectra combined with two-dimensional correlation analysis. J. Hazard. Mater. 2019, 365, 457–466. [Google Scholar] [CrossRef]
- Li, J.; Yip, C.M. Super-resolved FT-IR spectroscopy: Strategies, challenges, and opportunities for membrane biophysics. Biochim. Biophys. Acta BBA Biomembr. 2013, 1828, 2272–2282. [Google Scholar] [CrossRef]
- Smidt, E.; Meissl, K. The applicability of Fourier transform infrared (FT-IR) spectroscopy in waste management. Waste Manag. 2007, 27, 268–276. [Google Scholar] [CrossRef] [PubMed]
- Soobhany, N.; Gunasee, S.; Rago, Y.P.; Joyram, H.; Raghoo, P.; Mohee, R.; Garg, V.K. Spectroscopic, thermogravimetric and structural characterization analyses for comparing Municipal Solid Waste composts and vermicomposts stability and maturity. Bioresour. Technol. 2017, 236, 11–19. [Google Scholar] [CrossRef]
- Yang, X.; Zhang, S.; Liu, L.; Ju, M. Study on the long-term effects of DOM on the adsorption of BPS by biochar. Chemosphere 2020, 242, 125165. [Google Scholar] [CrossRef] [PubMed]
- Li, F.; Zhang, L.; Li, X.; Xie, Y.; Wang, Y.; Wang, J. Biomass co-pyrolysis with calcium dihydrogen phosphate improving carbon fixation of biochar. Trans. Chin. Soc. Agric. Eng. 2016, 32, 201–205. [Google Scholar]
- Li, W.; Zhang, F.; Ye, Q.; Wu, D.; Wang, L.; Yu, Y.; Deng, B.; Du, J. Composition and copper binding properties of aquatic fulvic acids in eutrophic Taihu Lake, China. Chemosphere 2017, 172, 496–504. [Google Scholar] [CrossRef]
- Wang, L.; Shen, Q.; Yu, G.; Ran, W.; Xu, Y. Fate of biopolymers during rapeseed meal and wheat bran composting as studied by two-dimensional correlation spectroscopy in combination with multiple fluorescence labeling techniques. Bioresour. Technol. 2012, 105, 88–94. [Google Scholar] [CrossRef]
- Chen, W.; Habibul, N.; Liu, X.; Sheng, G.; Yu, H. FTIR and Synchronous Fluorescence Heterospectral Two-Dimensional Correlation Analyses on the Binding Characteristics of Copper onto Dissolved Organic Matter. Environ. Sci. Technol. 2015, 49, 2052–2058. [Google Scholar] [CrossRef]
- Xue, S.; Zhao, Q.; Wei, L.; Ren, N. Behavior and characteristics of dissolved organic matter during column studies of soil aquifer treatment. Water Res. 2009, 43, 499–507. [Google Scholar] [CrossRef]
- Chun, Y.; Sheng, G.; Chiou, C.T.; Xing, B. Compositions and sorptive properties of crop residue-derived chars. Environ. Sci. Technol. 2004, 38, 4649–4655. [Google Scholar] [CrossRef]
- Zhang, X.; Liu, Y.; Liu, Q.; Chu, C.; Shi, M.; Ma, X.; Li, X.; Zheng, H.; Li, F. Dissolved black carbon enhanced the photodegradation of tetracycline in aqueous solution. Environ. Chem. 2023, 42, 2064–2075. [Google Scholar]
- Tomczyk, A.; Sokołowska, Z.; Boguta, P. Biochar physicochemical properties: Pyrolysis temperature and feedstock kind effects. Rev. Environ. Sci. Biotechnol. 2020, 19, 191–215. [Google Scholar] [CrossRef]
- Myers-Pigg, A.N.; Louchouarn, P.; Amon, R.M.W.; Prokushkin, A.; Pierce, K.; Rubtsov, A. Labile pyrogenic dissolved organic carbon in major Siberian Arctic rivers: Implications for wildfire-stream metabolic linkages. Geophys. Res. Lett. 2015, 42, 377–385. [Google Scholar] [CrossRef]
- Norwood, M.J.; Louchouarn, P.; Kuo, L.; Harvey, O.R. Characterization and biodegradation of water-soluble biomarkers and organic carbon extracted from low temperature chars. Org. Geochem. 2013, 56, 111–119. [Google Scholar] [CrossRef]
- Gustafsson, Ö.; Haghseta, F.; Chan, C.; MacFarlane, J.; Gschwend, P.M. Quantification of the dilute sedimentary soot phase: Implications for PAH speciation and bioavailability. Environ. Sci. Technol. 1997, 31, 203–209. [Google Scholar] [CrossRef]
- Gustafsson, Ö.; Bucheli, T.D.; Kukulska, Z.; Andersson, M.; Largeau, C.; Rouzaud, J.; Reddy, C.M.; Eglinton, T.I. Evaluation of a protocol for the quantification of black carbon in sediments. Glob. Biogeochem. Cycles 2001, 15, 881–890. [Google Scholar] [CrossRef]
- Wang, X.; Xu, C.; Druffel, E.M.; Xue, Y.; Qi, Y. Two black carbon pools transported by the Changjiang and Huanghe Rivers in China. Glob. Biogeochem. Cycles 2016, 30, 1778–1790. [Google Scholar] [CrossRef]
- Hammes, K.; Schmidt, M.W.I.; Smernik, R.J.; Currie, L.A.; Ball, W.P.; Nguyen, T.H.; Louchouarn, P.; Houel, S.; Gustafsson, Ö.; Elmquist, M.; et al. Comparison of quantification methods to measure fire-derived (black/elemental) carbon in soils and sediments using reference materials from soil, water, sediment and the atmosphere. Glob. Biogeochem. Cycles 2007, 21. [Google Scholar] [CrossRef]
- Sleighter, R.L.; Hatcher, P.G. The application of electrospray ionization coupled to ultrahigh resolution mass spectrometry for the molecular characterization of natural organic matter. J. Mass Spectrom. 2007, 42, 559–574. [Google Scholar] [CrossRef]
- Aeschbacher, M.; Graf, C.; Schwarzenbach, R.P.; Sander, M. Antioxidant Properties of Humic Substances. Environ. Sci. Technol. 2012, 46, 4916–4925. [Google Scholar] [CrossRef]
- Aeschbacher, M.; Sander, M.; Schwarzenbach, R.P. Novel Electrochemical Approach to Assess the Redox Properties of Humic Substances. Environ. Sci. Technol. 2010, 44, 87–93. [Google Scholar] [CrossRef]
- Dalrymple, R.M.; Carfagno, A.K.; Sharpless, C.M. Correlations between Dissolved Organic Matter Optical Properties and Quantum Yields of Singlet Oxygen and Hydrogen Peroxide. Environ. Sci. Technol. 2010, 44, 5824–5829. [Google Scholar] [CrossRef] [PubMed]
- Kaur, R.; Anastasio, C. Light absorption and the photoformation of hydroxyl radical and singlet oxygen in fog waters. Atmos. Environ. 2017, 164, 387–397. [Google Scholar] [CrossRef]
- Appiani, E.; Ossola, R.; Latch, D.E.; Erickson, P.R.; McNeill, K. Aqueous singlet oxygen reaction kinetics of furfuryl alcohol: Effect of temperature, pH, and salt content. Environ. Sci. Process. Impacts 2017, 19, 507–516. [Google Scholar] [CrossRef] [PubMed]
- Haag, W.R.; Hoigne’, J.; Gassman, E.; Braun, A.M. Singlet oxygen in surface waters—Part I: Furfuryl alcohol as a trapping agent. Chemosphere 1984, 13, 631–640. [Google Scholar] [CrossRef]
- Halladja, S.; Ter Halle, A.; Aguer, J.; Boulkamh, A.; Richard, C. Inhihition of humic substances mediated photooxygenation of furfuryl alcohol by 2,4,6-trimethylphenol. Evidence for reactivity of the phenol with humic triplet excited states. Environ. Sci. Technol. 2007, 41, 6066–6073. [Google Scholar] [CrossRef]
- Grebel, J.E.; Pignatello, J.J.; Mitch, W.A. Impact of halide ions on natural organic matter-sensitized photolysis of 17β-estradiol in saline waters. Environ. Sci. Technol. 2012, 46, 7128–7134. [Google Scholar] [CrossRef]
- Parker, K.M.; Pignatello, J.J.; Mitch, W.A. Influence of ionic strength on triplet-state natural organic matter loss by energy transfer and electron transfer pathways. Environ. Sci. Technol. 2013, 47, 10987–10994. [Google Scholar] [CrossRef]
- Tu, Y.; Tang, W.; Li, Y.; Pu, J.; Liao, J.; Wu, W.; Tian, S. Insights into the implication of halogen ions on the photoactivity of dissolved black carbon for the degradation of pharmaceutically active compounds. Sep. Purif. 2022, 300, 121765. [Google Scholar] [CrossRef]
- Tu, Y.; Li, C.; Shi, F.; Li, Y.; Zhang, Z.; Liu, H.; Tian, S. Enhancive and inhibitory effects of copper complexation on triplet dissolved black carbon-sensitized photodegradation of organic micropollutants. Chemosphere 2022, 307, 135968. [Google Scholar] [CrossRef]
- Grebel, J.E.; Pignatello, J.J.; Mitch, W.A. Sorbic acid as a quantitative probe for the formation, scavenging and steady-state concentrations of the triplet-excited state of organic compounds. Water Res. 2011, 45, 6535–6544. [Google Scholar] [CrossRef]
- Zhou, H.; Yan, S.; Ma, J.; Lian, L.; Song, W. Development of novel chemical probes for examining triplet natural organic matter under solar illumination. Environ. Sci. Technol. 2017, 51, 11066–11074. [Google Scholar] [CrossRef] [PubMed]
- Bader, H.; Sturzenegger, V.; Hoigné, J. Photometric method for the determination of low concentrations of hydrogen peroxide by the peroxidase catalyzed oxidation of N,N-diethyl-p-phenylenediamine (DPD). Water Res. 1988, 22, 1109–1115. [Google Scholar] [CrossRef]
- Liu, H.; Zhang, Z.; Tu, Y.; Li, Y.; Lei, Y.; Tian, S. Dual roles of Cu2+ complexation with dissolved organic matter on the photodegradation of trace organic pollutants: Triplet- and ·OH-induced reactions. Sci. Total Environ. 2022, 815, 152934. [Google Scholar] [CrossRef] [PubMed]
- Zhou, S.; Liao, Z.; Zhang, B.; Hou, R.; Wang, Y.; Zhou, S.; Zhang, Y.; Ren, Z.J.; Yuan, Y. Photochemical behavior of microbial extracellular polymeric substances in the aquatic environment. Environ. Sci. Technol. 2021, 55, 15090–15099. [Google Scholar] [CrossRef]
- Kuhn, H.J.; Braslavsky, S.E.; Schmidt, R. Chemical actinometry IUPAC technical report. Pure Appl. Chem. 2004, 76, 2105–2146. [Google Scholar] [CrossRef]
- Laszakovits, J.R.; Berg, S.M.; Anderson, B.G.; O’Brien, J.E.; Wammer, K.H.; Sharplessp, C. p-Nitroanisole/Pyridine and p-Nitroacetophenone/Pyridine actinometers revisited: Quantum yield in comparison to ferrioxalate. Environ. Sci. Technol. Lett. 2017, 4, 11–14. [Google Scholar] [CrossRef]
- Xing, J.; Xu, G.; Li, G. Analysis of the complexation behaviors of Cu(II) with DOM from sludge-based biochars and agricultural soil: Effect of pyrolysis temperature. Chemosphere 2020, 250, 126184. [Google Scholar] [CrossRef]
- Rajapaksha, A.U.; Ok, Y.S.; El-Naggar, A.; Kim, H.; Song, F.; Kang, S.; Tsang, Y.F. Dissolved organic matter characterization of biochars produced from different feedstock materials. J. Environ. 2019, 233, 393–399. [Google Scholar] [CrossRef]
- Tang, J.; Li, X.; Luo, Y.; Li, G.; Khan, S. Spectroscopic characterization of dissolved organic matter derived from different biochars and their polycylic aromatic hydrocarbons (PAHs) binding affinity. Chemosphere 2016, 152, 399–406. [Google Scholar] [CrossRef]
- Wei, S.; Zhu, M.; Fan, X.; Song, J.; Peng, P.; Li, K.; Jia, W.; Song, H. Influence of pyrolysis temperature and feedstock on carbon fractions of biochar produced from pyrolysis of rice straw, pine wood, pig manure and sewage sludge. Chemosphere 2019, 218, 624–631. [Google Scholar] [CrossRef]
- Wei, S.; Zhu, M.; Song, J.; Peng, P. Comprehensive characterization of biochars produced from three major crop straws of China. Bioresources 2017, 12, 3316–3330. [Google Scholar] [CrossRef]
- Xiao, X.; Chen, B. A direct observation of the fine aromatic clusters and molecular structures of biochars. Environ. Sci. Technol. 2017, 51, 5473–5482. [Google Scholar] [CrossRef] [PubMed]
- Wei, J.; Tu, C.; Yuan, G.; Bi, D.; Wang, H.; Zhang, L.; Theng, B.K.G. Pyrolysis Temperature-dependent changes in the characteristics of biochar-borne dissolved organic matter and its copper binding properties. Bull. Environ. Contam. Toxicol. 2019, 103, 169–174. [Google Scholar] [CrossRef] [PubMed]
- Mcknight, D.M.; Boyer, E.W.; Westerhoff, P.K.; Doran, P. Spectrofluorometric characterization of dissolved organic matter for indication of precursor organic material and aromaticity. Limnol. Oceanogr. 2001, 46, 38–48. [Google Scholar] [CrossRef]
- Sharpless, C.M. Lifetimes of triplet dissolved natural organic matter (DOM) and the effect of NaBH4 reduction on singlet oxygen quantum yields: Implications for DOM photophysics. Environ. Sci. Technol. 2012, 46, 4466–4473. [Google Scholar] [CrossRef] [PubMed]
- Xu, F.; Wei, C.; Zeng, Q.; Li, X.; Alvarez, P.J.J.; Li, Q.; Qu, X.; Zhu, D. Aggregation behavior of dissolved black carbon: Implications for vertical mass flux and fractionation in aquatic systems. Environ. Sci. Technol. 2017, 51, 13723–13732. [Google Scholar] [CrossRef] [PubMed]
- Balmer, B.; Ylitalo, G.; Watwood, S.; Quigley, B.; Bolton, J.; Mullin, K.; Rosel, P.; Rowles, T.; Speakman, T.; Wilcox, L.; et al. Comparison of persistent organic pollutants (POPs) between small cetaceans in coastal and estuarine waters of the northern Gulf of Mexico. Mar. Pollut. Bull. 2019, 145, 239–247. [Google Scholar] [CrossRef]
- Sánchez-Avila, J.; Vicente, J.; Echavarri-Erasun, B.; Porte, C.; Tauler, R.; Lacorte, S. Sources, fluxes and risk of organic micropollutants to the Cantabrian Sea (Spain). Mar. Pollut. Bull. 2013, 72, 119–132. [Google Scholar] [CrossRef]
- Zhao, Q.; Fang, Q.; Liu, H.; Li, Y.; Cui, H.; Zhang, B.; Tian, S. Halide-specific enhancement of photodegradation for sulfadiazine in estuarine waters: Roles of halogen radicals and main water constituents. Water Res. 2019, 160, 209–216. [Google Scholar] [CrossRef]
- Zhou, C.; Chen, J.; Xie, H.; Zhang, Y.; Li, Y.; Wang, Y.; Xie, Q.; Zhang, S. Modeling photodegradation kinetics of organic micropollutants in water bodies: A case of the Yellow River estuary. J. Hazard. Mater. 2018, 349, 60–67. [Google Scholar] [CrossRef]
- Mack, J.; Bolton, J.R. Photochemistry of nitrite and nitrate in aqueous solution: A review. J. Photochem. Photobiol. A 1999, 128, 1–13. [Google Scholar] [CrossRef]
- Ou, Q.; Xu, Y.; He, Q.; Wu, Z.; Ma, J.; Huangfu, X. Deposition behavior of dissolved black carbon on representative surfaces: Role of molecular conformation. J. Environ. Chem. Eng. 2021, 9, 105921. [Google Scholar] [CrossRef]
- Liu, H.; Ge, Q.; Xu, F.; Qu, X.; Fu, H.; Sun, J. Dissolved black carbon induces fast photo-reduction of silver ions under simulated sunlight. Sci. Total Environ. 2021, 775, 145897. [Google Scholar] [CrossRef]
- Li, C.; Che, X.; Bai, Y.; Shi, X.; Su, R. Indirect Photodegradation of Sulfamethoxazole in Water. Environ. Sci. 2019, 40, 8. [Google Scholar]
- Dong, X.; Ma, L.; Gress, J.; Harris, W.; Li, Y. Enhanced Cr(VI) reduction and As(III) oxidation in ice phase: Important role of dissolved organic matter from biochar. J. Hazard. Mater. 2014, 267, 62–70. [Google Scholar] [CrossRef]
- Lu, Q.; Liu, Y.; Li, B.; Feng, L.; Du, Z.; Zhang, L. Reaction kinetics of dissolved black carbon with hydroxyl radical, sulfate radical and reactive chlorine radicals. Sci. Total Environ. 2022, 828, 153984. [Google Scholar] [CrossRef]
- Luo, L.; Chen, Z.; Lv, J.; Cheng, Y.; Wu, T.; Huang, R. Molecular understanding of dissolved black carbon sorption in soil-water environment. Water Res. 2019, 154, 210–216. [Google Scholar] [CrossRef]
- Wenk, J.; Eustis, S.N.; Mcneill, K.; Canonica, S. Quenching of excited triplet states by dissolved natural organic matter. Environ. Sci. Technol. 2013, 47, 12802–12810. [Google Scholar] [CrossRef]
- Kelly, M.M.; Arnold, W.A. Direct and indirect photolysis of the phytoestrogens genistein and daidzein. Environ. Sci. Technol. 2012, 46, 5396–5403. [Google Scholar] [CrossRef]
- Wei, X.; Chen, J.; Xie, Q.; Zhang, S.; Li, Y.; Zhang, Y.; Xie, H. Photochemical behavior of antibiotics impacted by complexation effects of concomitant metals: A case for ciprofloxacin and Cu(II). Environ. Sci. Process. Impacts 2015, 17, 1220–1227. [Google Scholar] [CrossRef]
- Xie, Q.; Chen, J.; Zhao, H.; Qiao, X.; Cai, X.; Li, X. Different photolysis kinetics and photooxidation reactivities of neutral and anionic hydroxylated polybrominated diphenyl ethers. Chemosphere 2013, 90, 188–194. [Google Scholar] [CrossRef] [PubMed]
- Mcneill, K.; Canonica, S. Triplet state dissolved organic matter in aquatic photochemistry: Reaction mechanisms, substrate scope, and photophysical properties. Environ. Sci. Process. Impacts 2016, 18, 1381–1399. [Google Scholar] [CrossRef] [PubMed]
- Chen, Y.; Sun, K.; Wang, Z.; Zhang, E.; Yang, Y.; Xing, B. Analytical methods, molecular structures and biogeochemical behaviors of dissolved black carbon. Carbon Res. 2022, 1, 23. [Google Scholar] [CrossRef]
- Zhang, P.; Shao, Y.; Xu, X.; Huang, P.; Sun, H. Phototransformation of biochar-derived dissolved organic matter and the effects on photodegradation of imidacloprid in aqueous solution under ultraviolet light. Sci. Total Environ. 2020, 724, 137913. [Google Scholar] [CrossRef]


Disclaimer/Publisher’s Note: The statements, opinions and data contained in all publications are solely those of the individual author(s) and contributor(s) and not of MDPI and/or the editor(s). MDPI and/or the editor(s) disclaim responsibility for any injury to people or property resulting from any ideas, methods, instructions or products referred to in the content. |
© 2023 by the authors. Licensee MDPI, Basel, Switzerland. This article is an open access article distributed under the terms and conditions of the Creative Commons Attribution (CC BY) license (https://creativecommons.org/licenses/by/4.0/).