Abstract
Since Yarrowia lipolytica, an oily yeast, contains many valuable products as biomass, to increase its widespread use, it is very important to develop a sustainable production model. In this study, the production of high acid hydrolysate from sawdust biomass, which is produced in very high amounts in our environment, and the effect of these products on the growth efficiency of Yarrowia lipolytica were investigated. A preliminary statistical analysis was carried out to assess sugar production from sawdust by hydrolysis, which estimated 85% of total sugar recovery (TSR) using 96 g of sawdust, while TSR at the highest sawdust was as high as 79%. There was a higher loss in the recovery of C5 sugars with acid and time. This study revealed that Y. lipolytica could grow with high biomass yields in varying hydrolysate concentrations, approaching yields achieved in synthetic glucose media. The maximum biomass obtained was 13 and 26 g in batch and airlift operations, respectively, using organic nutrients. Biomass and lipid yields from kinetic modeling provided a close approximation to the experimental yields performed on an airlift reactor. It was found that Y. lipolytica biomass cultivated on sawdust hydrolysates had significant lipid and protein compositions, as high as 29 and 38%, respectively.
1. Introduction
Among lignocellulosic (LC) biomass, wood is one of the most prevalent, comprising 30.6% of the Earth’s land [1], and can be a source for biotechnological species to produce valuable products. Climate change mitigation has prompted policymakers to utilize woody biomass due to its energy potential [2]. The extensive route for wood valorization is in pellet form as a fuel source, with a global trade of 55.7 million metric tons [3]. Other than pellets, the utilization of decomposed wood via microbial transformation provides products such as biofuels such as ethanol, butanol, and bio-oils [4,5].
Liquidation of LC sugars in wood is accomplished by hydrolysis via acid, alkali, or enzymatic routes. During acid hydrolysis, cellulose and hemicellulose decompose into liquid, and acid-insoluble lignin (AIL) is separated. Other compounds, such as weak acids (acetic, formic, and levulinic), furans (furfural, hydroxymethylfurfural), and phenols (vanillin, syringaldehyde), may be formed [6]. In plant cell walls, recalcitrance is caused by structural or chemical factors (cellulose-specific surface area, crystallinity, degree of polymerization, pore size, lignin, hemicellulose, and acetyl group composition [7]), which could be overcome by decrystallization of LC biomass to achieve high sugar recovery.
The acid hydrolysis process that involves a prior decrystallization step of the biomass enhances the hydrolysis process for higher sugar recovery, which is generally performed at a solid/acid ratio of 0.3–0.8 at a temperature of 20–30 °C using a concentrated 70–80 weight percent acid density. In this process, a portion of the sugar is solubilized in 30–60 min. The slurry is diluted to 20–30 wt%, and hydrolysis is completed at 80–100 °C for 0.5–2 h [8]. This concentrated acid (CA) decrystallization before hydrolysis is advantageous due to its high sugar recovery if it is optimized to prevent the degradation of sugar and the formation of byproducts due to temperature and residence time conditions. In addition, cost efficiency can be increased with acid recovery units such as cation exchange resins, evaporators, and condensers [9]. During hydrolysis, polymeric fractions of LC biomass hydrolyze into oligomers or monomers, except insoluble lignin. Acid solutions react with hemicellulose and cellulose to break ester and ether bonds, resulting in soluble saccharides. The main pathways involve the degradation of cellulose into glucose and hemicelluloses into monosugars such as xylose, arabinose, and mannose. The breakdown of a portion of lignin and carbohydrates generates phenol and phenolic compounds [10]. Degradation of polymeric components may also release inorganic components [11]. Dehydration and decarboxylation take place simultaneously after hydrolysis, which further degrades products into organic acids and furfurals such as 5-HMF, erythrose, and aldehydes [11].
Today, the production of valuable microbial products by oleaginous yeast is intensively studied by more economical means, especially leaning on waste feedstocks such as lignocellulosic biomass, industrial waste, or food waste with a rich carbon content necessary for growth. Oleaginous yeast requiring a high amount of carbon for maximum biomass and lipid accumulation can utilize various carbon sources as well as lignocellulosic C6 and C5 sugars such as glucose, galactose, mannose, arabinose, and xylose. Although various species were studied in acid hydrolysates, a few studies were reported related to oleaginous yeast in acid hydrolysates of wood biomass to explain yeast’s biomass and lipid production capacity [9,12]. It has been shown that various microbial species can grow with high productivity in CA hydrolysates [9]. Detoxification may be necessary when highly inhibited hydrolysates are fermented if the inhibitors accumulate due to the recirculation of streams or if organisms with low inhibitor tolerance are used [13]. Some studies have attempted to identify the inhibition levels of byproducts on microbial species, i.e., oleaginous fungi, in acid hydrolysates of LC biomass. However, the effects of compounds such as HMF, furfural, and organic acids in terms of inhibitory concentration and influenced species were not yet well explained. Taking into account the significant carbon demand of oleaginous yeast, which could be supplied by the high sugar yield of acid hydrolysis of wood, this study searched for the production of oleaginous yeast, Y. lipolytica, grown on wood hydrolysates obtained through sulfuric acid hydrolysis. The yeast biomass composition consists of lipids, a beneficial protein with essential amino acids, as well as vitamins and minerals that may be utilized as biodiesel or nutritious feedstuffs for animals [14]. The strain used in this study has a high biomass production potential, which can yield valuable microbial products at a high rate [15]. This study was designed to improve the yield and cost-effectiveness of sugar products and advance the development of alternative methods of producing valuable microbial products. Moreover, this study assessed the hydrolysates’ effectiveness in producing lipids in the oleaginous yeast Yarrowia lipolytica, which can deposit intracellular lipids that account for more than 20% of their cell dry weight composition. With this aim, the hydrolysates produced in this study, consisting of lignocellulosic sugars, were amended with organic or inorganic nutrients to assess the biomass and lipid production of Y. lipolytica. In addition, they assessed protein and carbohydrate content.
The objective of this study is to produce oleaginous yeast in acid hydrolysates of wood due to the high sugar content of the wood. An assessment of the maximum total sugar recovery (TSR) per utilized acid for sustainable sugar production from wood was presented using a statistical approach. This included conditions of acidity, solidity, temperature, and time. Sawdust from the forest industry was considered a low-cost and widespread source of wood biomass. As part of the evaluation of microbial product production, lignocellulosic sugars in varying concentrations of the wood hydrolysate were analyzed in the production of the oleaginous yeast, Y. lipolytica, to assess the maximum biomass and lipid yields when using organic or inorganic nutrients. The findings of the batch study were utilized in the production of Y. lipolytica in an air lift bioreactor, as explained by a kinetic mass balance estimation.
2. Materials and Methods
2.1. Lignocellulosic Biomass
Pine wood sawdust was taken from a mill industry and then filtered through sieve No. 18 (1 mm) for homogeneity. According to the procedure of the New Renewable Energy Laboratory (NREL), moisture and ash contents were determined to be 9% and 1.4% by weight, respectively [16]. The characterization of the sawdust, including sugar and lignin components, was analyzed in Section 3.1. An elemental analysis (Table 1) of the sawdust hydrolysate using 240 g of sawdust according to the method in Section 2.2 was performed using IC (Dionex, ICS 3000, Sunnyvale, CA, USA).

Table 1.
Elemental analysis of the sawdust hydrolysate.
2.2. Acid Hydrolysis Conditions for Response Surface Methodology
Acid hydrolysis was performed in two stages. In decrystallization, samples were mixed with 72, 75, or 80 wt% sulfuric acid and stirred in a water bath for 30 min at 30 °C. The slurries were diluted 29% with deionized water to nearly 100 mL of 30 wt% acids. They were hydrolyzed at 105 °C using an autoclave for thermal stability. After autoclaving, the bottles were filtered at 0.45 µm. For five hydrolysis times, five parallels for each initial solid/acid of 0.3, 0.5, and 0.8, corresponding to 8.8, 14.6, and 23.4 g (dry wt.), were prepared in 250 mL glass reagent bottles. A total of 15 samples were prepared in parallel for each of the 72, 75, and 80 wt% acids (Table 2).
Table 2.
Experimental design for hydrolysis.
2.3. Analysis
2.3.1. Composition and Sugar Recovery of Sawdust
Sawdust composition in terms of sugars, acid-soluble (ASL), and AIL lignin was determined according to the NREL method for analysis using 72 wt% acid for decrystallization and 300 mg sawdust in 100 mL bottles [17]. Sawdust samples in triple were decrystallized at 30 °C, diluted to 4 wt%, and hydrolyzed at 105 °C for 60 min. ASL was measured at 240 nm in filtrates and then neutralized with Ca(OH)2 and 0.2 µm-filtered for sugar analysis.
Optimization hydrolysates (Table 2) were 1/7 diluted, neutralized, and filtered at 0.2 µm. The reducing sugars in all samples were measured by HPLC (High-Performance Liquid Chromatography, Shimadzu Prominence 20, Riverwood Drive Columbia, MD, USA) equipped with a refractive index detector and an Inertsil NH2 column (5 µm, 4.6 I.D. × 250 mm, GL Sciences Inc., Tokyo, Japan) using 75% acetonitrile at 40 °C, 1 mL/min flow rate, and 20 µL of injection. Using mixed solutions of D(+) xylose (Xyl), L(+) arabinose (Ara), D(+) mannose (Man), D(+) glucose (Glu), and D(+) galactose (Galac) supplied from Sigma Aldrich (St. Louis, MO, USA), a six-point calibration curve was established (Supplementary Figure S1). The hydrolysate was quantified using multiple-point external calibration. By testing control samples with each sample sequence, calibration accuracy and repeatability were confirmed. HPLC spectra of the mixed standard sugar solution for calibration curve are shown in Supplementary Figure S2.
A gas chromatograph (Shimadzu GC-2010) equipped with a flame-ionization detector and a TRB-FFAP capillary column with a film thickness of 0.25 µm has been used to determine volatile fatty acids (acetic acid, propionic acid, isobutyric acid, caproic acid, isocaproic acid, and heptanoic acid) [18]. For total phenol analysis, a 30 m × 0.25 mm TRB-FFAP capillary column was used. The injection port and detector temperatures were 240 °C and 230 °C, respectively. The analysis program consisted of increasing the oven temperature to 60 °C, holding for 6 min, and then ramping 60 °C to 140 °C (5 °C/min), ramping 140 °C to 280 °C (5 °C/min), and fixing at 280 °C for 1 min.
2.3.2. Statistical Analysis
Statistical analyses were conducted using the Minitab®16.1 Statistical Software Package (Minitab, LLC, State College, PA, USA). A Pearson product-moment correlation test was used to determine the correlation between acid (%, Cacid), solid (g, Csolid), and time (min, Ctime) on response variables, Xyl (g/L), Ara (g/L), Man (g/L), Glu (g/L), Galac (g/L), and total sugar recovery (TSR, %wt).
2.3.3. Response Surface Methodology
Three independent variables, namely, acid (%, Cacid), solid (g, Csolid), and time (min, Ctime), on the response variables Xyl (%), Ara (%), Man (%), Glu (%), Galac (%), and total sugar recovery (TSR %), were estimated using multivariable regression analyses, and polynomial regression was used to perform accurate predictions for the second-order polynomial equation using Design Expert v12 software (Stat-Ease, Inc., Minneapolis, MN, USA). Table 3 shows the ranges of the variables tested. To be able to analyze the acid concentration with at least three points above 70%, 72% was selected as the lowest point, which is the concentration used in the NREL procedure for analysis of LC biomass. The two next were taken as midpoints to 70% at 75% and 80%, since it would be unfavorable above 80% considering neutralization; likewise, three conditions of the solid parameter were selected as solid/CA of 0.3, 0.5, and 0.8, which is more applicable than ratio 1 for reactions.
Table 3.
Experimental design.
2.3.4. Fourier Transform Infrared Spectroscopic (FT-IR) Analysis
FT-IR analysis of raw sawdust and hydrolyzed sawdust residue, lignocellulosic sugars, and yeast biomass was conducted using an FT-IR spectrometer (Spectrum 100 FT-IR Spectrometers, Perkin Elmer, Waltham, MA, USA) equipped with a single-reflective ATR (Attenuated Total Reflection) diamond. The spectrometer measurements were recorded in the range between 4000 and 550 cm−1 with a minimum resolution power of 0.4 cm−1. Sawdust residue after hydrolysis was washed to remove acids and dried after centrifugation. D(+) xylose, L(+) arabinose, D(+) mannose (Man), D(+) glucose, and D(+) galactose were used for LC sugar spectra analysis. For yeast biomass analysis, lyophilized yeast biomass samples were obtained from fermented sawdust hydrolysate and YPD media.
2.4. Fermentation of Yarrowia lipolytica in CA Hydrolysates of Sawdust
Due to its ability to ferment hydrolysates containing more glucose, Yarrowia lipolytica was selected for the fermentation process [19]. Hydrolysate media changed in their total lignocellulosic sugar concentration. To analyze the fermentability of the oleaginous yeast, Y. lipolytica, biomass growth, lipid, protein, and carbohydrate content of sawdust were determined using hydrolyzed sawdust hydrolyzed with 80 wt% CA for 10 min. A sawdust hydrolysate sample was prepared using 240 g of sawdust in a 1 L final volume in a 2 L working volume of reagent glass bottles according to the same process as in Section 2.2. Neutralization was performed in a cooling bath using an 18 M NaOH solution applied to acid hydrolysates brought to 15 wt% and then filtered through a 0.45 µm membrane filter.
2.4.1. Seed Culture
Seed inoculum was prepared via a subgeneration culture of Yarrowia lipolytica strain MUCL 28,849 grown in YPD media (yeast extract 10 g/L, peptone 20 g/L, and D-glucose 20 g/L) at 300 rpm at 28 °C for 3 days until the stationary phase.
2.4.2. Growth Conditions
Y. lipolytica growth was analyzed on two different sets of media. This was to assess the effect of hydrolysate media in terms of nutrient source and hydrolysate sugar concentration on biomass as a VSS and lipid content of cell dry weight (CDW%). In addition, it was to assess biomass composition. To evaluate growth based solely on the utilization of sugars in the hydrolyses, the first set analyzed the growth of Y. lipolytica using inorganic supplemental nutrients such as nitrogen, phosphorous, and micronutrients (Table 4). In the second set, supplementation of two organic nutrients, yeast extract and peptone, was investigated, which were very rich nutrient sources for seed culture YPD.
Table 4.
Growth conditions of Y. lipolytica in sawdust hydrolysates.
Inoculum of about 0.5 mL (2.5%, v/v) taken from the YPD seed culture was centrifuged at 2500 rpm for 3 min, and the supernatant was removed. The inoculum was washed and centrifuged again. Parallel batch samples in 100 mL conical flasks, including 20 mL of each medium, namely the wood hydrolysate supplied either with inorganic or organic nutrients that had four different sugar concentrations of 10, 20, 40, and 60 g TS/L, and others for comparison such as synthetic glucose and YPD, were inoculated with seed inoculum to start the fermentation with an initial pH of 6.0 and optical density of 0.7 as OD600. The flasks were incubated in a shaker incubator at 300 rpm and 28 °C. Culture growth was determined by measuring OD for five days, and samples were then measured for biomass growth using VSS. In addition, lipid, protein, and carbohydrate contents were calculated as CDW%.
A defined medium with nutrient supplements was chosen for studying the effect of nutrient addition on the hydrolysates contained (g/L): KH2PO4, 3.0; MgSO4·7H2O, 1.0; ZnSO4·7H2O, 0.040; FeSO4·7H2O, 0.016; MnSO4·H2O, 0.0038; CaCl2·2H2O, 0.023; CoCl2·6H2O, 0.0005; CuSO4·5H2O, 0.0009; Na2MoO4·2H2O, 0.00006; H3BO3, 0.003; and (NH4)2SO4 for a C/N molar ratio of 20 for each medium. As part of the fermentation analysis of Y. lipolytica with organic nutrients, 10 g of YE (yeast extract) and 20 g of peptone (P) were supplied to wood hydrolysates, which changed in their total sugar concentration between 10 and 60 g TS/L.
2.4.3. Compositional Analysis of Y. lipolytica Biomass
Lipid Analysis
The lipid content (%, w/w) of Y. lipolytica biomass was quantified using the sulfo-phospho-vanillin (SPV) method. The comparison of SPV with Blight Dyer and ethanol-hexane solvent system is shown in Supplementary Figure S3. A centrifuge was used to separate the cells from the medium. The cells were then lyophilized after being washed twice in PBS. A high-speed cell disruptor disrupted lyophilized cells. A mixture of known amounts of disrupted cells and 2 mL of concentrated sulfuric acid (98%) was placed in glass tubes and heated for 10 min at 100 °C. During the cooling process, the glass tubes were kept at room temperature for 10 min. A vanillin-phosphoric acid solution of 4 mL was added to the tubes, and the tubes were incubated at 37 °C for 15 min and then cooled to room temperature. The reaction between the phospho-vanillin reagent and the lipid produced a pink color, whose intensity was evaluated using a spectrophotometer at 530 nm. The amount of lipids was determined using a standard curve created from Y. lipolytica biomass with the following equation: y = 0.706x.
Carbohydrate Analysis
The carbohydrate analysis was performed using the Anthrone method [20]. The samples and solutions were studied by placing them in an ice bath. A 100°C hot water bath was prepared beforehand. For the calibration curve, 0.05 g of glucose was dissolved in 500 mL of double-distilled water and diluted into the main stock solution. For the calibration curve, glucose intermediate solutions at 0–100 mg/L were prepared. A 1 mL sample was taken into a glass tube, and 2 mL of 75% sulfuric acid was added and vortexed. Then, 4 mL of Anthrone solution was added to the sample and vortexed again. The samples were left to cool by incubating at 100 °C for 15 min. Measurements were made at 630 nm in distilled water.
Protein Analysis
A modified version of Lowry et al.’s [21] and Gerhard et al.’s [20] methods was used to analyze the proteins. The following solutions were prepared: 2.86 g NaOH and 14.31 g Na2CO3 were dissolved in 500 mL of distilled water (Solution A). An amount of 1.42 g of copper sulfate heptahydrate was dissolved in 100 mL of distilled water (Solution B). An amount of 2.86 g of sodium tartrate was dissolved in 100 mL of distilled water (Solution C). Lowry’s solution was prepared by mixing 100/1/1 from solutions A, B, and C. Folin Solution: Since it is light-sensitive, it was prepared in a Falcon wrapped in aluminum 5 min before use. An amount of 6 mL of distilled water was added to 5 mL of Folin reagent, 0.05 g of bovine serum albumin was dissolved in 500 mL of double-distilled water for the calibration curve, and the main stock solution was added. BSA intermediate solutions were prepared between 0 and 100 mg/L for the calibration curve. As a pre-treatment, the samples were boiled with 2N NaOH at 1:1 (v/v) for 10 min. An amount of 1 mL of a sample at room temperature was mixed with 700 µL of Lowry solution. After vortexing, it was left in the dark at room temperature for 20 min. Folin solution was prepared 5 min before 20 min. An amount of 100 µL of Folin solution was added to the mixture and vortexed. Samples were kept in the dark for at least 30 min. Samples were read against distilled water at 750 nm.
2.4.4. Kinetics
In the fermentation of Yarrowia lipolytica, microbial specific growth rate can be determined using Michelis–Menten kinetics in Equation (1) [22,23]:
where µ is the specific growth rate of the yeast, µmax is the maximum specific yeast growth rate, Ks is the saturation constant of substrates, and Cs is the concentration of substrates.
Specific lipid production rate can be calculated using the Equation (2):
where and are the lipid concentrations at the end and start of the bioreactor operation, t is the time of the cultivation period, and is the concentration of the yeast biomass.
When the airlift bioreactor was considered for Yarrowia lipolytica growth, the material balance could be calculated as follows (Equations (3)–(5)) [24]:
where is the concentration of the produced lipids (g/L) and α and β are the empirical constants.
where refers to lipid production rate and α. µ represents the cell growth.
2.4.5. Material Balance for Lipid Production from Y. lipolytica Culture
Airlift bioreactors were assumed to be used in the continuous production of lipids. A view of an airlift bioreactor is shown in Figure 1.
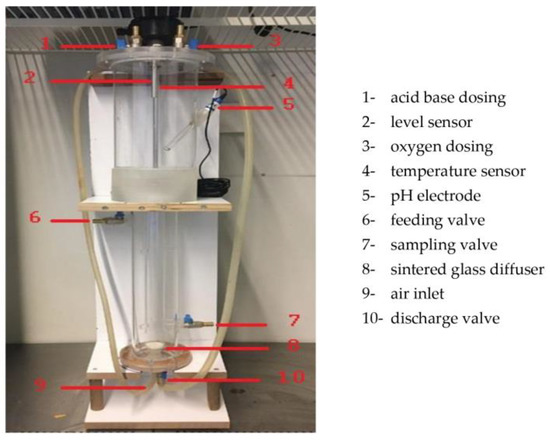
Figure 1.
A view of the airlift bioreactor used in this study.
Material balance for biomass:
Material balance for substrate (concentrated acid hydrolysate):
Material balance for lipid:
Vr represents the volume of the reactor, F is the flow rate of the substrate feeding to the airlift bioreactor, and denote the initial and final concentration of the yeast biomass in the airlift bioreactor, and denote the initial and final concentration of the substrates in the airlift bioreactor, and denote the initial and final concentration of the lipid in the airlift bioreactor, represents the substrate consumption yield, represents the lipid production yield, represents the death rate of the yeast cell, rs represents substrate consumption rate, ry represents the yeast growth rate, and rp represents the lipid production rate (.
2.4.6. Airlift Bioreactor
A bioreactor with airlift capability was chosen as the most appropriate method for Yarrowia lipolytica culture growth (Figure 1). This is because it does not require mechanical stirring, as mixing is accomplished through aeration. The reactor used in this study was placed in an incubator that could keep its environment constant at the desired temperature. Air was used by passing through filters. Sintered glass diffuser was used for air intake in the reactor. An Enhell TC-AC 190/6/8 compressor was used to give air to the system controlled by an automation system. The amount of air entering the bioreactor with the compressor was regulated using a valve.
Yarrowia lipolytica was cultivated in the air lift bioreactor in a batch study using a growth medium with an initial pH adjustment of 6.0, at 28 ± 2 °C, and with 7 L/min of air. The medium contained wood hydrolysate with a sugar content of 20 g TS/L and a working volume of 3 L. The media was seeded with an inoculum cultivated in a seed culture with the same media composition in a 250 mL volume of a 500 mL shake flask to start with an initial biomass concentration of an OD600 of 0.7. The hydrolysate was supplied with 20 g of peptone and 10 g of yeast extract per liter. Growth in the air-lift bioreactor was monitored during 5 days of cultivation by measuring OD600 by sampling from the sampling valve once a day. Biomass as VSS was measured immediately at the end of cultivation. Biomass sample was recovered from 200 mL of fermented hydrolysate using a centrifuge and stored at −20 °C until lyophilization for dry biomass analysis of lipid content.
3. Result
3.1. Composition of Sawdust and Hydrolysates
The composition of sawdust was presented in Figure 2 for detecting sugar components to be analyzed according to the NREL procedure (72 wt%, 0.1 solid/CA), which is commonly used in the literature. Sawdust was rich in sugars like those of pine species, especially Glu, providing a valorized biomass.
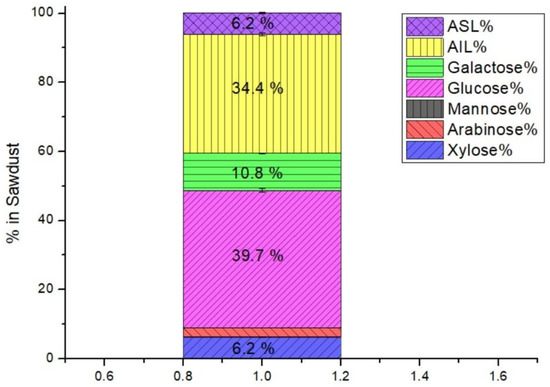
Figure 2.
Compositional analysis of pine sawdust.
The sawdust composition by dry weight was similar to that of other pines for Glu and hemicelluloses [12,25]. The largest fraction was 40% glu, representing the cellulose known as Glu polymer, as reported for pine as 39.9% [26], 43.6% [27,28], 45.6% [8], and 46.6% [29]. Hemicellulose was 19.8%, comparable with other pine (21%) [30], palm (19%) [31], and eucalyptus (23.8%) [32]. Galac was higher than the C5 sugars Xyl and Ara in sawdust abundant in crop plants and grasses. The AIL of 34.2%, characterized by 20–25% and 25–35% for hard and softwood, respectively [33], increases recalcitrance. Softwood lignin is composed of syringyl and guaiacyl, causing a fibrillous structure [34].
Figure 3 shows the composition of sawdust hydrolysates with different total sugar content levels (20–60 g/L). In acid hydrolysates with 20 g TS/L, acetic acid had the highest concentration, while heptanoic acid had the lowest. Apart from that, acid hydrolysates with a TS/L of 60 had the highest levels of total phenol. As stated by Konzock et al. [19], Yarrowia lipolytica can grow up to 75 mM acetic acid, which is 1.35-fold higher than our study. In the study by Sarris et al. [35], the phenol concentration was 2.90 g/L, which is 1.07–1.58-fold higher than this study and showed as high biomass as the no phenol added condition.
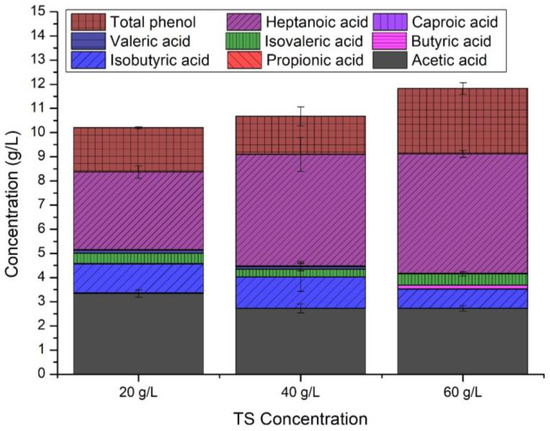
Figure 3.
Compositional analysis of acid hydrolysate of pine sawdust.
3.2. Optimization of Sugar Content and Total Sugar Recovery Using Response Surface Methodology
Optimization of hydrolysis conditions (acid, solid, and time) for maximum recovery of LC sugars can be a significant step from both an economical and efficiency point of view. In this study, three independent variables, Cacid, Csolid, and Ctime, were evaluated using experimental findings and optimized using Design Expert v12 (Supplementary Table S1). Xyl (%), Ara (%), Man (%), Glu (%), Galac (%), and TSR (%) were considered as responses, and analysis of variance (ANOVA) confirmed the model (Supplementary Tables S2 and S3).
3.2.1. Recovery of Single Lignocellulosic Sugars
Regression analysis was applied to Xyl as a function of three independent variables, Cacid, Csolid, and Ctime, and a quadratic polynomial Equation (12) was obtained. The significance of the equation was confirmed using ANOVA with a coefficient of determination (R2 = 0.83) and was statistically significant (p < 0.05). The optimum conditions for the highest Xyl (97.034%) were Cacid = 77.747%, Csolid = 88.391 g, and Ctime = 10.014 min. The quadratic polynomial Equation (13) is the result of a regression analysis of Ara recovery. R2 = 0.7325 and significance (p < 0.05) was confirmed. The optimum was Cacid = 77.328%, Csolid = 89.281 g, and Ctime = 11.068 min, yielding the highest Ara (93.376%). A second-order polynomial regression model was employed for mannose. It was observed that the lack of fit was significant, with a predicted R2 of 0.3535, which was not close to the adjusted R2 of 0.5708, as the difference was more than a reasonable range of 0.2. Therefore, this model did not accurately represent the data in the experimental region. Regression analysis was performed on Glu recovery, yielding the quadratic polynomial Equation (14). The predicted R2 of 0.7779 is as close to the adjusted R2 of 0.7071 as one might typically expect, i.e., the difference was in a reasonable range (<0.2). The optimum for the highest Glu (82.406%) was derived as Cacid = 80%, Csolid = 145.915 g, and Ctime = 10 min. Regression analysis was applied to Galac recovery within the function of the independent variables Cacid, Csolid, and Ctime, and the following quadratic polynomial Equation (15) was obtained. The equation was statistically significant (p < 0.05), with R2 = 0.8503. The optimum condition for the highest Galac recovery (89.956%) was Cacid = 79.449%. Csolid = 88 g, and Ctime = 10 min.
Three-dimensional response surface plots were generated to analyze the interactions between independent variables and predict the optimum values for each variable at their maximum values. The surface responses of Xyl, Ara, Glu, and Galac as a function of acid vs. solid and acid vs. time are presented in Figure 4. Xyl and Ara were more planar, while Glu and Galac were more quadratic.
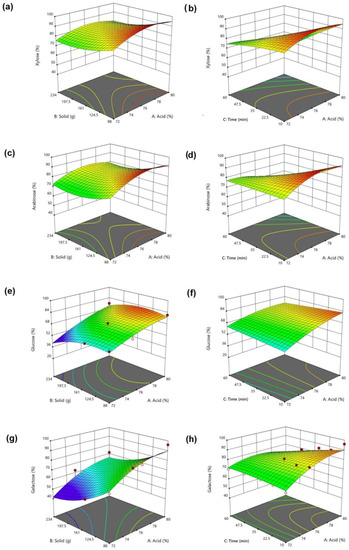
Figure 4.
Maximum recoveries for single sugars wrt. acid vs. solid and acid vs. hydrolysis time. (a,b) xylose; (c,d) arabinose; (e,f) glucose; (g,h) galactose individually.
Xyl and Ara recovery increased for lower solids, with maxima of 95 and 92.7%, respectively. Galac increased from 53.4 to 96.1% with acid, reaching 80%. The maximum Glu was 82.4% when 146 g was solid. Maximum recoveries were estimated at the lowest time and highest acid. In addition, the maximum recovery for all sugars driven by RSM was as high as Xyl 95.7771%, Ara 93.3942%, Glu 77.7577%, and Galac 89.9515% under the same conditions of Cacid = 79.554%, Csolid = 88 g, and Ctime = 10.000 min (Supplementary Figure S4). Considering the Pearson correlation results, there was a strong positive correlation between the solid amount and Xyl (r = 0.829 p = 0.000), Ara (r = 0.846 p = 0.000), Glu (r = 0.854 p = 0.000), and Galac (r = 0.872 p = 0.000). Furthermore, there was a negative and moderate correlation between solids and TSR (r = −0.582 p = 0.001). Additionally, there was a very strong positive correlation between Galac and Glu (r = 0.919 p = 0.000) but a moderate correlation between Galac and Man (r = 0.646 p = 0.000). Additionally, Ara was strongly correlated with Man (r = 0.705 p = 0.000) and Glu (r = 0.782 p = 0.000) and very strongly correlated with Galac (r = 0.918 p = 0.000). In addition, Xyl was strongly correlated with Man (r = 0.692 p = 0.000) and Glu (r = 0.786 p = 0.000) and very strongly correlated with Ara (r = 0.988 p = 0.000) and Galac (r = 0.911 p = 0.000).
3.2.2. Total Sugar Recovery
According to the regression analysis for TSR within the function of independent variables Cacid, Csolid, and Ctime, the following quadratic polynomial Equation (16) was obtained: An ANOVA confirmed that R2 = 0.8343 was statistically significant (p < 0.05). The optimum conditions for the highest TSR (84.682%) were Cacid = 80.00%, Csolid = 95.468 g, and Ctime = 10.000 min. The response surface plots (Figure 5) present the effect of interactions between solid and acid, acid and time, and solid and time on TSR. The optimum conditions for each independent variable that maximize sugar recovery can be observed. The highest TSR (84.68%) was derived from the independent variables Cacid = 80.00%, 95.47 g sawdust, and 10 min. Response surface optimization showed TSR was more affected by the acid-solid relationships. Three zones were observed in the quadratic TSR, which ranged between 48 and 87 (Figure 5a). The TSR was >80% in the red zone for solids between 88 and 161 g in an acid range of 78–80%. An acid content of 74% was less effective for recovery below 60%. The TSR increased from 72% to 80% in 10 min (Figure 4b). The effect of time on TSR was destructive at higher acid concentrations. Interestingly, increasing the time did not improve the TSR for high solids (Figure 4c).
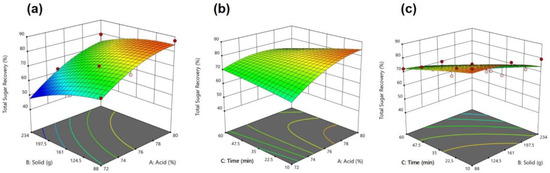
Figure 5.
Maximum TSR with respect to (a) acid vs. solid; (b) acid vs. time; (c) solid vs. time.
The autoclave contributed to the hydrolysis duration by heating slowly to 105 °C. Therefore, a relatively shorter residence time of 10 min at 105 °C than the 30 min with 80% acid reported [8] was reasonable. As a result of the acidity and the high temperatures, inhibitors were primarily increased [36,37]. However, longer times were reported, such as 90% glucan from reeds in 2 h [36]. An RSM optimization for wastepaper found an optimum time of 3.6 h and an acidity of 71% for a predicted value of 94% Glu [37]. The positive effect of time was more related to dilute acid hydrolysis. TSR increased with time using dilute acid in an RSM optimization of eucalyptus wood chips in 25 min and Teff straw in 55 min [32,38]. Accordingly, the longer time was found to result in a decrease in sugar yield in a CA hydrolysis of sawdust, similar to what was observed in a dilute acid hydrolysis of beechwood, which yielded an optimal amount of Xyl [39].
Based on the optimization of the maximum TSR, the optimum condition of variables suggested by the second-order quadratic experiment model (Figure 5) is an acid concentration of 80.0%, a solid of 95.47 g, and a hydrolysis time of 10 min, for a predicted value for the TSR of 84.68%. The model was validated considering the root-mean-square deviation (RMSD) values, as shown in Table 5. The RMSD percentage was less than 4.50% for each response. The predicted data are a good representation of the output of the model. In addition, the solid amount showed a statistical correlation with single and TSRs, which makes it the most critical parameter for the hydrolysis of pine sawdust.
Table 5.
Validation of the model.
A maximum TSR of 87% was obtained using 80% acid on 88 g of sawdust for 10 min. For 75%, 79% TSR was reached using 146 g/L in 30 min. In total, 80% acid resulted in a higher TSR for all solids. In the CA hydrolysis of pine, the maximum TSR obtained was 64% [37] and 78% [8] (Table 6). According to Xyl, Ara, Glu, and Galac, the conditions changed for C5 and C6 sugars. C5 required fewer extreme conditions. C5 loss indicated low durability. Notably, studies showed a high C5 recovery with decreased acidity. Eucalyptus was recovered 100% by 1.5% acid [40]. The opposite was true for C6, which resulted in a lower Glu of 40% from pine [41] and 12% from softwood chips [42]. Similarly, 70% Ara recovery from sugar beet pulp was achieved with 2% H2SO4, while Glu was only 14% [43]. The structure of biomass is usually associated with acid hydrolysis intensity. Biomass structures with lower lignin contents could be hydrolyzed less vigorously. In contrast, biomass with greater lignin contents, such as softwood, could be hydrolyzed under more stringent conditions. A kinetic model for southern yellow pretreated pine sawdust demonstrated 41% Glu conversion in 3 min at 130 °C [44]. Similarly, CA hydrolysis of spruce and birch resulted in a high sugar yield of 70% TSR [27]. Sawdust in this study with a high AIL (35%) achieved a higher TSR with 80% acid, especially for 234 g of sawdust with a high recovery of Glu, but the recovery of hemicellulosic sugars was similar with the use of 75% acid.
Table 6.
Recent studies on CA hydrolysis of woody biomass.
3.3. Growth of Y. lipolytica in Sawdust Hydrolysate
The growth of Y. lipolytica in the sawdust hydrolysates (SwH) changed in lignocellulosic sugar concentration between 10 and 60 g/L and was analyzed in terms of inorganic and organic nutrients for biomass and lipid production (Figure 6). The biomass and lipid content of Y. lipolytica grown in sawdust hydrolysates with inorganic supplements are shown in Figure 6a. Yeast growth in glucose media with the same concentration range was analyzed for comparison. The biomass concentration in the hydrolysates was close to synthetic glucose media for each concentration. Lipid production by the yeast increased with the concentration of the media, reaching a maximum of 25.3% at 60 g Total Solids (TS)/L, similar to the increasing aspect of biomass. Approximately the same amount of lipid content, changing between 17 and 25%, was obtained in the yeast biomass using inorganic nutrients. The yeast was more productive at a sugar concentration between 20 and 40 g TS/L in terms of both biomass and lipid production efficiency.
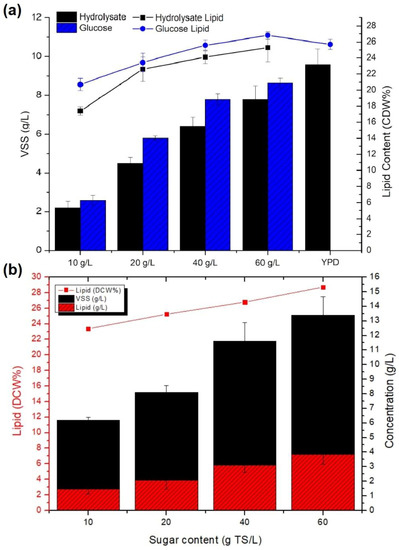
Figure 6.
Biomass and lipid production of Y. lipolytica in sawdust sugar hydrolysates within a concentration range of 10–60 g TS/L amended with (a) inorganic nutrients and (b) organic nutrients (YP).
One of the outcomes of this study is that wood hydrolysate did not cause a serious inhibition on Y. lipolytica, which could produce more than 80% of the biomass obtained in the synthetic glucose solution in Figure 6a. The difference between glucose and wood hydrolysate could be partly attributed to the slower growth rate of the mixed C5 and C6 LC sugars in wood hydrolysate in comparison with C6 sugar glucose. The inhibitory effects of various byproducts of lignocellulosic hydrolysates such as HMF, furfural, vanillin, syringealdehyde, and organic acids were investigated in several studies. Acetic acid caused an inhibition of 50% on Trichosporon cutaneum and 10% on the growth of Rhodosporidium toruloides in the presence of 25 and 4 g/L acetic acid, respectively [47,48].
Effective inhibitory doses were usually above 1 g/L for organic acids, while doses of furfural <1 g/L could inhibit Rhodosporidium toruloides [49], Rhodotorula glutinis, and Lipomyces starkeyi [50]. Moreover, the synergetic effect of inhibitory compounds such as formic and acetic, together with furfural and vanillin, caused a higher inhibition of Rhodotorula glutinis [49]. In this study, a maximum of 12 g/L of organic acids and phenols were detected in wood hydrolysate, which can be considered within the inhibitory levels reported. Although the amount of biomass was not substantially lower than synthetic media, an inhibition <20% on growth may be related to the wood hydrolysate composition. On the other hand, utilization of some hydrolysis byproducts, such as HMF, was reported by oleaginous yeast. More research is needed on the actual inhibitor concentrations found in LC hydrolysates. Synthetic compounds were used mostly in the studies, and the concentration and the inhibition effects varied among the studies. In Figure 6b, the efficiency of sugar hydrolysates with corresponding sugar concentrations supplied with yeast extract and peptone was compared with inorganic nutrients for biomass and lipid yields in Figure 6a. Glucose is one of the major constituents of YPD media and provides a rich source of Y. lipolytica with a high biomass yield. In order to study how hydrolysate sugars affected the substitution of glucose in YPD media with sawdust hydrolysates that contained varying sugar concentrations, hydrolysate sugars were added to the YPD media. As can be seen, adding YP to the culture resulted in an increase in biomass of up to 13 g/L. The biomass concentration increased with increased sugar concentration, while the biomass yield per sugar supplied decreased as the medium became more concentrated. For example, when Y. lipolytica biomass was supplied with 10 g TS/L, the biomass obtained was 74% of the biomass obtained when sugar was 20 g/L.
The lipid content of the hydrolysates with organic nutrients was improved to 29% compared with inorganic supplements (Figure 6b). The results showed that yeast extract and peptone additions to sugar media were very beneficial for Y. lipolytica lipid and biomass production. Furthermore, studies examining the effects of different monosugars on oleaginous bacteria have shown that lipid content can vary based on the type of sugar or the combination of C6 and C5 sugars. As xylose utilization by microorganisms was among the most widely studied C5-structured types of lignocellulosic sugar, its consumption by a fungal strain, Penicillium commune, resulted in the highest lipid accumulation of 35% among glucose, sucrose, lactose, and raffinose [51]. The reported data on lipid production by Y. lipolytica on acid hydrolysates of wood is limited. The Y. lipolytica biomass of a strain Y. lipolytica 63,746 produced on C5 and C6 sugar hydrolysates separately resulted in 15% and 21% lipid content, respectively, in a batch fermentation study of wood hydrolysates [46].
A compositional analysis of Y. lipolytica biomass in terms of the contents of lipids, proteins, and carbohydrates in biomass samples cultivated in hydrolysates with inorganic nutrients is shown in Figure 7. A fractional assessment of biomass showed that Y. lipolytica contained a high amount of protein in a range between 30 and 38% of CDW. The carbohydrate content ranged between 17 and 22%. According to a study with glycerol, protein content in Y. lipolytica varied from 19 to 48% depending on substrate type, concentration, and nitrogen supply [52]. Studies suggest that both high protein and lipid synthesis can be associated with NADPH metabolism, resulting in increased biomass and lipid production. NADPH supply dominated fatty acid biosynthesis, and higher NADPH consumption was predicted in protein synthesis under low C/N in a study of R. toruloides grown on glycerol [53]. Sekova et al. [54] reported that stress conditions such as alkaline pH and elevated temperature increased cytosolic carbohydrate content in yeast populations between 3.6 and 11.8%. The engineered strain of Yarrowia lipolytica used by Niehus et al. [55] produced up to 67% lipid.
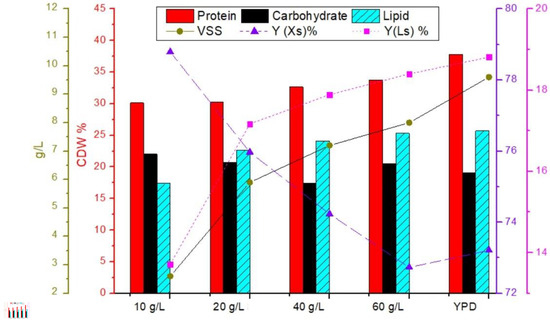
Figure 7.
Compositional analysis of Y. lipolytica biomass in terms of lipid, protein, carbohydrate content, biomass Y(Xs), and lipid yield Y(Ls).
It was shown that Y. lipolytica could grow at all concentrations of hydrolysate sugar between 10 and 60 g/L, amended with nutrients. Although a substantial amount of biomass was obtained at higher sugar concentrations, biomass yields were higher at lower sugar concentrations. In addition, lipid yields increased with sugar concentration. The results indicated that the yeast required water to proliferate to maximum biomass density per substrate in the sawdust sugar hydrolysates. The maximum biomass and lipid yields were 60 and 16%, respectively, at 40 g TS/L, which was similar to glucose yields. The biomass increased to 8 g/L only with inorganic nutrients. Organic nutrients increased biomass production and improved biomass quality. Consequently, a high amount of biomass can be produced from wood hydrolysates. This biomass can substitute for sugar requirements when combined with organic sources, providing a suitable medium for yeast growth. It was known that yeast extract and peptone, besides nitrogen and phosphorus, provided a rich source of vitamins, micronutrients, and growth factors that stimulate growth. This was similarly revealed by the production of Y. lipolytica in the present study, which showed high efficiency when combined with wood hydrolysate. In addition, using organic nutrients avoids the precipitation of ions contributed by inorganic nutrients, improving biomass quality.
3.4. Identification of Functional Groups Using FT-IR
FT-IR spectra of sawdust before and after hydrolysis, lignocelluloscis sugars, and Y. lipolytica biomass cultivated in sawdust hydrolysates were analyzed as shown in Figure 8. FT-IR bands in sawdust appeared in the ranges of 900–1800 and 2800–3600 cm−1 (Figure 8a). LC sugar components of wood were assigned peaks at 950–1200 cm−1. There were distinct changes in the spectra of wood due to the reactions occurring during thermochemical hydrolysis causing mass loss, particularly with a lowering in major peaks including at 3319, 2896, and 1027 cm−1 due to absorption into the liquid phase of hydrolysis. Some peaks were more intensified or split in the region of 1000–1800 cm−1 due to the deformation in the biomass structure. The relative composition changed to a higher mass percent of lignin in the insoluble sawdust residue by degradation of both hemicelluloses and cellulose, which showed several common peaks in FT-IR [56]. The comparison between the two bands demonstrated this saccharide degradation by the disappearance of the peak at 3319 cm−1 related to -OH groups, the lowering of those assigned to C-O-C bonds as stretching at the β-glycosidic linkages at 1263 cm−1, the pyranose ring skeletal vibrations attributed at 1027 cm−1, which is the highest peak, and the weakening of CH2 and CH3 groups at peak 2896 cm−1 [57,58,59]. In contrast to the decrease in several peaks, intensification of lignin peaks at 1700 cm−1 and 1598 cm−1 was clearly observed in the hydrolyzed wood, which was more broadened before hydrolysis. The results matched the characteristics of lignin bands assigned as aromatic skeletal vibration at 1598 cm−1, C-O stretching of the guacyl unit at 1253 cm−1, and vibration of the syringil ring together with C-O stretching at 1186 cm−1 [56]. The spectra of sawdust were comparable with other data related to FT-IR bands of cellulose and lignin, especially with organosolv and Klason lignin bands at 1200, 1500, 1600, and 1700 cm−1 that showed differences with respect to cellulose spectra [57,60].
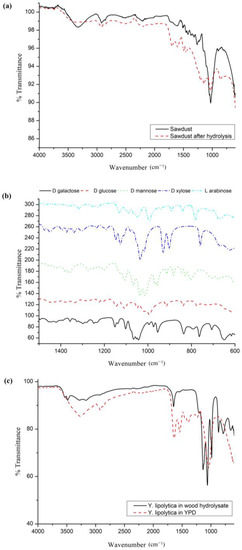
Figure 8.
FT-IR spectra of (a) raw and hydrolyzed sawdust; (b) lignocellulosic sugars; and (c) Y. lipolytica biomass in wood hydrolysate and YPD.
The FT-IR profile of each lignocellulosic sugar was observed with several peaks between 650 and 1500 cm−1 (Figure 8b). The highest intensities for each sugar occurred at 1035, 1000, 1036, 993, and 1043 cm−1 for xylose, arabinose, mannose, glucose, and galactose, respectively, which were comparable with the large sugar peak region of sawdust at 900–1150 cm−1 and FT-IR of cell sugars in Y. lipolytica biomass (Figure 8c).
Y. lipolytica’s structure is associated with various FT-IR bands within a wide wavelength range. The peak profile of Y. lipolytica was observed mainly in three regions, namely, 2800–3600 cm−1, 1200–1800 cm−1, and 650–1200 cm−1, which showed compliance with other oleaginous yeast species. The FT-IR profiles of some oleaginous yeast strains have been analyzed, such as Solicoccozyma, Lipomyces, Cryptococcus, and Rhodotorula [61,62,63]. Amide I and II bands of protein molecules are observed at 1200–1800 cm−1. The band region at 950–1200 cm−1 is associated with C-O structures of cell sugars, and the region between 1000 and 1200 cm−1 is associated with nucleic acid phosphodiester groups and phospholipids [62]. Lipids, including saturated, monounsaturated, and polyunsaturated fatty acids, were assigned several bands at 3020–2800 cm−1, 1800–1700 cm−1, 1500–1300 cm−1, 1100–1200 cm−1 and 800–700 cm−1 [61]. The related molecular structures for the bands were assigned to configurations of functional groups such as νC=O νasCH2, νCH2, νCH3, and νC=O stretching for lipids, νC=OδasCH2, CH3/δC-O, δN-H/νC-N δasCH2, and δasCH3 in peptide bonds of proteins, νasP=O related to nucleic acids, and νC-O-C and νC-O-C/νP=O groups at the carbohydrate region that were reported in several studies for yeast and algal species [63,64,65]. FT-IR analysis of Y. lipolytica recovered from sawdust hydrolysates matched that of YPD grown on synthetic glucose media. This indicated that the growth medium obtained from acid hydrolysates of wood enabled the maintenance and production of similar lipid components to those found in seed cultures of oleaginous yeast. In addition to lipids, the protein and carbohydrate contents of Y. lipolytica have a significant compartment in the FT-IR peaks of the biomass, which is in agreement with the microbial product-based studies of Y. lipolytica biomass showing a high carbohydrate and protein content that changes under different growth conditions [14,54]. The content of lipids in the biomass was assessed by determining the ratio of the intensity of the lipid band (2925 cm−1) to the protein band (amide I band—1636–1650 cm−1). Biomass obtained from YPD culture displayed the highest lipid content, based on the L/AI ratio (the ratio between lipid absorption and amide absorption) of 2.14. On the other hand, cultures grown in wood hydrolysates had lower levels of lipids, indicating a ratio of 1.82. Such a difference could be due to the fact that higher amounts of glucose are present in the YPD medium, which stimulates lipid synthesis.
3.5. Airlift Operation
The results of the batch operation of the airlift reactor resulted in 8.4 g/L biomass with a lipid content of 30.2%, which is comparable with the yields obtained in the prior batch study with 100 mL flasks. The results indicated that the batch study was a good representative of biomass efficiency at higher scales, such as airlift reactors. A total of 25.3 g of biomass could be harvested from the fermented wood hydrolysate of 3L applied to the bioreactor, which indicated that wood hydrolysate has a potential for large-scale applications for lipid production from oleaginous yeast cultures. In terms of cost-efficiency, airlift bioreactors are also more advantageous than mechanically agitated bioreactors, in which impellers are fitted for rotation, which requires a constant supply of electrical power for their operation. Therefore, the operating costs are high. The mass balance of lipid production from Yarrowia lipolytica culture under sawdust hydrolysate substrate is shown in Figure 9.
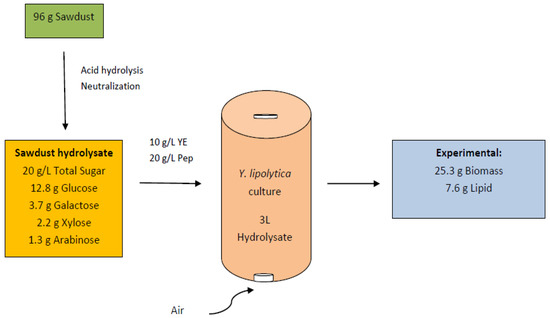
Figure 9.
Mass balance of lipid production by Y. lipolytica from wood hydrolysate.
Based on the importance of kinetic estimations in biological processes from small batch to large-scale systems such as continuous stirred-tank reactors, an assessment of kinetic coefficients for Y. lipolytica was presented in Table 7. The biomass and lipid production in a theoretical bioreactor with the same working volume size as the airlift reactor were estimated using Michelis–Menten kinetic modeling. Accordingly, using a high specific growth rate of 0.8 per day, corresponding to 0.033 per hour, and a biomass concentration of 9.6 g/L, a relative error of 0.097 was calculated. This represents the closeness of theoretical value and experimental value in the airlift bioreactor; as long as a relative error less than 0.1 is obtained, it is acceptable.
Table 7.
Coefficients for an airlift bioreactor.
In a study with glycerol consumption, maximum kinetic coefficients were estimated as a specific growth rate of 0.043, a lipid production rate of 0.09, and a glycerol consumption rate of 0.05 per hour for Y. lipolytica, which decreased after 40 h on 10 g/L of pure glycerol [66]. The relatively lower growth rates achieved in more concentrated substrate concentrations could be related to conditions such as decreased air transfer and the density of the media slowing the propagation of the yeast.
4. Conclusions
This study indicated that optimizing acid hydrolysis parameters may be a critical step in preventing high acid consumption as well as an elongated residence time. A modification of the parameters makes it possible to increase the effect of inhibitory degradation compounds on sawdust at the chosen hydrolysis temperature. As much as 85% of the total sugar content was obtained with solids, acid concentration, and time. To minimize acid per solid and increase sugar efficiency, the results indicated that for the maximum sawdust loading of 0.8, total sugar recovery was above 70%. This yield provides for the feasibility of CA hydrolysis of wood to produce a concentrated sugar stock for microorganisms to manage energy efficiency. The result may also provide time and economic efficiency for large-scale sugar production by acid hydrolysis. Despite the maximum values being observed at low solids, a high solid/acid ratio resulted in a more convenient process with a comparable TSR. The increased solid loading decreased the acid requirement for decrystallization to 1.2 mL/g sawdust for 1 L of hydrolysate. Furthermore, bringing the hydrolysate to 15% acid after hydrolysis allows a neutralization process in the dilute acid hydrolysate with high sugar efficiency.
This study suggested that the sugar hydrolysate of wood can be a suitable feedstock for Y. lipolytica, in which the biomass and lipid yields were as close as those in the synthetic glucose media. A growth screening in the hydrolysate demonstrated that fermentation, including 2% peptone and 1% yeast extract, was much more beneficial than inorganic nutrient sources to increase biomass and lipid efficiency, which were supplied to the hydrolysate at a concentration of 20 g TS/L at optimized hydrolysate concentration. The airlift operation produced at least 18–25 g of Y. lipolytica biomass with approximately 5–8 g of lipid and 6–8 g of microbial protein, as determined by kinetics and experimental data, respectively. Optimizing the sugar hydrolysate concentration is shown to increase biomass yields per operation while decreasing residual organic content in the effluent. This study also showed that, in addition to lipids, Y. lipolytica contained a significant amount of protein in its biomass. This can be a beneficial product in the biotechnological field.
Supplementary Materials
The following supporting information can be downloaded at: https://www.mdpi.com/article/10.3390/separations10070371/s1, Figure S1: Five-point calibration curve of standard sugars in HPLC by 0.25, 1, 3, 4, 6 mg/mL; Figure S2: HPLC spectra of the mixed standard sugars solution for calibration curve. Points are 0.25, 1, 3, 4, 6 mg/mL. Peaks from left: xylose, arabinose, mannose, glucose, galactose; Figure S3: Contour plots indicating the simultaneous maximum recovery of (a) xylose (b) arabinose (c) glucose and (d) galactose with respect to acid vs. solid; Figure S4: Lipid extraction efficiency from Y. lipolytica using different methods: hexane, methanol chloroform, and sulpho phospho vanillin; Table S1: Factors and responses; Table S2: ANOVA for xylose, arabinose, glucose, and galactose; Table S3: ANOVA for total sugar recovery.
Author Contributions
Conceptualization, H.Ü., E.P. and M.A.; methodology, H.Ü., E.P. and M.A.; software, E.P.; validation, H.Ü. and E.P.; investigation, H.Ü.; data curation, H.Ü., E.P. and M.A.; writing—original draft preparation, H.Ü., E.P. and M.A.; writing—review and editing, H.Ü., E.P. and M.A.; visualization, M.A.; supervision, M.A. All authors have read and agreed to the published version of the manuscript.
Funding
This research received no external funding.
Data Availability Statement
The data presented in this study are available on request from the corresponding author.
Acknowledgments
We acknowledge Istanbul Technical University’s National Research Center on Membrane Technologies (MEM-TEK) for providing instrumental analysis. HPLC analysis was supported by Mehmet Emin Paşaoğlu.
Conflicts of Interest
The authors declare no conflict of interest.
References
- Nations, F.A.O.U. Global Forest Resources Assessment 2015: How Are the World’s Forests Changing? 2nd ed.; Food and Agriculture Organization of the United Nations: Rome, Italy, 2018; ISBN 9789251092835. [Google Scholar]
- Lauri, P.; Havlík, P.; Kindermann, G.; Forsell, N.; Böttcher, H.; Obersteiner, M. Woody Biomass Energy Potential in 2050. Energy Policy 2014, 66, 19–31. [Google Scholar] [CrossRef]
- Rodriguez Franco, C. Forest Biomass Potential for Wood Pellets Production in the United States of America for Exportation: A Review. Biofuels 2022, 13, 983–994. [Google Scholar] [CrossRef]
- Nanda, S.; Dalai, A.K.; Kozinski, J.A. Butanol and Ethanol Production from Lignocellulosic Feedstock: Biomass Pretreatment and Bioconversion. Energy Sci. Eng. 2014, 2, 138–148. [Google Scholar] [CrossRef]
- Braghiroli, F.L.; Passarini, L. Valorization of Biomass Residues from Forest Operations and Wood Manufacturing Presents a Wide Range of Sustainable and Innovative Possibilities. Curr. For. Rep. 2020, 6, 172–183. [Google Scholar] [CrossRef]
- Ruan, Z.; Hollinshead, W.; Isaguirre, C.; Tang, Y.J.; Liao, W.; Liu, Y. Effects of Inhibitory Compounds in Lignocellulosic Hydrolysates on Mortierella Isabellina Growth and Carbon Utilization. Bioresour. Technol. 2015, 183, 18–24. [Google Scholar] [CrossRef]
- Zoghlami, A.; Paës, G. Lignocellulosic Biomass: Understanding Recalcitrance and Predicting Hydrolysis. Front. Chem. 2019, 7, 874. [Google Scholar] [CrossRef]
- Wijaya, Y.P.; Putra, R.D.D.; Widyaya, V.T.; Ha, J.-M.; Suh, D.J.; Kim, C.S. Comparative Study on Two-Step Concentrated Acid Hydrolysis for the Extraction of Sugars from Lignocellulosic Biomass. Bioresour. Technol. 2014, 164, 221–231. [Google Scholar] [CrossRef]
- Jang, M.-O.; Choi, G. Techno-Economic Analysis of Butanol Production from Lignocellulosic Biomass by Concentrated Acid Pretreatment and Hydrolysis plus Continuous Fermentation. Biochem. Eng. J. 2018, 134, 30–43. [Google Scholar] [CrossRef]
- Zhang, B.; Huang, H.J.; Ramaswamy, S. Reaction Kinetics of the Hydrothermal Treatment of Lignin. Appl. Biochem. Biotechnol. 2008, 147, 119–131. [Google Scholar] [CrossRef]
- Reza, M.T.; Andert, J.; Wirth, B.; Busch, D.; Pielert, J.; Lynam, J.G.; Mumme, J. Hydrothermal Carbonization of Biomass for Energy and Crop Production. Appl. Bioenergy 2014, 1, 11–29. [Google Scholar] [CrossRef]
- Reyes, P.; Mendonça, R.T.; Aguayo, M.G.; Rodríguez, J.; Vega, B.; Fardim, P. Extração e Caracterização de Hemiceluloses de Pinus Radiata e Sua Viabilidade Para a Produção de Bioetanol. Rev. Árvore 2013, 37, 175–180. [Google Scholar] [CrossRef]
- Palmqvist, E.; Hahn-Hägerdal, B. Fermentation of Lignocellulosic Hydrolysates. II: Inhibitors and Mechanisms of Inhibition. Bioresour. Technol. 2000, 74, 25–33. [Google Scholar] [CrossRef]
- Juszczyk, P.; Rymowicz, W.; Kita, A.; Rywińska, A. Biomass Production by Yarrowia Lipolytica Yeast Using Waste Derived from the Production of Ethyl Esters of Polyunsaturated Fatty Acids of Flaxseed Oil. Ind. Crops Prod. 2019, 138, 111590. [Google Scholar] [CrossRef]
- Liu, H.-H.; Ji, X.-J.; Huang, H. Biotechnological Applications of Yarrowia Lipolytica: Past, Present and Future. Biotechnol. Adv. 2015, 33, 1522–1546. [Google Scholar] [CrossRef]
- Sluiter, A.; Hames, B.; Ruiz, R.; Scarlata, C.; Sluiter, J.; Templeton, D. Determination of ash in biomass. In Laboratory Analytical Procedure: Technical Report NREL; TP-510-42622; National Renewable Energy Laboratory: Golden, CO, USA, 2008; pp. 302–305. Available online: https://www.nrel.gov/docs/gen/fy08/42622.pdf (accessed on 15 January 2023).
- Sluiter, A.; Hames, B.; Ruiz, R.; Scarlata, C.; Sluiter, J.; Templeton, D.; Crocker, D. Determination of Structural Carbohydrates and Lignin in Biomass. Laboratory Analytical Procedure: Technical Report NREL; TP-510-42618; National Renewable Energy Laboratory: Golden, CO, USA, 2012. Available online: https://www.nrel.gov/docs/gen/fy13/42618.pdf (accessed on 15 January 2023).
- Altinbas, M.; Kara, C.; Hasanoglu, A. Volatile Fatty Acid Production from Baker’s Yeast Industry Effluent. Waste Biomass Valorization 2020, 11, 1513–1525. [Google Scholar] [CrossRef]
- Konzock, O.; Zaghen, S.; Norbeck, J. Tolerance of Yarrowia Lipolytica to Inhibitors Commonly Found in Lignocellulosic Hydrolysates. BMC Microbiol. 2021, 21, 77. [Google Scholar] [CrossRef]
- Gerhardt, P. Methods for General and Molecular Bacteriology, Rev. ed.; American Society for Microbiology: Washington, DC, USA, 1994; ISBN 1555810489. [Google Scholar]
- Lowry, O.H.; Rosebrough, N.J.; Farr, A.L.; Randall, R.J. Protein Measurement with the Folin Phenol Reagent. J. Biol. Chem. 1951, 193, 265–275. [Google Scholar] [CrossRef] [PubMed]
- Tulashie, S.K.; Akpari, E.E.A.; Appiah, G.; Adongo, A.; Andoh, E.K. Acid Hydrolysis of Sawdust Waste into Bioethanol. Biomass Convers. Biorefin. 2021, 13, 5743–5756. [Google Scholar] [CrossRef]
- Michaelis, L.; Menten, M.L. Die Kinetik Der Invertinwirkung. Biochem. Z. 1913, 49, 352. [Google Scholar]
- Taavoni, S.; Habibi, A.; Varmira, K.; Alipour, S. Kinetics of Continuous Production of β-Carotene in an Airlift Bioreactor. Asia-Pac. J. Chem. Eng. 2018, 13, e2160. [Google Scholar] [CrossRef]
- Cotana, F.; Cavalaglio, G.; Gelosia, M.; Nicolini, A.; Coccia, V.; Petrozzi, A. Production of Bioethanol in a Second Generation Prototype from Pine Wood Chips. Energy Procedia 2014, 45, 42–51. [Google Scholar] [CrossRef]
- Kruyeniski, J.; Ferreira, P.J.; Carvalho, M.D.G.V.S.; Vallejos, M.E.; Felissia, F.E.; Area, M.C. Physical and Chemical Characteristics of Pretreated Slash Pine Sawdust Influence Its Enzymatic Hydrolysis. Ind. Crops Prod. 2019, 130, 528–536. [Google Scholar] [CrossRef]
- Heinonen, J.; Tamminen, A.; Uusitalo, J.; Sainio, T. Ethanol Production from Wood via Concentrated Acid Hydrolysis, Chromatographic Separation, and Fermentation. J. Chem. Technol. Biotechnol. 2012, 87, 689–696. [Google Scholar] [CrossRef]
- Tesfaw, A.A.; Tizazu, B.Z. Reducing Sugar Production from Teff Straw Biomass Using Dilute Sulfuric Acid Hydrolysis: Characterization and Optimization Using Response Surface Methodology. Int. J. Biomater. 2021, 2021, 2857764. [Google Scholar] [CrossRef] [PubMed]
- Stoffel, R.B.; Felissia, F.E.; Silva Curvelo, A.A.; Gassa, L.M.; Area, M.C. Optimization of Sequential Alkaline–Acid Fractionation of Pine Sawdust for a Biorefinery. Ind. Crops Prod. 2014, 61, 160–168. [Google Scholar] [CrossRef]
- Kangas, H.; Felissia, F.E.; Filgueira, D.; Ehman, N.V.; Vallejos, M.E.; Imlauer, C.M.; Lahtinen, P.; Area, M.C.; Chinga-Carrasco, G. 3D Printing High-Consistency Enzymatic Nanocellulose Obtained from a Soda-Ethanol-O2 Pine Sawdust Pulp. Bioengineering 2019, 6, 60. [Google Scholar] [CrossRef]
- Chew, J.-J.; Doshi, V.; Yong, S.-T.; Bhattacharya, S. Kinetic Study of Torrefaction of Oil Palm Shell, Mesocarp and Empty Fruit Bunch. J. Therm. Anal. Calorim. 2016, 126, 709–715. [Google Scholar] [CrossRef]
- Vilcocq, L.; Crepet, A.; Jame, P.; Carvalheiro, F.; Duarte, L.C. Combination of Autohydrolysis and Catalytic Hydrolysis of Biomass for the Production of Hemicellulose Oligosaccharides and Sugars. Reactions 2022, 3, 30–46. [Google Scholar] [CrossRef]
- Siau, J.F. Wood: Influence of Moisture on Physical Properties; Department of Wood Science and Forest Products Virginia Polytechnic Institute and State University: Blacksburg, VA, USA, 1995; ISBN 0-9622181-0-3. [Google Scholar]
- Sanchez-Salvador, J.L.; Campano, C.; Balea, A.; Tarrés, Q.; Delgado-Aguilar, M.; Mutjé, P.; Blanco, A.; Negro, C. Critical Comparison of the Properties of Cellulose Nanofibers Produced from Softwood and Hardwood through Enzymatic, Chemical and Mechanical Processes. Int. J. Biol. Macromol. 2022, 205, 220–230. [Google Scholar] [CrossRef]
- Sarris, D.; Stoforos, N.G.; Mallouchos, A.; Kookos, I.K.; Koutinas, A.A.; Aggelis, G.; Papanikolaou, S. Production of Added-value Metabolites by Yarrowia Lipolytica Growing in Olive Mill Wastewater-based Media under Aseptic and Non-aseptic Conditions. Eng. Life Sci. 2017, 17, 695–709. [Google Scholar] [CrossRef]
- Moon, H.C.; Song, I.S.; Kim, D.H. Concentrated Acid Impregnation, Hydrolysis, and Fermentation of Reed to Ethanol. Int. J. Green Energy 2010, 7, 475–484. [Google Scholar] [CrossRef]
- Jung, J.Y.; Choi, M.S.; Yang, J.K. Optimization of Concentrated Acid Hydrolysis of Waste Paper Using Response Surface Methodology. J. Korean Wood Sci. Technol. 2013, 41, 87–99. [Google Scholar] [CrossRef]
- Amenaghawon, N.A.; Okieimen, C.O.; Ogbeide, S.E. Modelling and Statistical Optimization of Dilute Acid Hydrolysis of Eucalyptus Wood Chips Using Response Surface Methodology. Pac. J. Sci. Technol. 2014, 15, 245–256. [Google Scholar]
- Lin, Q.; Li, H.; Ren, J.; Deng, A.; Li, W.; Liu, C.; Sun, R. Production of Xylooligosaccharides by Microwave-Induced, Organic Acid-Catalyzed Hydrolysis of Different Xylan-Type Hemicelluloses: Optimization by Response Surface Methodology. Carbohydr. Polym. 2017, 157, 214–225. [Google Scholar] [CrossRef]
- Alftrén, J.; Hobley, T.J. Immobilization of Cellulase Mixtures on Magnetic Particles for Hydrolysis of Lignocellulose and Ease of Recycling. Biomass Bioenergy 2014, 65, 72–78. [Google Scholar] [CrossRef]
- Gonzales, R.R.; Sivagurunathan, P.; Parthiban, A.; Kim, S.-H. Optimization of Substrate Concentration of Dilute Acid Hydrolyzate of Lignocellulosic Biomass in Batch Hydrogen Production. Int. Biodeterior. Biodegrad. 2016, 113, 22–27. [Google Scholar] [CrossRef]
- Lim, W.-S.; Lee, J.-W. Influence of Pretreatment Condition on the Fermentable Sugar Production and Enzymatic Hydrolysis of Dilute Acid-Pretreated Mixed Softwood. Bioresour. Technol. 2013, 140, 306–311. [Google Scholar] [CrossRef] [PubMed]
- Narisetty, V.; Narisetty, S.; Jacob, S.; Kumar, D.; Leeke, G.A.; Chandel, A.K.; Singh, V.; Srivastava, V.C.; Kumar, V. Biological Production and Recovery of 2,3-Butanediol Using Arabinose from Sugar Beet Pulp by Enterobacter Ludwigii. Renew. Energy 2022, 191, 394–404. [Google Scholar] [CrossRef]
- Miller, S.; Hester, R. Concentrated Acid Conversion Of Pine Sawdust To Sugars. Part Ii: High-Temperature Batch Reactor Kinetics Of Pretreated Pine Sawdust. Chem. Eng. Commun. 2007, 194, 103–116. [Google Scholar] [CrossRef]
- Seong, H.A.; Lee, J.S.; Yoon, S.Y.; Song, W.-Y.; Shin, S.-J. Fermentation Characteristics of Acid Hydrolysates by Different Neutralizing Agents. Int. J. Hydrog. Energy 2016, 41, 16365–16372. [Google Scholar] [CrossRef]
- Osorio-González, C.S.; Hegde, K.; Ferreira, P.; Brar, S.K.; Kermanshahipour, A.; Soccol, C.R.; Avalos-Ramírez, A. Lipid Production in Rhodosporidium Toruloides Using C-6 and C-5 Wood Hydrolysate: A Comparative Study. Biomass Bioenergy 2019, 130, 105355. [Google Scholar] [CrossRef]
- Wang, J.; Gao, Q.; Zhang, H.; Bao, J. Inhibitor Degradation and Lipid Accumulation Potentials of Oleaginous Yeast Trichosporon Cutaneum Using Lignocellulose Feedstock. Bioresour. Technol. 2016, 218, 892–901. [Google Scholar] [CrossRef] [PubMed]
- Hu, C.; Zhao, X.; Zhao, J.; Wu, S.; Zhao, Z.K. Effects of Biomass Hydrolysis By-Products on Oleaginous Yeast Rhodosporidium Toruloides. Bioresour. Technol. 2009, 100, 4843–4847. [Google Scholar] [CrossRef] [PubMed]
- Zhao, X.; Peng, F.; Du, W.; Liu, C.; Liu, D. Effects of Some Inhibitors on the Growth and Lipid Accumulation of Oleaginous Yeast Rhodosporidium Toruloides and Preparation of Biodiesel by Enzymatic Transesterification of the Lipid. Bioprocess Biosyst. Eng. 2012, 35, 993–1004. [Google Scholar] [CrossRef] [PubMed]
- Chen, X.; Li, Z.; Zhang, X.; Hu, F.; Ryu, D.D.Y.; Bao, J. Screening of Oleaginous Yeast Strains Tolerant to Lignocellulose Degradation Compounds. Appl. Biochem. Biotechnol. 2009, 159, 591–604. [Google Scholar] [CrossRef]
- Abdelhamid, S.A.; Hussein, A.A.; Asker, M.S.; El Sayed, O.H.; Mohamed, S.S. Optimization of Culture Conditions for Biodiesel Production from Egyptian Isolate Penicillium Commune NRC2016. Bull. Natl. Res. Cent. 2019, 43, 15. [Google Scholar] [CrossRef]
- Fabiszewska, A.U.; Zieniuk, B.; Kozłowska, M.; Mazurczak-Zieniuk, P.M.; Wołoszynowska, M.; Misiukiewicz-Stępień, P.; Nowak, D. Studies on Upgradation of Waste Fish Oil to Lipid-Rich Yeast Biomass in Yarrowia Lipolytica Batch Cultures. Foods 2021, 10, 436. [Google Scholar] [CrossRef]
- Lopes, H.J.S.; Bonturi, N.; Kerkhoven, E.J.; Miranda, E.A.; Lahtvee, P.-J. C/N Ratio and Carbon Source-Dependent Lipid Production Profiling in Rhodotorula Toruloides. Appl. Microbiol. Biotechnol. 2020, 104, 2639–2649. [Google Scholar] [CrossRef]
- Sekova, V.Y.; Dergacheva, D.I.; Isakova, E.P.; Gessler, N.N.; Tereshina, V.M.; Deryabina, Y.I. Soluble Sugar and Lipid Readjustments in the Yarrowia Lipolytica Yeast at Various Temperatures and PH. Metabolites 2019, 9, 307. [Google Scholar] [CrossRef]
- Niehus, X.; Crutz-Le Coq, A.-M.; Sandoval, G.; Nicaud, J.-M.; Ledesma-Amaro, R. Engineering Yarrowia Lipolytica to Enhance Lipid Production from Lignocellulosic Materials. Biotechnol. Biofuels 2018, 11, 11. [Google Scholar] [CrossRef]
- Cheng, S.; Huang, A.; Wang, S.; Zhang, Q. Effect of Different Heat Treatment Temperatures on the Chemical Composition and Structure of Chinese Fir Wood. BioResources 2016, 11, 4006–4016. [Google Scholar] [CrossRef]
- Khenblouche, A.; Bechki, D.; Gouamid, M.; Charradi, K.; Segni, L.; Hadjadj, M.; Boughali, S. Extraction and Characterization of Cellulose Microfibers from Retama Raetam Stems. Polímeros 2019, 29, e2019011. [Google Scholar] [CrossRef]
- Sun, J.X.; Sun, X.F.; Zhao, H.; Sun, R.C. Isolation and Characterization of Cellulose from Sugarcane Bagasse. Polym. Degrad. Stab. 2004, 84, 331–339. [Google Scholar] [CrossRef]
- Tian, Z.; Chen, J.; Ji, X.; Wang, Q.; Yang, G.; Fatehi, P. Dilute Sulfuric Acid Hydrolysis of Pennisetum (Sp.) Hemicellulose. BioResources 2017, 12, 2609–2617. [Google Scholar] [CrossRef]
- Yu, J.; Paterson, N.; Blamey, J.; Millan, M. Cellulose, Xylan and Lignin Interactions during Pyrolysis of Lignocellulosic Biomass. Fuel 2017, 191, 140–149. [Google Scholar] [CrossRef]
- Shapaval, V.; Brandenburg, J.; Blomqvist, J.; Tafintseva, V.; Passoth, V.; Sandgren, M.; Kohler, A. Biochemical Profiling, Prediction of Total Lipid Content and Fatty Acid Profile in Oleaginous Yeasts by FTIR Spectroscopy. Biotechnol. Biofuels 2019, 12, 140. [Google Scholar] [CrossRef] [PubMed]
- Ami, D.; Posteri, R.; Mereghetti, P.; Porro, D.; Doglia, S.M.; Branduardi, P. Fourier Transform Infrared Spectroscopy as a Method to Study Lipid Accumulation in Oleaginous Yeasts. Biotechnol. Biofuels 2014, 7, 12. [Google Scholar] [CrossRef]
- Signori, L.; Ami, D.; Posteri, R.; Giuzzi, A.; Mereghetti, P.; Porro, D.; Branduardi, P. Assessing an Effective Feeding Strategy to Optimize Crude Glycerol Utilization as Sustainable Carbon Source for Lipid Accumulation in Oleaginous Yeasts. Microb. Cell Fact. 2016, 15, 75. [Google Scholar] [CrossRef]
- Piasecka, A.; Nawrocka, A.; Wiącek, D.; Krzemińska, I. Agro-Industrial by-Product in Photoheterotrophic and Mixotrophic Culture of Tetradesmus Obliquus: Production of Ω3 and Ω6 Essential Fatty Acids with Biotechnological Importance. Sci. Rep. 2020, 10, 6411. [Google Scholar] [CrossRef]
- Mecozzi, M.; Pietroletti, M.; Scarpiniti, M.; Acquistucci, R.; Conti, M.E. Monitoring of Marine Mucilage Formation in Italian Seas Investigated by Infrared Spectroscopy and Independent Component Analysis. Environ. Monit. Assess. 2012, 184, 6025–6036. [Google Scholar] [CrossRef]
- Ram, S.K.; Tyagi, R.D.; Drogui, P. Effect of Sludge Concentration and Crude Glycerol Matrix as a Substrate on the Production of Single-Cell Oil by Oleaginous Yeast Yarrowia Lipolytica SKY7. Fermentation 2018, 4, 24. [Google Scholar] [CrossRef]
Disclaimer/Publisher’s Note: The statements, opinions and data contained in all publications are solely those of the individual author(s) and contributor(s) and not of MDPI and/or the editor(s). MDPI and/or the editor(s) disclaim responsibility for any injury to people or property resulting from any ideas, methods, instructions or products referred to in the content. |
© 2023 by the authors. Licensee MDPI, Basel, Switzerland. This article is an open access article distributed under the terms and conditions of the Creative Commons Attribution (CC BY) license (https://creativecommons.org/licenses/by/4.0/).