Article

Assessment of Two Materials as Adsorbents for the Effective Removal and Further Pre-Concentration of Gallium from Aqueous Solutions: Mesoporous Carbon vs. Clinoptilolite

Chemical and Materials Engineering Department, Catalysis and Separation Process Group (CyPS), Universidad Complutense de Madrid, Avda. Complutense s/n, 28040 Madrid, Spain
*
Author to whom correspondence should be addressed.
Separations 2023, 10(6), 349; https://doi.org/10.3390/separations10060349
Submission received: 18 May 2023 / Revised: 5 June 2023 / Accepted: 6 June 2023 / Published: 9 June 2023

Abstract

:
In this research, the adsorption of gallium onto natural zeolite (clinoptilolite) and two mesoporous-activated carbons were compared and evaluated. The clinoptilolite was treated with HCl (HCPL), while mesoporous-activated carbons (MCSG60A and MCO1) were synthesized by replica method, using sucrose as the carbon precursor and silica gel as the template. These carbonaceous materials showed large pore sizes and mesoporous surface, as well as a suitable surface chemistry for cation adsorption, which promotes a high negative charge density. On the other hand, zeolites have narrower pore sizes, which hinders the material diffusion inside the particle; however, its strength is their ion exchange capacity. Regarding the gallium kinetic studies, it is described by Pseudo-second order model for both sorts of adsorbents. MCO1 is the best carbonaceous adsorbent studied, with a capacity of 4.58 mg/g. As for zeolites, between the two zeolites studied, HCPL showed the best results, with a gallium adsorption capacity of 3.1 mg/g. The gallium adsorption mechanism onto MCO1 material is based on physisorption, while HCPL is mainly retained due to an ion-exchange process. Regarding the Giles classification, MCO1 isotherm described an H-4 pattern of high affinity and characteristic of multilayer adsorption. The Double-Langmuir model fits properly within these experimental results. In the case of zeolites, HCPL adsorption isotherm followed an L-2 pattern, typical of monolayer adsorption—the Sips model is the one that better describes the adsorption of gallium onto the zeolite.

Graphical Abstract

1. Introduction

The industrialization and the use of semiconductors in many electronic devices have made gallium a hi-tech metal with a wide range of applications: photovoltaic cells, light-emitting diodes (LED), laser diodes, digital integrated circuit chips, etc. [1]. Recently, Hong Zhou et al. [2] analyzed the main applications of gallium oxide in the electronic industry and Liu et al. studied the properties of gallium oxide applied in transistors and diodes [3]. Ramanujan et al. [4] studied the properties of solar cells based on copper-indium-gallium selenide.
Gallium is a relatively rare element, which is classified as a strategic metal due to its relative scarcity and increasing use. Compared with other metallic elements, it is not so rare because it occupies the 30th place in terms of abundance [5], with an average concentration of 19 mg/g in the Earth’s Crust [6]. However, the main drawback for its recovery is that it is uniformly distributed and, consequently, its extraction is not economical. For this reason, in many extraction processes, gallium is considered as an impurity that needs to be recovered from industrial processes’ wastes, such as flue dusts from the zinc industry or sludge from the aluminum industry [7]. Nowadays, the main source of gallium is Bayer liquor (solution from the process to obtain aluminum from bauxite). The amount of gallium in Bayer liquor can reach concentrations of up to 100–200 mg/L of Ga3+ [5].
The main world producer of gallium is China. In relation to this, it is important to highlight that, in 2019, U.S. gallium metal imports decreased by about 90% from those of 2018, most likely owing to the introduction of higher import tariffs on gallium from China and the 300% increase of gallium imports from China in 2018 before the tariffs were introduced [8].
The recovery of gallium from Bayer liqueur can be performed by different processes, depending on the bauxite plant: solvent extraction, ion exchange resins, and adsorption or chemical precipitation. These processes are some of the most commonly used but they have some limitations, such as environmental problems or high costs [9]. Recently, Jadhav and Hocheng [10] studied the recycling metals from industrial wastes; however, on the contrary to lead, tin or indium, the possibility of recovering gallium from industrial waste is quite difficult.
Therefore, to overcome the previously described limitations, adsorption can be considered as a reliable alternative. An adsorption process does not allow a direct recovery of the metal; nevertheless, once the metal is bonded to the solid, the desorption process allows the pre-concentration of the metal that was initially presented in trace amounts in waste waters, so that it is possible to finally recover it more economically by means of other technologies such as extraction [11]. Additionally, adsorption processes can be relatively cheap, depending on the adsorbent price.
Among the most employed adsorbents for metal recovery are natural zeolites and carbons. Natural zeolites are cheap materials due to their high availability. Clinoptilolite, the most common natural zeolite, is an aluminosilicate with the following general chemical formula: (Na,K,Ca)4Al6Si30O72·24H2O. Its crystal structure presents a 3-dimensional framework that develops a pore and channels system occupied by hydrated cations, making this material suitable for removing metals from wastewater [12]. This material has been widely employed to remove metal ions from aqueous solutions. Zanin et al. [13] employed clinoptilolite, which showed high capacity to adsorb Cu2+, Cr3+ and Fe3+, removing 95%, 96% and 85%, respectively, at pH 6. In addition, Cu2+ and Cd2+ adsorption using spherical mesoporous silica has been studied, obtaining a removal of 80% and 20%, respectively, by Liang et al. [14]. More recently Pb, Zn, Cd and Cu ions were successfully recovered from aqueous solutions, employing Na-exchanged clinoptilolite [15]. It is important to point out that, due to its adequate adsorbent properties, clinoptilolite has been employed for the removal of not only metal, but many different compounds. In fact, it has been recently used for the removal of asphaltenes [16] and antibiotics [17].
In relation to carbonaceous materials, they are typically more expensive than zeolites; nevertheless, they have a higher specific surface area due to their disorganized and porous structure, which enhances their capacity as adsorbents. Among the carbonaceous materials, activated carbons are especially interesting due to their surface chemistry, which comprises plenty of oxygenated groups (carboxyl, phenolic and carbonyl) that promote the adsorption phenomena because it favors the electrostatic interactions-mechanism with protons in oxygen functional groups [18]. However, the dominance of micropores in activated carbons hinders diffusion, so recently attention has been devoted to new carbonaceous materials, such as carbon nanotubes and ordered mesoporous-activated carbons [19]. Ordered mesoporous carbons have relatively uniform pore sizes and large pore volumes—these characteristics make them good adsorbents and suitable for other applications. In the literature, several authors have employed these materials to remove metals from aqueous solutions—Kyzas et al. were capable of removing [20] 92% of the cobalt in an aqueous solution in 180 min, using activated carbon synthesized from waste potato carbonization. Odisu et al. [21] employed activated carbon from palm, coconut and groundnut shells to remove Zn, Fe, Pb and Ni from cement wastewater. More recently, Yunus et al. [22] employed activated carbon from honeydew peels to remove chromium and zinc from acid mining effluents, and Nejadshafiee and Islami [23] employed activated carbon from pistachio shells to retain heavy metals form the copper industry.
When talking specifically about gallium adsorption, the number of contributions is much lower than for other metals. Suryavanshi and Shukla [5] employed oxidized coir to adsorb Ga3+. With this material, the percentage of removal at pH 3 was 71%. Chegrouche and Bensmail [11] researched the gallium adsorption on bentonite. The results obtained by these authors were very promising, since the percentage of Ga3+ adsorbed was 99% at 2.5 pH with 25 g/L of bentonite dosage. Roosen et al. [24] used a chitosan-silica matrix impregnated with 8-hydroxyquinoline and 8-hydroxyquinaldine as adsorbent for the selective recovery of Ga3+ from a synthetic Bayer liquor solution, reaching equilibria in 8 h with an adsorption capacity of 26.49 mg/g. Hassanien et al. [25] studied the adsorption to pre-concentrate Ga3+ for its recovery by solvent extraction. They employed amino silica gel functionalized with 2-hydroxy-5-(2-hydroxybenzylideneamino) benzoic acid, which removes between 95–100% of Ga3+ in an aqueous solution. Additionally, Zhao et al. [26] synthesized a CoFe2O4−Zeolite material, adsorbing 90% of the Ga3+ in an aqueous solution. Moreover, Zhang et al. [27] proposed carboxyl-functionalised materials based on natural corn stalk to use it to remove gallium, obtaining a maximum adsorption capacity of 139.56 mg/g. More recently, Gao et al. [28,29] employed a persimmon-based ion imprinted polymer as gallium adsorbent, achieving 80% of gallium removal. On the other hand, Cui et al. [30] employed chitosan-derived layered porous carbons as adsorbents, reaching gallium removals of up to 90%, and Wang et al. [31] employed a chitosan-based ion imprinted polymer, reaching gallium removals of up to 80%. Finally, Meng et al. [32] employed a porous resin composed of 2-ethylhexylphosphonic acid mono-2-ethylhexyl ester (P507) and tributyl phosphate (TBP) attached to a silica matrix, as adsorbent with a large capacity to remove gallium.
Therefore, because the literature concerning gallium adsorption is relatively scarce, the main objective of this study is to compare the adsorption capacity and the adsorption mechanism of two different sorts of materials, to evaluate which one would be more suitable to pre-concentrate gallium from an aqueous solution so that it could be possible to recover it by other techniques such as solvent extraction. The criteria to select the material for future experiments in a continuous mode will be the kind of adsorption, the adsorption mechanism and the process-limiting step. The importance of the work is that the references concerning gallium recovery are rather scarce, and pre-concentrating the metal is fundamental to further recovery and reuse because of its economic impact, which is due to either its scarcity or the wide range of applications.

2. Materials and Methods

2.1. Materials

The clinoptilolite employed in this study was obtained from Zeocat Soluciones Ecológicas S.L.U (Barcelona, Spain). Clinoptilolite was described by the supplier as 82–86% pure. The impurities included quartz, illite and cristobalite. Regarding the chemical composition of the zeolite sample, the results provided by the supplier were (wt.%): SiO2: 68.15; Al2O3: 12.30; K2O: 2.80; CaO: 3.95; Na2O: 0.75, MgO: 0.90; Fe2O3: 1.30; TiO2: 0.20. The Si/Al ratio of the sample calculated from this composition was 4.70, which is within the typical range for clinoptilolite [12]. To modify the zeolite, hydrochloric acid (HCl, 37%) supplied by Fluka (Sigma Aldrich, Saint Louis, MO, USA) was employed.
The mesoporous carbons were synthesized using silica gel (SiO2, ≥99%) of 60 Å and 40–63 μm particle size, and 150 Å with 75-250 μm particle size, sucrose (C12H22O11, 99.5%) and hydrofluoric acid (HF, 40%), all provided by Sigma Aldrich. Sulfuric acid (H2SO4, 98%) was supplied by Panreac.
Gallium (III) nitrate hydrated (Ga(NO3)3, ≥99.9%), employed as a gallium source, was also provided by Sigma Aldrich. Sodium chloride (NaCl, 99.5%), purchased from Fluka, was employed to study the ionic strength, and nitric acid (HNO3, 69.5%), supplied by Carlo Erba, was used to adjust the pH. Finally, all the solutions were prepared using ultrapure water (Elga Veolia purification unit).

2.2. Adsorbents

In this article, two adsorbents of different nature have been tested: two mesoporous carbons and a natural zeolite. The synthesis, conditioning and characterization of the adsorbents are shown in the following paragraphs. Although mesoporous carbon was expected to have a very fast adsorption rate, we also considered the alternative of clinoptilolite because is a natural zeolite, making it widely available and very cheap.
Synthesis of mesoporous carbons.
The synthesis of both ordered mesoporous-activated carbons was carried out according to previous works [33], using sucrose as the carbon source and commercial silica gel as the template. Firstly, the silica gel was impregnated with an aqueous solution of sucrose and sulfuric acid. After this, the sucrose polymerization and the pre-carbonization were carried out, heating the solution to 100 °C for 6 h and 150 °C for another 6 h. Afterwards, the material was carbonized at a higher temperature in an N2 atmosphere. Finally, the silica gel template was removed using a 25 wt.% HF aqueous solution of HF and, after that, the material was washed with ethanol and deionized water. Two different activated carbons (MCSG60A and MCO1) were synthesized with a sucrose/silica gel weight ratio of 1.25 and 1.0, respectively. MCSG60A was carbonized at 800 °C for 240 min, while MCO1 was synthesized at milder carbonization conditions of 600 °C for 15 min. As for the silica gel template, MCO1 was synthesized with silica gel of 150 Å and MCSG60A was synthesized with silica gel 60 Å. The carbonization step is an important variable as it can affect the nature of the material surface.
The activation of these mesoporous carbons consists of promoting the formation of oxygenated groups on its surface. In this work, the activation was carried out heating the carbons to 450 °C and keeping them for 5 h at that temperature in a slightly oxidant atmosphere (100 mL/min of a 5% of oxygen diluted in N2 stream).
Conditioning of natural zeolite.
Before being used as adsorbent, the clinoptilolite was washed with deionized water to remove its turbidity. After that, it was dried at 100 °C for 24 h and calcined at 350 °C (the same treatment was performed by the supplier) for 3.5 h. The calcined zeolite was sieved to obtain a 0.8–1 mm particle size fraction (CPL).
Additionally, the natural zeolite was treated with HCl (H-CPL), with the purpose of exchanging the cations in the bare zeolite by protons to improve the removal of Ga3+ ions. The exchanged clinoptilolite was prepared by treating 1 g of clinoptilolite with 50 mL of HCl 2 M. This exchange process was performed by disposing the zeolite on a filter and adding the acid step by step over the zeolite. With this methodology, the acid attack is less aggressive than when using direct contact during 24 h. Thus, delamination is avoided. Afterwards, the clinoptilolite sample was washed with deionized water until no Cl- was detected in the washing water. The presence or absence of Cl- was detected by using an AgNO3 solution that stopped the washing process when no AgCl precipitate was detected. Finally, the samples were dried at 100 °C for 24 h.
Characterization.
First, to characterize the adsorbents, their textural properties were measured by means of nitrogen adsorption–desorption isotherms at −196 °C, using a Micromeritics ASAP-2020 adsorption apparatus. Their specific surfaces were determined using the BET (Brunauer–Emmett–Teller). The micropore volume (Vmicro) and mesoporous surface (Smeso) were obtained using the t-plot method. With the aim of studying their surface charge, Zeta potential measurements were carried out with a MALVERN Zetasizer Nano Z apparatus. To further analyze the surface chemistry of the adsorbents and their thermal stability, thermogravimetric analyses were performed with Setaram Labsys EVO equipment. The analyses were carried out in a helium atmosphere (50 mL/min) using an Al2O3 crucible. The range of the temperatures employed were between 35 and 1050 °C for the mesoporous carbon, and between 35 and 700 °C for the clinoptilolite, with a heating rate of 10 °C/min for both materials. To complete this analysis, an infrared spectrometry was carried that, providing information about the superficial chemistry. The Thermo Nicolet Avatar 360 FTIR spectrophotometer was the equipment used. The crystal structure of zeolites was examined by X-ray diffraction (XRD), using a PANalytical X’Pert MPD equipment with CuKα radiation in the range of 5–70° with a step size of 0.1°. The chemical composition was analyzed by X-ray fluorescence (XRF), using an Aχios PANalytical. Additionally, the surface charge of Ga(NO3)3·xH2O was measured in order to compare it with the adsorbents.
Finally, the morphology of the solids was analyzed by means of Scanning Electron Microscopy (SEM) images, obtained in a JEOL 6400F apparatus with a thermionic cathode with a tungsten filament and a voltage of 35 kV.

2.3. Adsorption Experiments

The studies of metal adsorption were carried out in a batch mode, with flasks filled with known concentrations of gallium ion (synthetic mixtures prepared by dissolving Ga(NO3)3·xH2O in deionized water) and the proper adsorbent dosage. The flasks were stirred at a constant rate and temperature until equilibrium was attained. The stirring rate was fast enough to avoid mass-transfer resistance. To know if the equilibrium was attained, two samples were taken at different times until the concentration of cobalt in two consecutive samples were the same or very close. Afterwards, each sample was passed through a 0.2 µm filter to separate the adsorbent. In the case of the mesoporous carbon, due to its small particle size, the samples were additionally centrifuged at 10.900 r.p.m. The concentration of metal ion remaining in solution was determined by atomic absorption spectroscopy (Shimadzu AA-7000). All the samples were measured three times, and the average value was employed. The gallium adsorption capacity was estimated using Equation (1), whereas the gallium removal efficiency was calculated using Equation (2):
q = C 0 C t · V m
% G a = C 0 C t C 0
where q (mg/g) is the amount of Ga3+ adsorbed per gram of adsorbent; C0 (mg/L) is the initial gallium concentration, Ct (mg/L) is the gallium concentration after time t, V (L) is the solution volume and m (g) is the mass of the adsorbent.
The detailed procedure was used to describe the adsorption mechanism of gallium ion onto mesoporous carbons and zeolite carrying out the kinetic, isotherm and thermodynamic studies.
The percentage of associated error was expressed as the ratio between the 95% confidence interval and the average value of the repeated sample measurements (5–6 times). This error was estimated at 5%.

3. Results

3.1. Characterization of the Adsorbents

The adsorbents were characterized by employing several techniques to compare the properties of the carbonaceous and zeolitic materials, and to further predict their behavior in the gallium adsorption process.
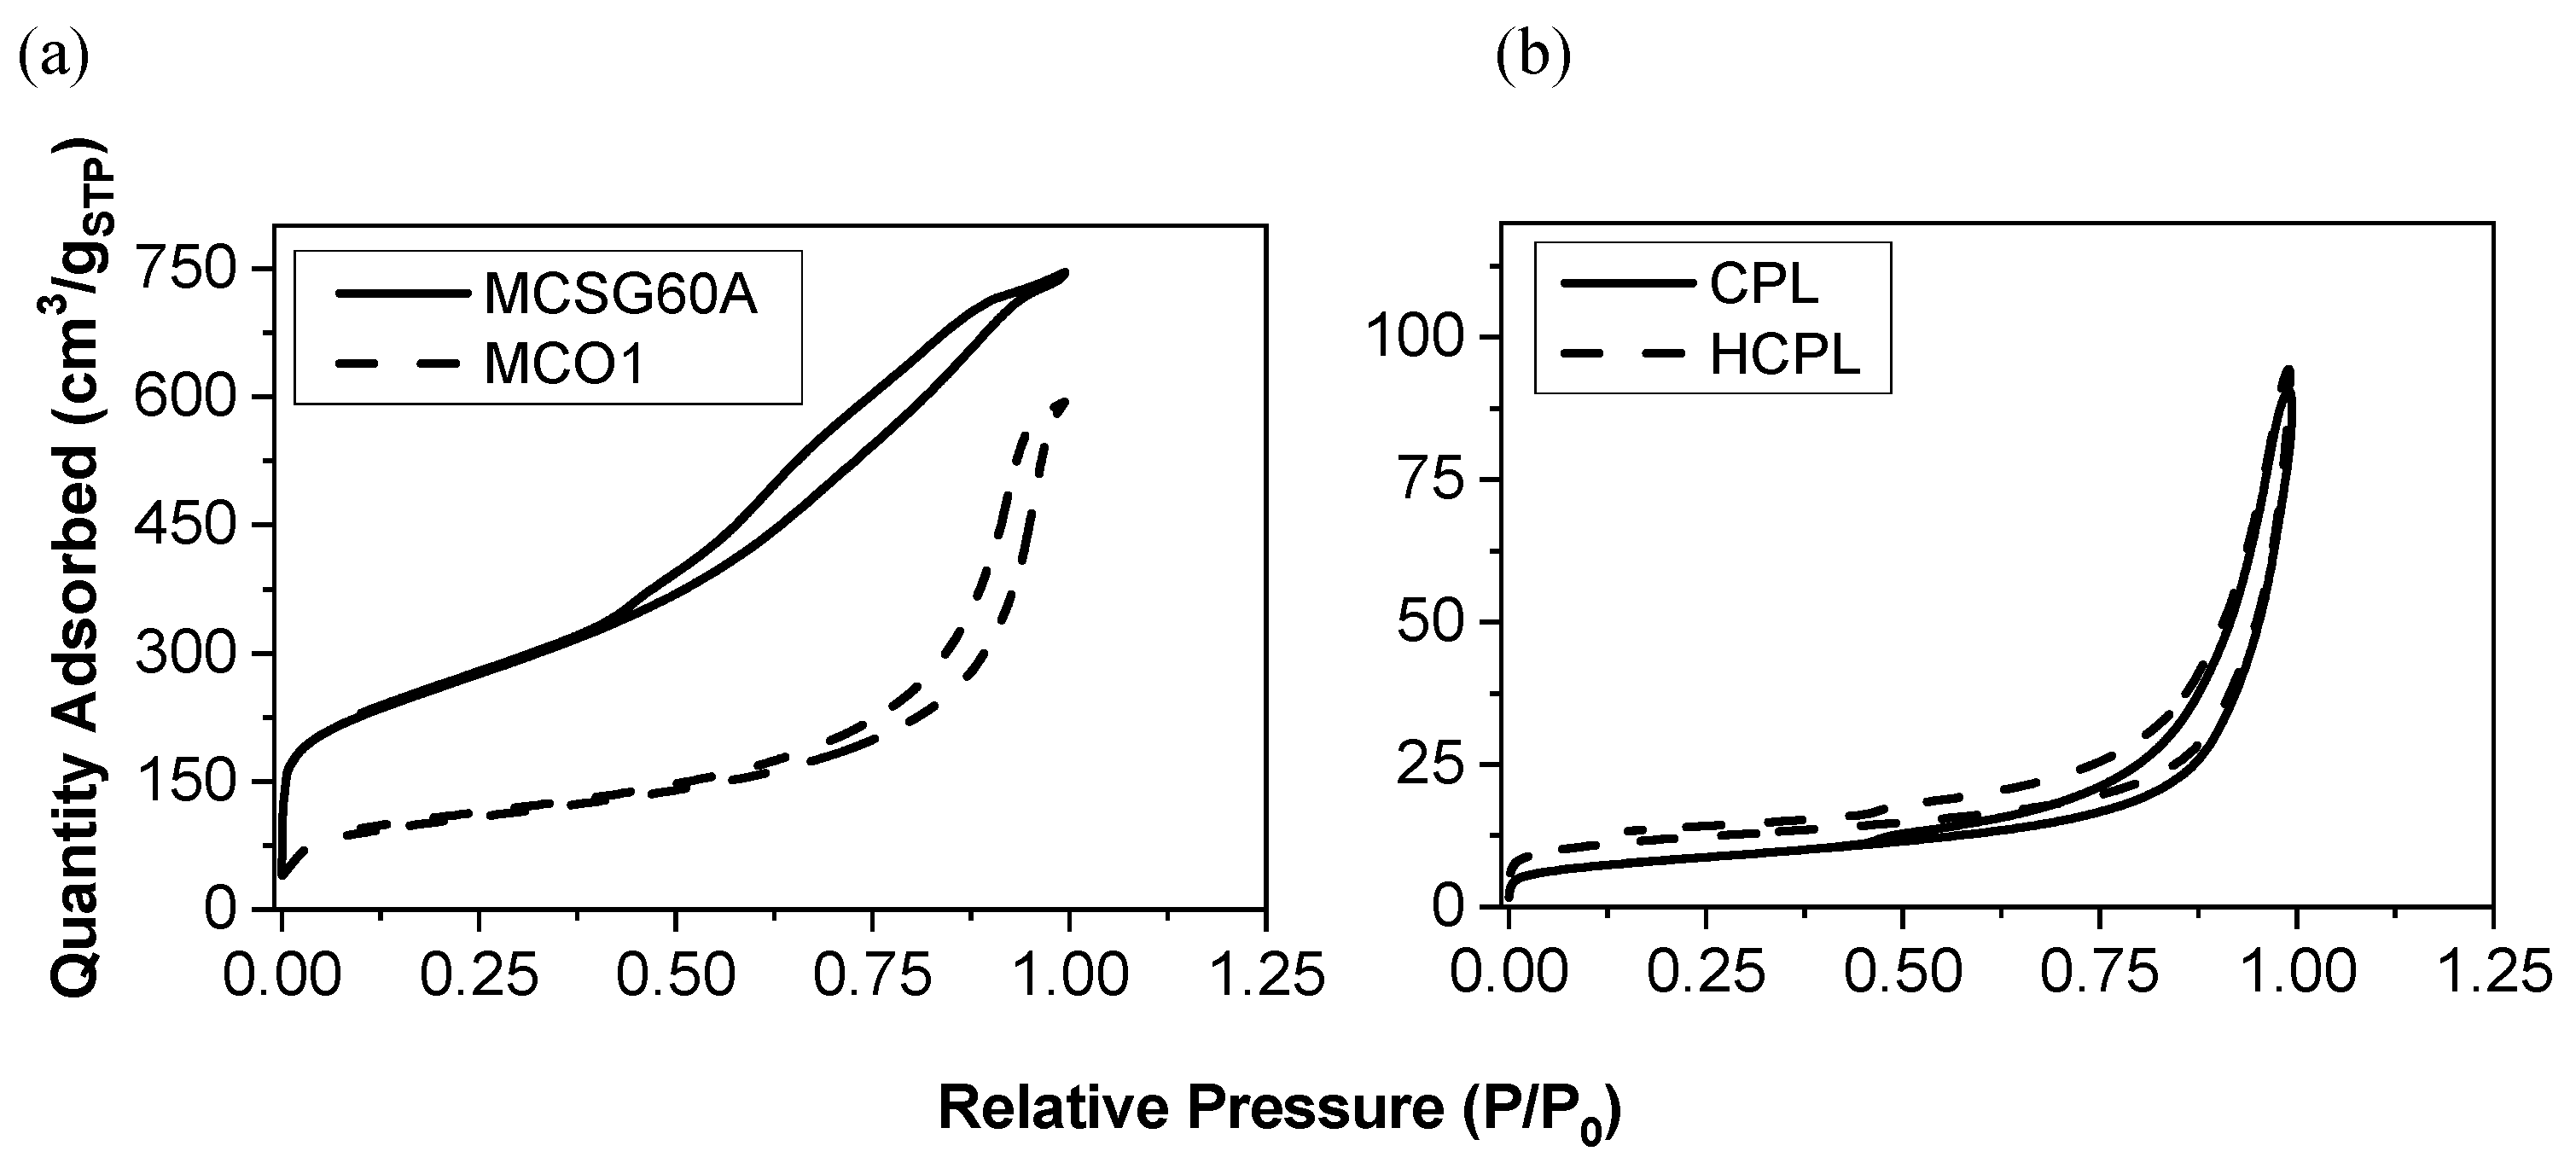
Figure 1 represents the N2 adsorption-desorption isotherms, and Table 1 shows the values of the main parameters obtained from the analysis of the isotherms: specific surface area (SBET), mesoporous surface (Smeso), average pore size (Dpore), specific volume (VSpecific) and mesoporous volume (Vmeso) calculated as Vspecific − Vmicro.
The isotherms of both materials are IUPAC type IV (a), which is in agreement with the literature [34], with a characteristic hysteresis loop. In the case of the zeolites, this hysteresis loop can be classified as H-3. This sort of loop is associated with materials having a solid surface or aggregates of particles with slit-shaped pores. This statement is a confirmation of the nature of the clinoptilolite used in this work (a natural zeolite with different aggregates). In the case of carbonaceous materials, the loop is an H-3 type for MCSG60A and H-2(b) for MCO1. Considering that the H-2 loop is clearly broader than the H-3 loop [35], the results seem coherent, taking into account that MC01 carbon was synthetized using as template 150 Å silica gel (it is expected to be more mesoporous), while MCSG60A was synthetized with 60 Å silica gel. These hysteresis loops are characteristic of complex pore structures and are associated with pore blocking, and have been observed in mesoporous-ordered silica after hydrothermal treatment [34].
Analyzing the results of the two kinds of materials separately, the mesoporous carbons studied, and MCSG60A present large specific surface areas (>700 m2/g) and large pore volumes (>1.1 cm3/g); the specific surface area of MC01 is much lower, due to its much larger pore size. It is important to emphasize that around 80% of the total surface area of both materials correspond to mesoporous and macroporous surface; this highlights the mesoporous character of both materials.
In the case of the zeolites, their specific surface areas are much lower than the ones of the carbons. This is due to the presence of ions, such as sodium, calcium, or potassium, which are located along the channels of the zeolite, hindering the diffusion of N2 molecules. H-CPL presents a specific surface area larger than bare CP. This is a consequence of the acid treatment producing a loss of the larger cations attained to the zeolite (this affirmation will be verified with XRF analysis), partially allowing the passage of N2 molecules into the channels.
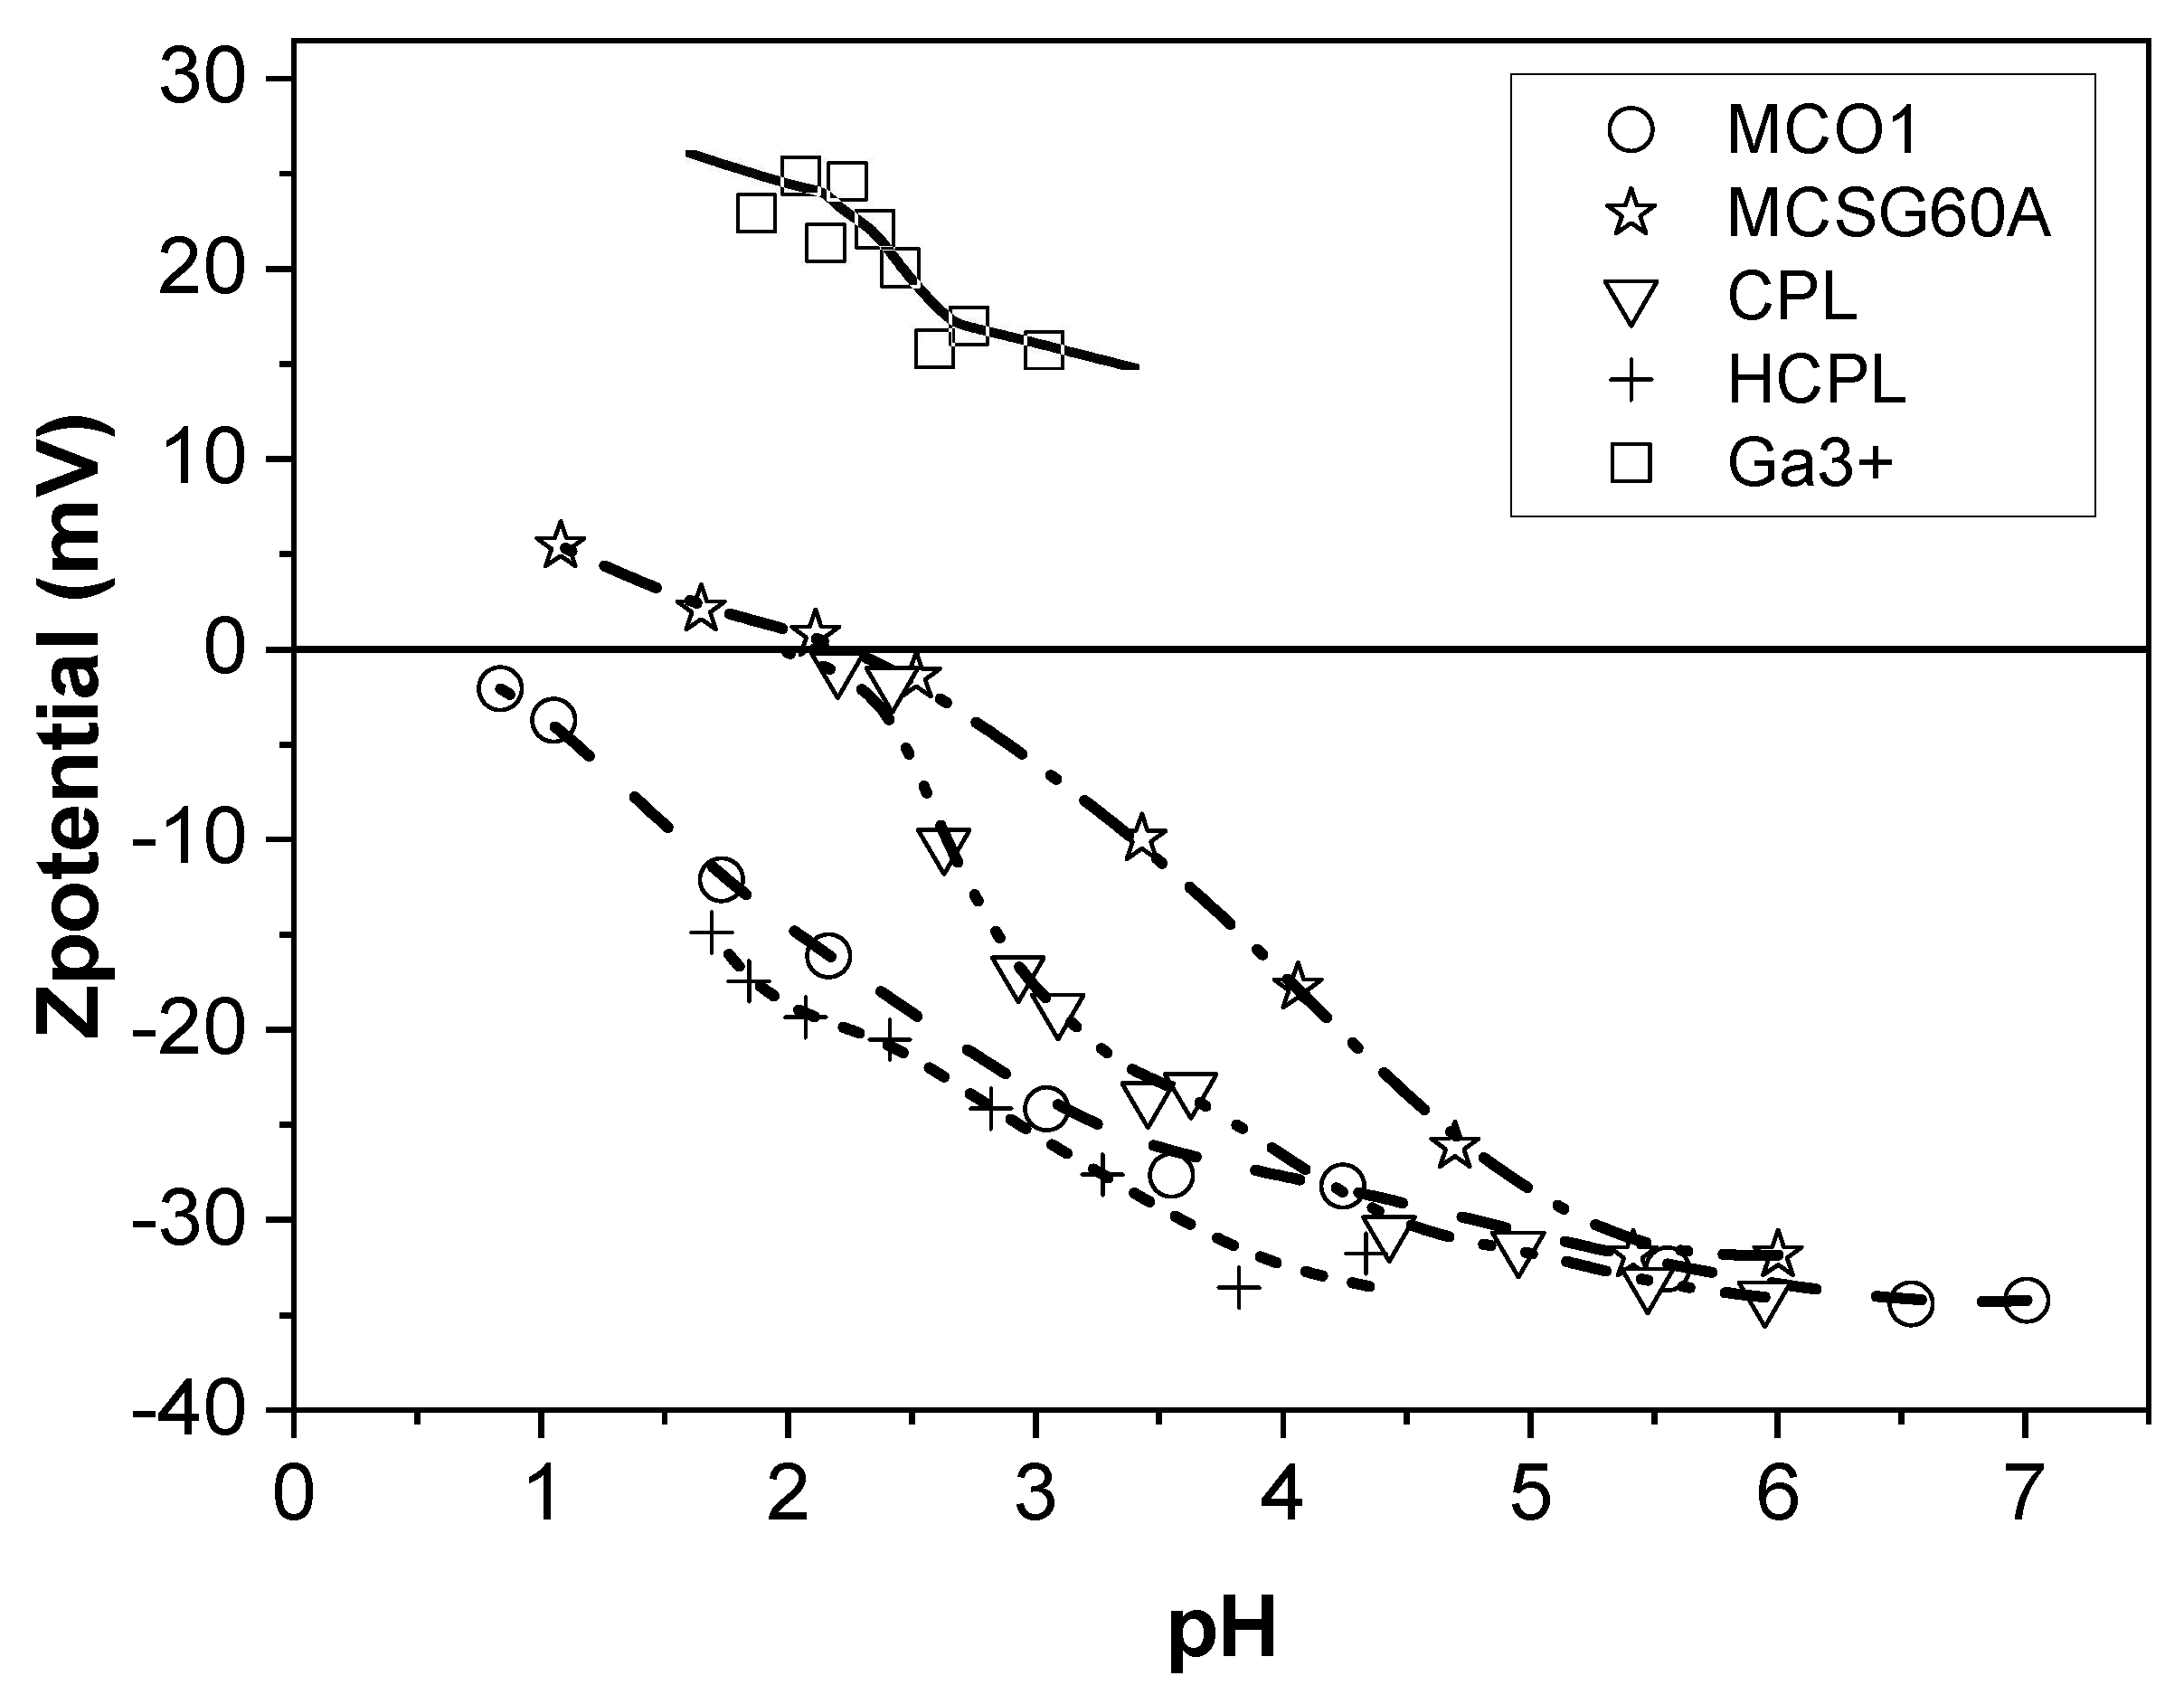
In order to know whether the surface of the adsorbents is negatively charged or not, Z potential analysis was employed. This technique allows quantifying the electrostatic interactions between adsorbate and adsorbent [36] states. Figure 2 displays the results of the potential Z analysis. Related to this analysis, it is important to bear in mind the isoelectric point (IEP) concept. This is the pH value at which the surface charge gets null, or the pH at which Z potential is zero. Consequently, the charge of the surface of the solid will be negative when the pH is above the pHIEP, and positive when the pH is below this value. If the adsorbent is negatively charged, then it will be capable of interacting with the metal cations in the solution.
Figure 2 shows that both CPL and MCSG60A have an isoelectric point of approximately 2.3, while H-CPL and MCO1 do not present this isoelectric point. In the case of the carbonaceous materials, the presence of oxygenated groups (phenolic, hydroxylic, carboxylic, etc.) contributes to a high negatively charged surface on the adsorbent [37]. However, the difference in the Z-potential value of both materials is noticeable. This behavior can be attributed to the carbonization conditions: MCSG60A was carbonized at more severe conditions than MC01. This, as it will be shown and discussed in the FTIR spectra, will affect the intensities of the peaks, indicating that carbonization time and temperature do not affect the variety of oxygenated groups generated during carbonization, but to their relative amount. In fact, an increase in the carbonization conditions leads to a partial oxidation to aldehyde, ketone and quinone groups, responsible for the different values of Z-potential. In the case of the clinoptilolite, this different behavior is due to the number of substitutions of Al for Si, and the high positive charge deficiency [38]. Finally, regarding the zeta potential of gallium, if the pH is below 3, the zeta potential values are around 25 mV. Therefore, considering all previously discussed points, it can be concluded that Z-potential analysis can be employed as a predictive tool to determine if a certain material would be suitable for the removal of metal ions from aqueous solutions. Specifically, in this case, the two materials expected to work better in the gallium adsorption process are HCPL and MCO1, due to their large negatively charged surface (around −15 mV at pH values lower than 3).
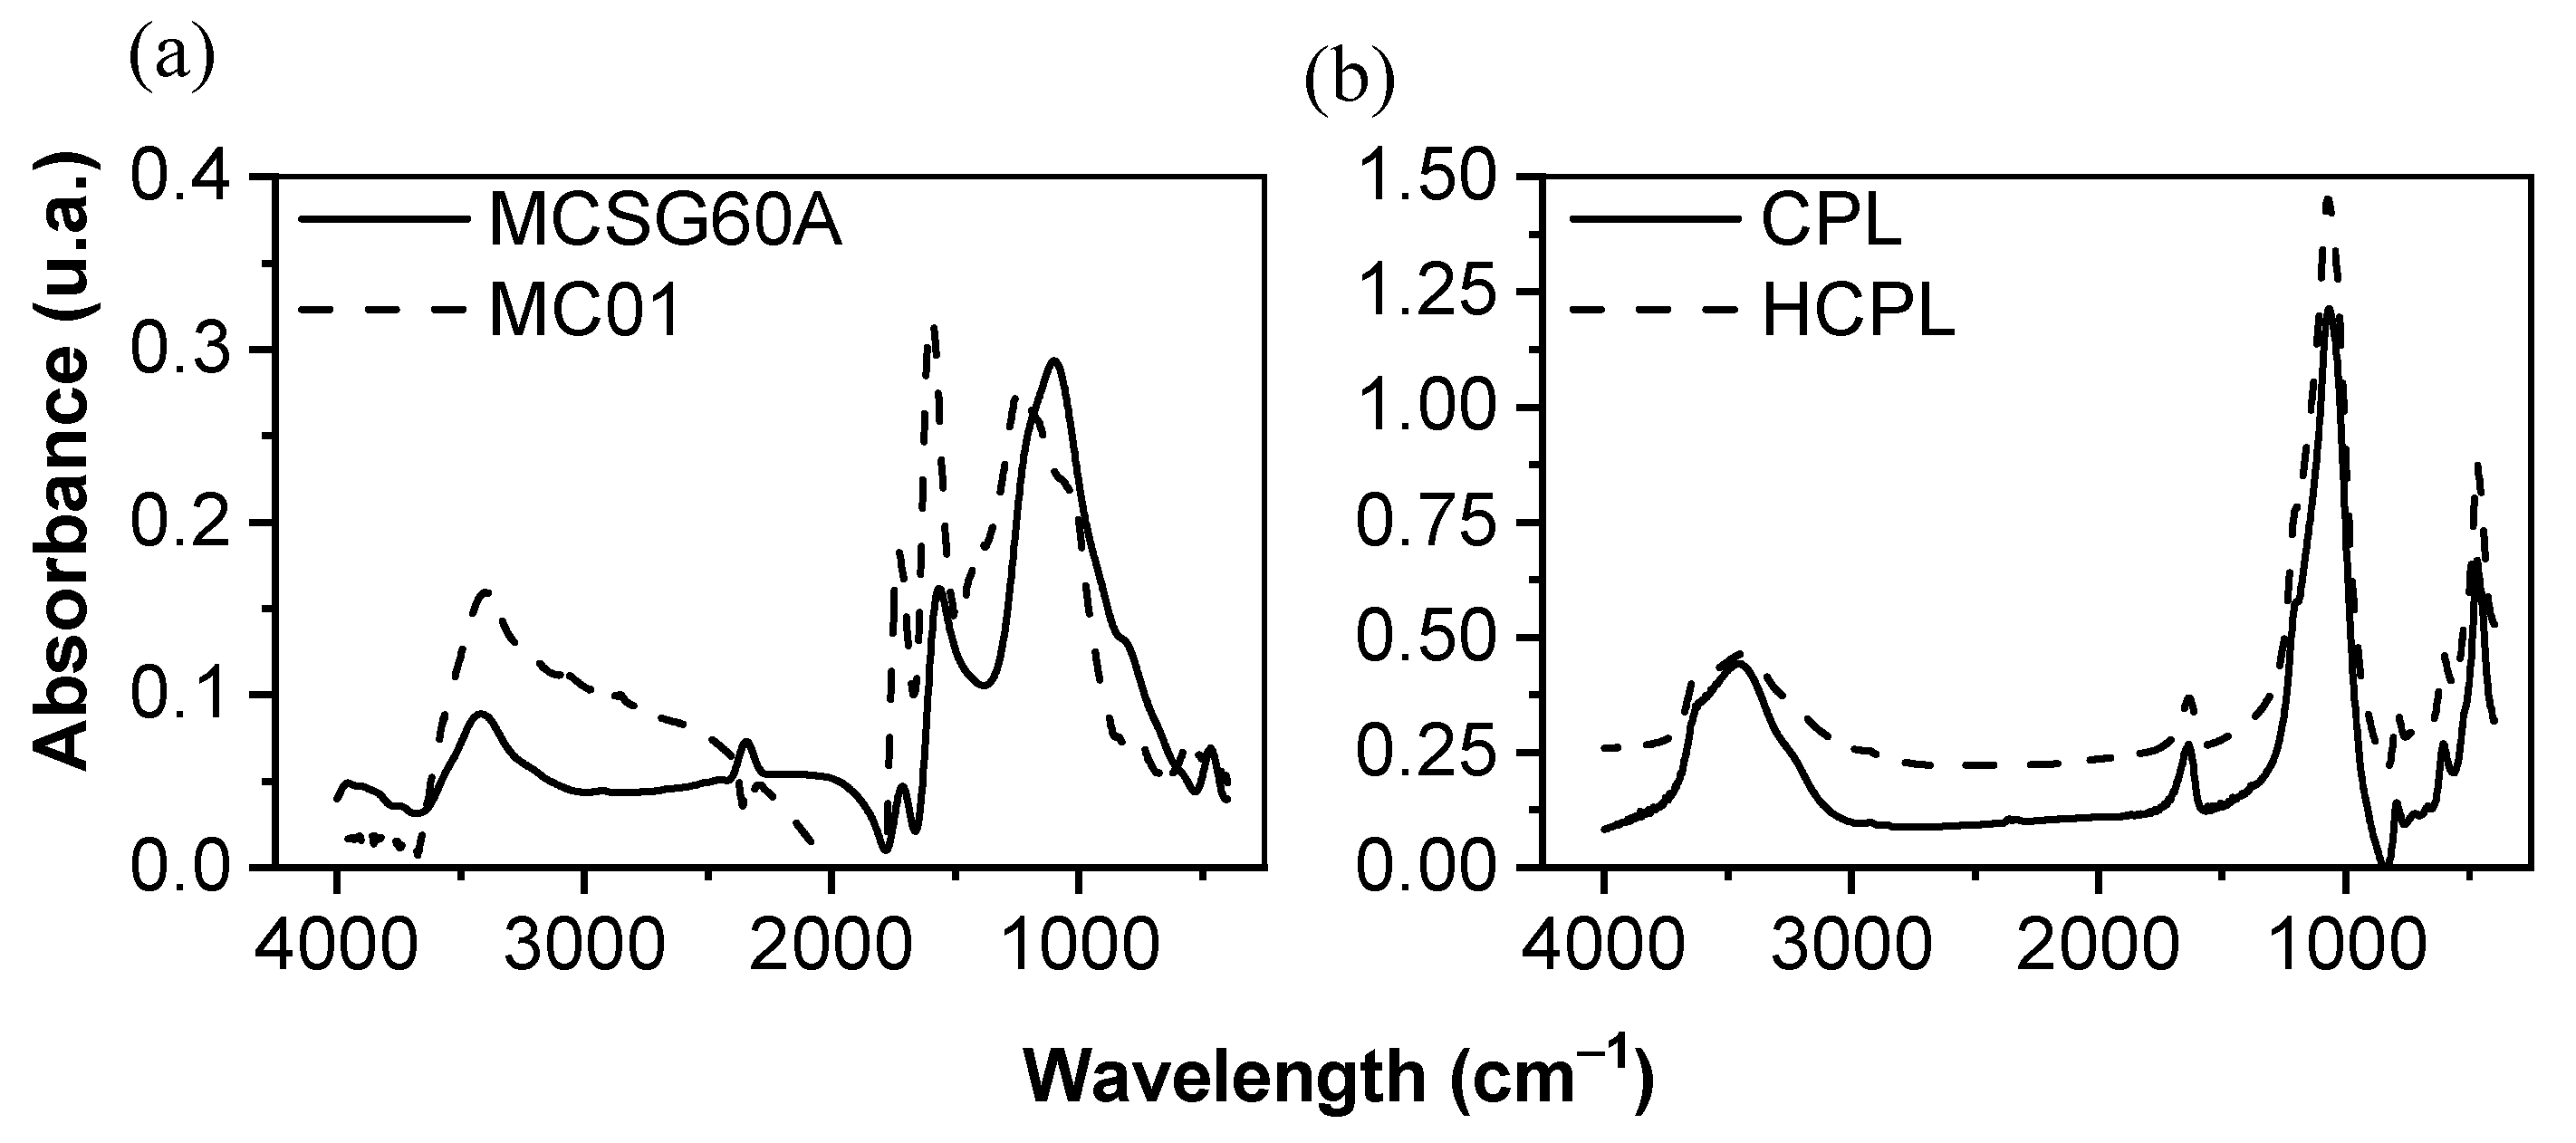
FTIR spectroscopy analysis has been used to characterize the surface chemistry of the adsorbents employed. The results of the analysis are shown in Figure 3. Due to their different surface chemistry, the results will be discussed separately.
Both carbonaceous materials showed a similar FTIR spectrum. Their peaks were numerous and high due to the presence of a wide range of oxygenated groups on their surfaces, promoted by their activation by oxidant atmosphere. The band around 1120 cm−1 is due to the presence of -CO from carboxyl groups, as well as the -OH group of phenol structures [37]. The band observed around 1560 cm−1 was attributed to non-aromatic carboxylic acids and lactone structures [39], and the band around 1700–1725 cm−1 suggested the presence of carboxylic acid, C=O groups, ketones, aldehydes and benzene rings [40]. Additionally, the presence of -COOH groups was associated to the band at 2360 cm−1 [41]. The band at 2900 cm−1 was assigned to the C-H vibrations of aromatic and aldehyde groups. At 3400 cm−1, the band corresponded to the O-H stretching vibrations of OH anions of the phenol hydroxyl groups, linked by hydrogen bonds with the π electrons of the aromatic ring (OH-π) [41]. To sum up, all the detected groups increased the negative charge of the surface (COOH, C=O, O-H, etc.). The main difference between both synthesized activated carbons is the bands intensity, being larger in MCO1, except for the band 1120 cm−1. Considering what groups are attributed to each band, both materials showed carboxyl and phenolic groups as predominant. However, the peaks at 1560, 1725 and 3400 cm−1 were larger for MCO1 than MCSG60A: this suggests that MCO1 have more carboxylic and phenolic groups than MCSG60A, and, as previously discussed in the Z-potential analysis, is a consequence that toughen the carbonization conditions and leads to a partial oxidation to aldehyde, ketone and quinone groups.
Regarding the zeolites’ results, the FTIR spectra shown in Figure 3 is typical of clinoptilolite. It can be divided into two groups: internal vibrations of T-O (T=Si and Al) and vibration of external bonds between tetrahedrons, whose peaks appear between 1200–400 cm−1, and the bands due to the presence of structural H2O in the range of 1600–3700 cm−1. The spectra for both materials are very similar, indicating that their original structure has not been modified by the HCl treatment.
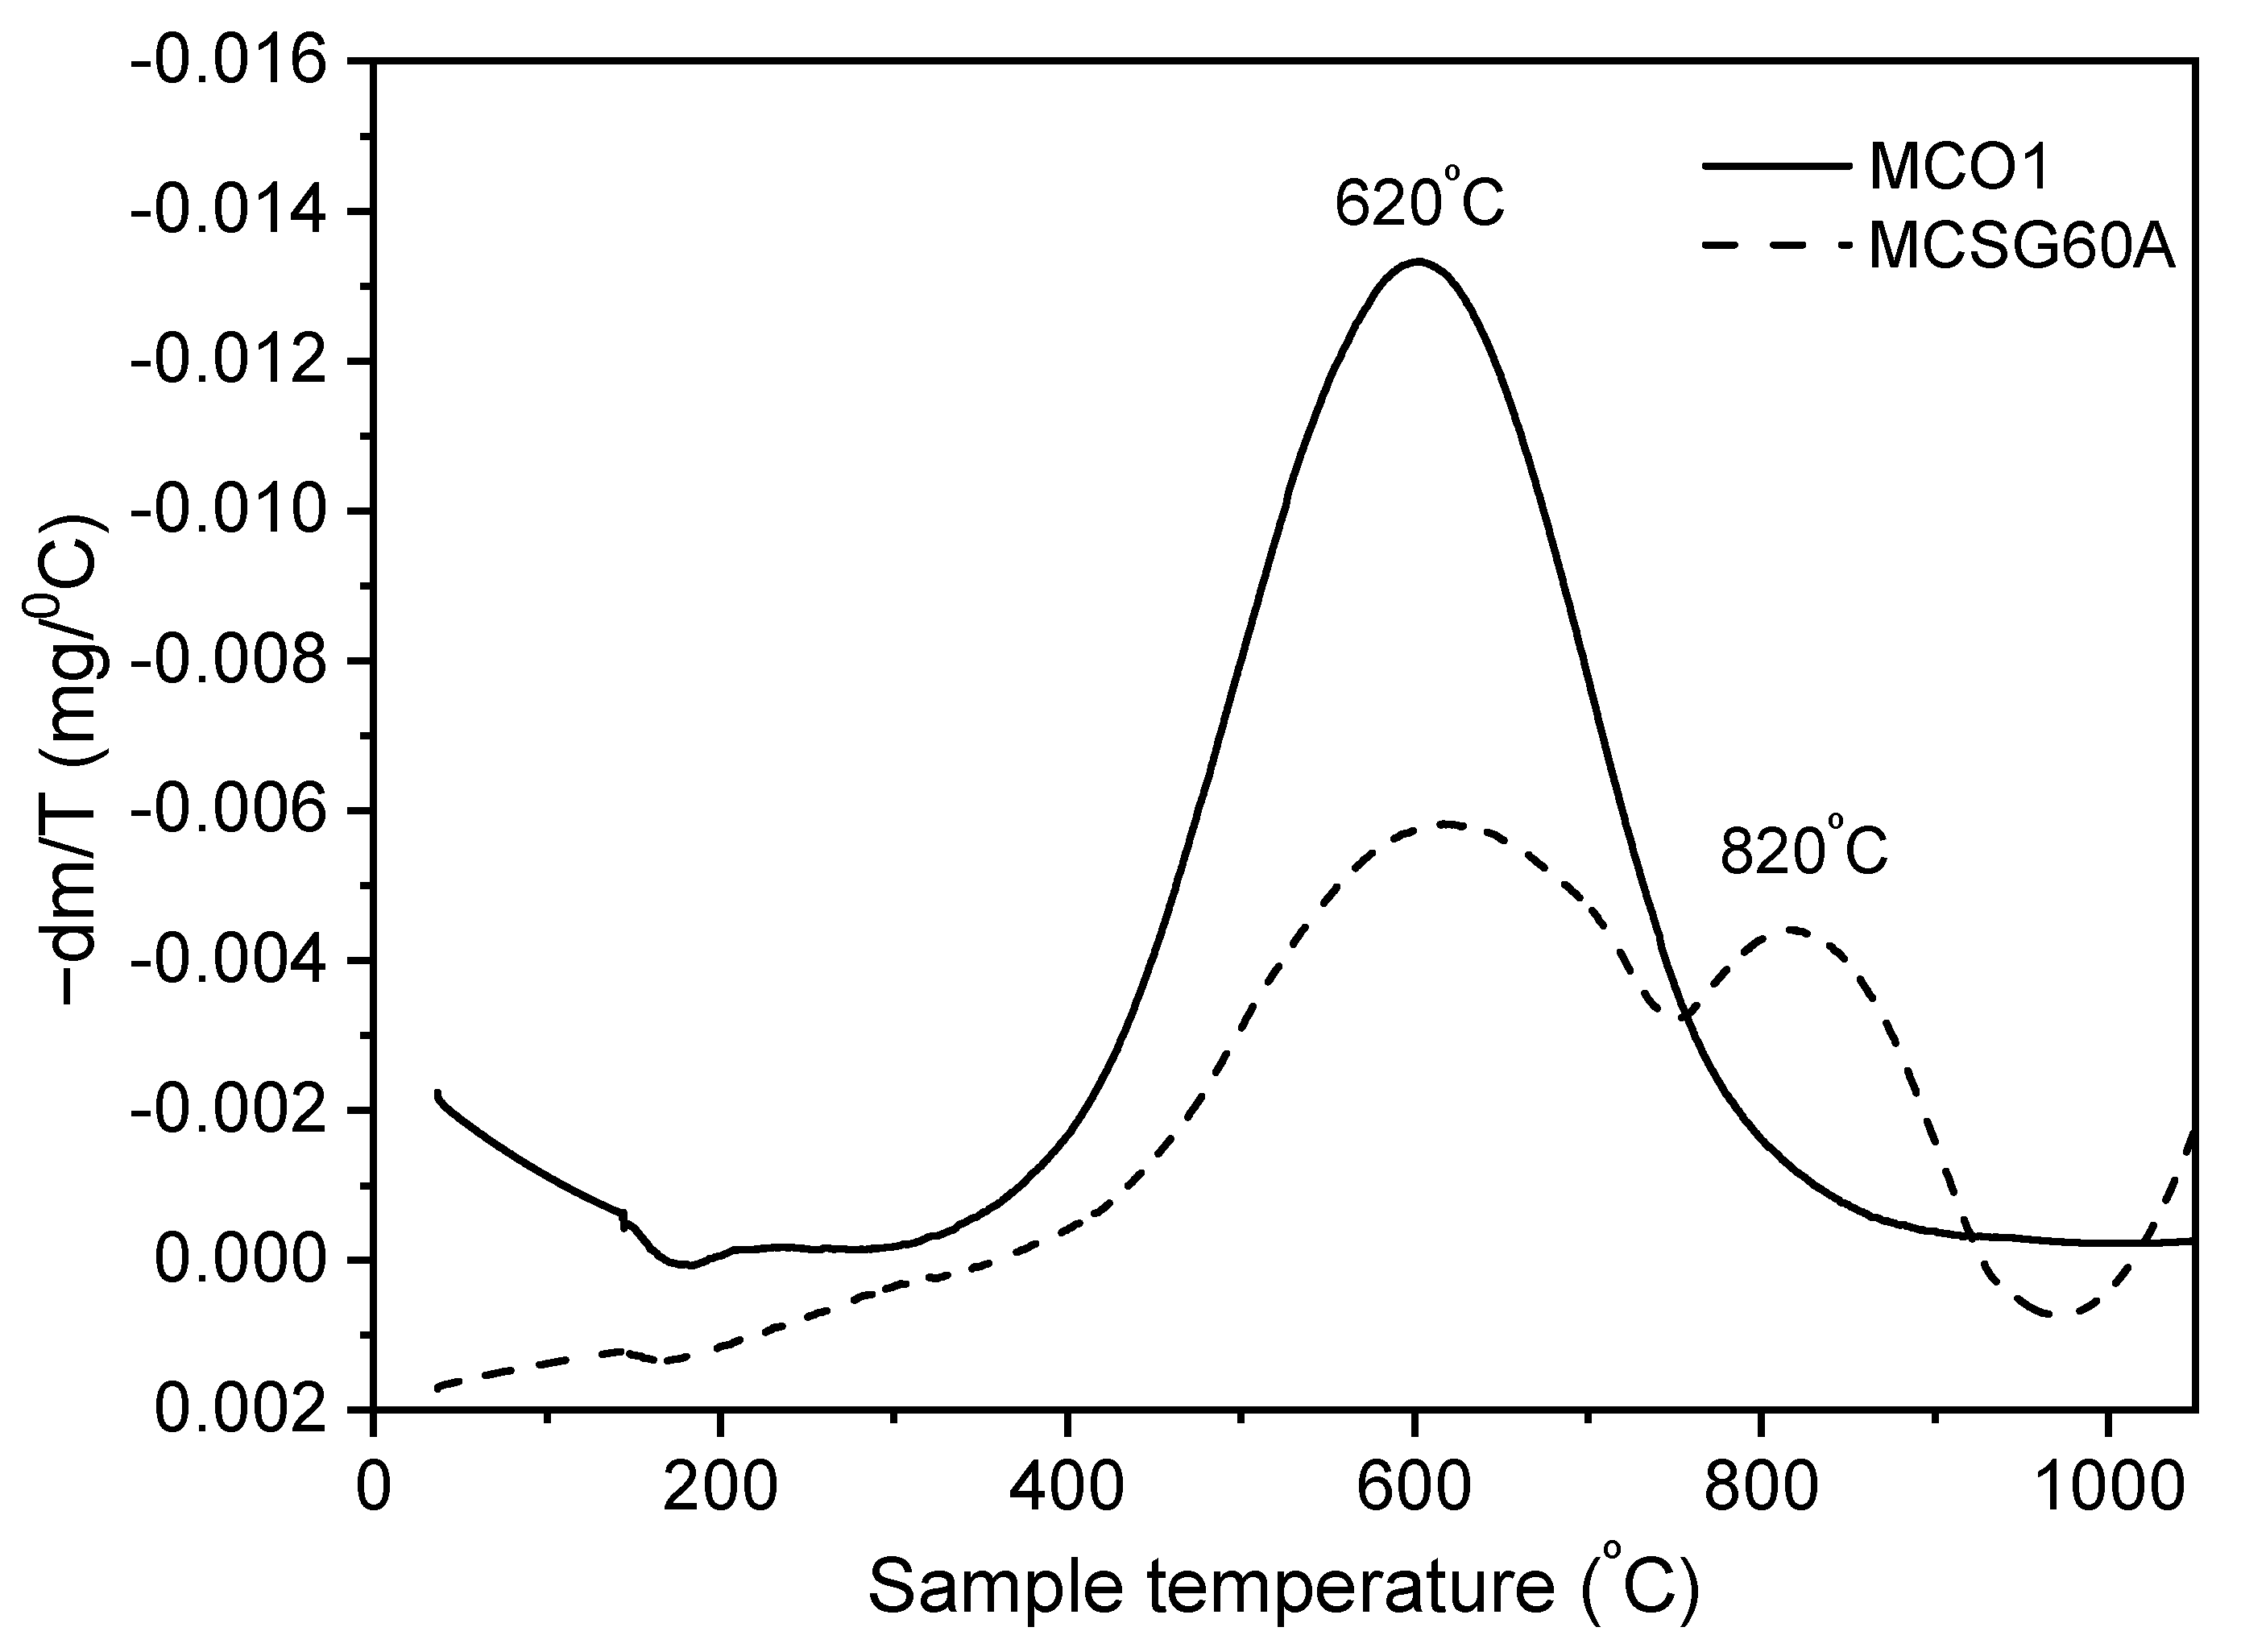
The thermogravimetric analysis was carried out for both carbonaceous and zeolitic materials. However, only the results for carbonaceous materials are shown. The thermogravimetric analysis of the zeolites displayed a common pattern for this kind of material: about 8% of the zeolite was lost due to dehydration and dehydroxylation.
The results of the thermogravimetric analysis of the carbons are displayed in Figure 4 as DTG (Derivative of the TG curve) vs. temperature plots. This analysis was carried out under an inert helium atmosphere (50 mL/min), heating the samples from 35 °C to 1050 °C with a heating rate of 10 °C/min. A priori, a weight loss was expected in both materials, due to the decomposition of the oxygenated groups into CO and CO2 [42].
The thermogravimetric analysis indicates that MCSG60A and MCO1 lose 15 and 35% of their weight, respectively. However, the water desorbed is negligible in both cases, since below 400 °C there is no noticeable weight loss. Therefore, the difference in the behavior of MCSG60A and MC01 is due to the different number of oxygenated groups in the solid surface of both carbons, since these groups dissociate with temperature. Another important aspect to consider is that, as shown in the DTG curve, the decomposition temperatures vary from one carbon to the other: MCO1 showed an important weight loss around 620 °C assigned to decomposition of a high quantity of phenolic groups [42]. MCSG60A exhibited two weight losses: between 500–750 °C, attributed to phenolic groups, and another in the interval 650–950 °C due to the decomposition carbonyl groups. This is in agreement with the aforementioned statement: more severe carbonization conditions lead to a partial oxidation to aldehyde, ketone and quinone groups.
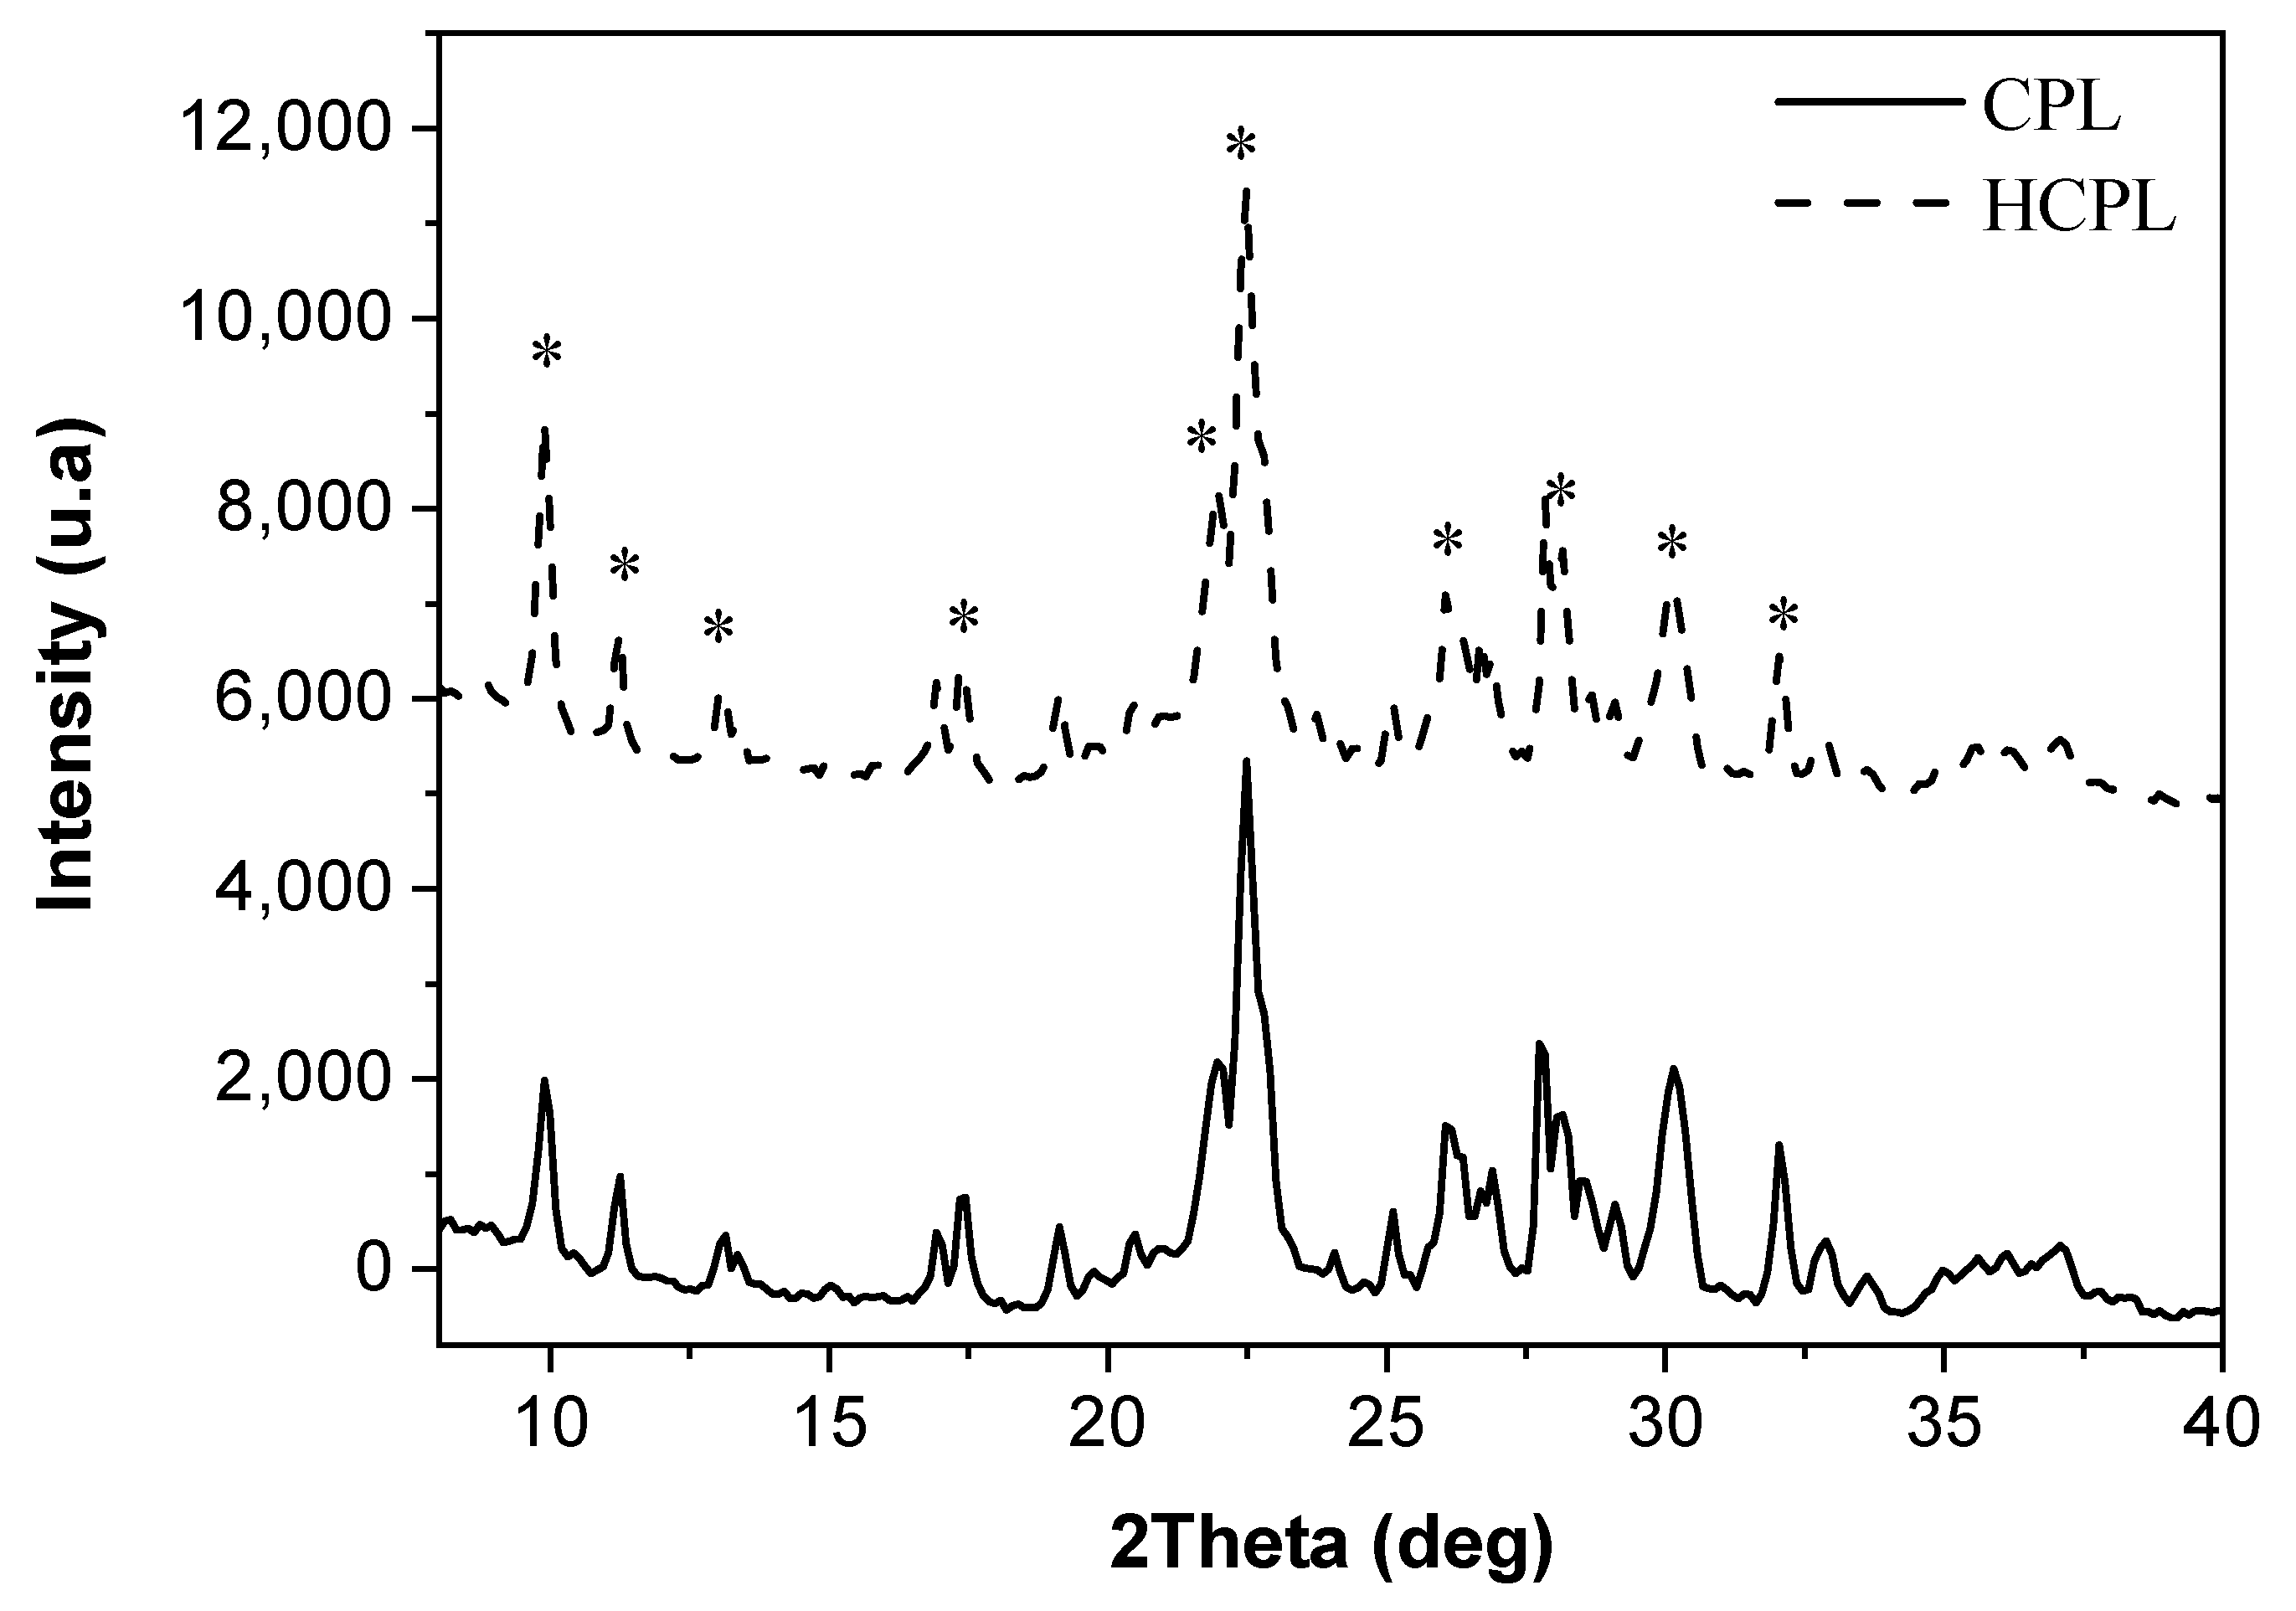
Additionally, in the case of the zeolitic materials, two additional analyses were carried out: X-ray fluorescence (XRF) to analyze the chemical composition and X-ray diffraction (XRD) to study the morphology. The XRD results are shown in Figure 5, while the XRF results are shown in Table 2.
The XRD results reveal that the materials employed present the characteristic peaks of clinoptilolite (*) agreeing with the FTIR results obtained [43]. The intensity of the peaks is very similar for both materials, so it can be concluded that the relation Si/Al is kept constant (an increase in Si/Al implies a reduction in the intensity) and the exchange of initial cations by protons has not been completed (exchanging larger cations like calcium, or potassium by protons produces an increase in the intensity). This statement will be confirmed with XRF results.
The elemental composition analysis shows that two clinoptilolite contains exchangeable ions as sodium, potassium and calcium. The silicon to aluminum ratio ranges from 6.06 to 6.49. The difference between these values can be considered negligible and it can be concluded that the zeolite treated with acid has not suffered the dealumination process. Regarding the quantity of hydronium ions exchanged, the milliequivalents ratio between cations and aluminum was calculated. As can be seen, these ratios are very similar for both materials, indicating that the protonation has not been very high. These results coincide with XRD and FTIR results.
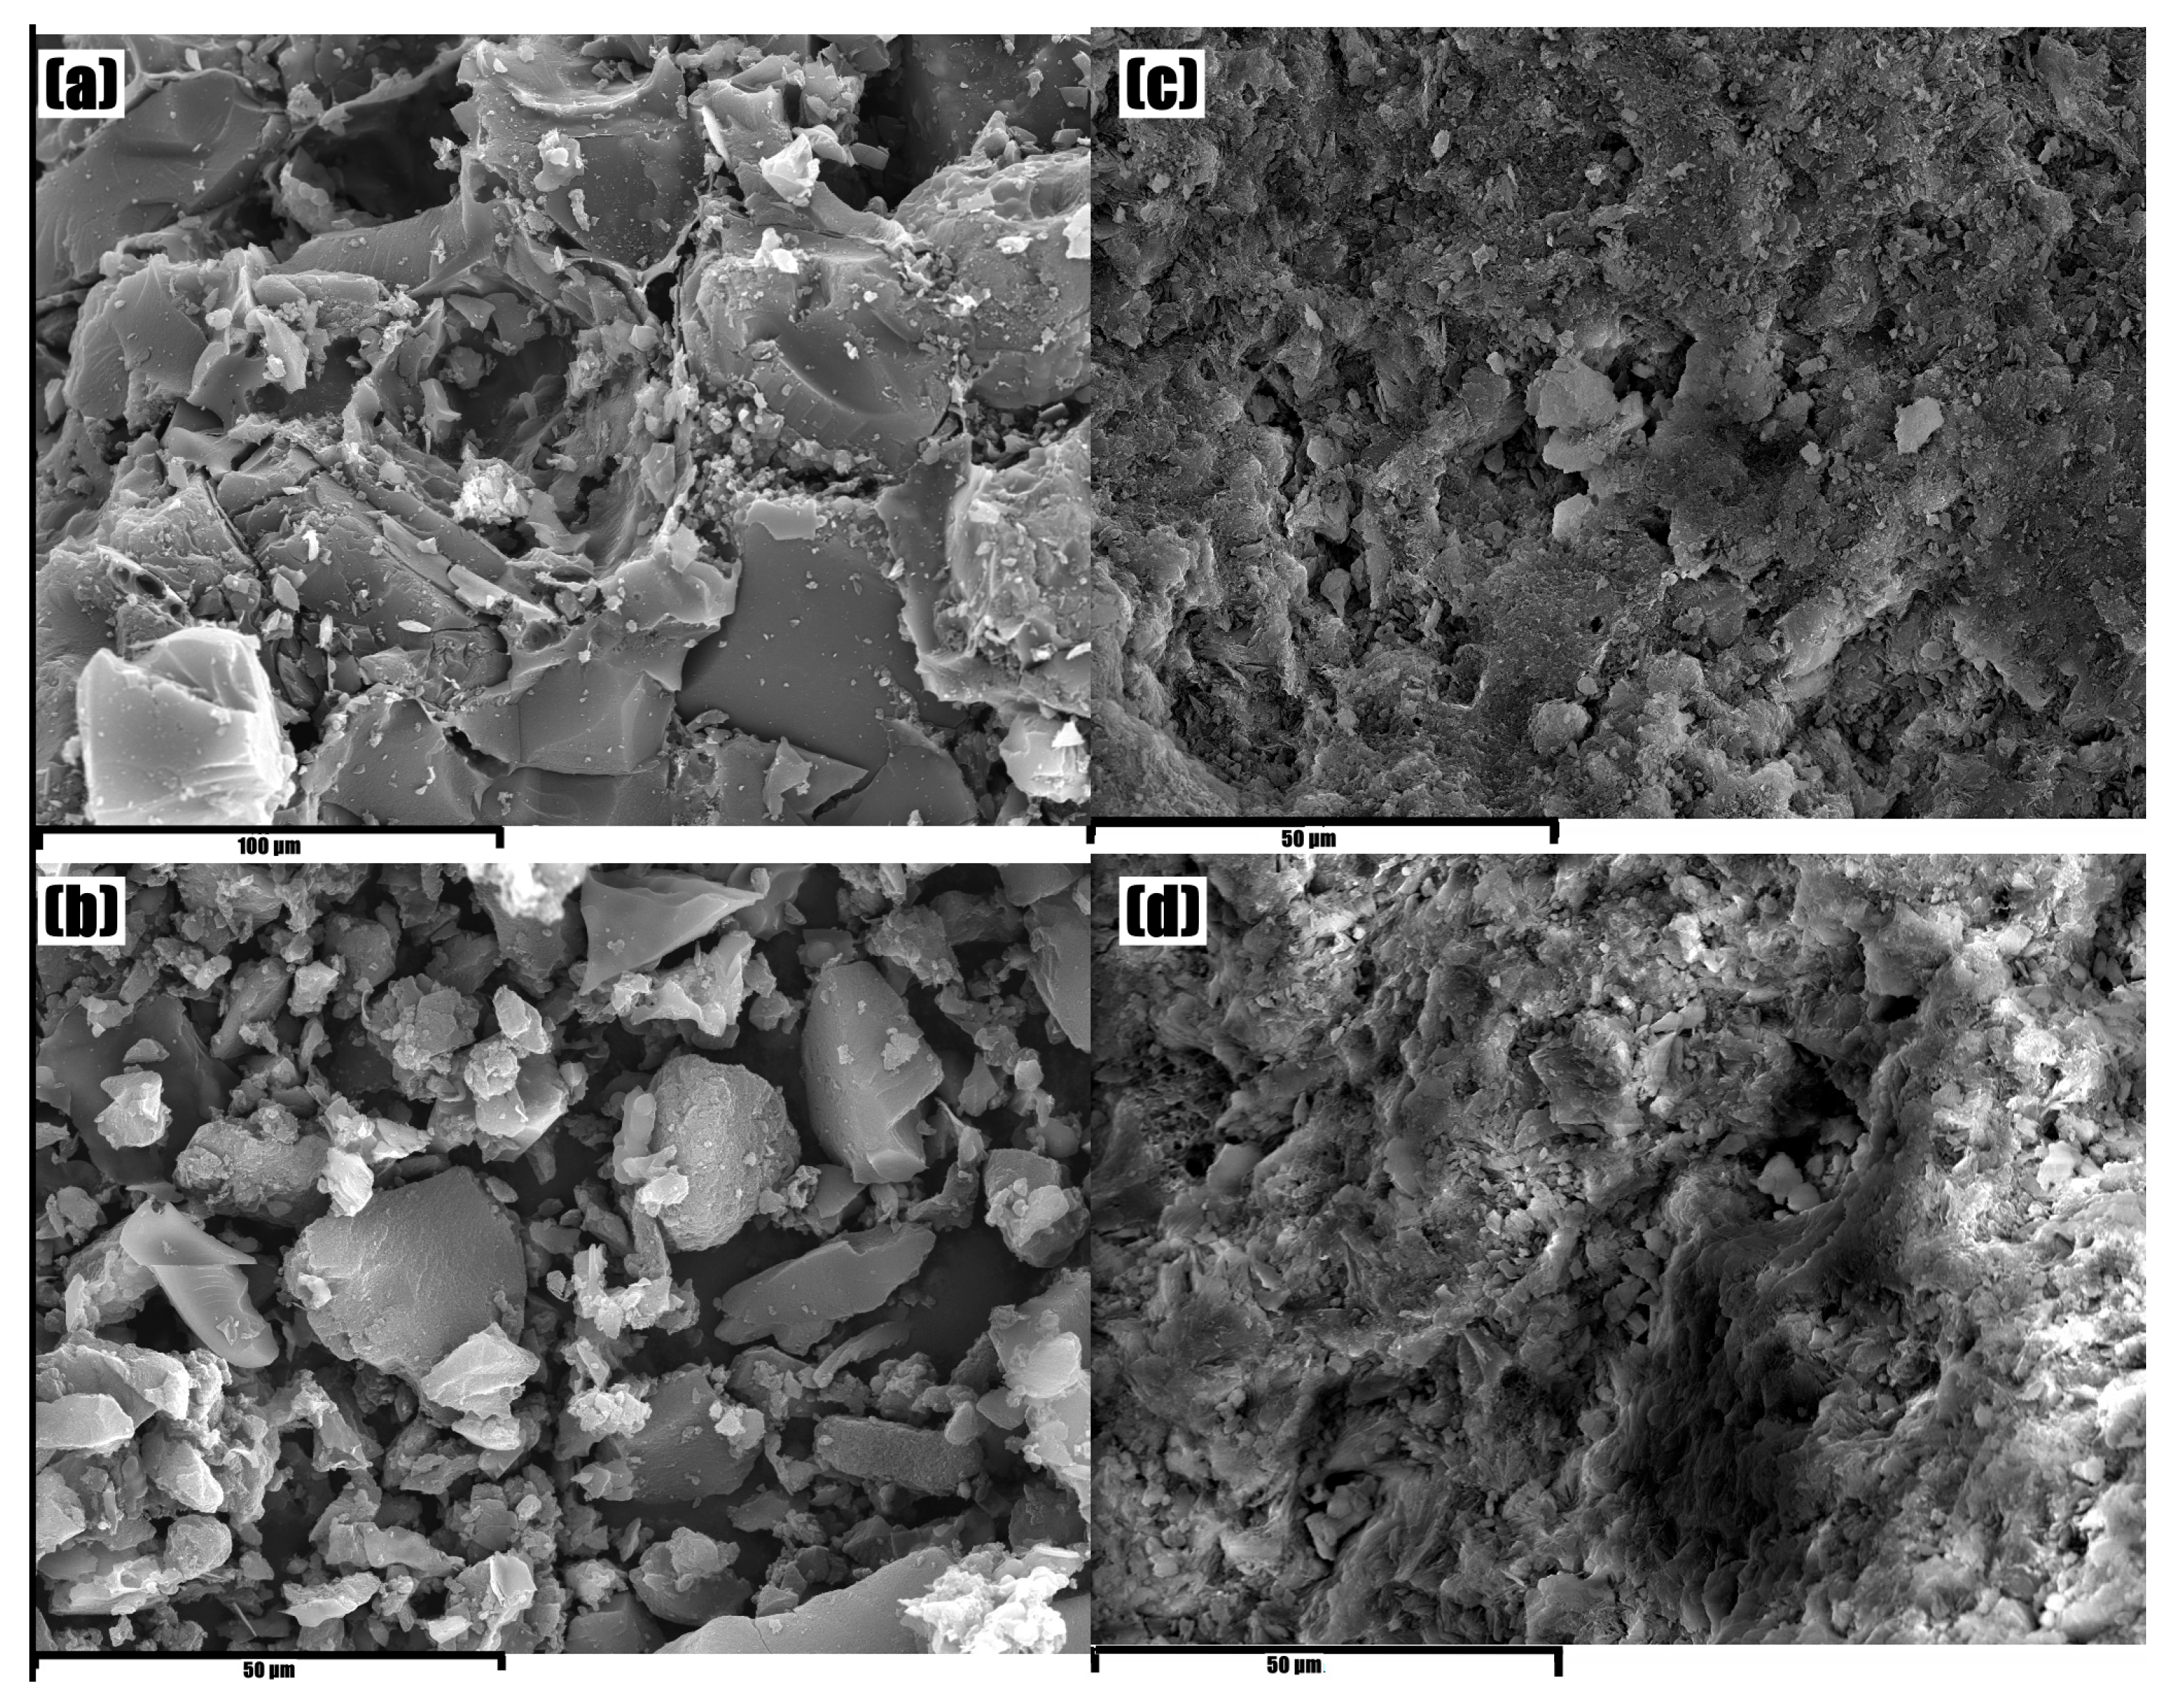
Finally, the morphology of the solids was studied by means of SEM images, which are displayed in Figure 6. As can be observed, the carbon particles present an amorphous appearance and an irregular surface, characteristic of disordered mesoporous carbons. On the other hand, the SEM images of the zeolites display a set of irregular shapes without edges.

3.2. Gallium Adsorption

Firstly, before starting the experiments, the speciation diagram of gallium must be considered. Gallium precipitates as gallium hydroxide at pH beyond 3 (approximately 3.2) [44]. For this reason, all the experiments are carried out in a range of pH between 1.5 and 3. In the case of the carbonaceous materials, this situation is not a problem because they reduce the pH at a value lower than 3, due to the phenolic groups in their structure; however, in the case of the natural zeolites, it is necessary either to add acid to the solution to reduce the pH, or to modify the zeolite with an acid treatment, because clinoptilolite in a suspension tends to increase the pH until values are between 7 and 9 [38]. The following sections show the adsorption kinetic and isotherms for each material, together with the thermodynamic study for gallium adsorption.
Adsorption Kinetic
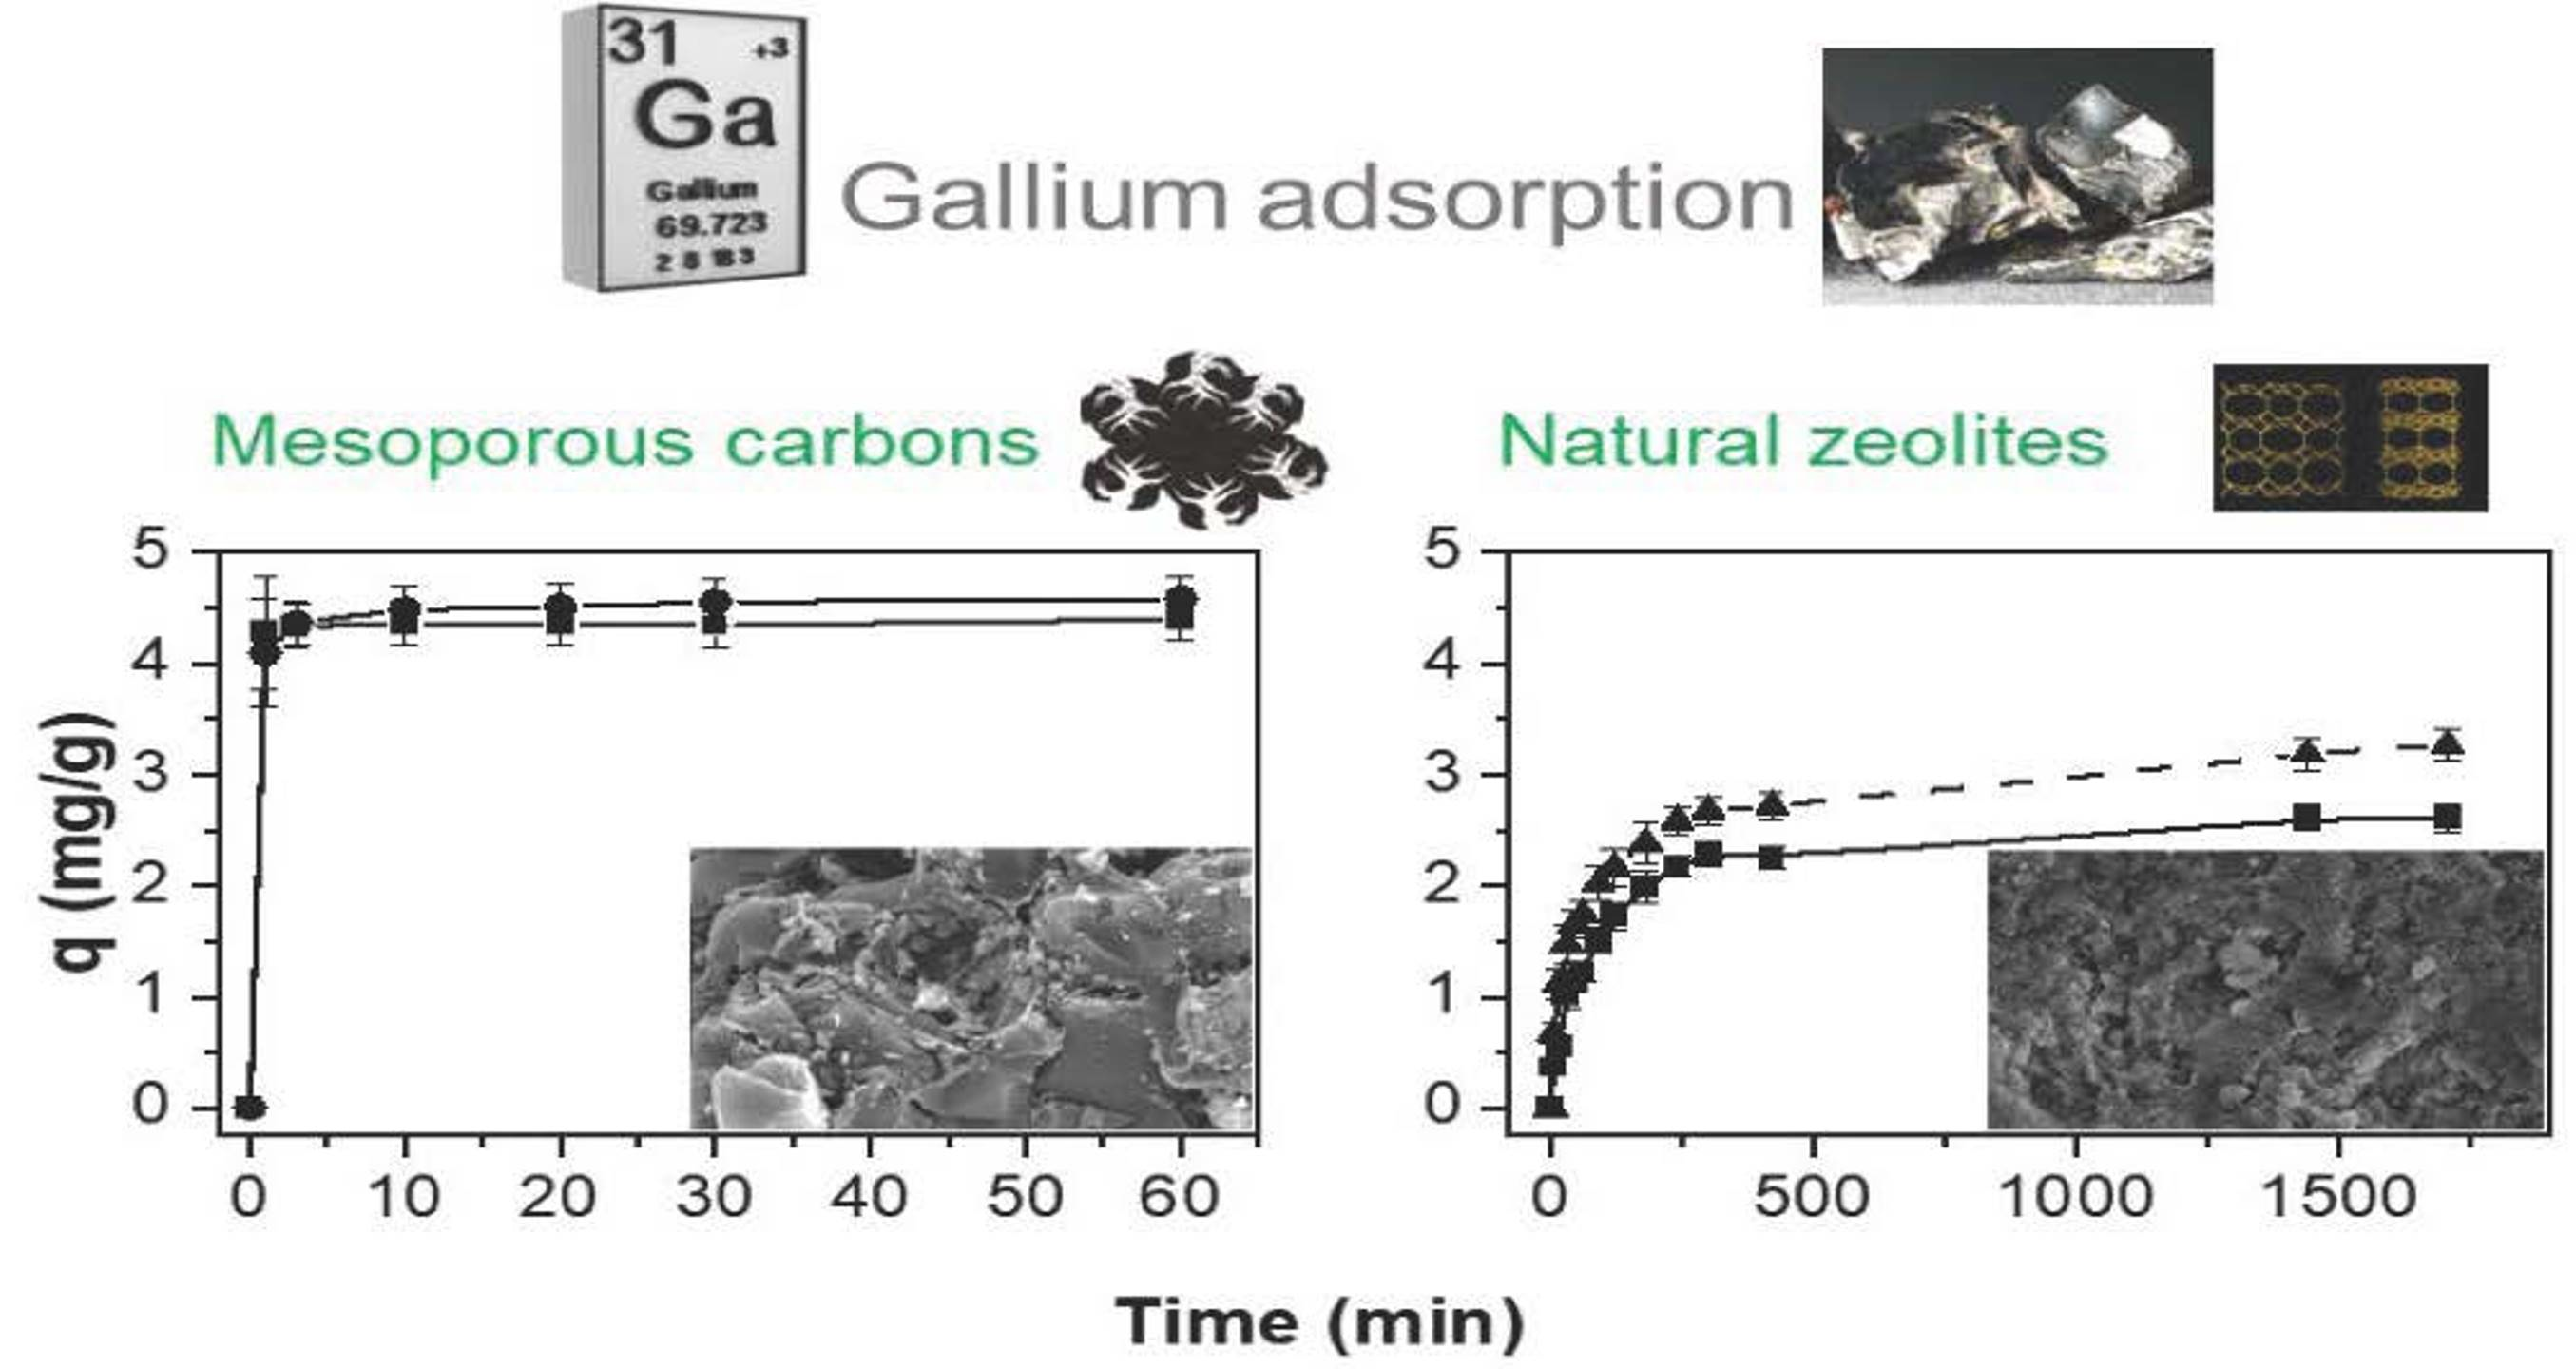
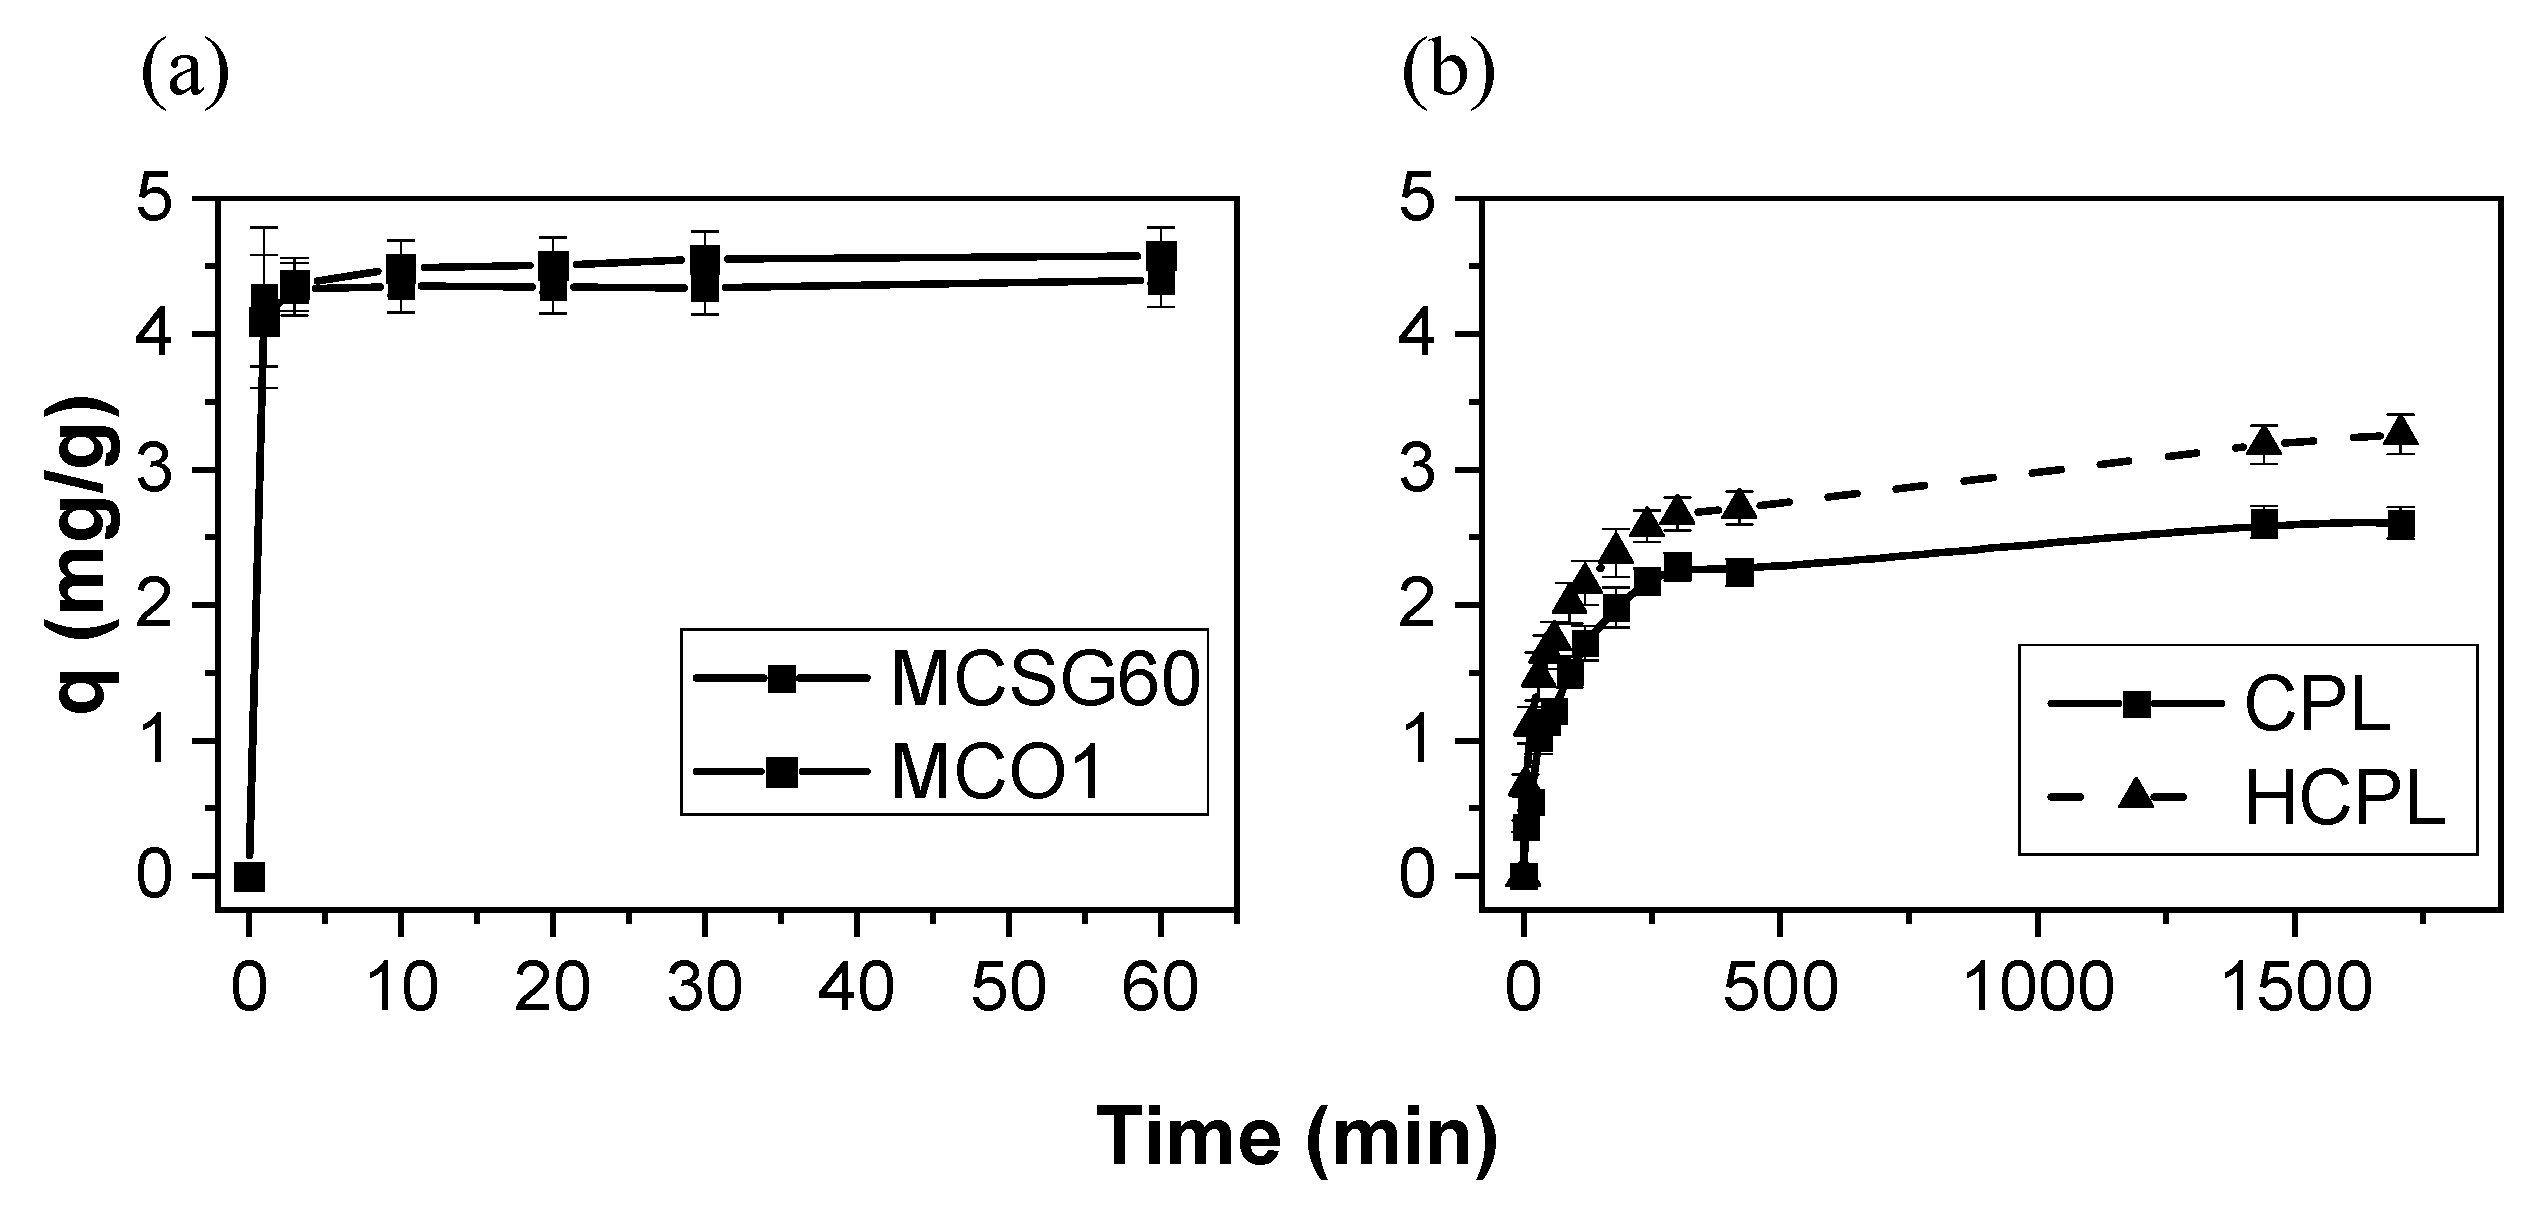
The adsorption kinetics were carried out for the four materials. The results obtained are shown in Figure 7. In the case of mesoporous carbons and HCPL, the adsorption kinetic was carried out at a free pH (it was not necessary to add acid to keep the pH below 3.2, but for CPL it was necessary to add HNO3 to reach an initial pH of 2.2 (maximum value of pH at which the zeolite did not increase the pH to higher values than 3.2), in order to assure that all the gallium in water solution was in its ionic form.
As can be observed, the adsorption capacity is larger for the carbonaceous materials. A plausible explanation is their high specific surface compared with zeolites (Table 1). If the results are analyzed separately, in the case of the mesoporous carbons, the results are very similar for both materials, reaching an adsorption capacity of 4.40 and 4.60 mg/g for MCSG60 and MCO1, respectively. This slight difference could be associated with the surface chemistry of each material. MCO1 has more oxygenated groups than MCSG60A, so its surface is more negatively charged, as can be observed in the Z-Potential results (Figure 2). Therefore, despite its lower specific surface (365 m2/g for MCO1 and 911 m2/g for MCSG60A), this adsorbent can remove more gallium mainly thanks to its negatively charged surface, while MCSG60A reaches quite similar values, mainly due to its larger specific surface, which is also negatively charged. Thus, in the case of carbonaceous materials, the most important aspect is the presence of an oxygenated group, which promotes a negative surface charge.
For the zeolites, HCPL has the largest adsorption capacity, which is 33% higher than natural clinoptilolite. The main reason for this is that HCPL has been treated with HCl, so it is not necessary to add acid to keep a pH below 3.2, while in the case of CPL it is necessary to add acid until a pH of 2.2 has been achieved. Consequently, there is a competition between protons and gallium. This is caused by the poorer results obtained: the clinoptilolite adsorbs the H+ first, due to its ionic radius and ionic mobility [45].
Employing the Equation (2), the gallium removal efficiency for each material was calculated and then compared with data from the literature. The results are summarized in Table 3:
To investigate the gallium adsorption mechanism on these materials, the adsorption kinetic data were fitted to different kinetic models (Table 4).
Table 4. Kinetic models.
Kinetic Model EquationReference
Pseudo-first-order kinetic model or Lagergren equation
ln q e q = l n q e k 1 · t
[46]
Pseudo-second-order kinetic model
t q = 1 k 2 · q e 2 + t q e
[47]
Elovich kinetic model
q = 1 β · ln V 0 · β + 1 β · l n t
[48]
Where, q and qe are the gallium adsorption capacities of the adsorbent at time t and at equilibrium, respectively; (mg/g) k1 is the rate constant of first order (min−1); k2 is the rate constant of second order (min·g/mg); β and V0 are the desorption constant and the initial adsorption rates, respectively.
The pseudo-second-order model also allows the estimation of additional parameters, such as the initial adsorption rate (h) and the time when it reaches 50% of the maximum adsorption capacity (t1/2):
h = k 2 · q e 2
t 1 / 2 = 1 k 2 · q e
To analyze the accuracy of the fittings, correlation coefficient (R2) and Root Mean Squared Error (RMSE) were employed. The RMSE is calculated using the next expression:
R M S E = i = 1 n y e x p , i y c a l c , i 2 n
where yexp,i is the experimental value of the variable “y” (qe, t/q or ln(qe-q)), ycalc,i is the predicted value and n is the sample size.
The determined kinetic parameters obtained after fitting the experimental data (Figure 6) to the different models are displayed in Table 5. The results indicate that gallium adsorption follows the pseudo-second-order kinetic model, due to the higher correlation coefficient (R2) and low value of RMSE (attending to the y-axis scale), compared with the values obtained using both the pseudo-first-order model and the Elovich model. This is also confirmed by the fact that the values of the experimental adsorption capacity are very similar to that obtained by the model. The fact that this model fits the gallium adsorption results implies that the rate-determining step may be the sorption, because this model is based on this assumption. This affirmation will be further verified with the Weber and Morris model.
Comparing the parameters of the pseudo-second-order model (h and t1/2) calculated for both materials, it can be observed that the adsorption kinetic is much faster for carbonaceous materials—the time it takes to reach 50% of the maximum adsorption capacity is 0.16 min for the carbons, while for the zeolites it is 50 min. This fact agrees with the kinetic constant. This difference is accounted in terms of their pore sizes. Furthermore, the synthesized carbonaceous materials are mesoporous, with an average pore size of 60 and 270 Ǻ, while these zeolitic materials are microporous with a pore size of 4–9.5 Ǻ [49]. The hydrated radius of the gallium ion is 4.70 Ǻ, so the adsorption in the carbons materials is easier because the pore size is large enough to ensure the entrance of the gallium ion.
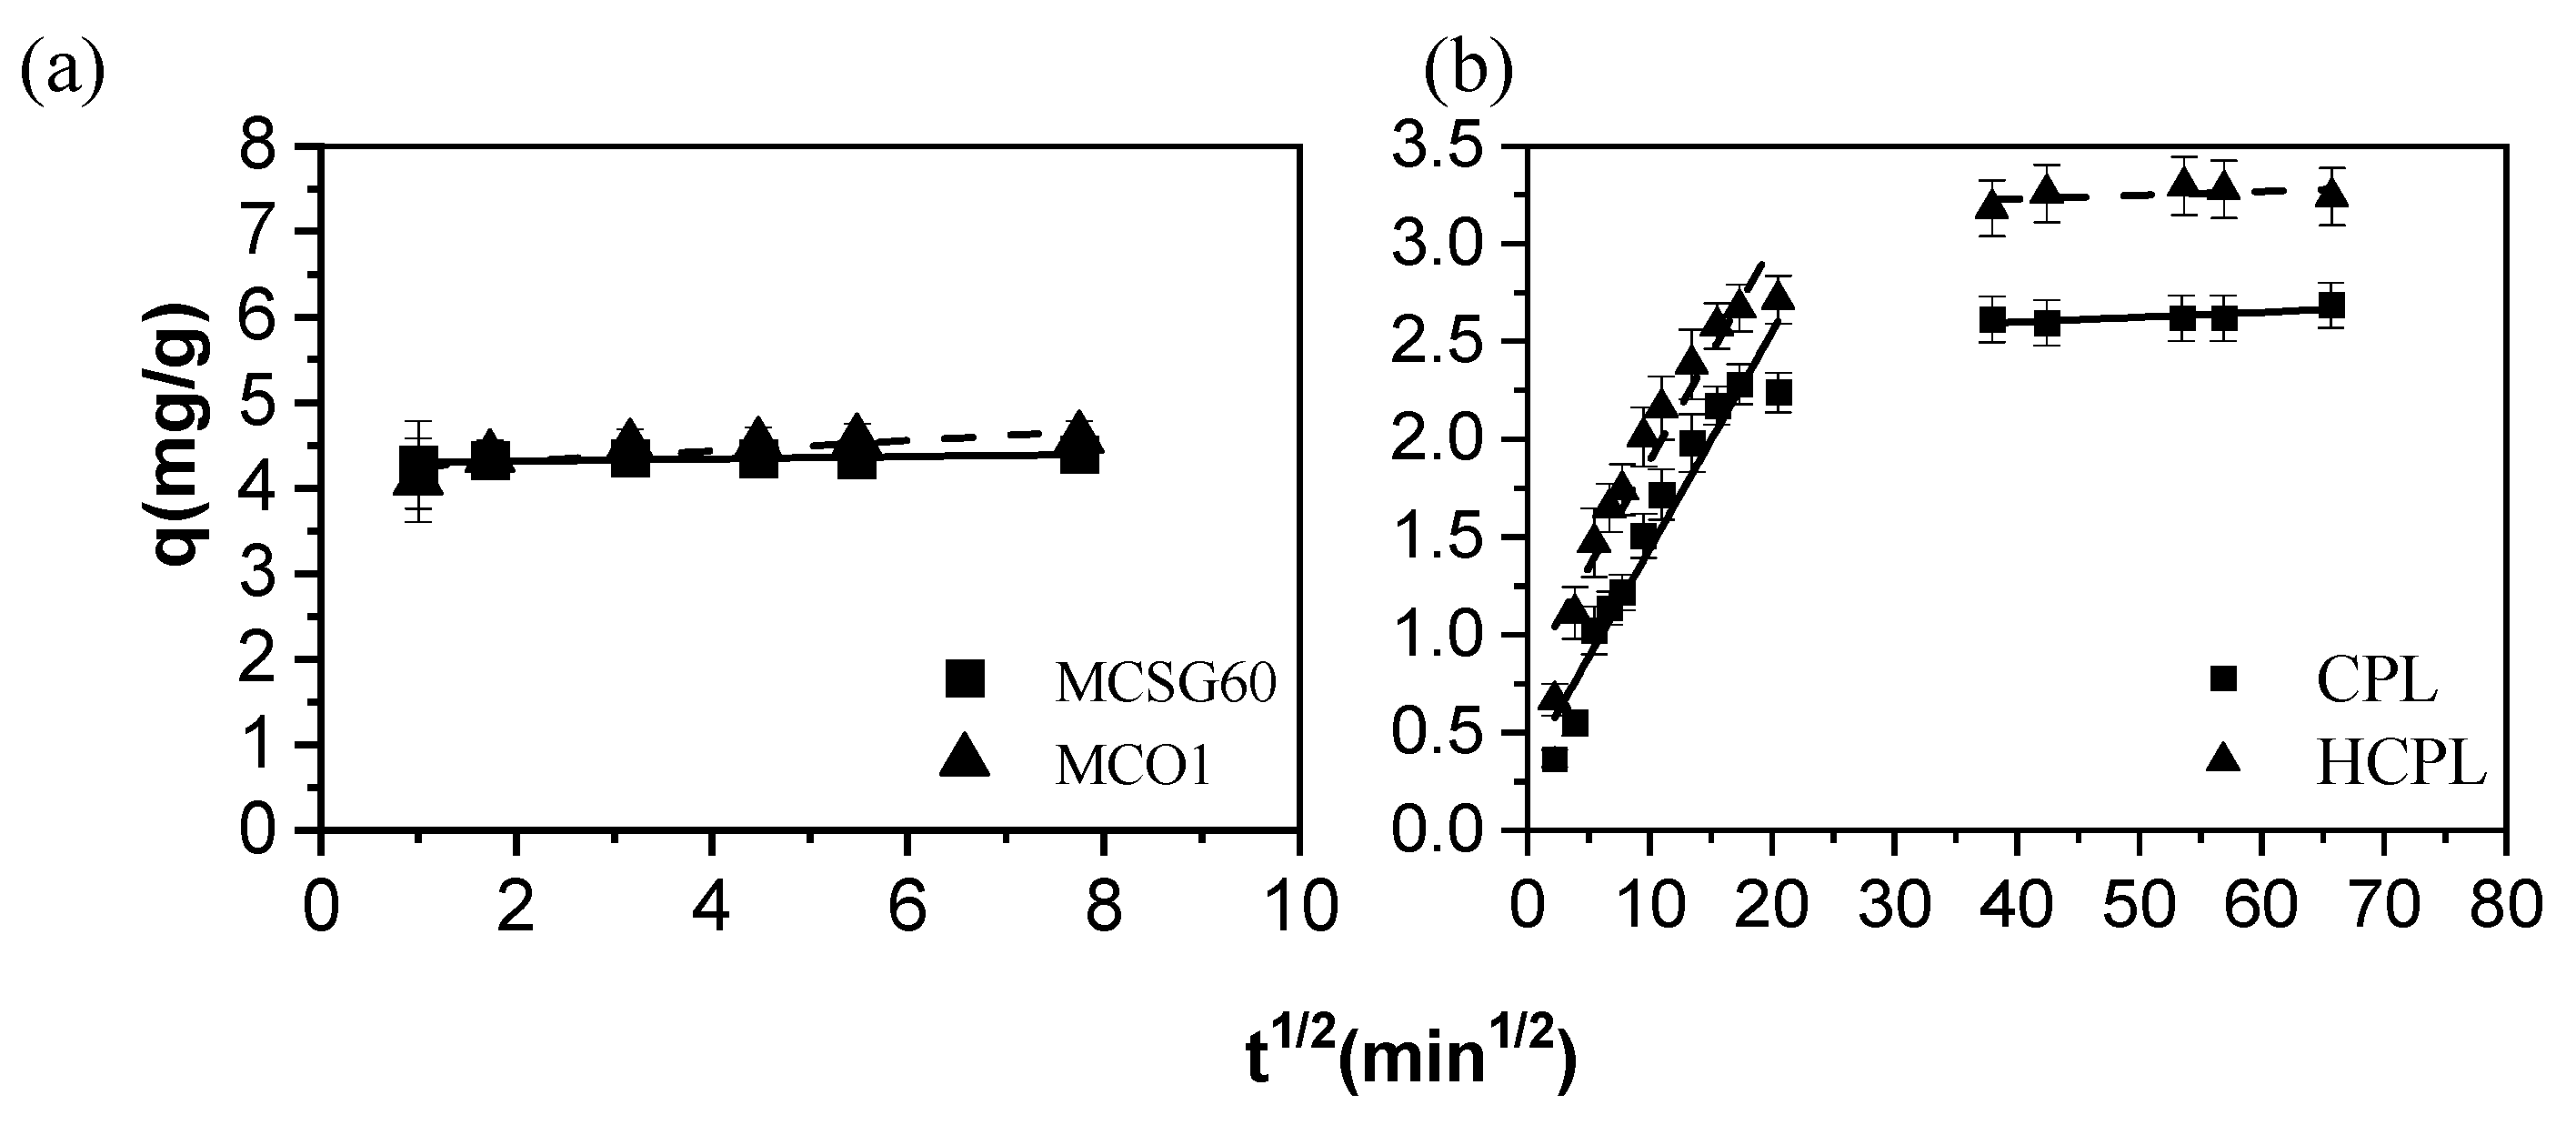
Nevertheless, the assayed models do not consider the diffusion step, which is important to describe the overall adsorption mechanism. Therefore, to elucidate the adsorption mechanism, the intra-particle diffusion model developed by Weber-Morris was used to further analyze the gallium adsorption process. This model is described by the following rate equation [50]:
q = k · t 0.5 + C
where k is the diffusion rate constant (mg·g−1·min0.5) and C is the intercept at the ordinate (mg/g). If the plot q vs. t0.5 gives a straight line and crosses the origin it can be assumed that the intraparticle diffusion is the rate-controlling step. However, if the data shows multi-linear plots, then two or more steps influence the sorption process. The adjustment to the Weber-Morris equation is shown in Figure 8 and the fitting parameters obtained in Table 6:
As it can be observed in Figure 8, in the case of clinoptilolite, the plots of q vs. t0.5 describe two straight segments, while in the case of carbonaceous materials the plots give only one segment. Therefore, it can be concluded that, in the case of the mesoporous carbons, the controlling step of the adsorption mechanism is the adsorption step, as the pseudo-second-order model predicted. Regarding the gallium adsorption on zeolitic materials, the results are completely different. In this case, the data can be perfectly fitted to the Weber-Morris model. The plot (Figure 7) shows two linear sections: before and after 30 min0.5. The first section can be assigned to the diffusion of the gallium ions through the solution to the external surface of the adsorbent, while the second segment reflects a gradual adsorption step, which is characteristic of the intraparticle diffusion of Ga3+ into the clinoptilolite channels. Therefore, in this case the adsorption mechanism indicates that two additional steps affect the rate of gallium removal apart from the proper adsorption process, but only one of them is important in a particular time region. The slope of each linear segment points out the rate of the corresponding process. As KI and KII show in Table 6, it could be assumed that the external diffusion occurs faster than the intraparticle diffusion. This fact is observed for both zeolites whose KI and KII values are quite similar. Additionally, the second segment does not cross through the origin (C > 0), meaning that the intraparticle diffusion, although important at longer contact time periods, is not the limiting step in the adsorption process being the adsorption reaction the controlling step.
Adsorption Isotherm
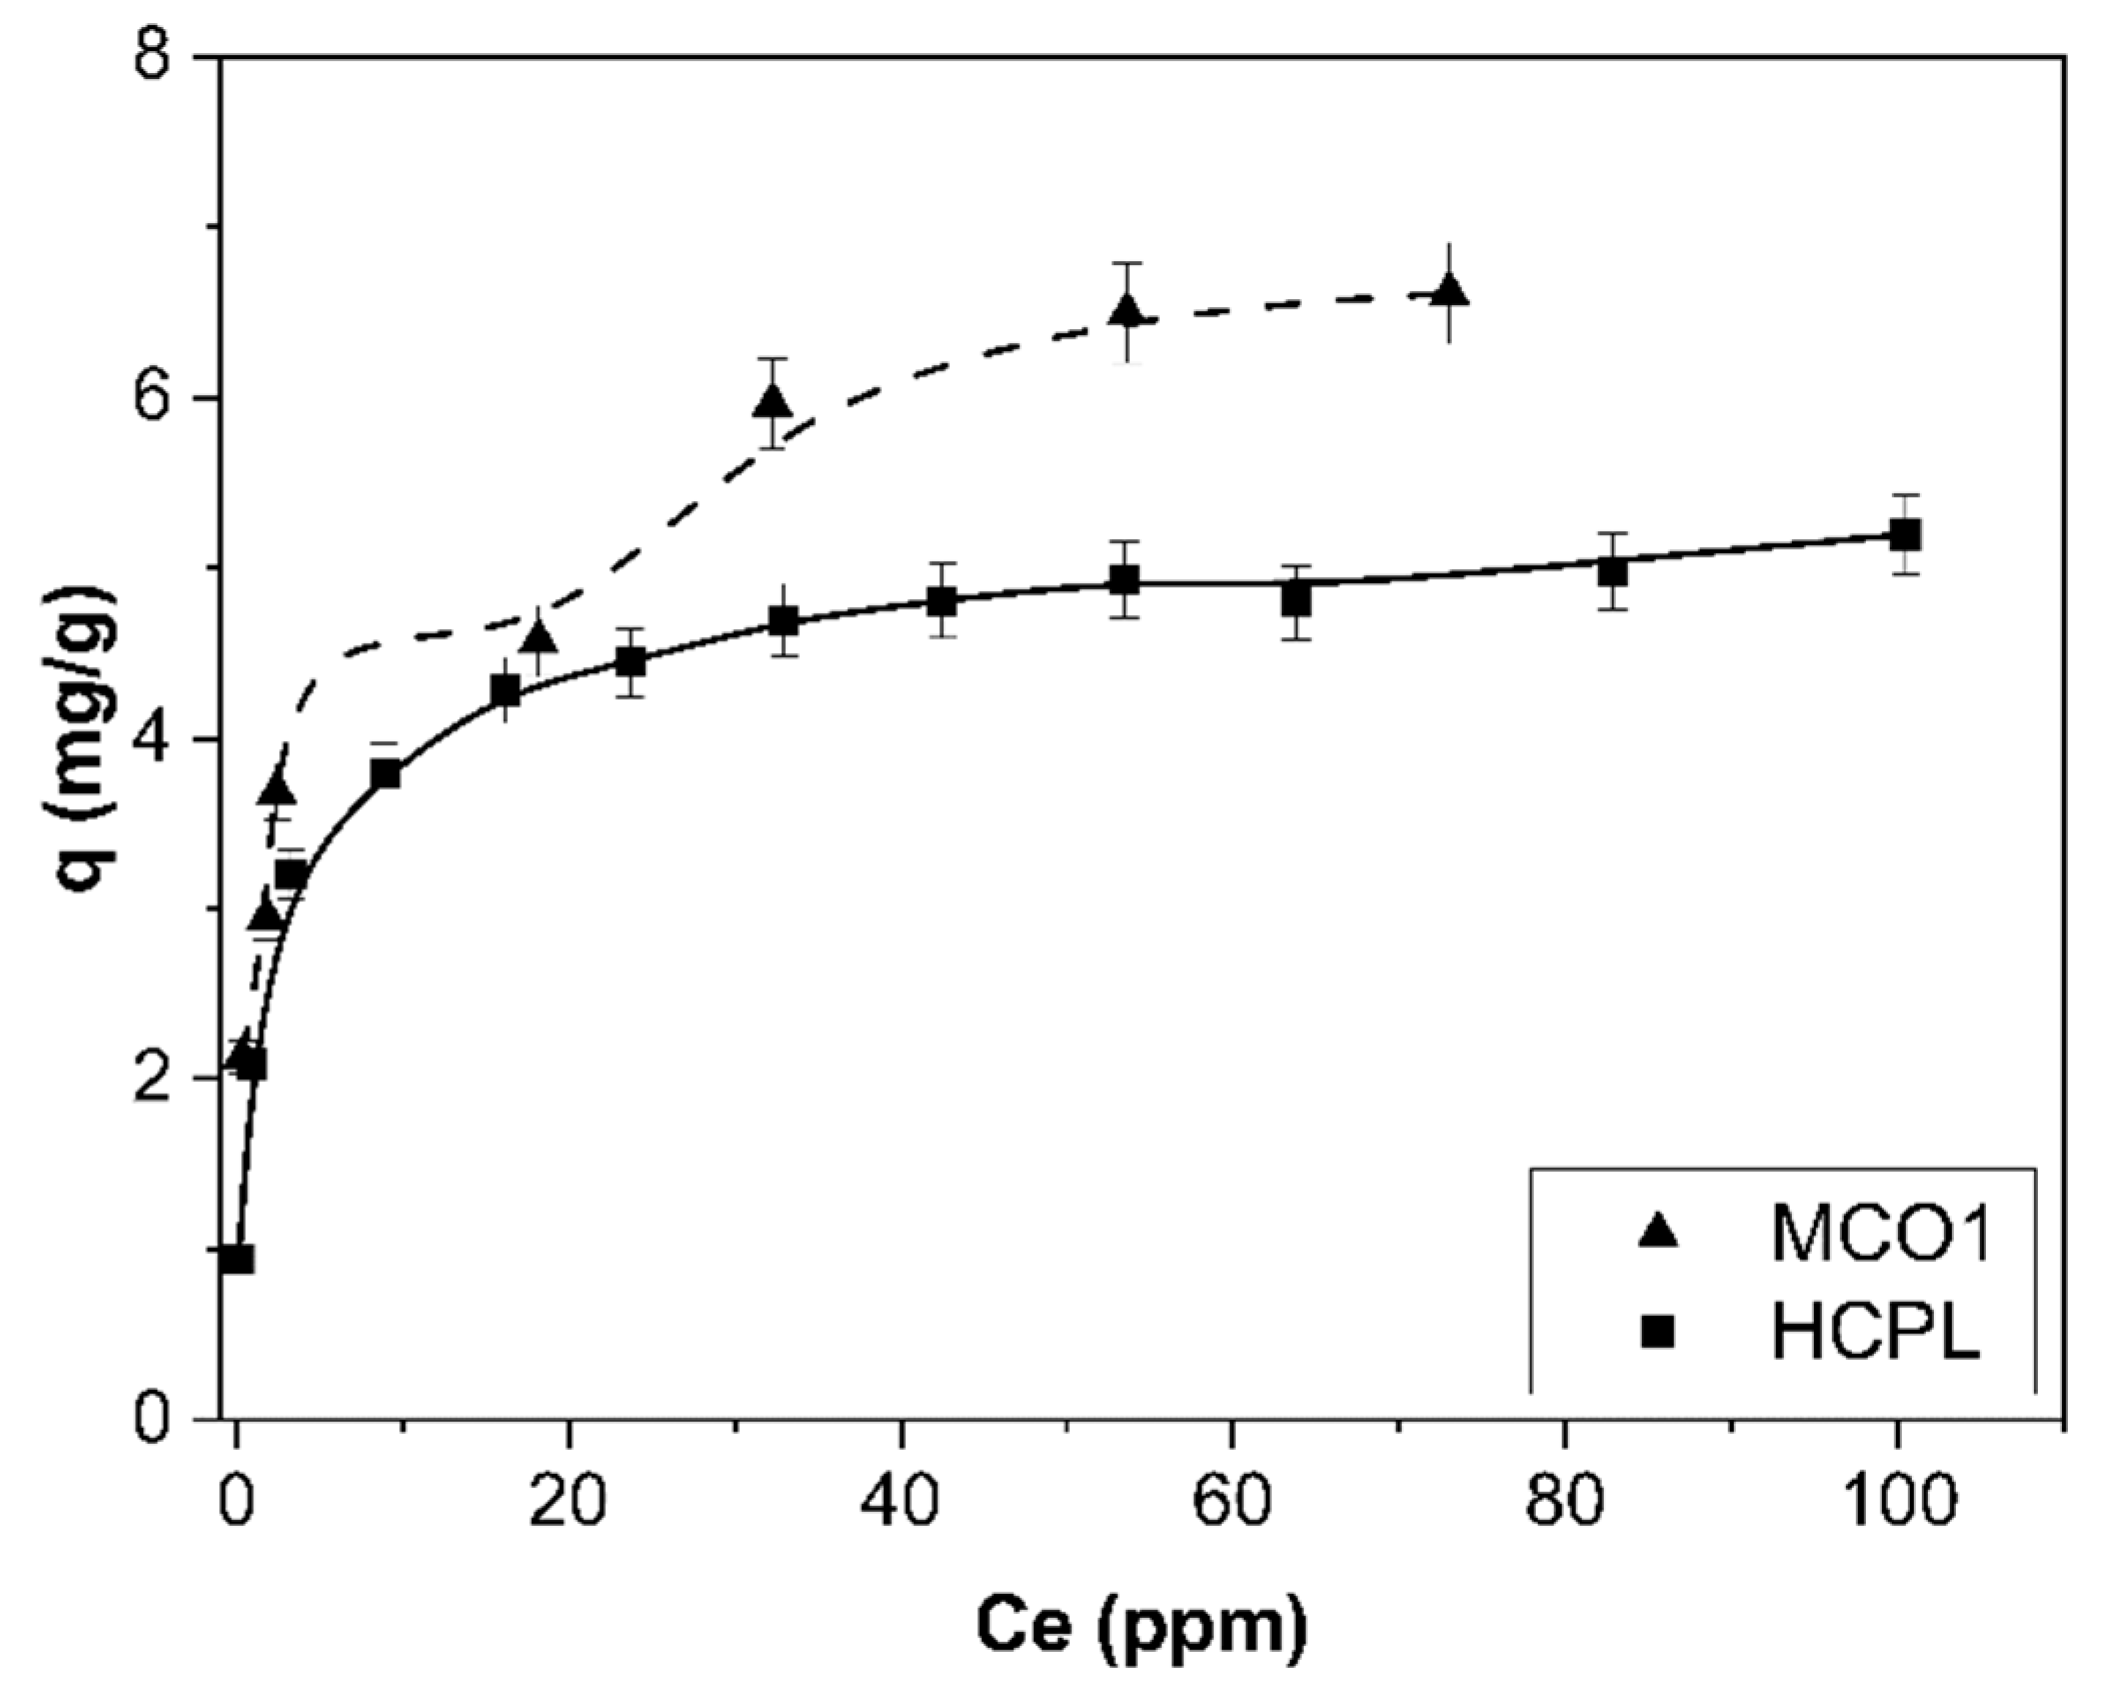
In this section, the gallium adsorption isotherms, which are one of the most important data to describe the interaction mechanism between adsorbent and adsorbate, will be analyzed. The equilibrium will only be studied for the best gallium adsorbents, which are MCO1 and HCPL. The adsorption equilibrium isotherms of MCO1 and HCPL are shown in Figure 9. The isotherms were carried out at initial gallium concentrations from 10 to 140 mg/L.
As Figure 9 shows, the isotherms are completely different, depending on the material studied. According to the Giles classification [51], the isotherm for MCO1 materials is an H-4 type. This shows that the gallium is adsorbed on the adsorbent surface by multilayer disposition, which is related to the high affinity between adsorbate and adsorbent. This kind of isotherm is typical of the adsorption of large molecules, such as enzyme or dyes. Besides, ions which are easily exchanged with each other on the adsorbent surface can promote a second stage of adsorption. In the case of the HCPL material, the isotherm is L-2 type. These isotherms have a convex shape at low concentration with one plateau, which indicates the saturation of the material [52]. The main difference of these two kinds of materials could be associated with the fact that MCO1 has on its surface many oxygenated groups, mainly phenolic, which seems to be the key to its high affinity to adsorb Ga3+. In the case of the zeolite, this multilayer disposition does not seem to be possible, due to the large charge of the gallium or its large size, preventing the reorientation of the gallium ions. According to the Giles classification, the models that could describe these isotherms are [52]. These models are shown in Table 7.
Table 7. Isotherm Models.
Isotherm ModelEquationReference
Langmuir
q e = q s a t · b L · C e 1 + b L · C e
[53]
Freundlich
q e = K F · C e 1 n F
[54]
Sips
q e = q s a t · b S · C e 1 / n S 1 + b S · C e 1 / n S
[55]
Double-Langmuir
q e = q s a t 1 · K 1 · C e 1 + K 1 · C e + q s a t 2 · K 2 · C e 1 + K 2 · C e
K 2 = A · C e B
[36]
Ce (mg/L) is the concentrations of Ga3+ in the equilibrium; bL (L/mg) is a constant that describes the affinity between adsorbent and adsorbate; qe (mg/g) and qsat (mg/g) are the equilibrium adsorption capacity and the maximum adsorption capacity on the monolayer, respectively; KF (L mg−1) and nF are constant parameters of the Freundlich model. The value 1/nF is an empirical constant assigned depending on the strength of the adsorption process and the surface heterogeneity; bS (L mg−1) and nS are empirical constants; qsat1 and qsat2 (mg/g) represent the maximum capacity of adsorption for the first and the second layers, respectively; K1 (L/mg) and K2 (L/mg) indicate the affinity between adsorbate and adsorbent in the first layer and in the second layer, respectively; A and B are constants.
The experimental data were fitted with the corresponding model equation, bearing in mind their type. For the MCO1 material (isotherm H-4 type), the models used were Double Langmuir and Freundlich; while for HCPL, the models used were Langmuir, Freundlich and Sips. The fitting parameters are shown in Table 8.
Due to the difference between the isotherms, the fitting parameters cannot be compared. Therefore, the results will be analyzed separately. Firstly, the MCO1 isotherm was adjusted to Double Langmuir and Freundlich models. The R2 correlation coefficient, as well as RMSE values of the adsorption isotherms, determine that the adsorption data of Ga3+ onto carbon fits properly. However, the Double Langmuir model could be considered the best fitting because it considers that the adsorbate locates on the surface following a multilayer disposition. This multilayer could be explained by two different causes: the adsorbent could regroup on its surface to adsorb more metal ions, or its high affinity with gallium ions is so strong that these ions form another layer over the previously formed on the adsorbent surface. Regarding HCPL results, the isotherm was adjusted to Langmuir, Freundlich and Sips models. The R2 correlation coefficient and RMSE values show that the best fitting is reached by the Sips model. The calculated value of qs is close to the experimental one, so this is also indicative that the Sips model can describe the adsorption of Ga+3 onto clinoptilolite. Regarding the parameter ns, its inverse (1/ns) can give an idea about the distribution of binding sites. When 1/ns is close to zero, it indicates a heterogeneous sorbent, while values closer to 1 indicate a relatively homogeneous distribution. If the value is 1, Sips isotherm coincides with Langmuir equation. The 1/ns value obtained for the gallium sorption is 0.62, so the clinoptilolite has a homogenous distribution of the binding sites.
Finally, if the saturation capacity of both materials is compared, it can be observed that carbonaceous materials can adsorb more Ga3+. This is due to their capacity of redistributing the Ga3+ ion on its surface, because up to the inflection point the adsorption capacity is almost the same for the materials studied.
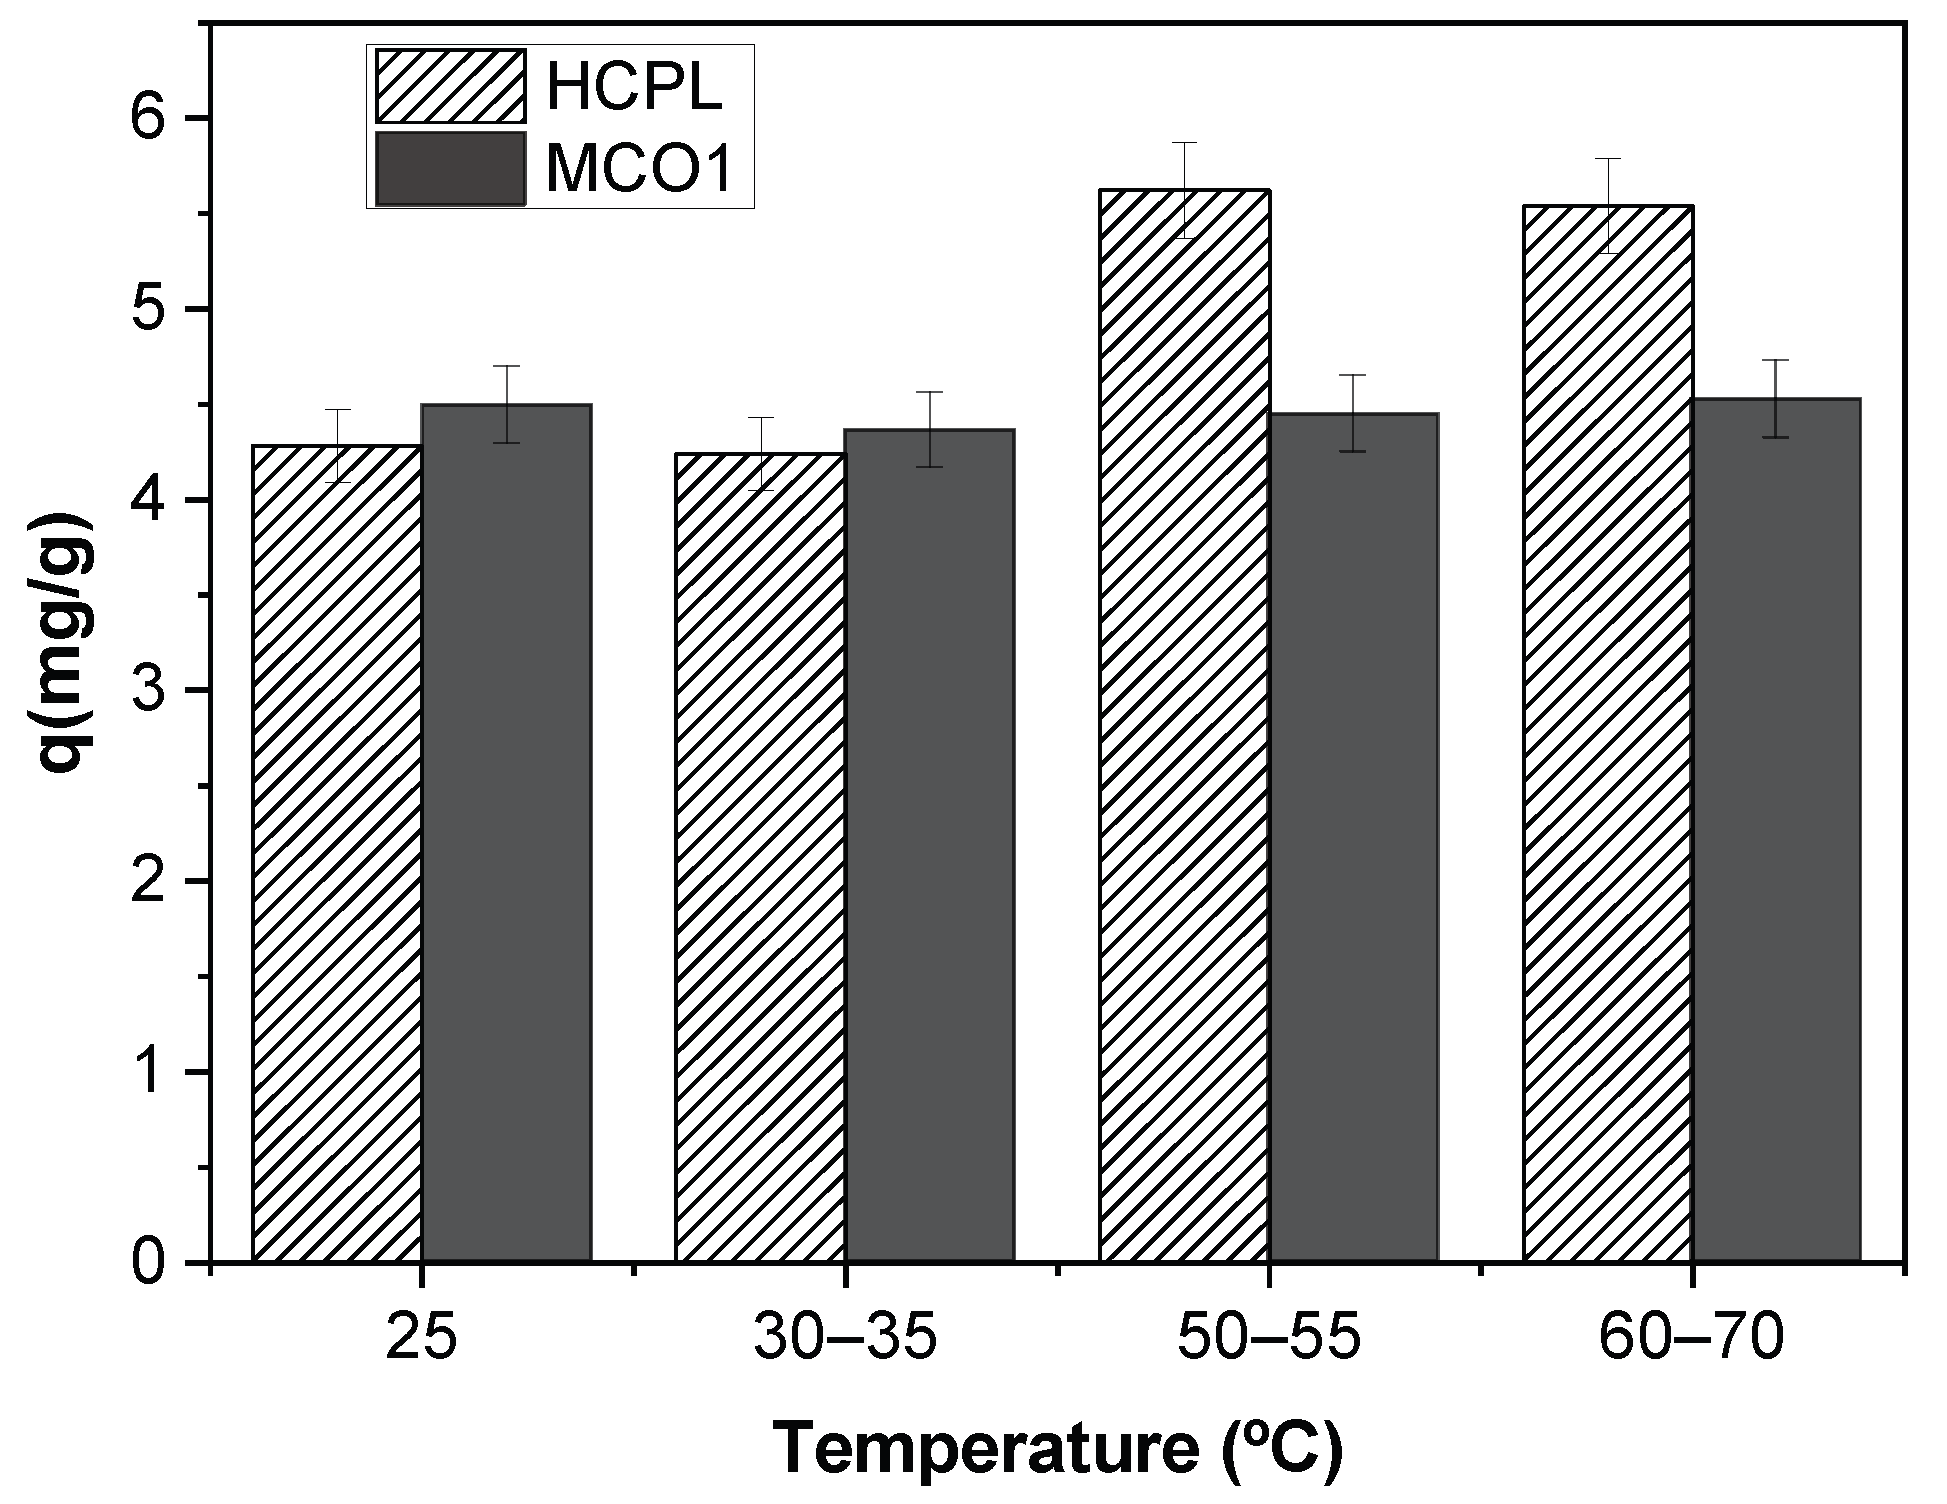
Temperature Influence
The influence of temperature on gallium adsorption was studied by varying the temperature from 25 to 70 °C. The results of this study are shown in Figure 10:
As the previous figure displays, the effect of the temperature is very different depending on the material employed. In the case of the MCO1 material, the effect is insignificant—the adsorption capacity varies 8% in 45 °C, while in the case of the HCPL material, the effect of the temperature in the adsorption is very important. As observed in Figure 10, at a low temperature, the carbonaceous material works better, removing a larger quantity of gallium ions at the same conditions. However, if the temperature is higher, the material that removes more metal ions is HCPL. With the objective of understanding the effect of increasing the temperature of the adsorption of Ga3+ on the different materials studied, three thermodynamic parameters were studied: the Gibbs free energy (∆G0), the enthalpy change (∆H0) and the entropy change (∆S0). The equations used to calculate these parameters are the following:
K C = C 0 C e C e
G 0 = R · T · ln K C
G 0 = H 0 T · S 0
ln K C = H 0 R · 1 T S 0 R
where Kc is the equilibrium constant; C0 (mg/L) is initial concentration of Ga3+; Ce (mg/L) is the concentration at equilibrium; R is the universal gas constant (8.134 J/K · mol) and T(K) is the temperature [20].
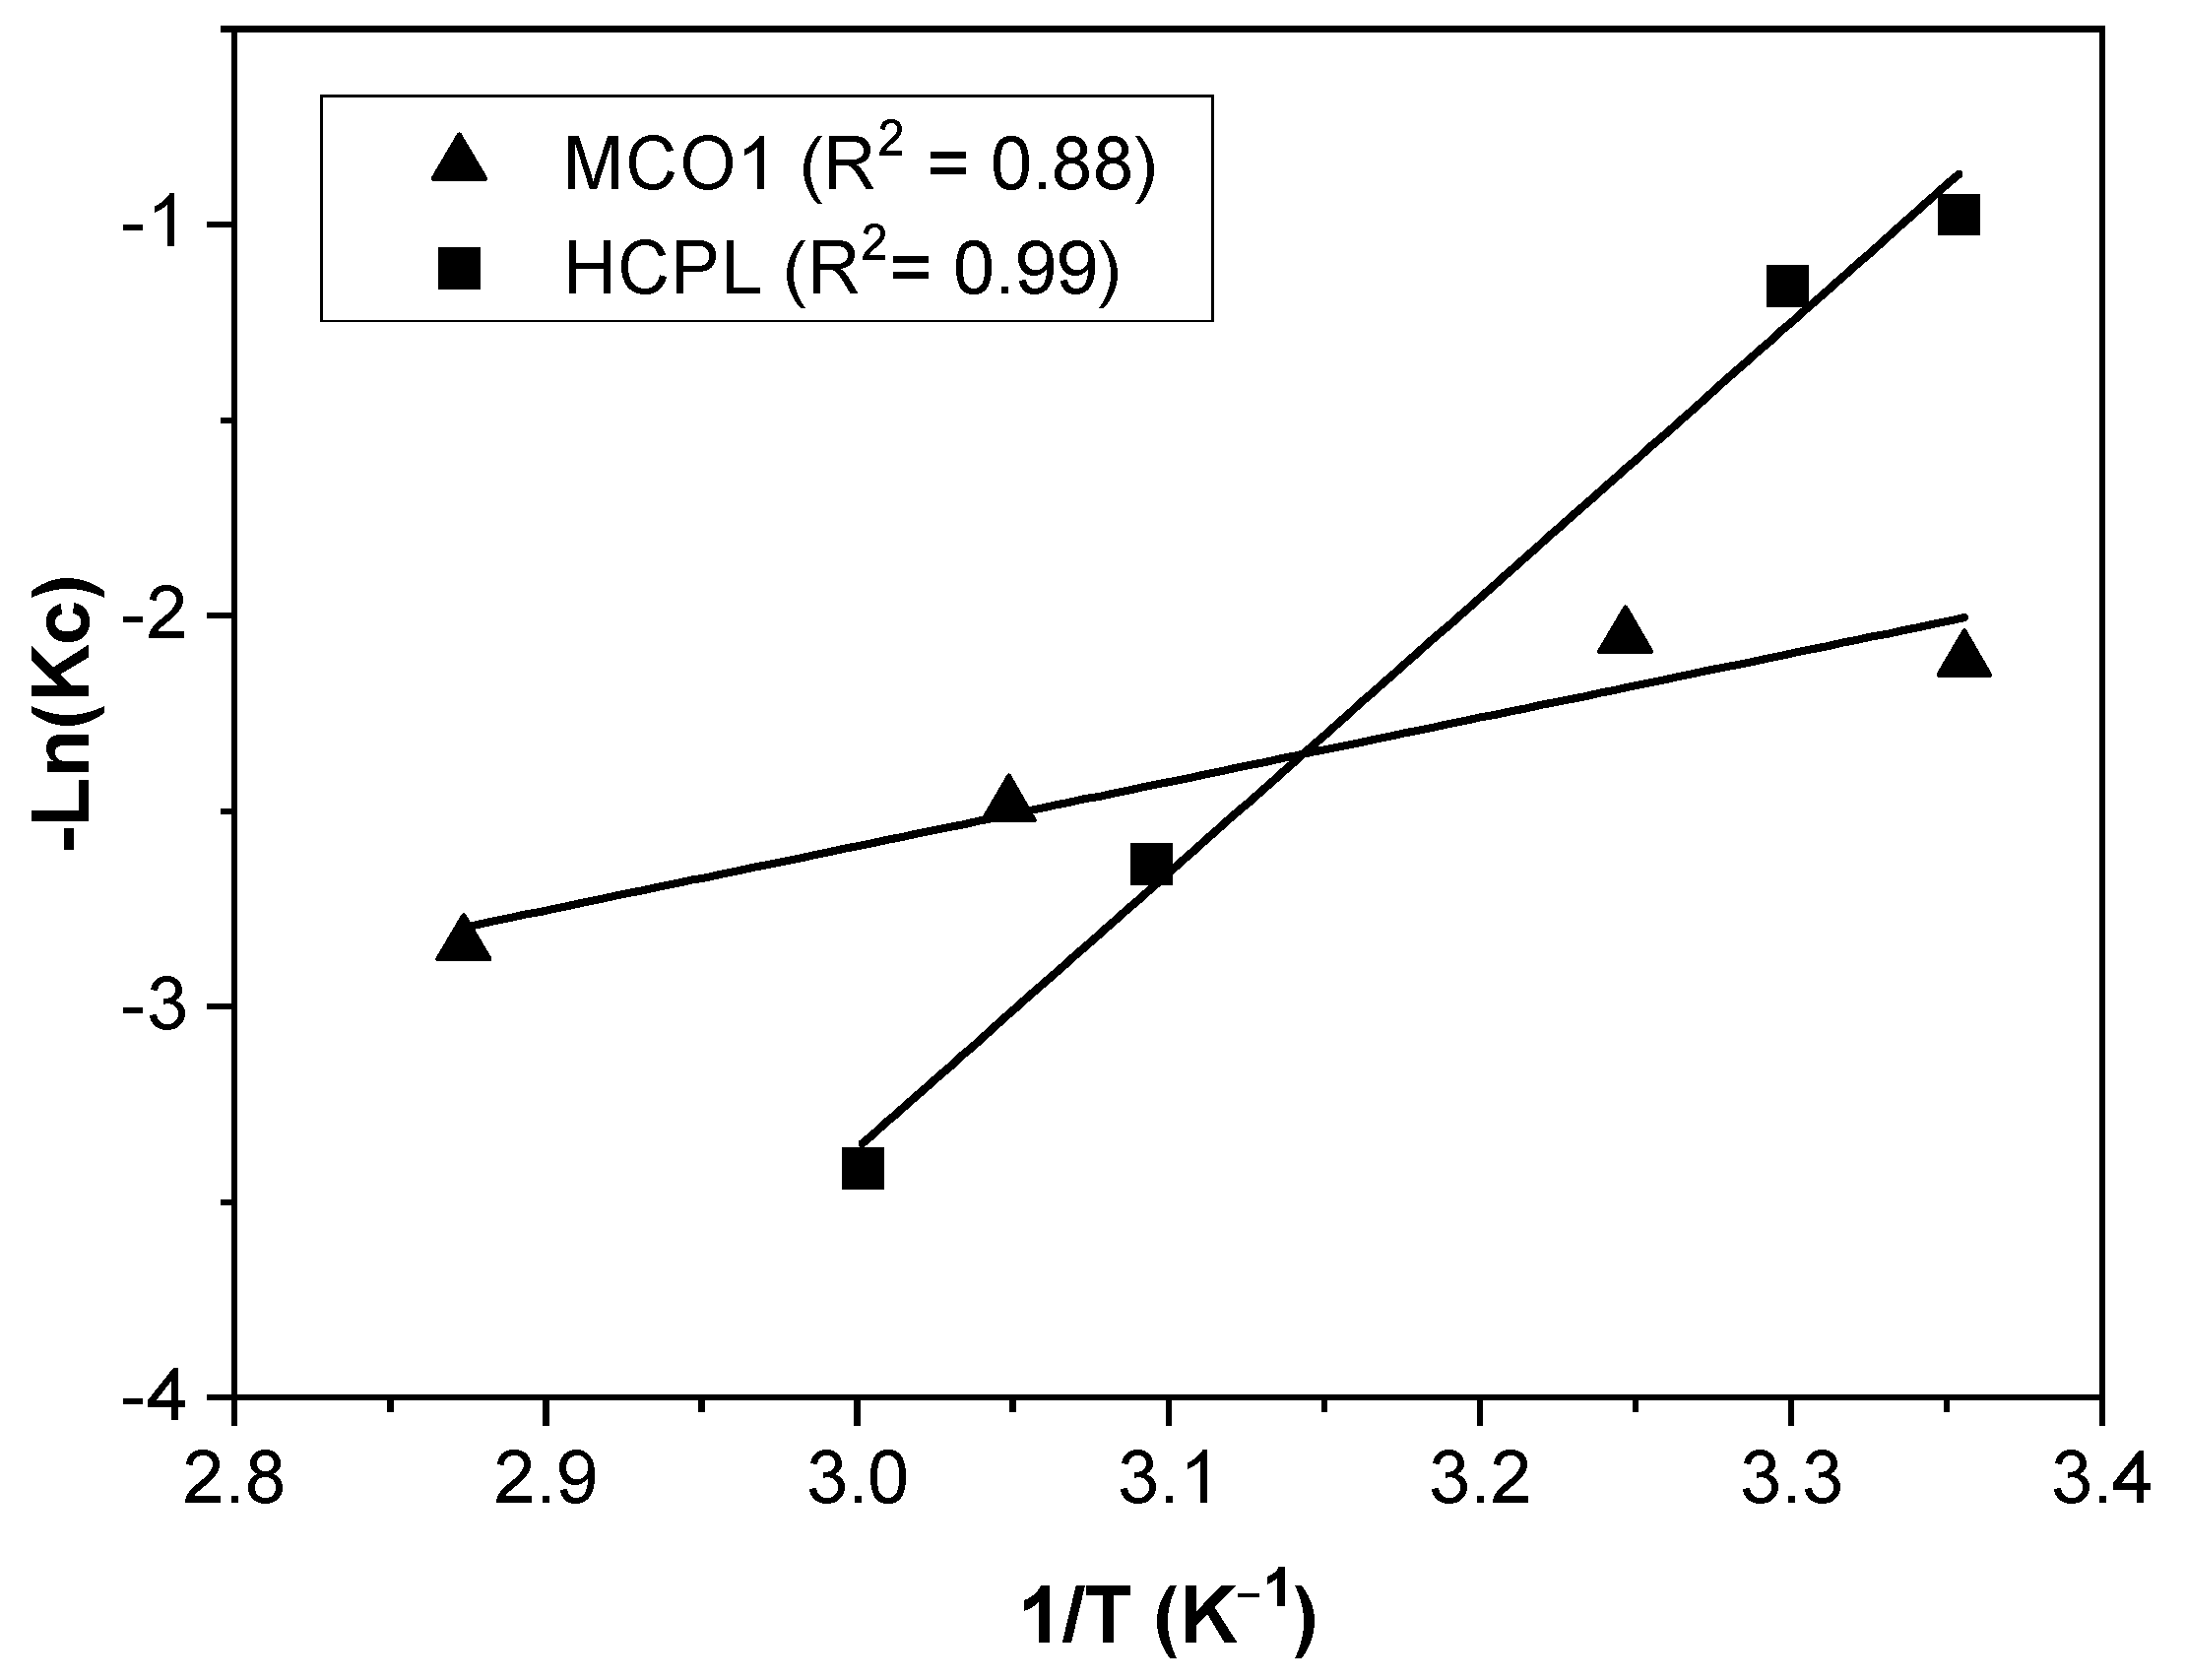
Figure 11 displays the adjustment to Equation (18), to obtain the thermodynamic parameters. With the equation obtained from the linear fitting, the thermodynamic parameters are calculated. These parameters are shown in Table 9.
As seen in Table 9, ∆H0 values are found to be positive for two materials due to the endothermic nature of the adsorption. The magnitude of ∆H0 may also give an idea about the sort of adsorption. The heat evolved during physical adsorption is of the same order to magnitude as the heats of condensation (2.1–20.9 kJ/mol), while the chemisorption heat generally falls into a range of 80–200 kJ/mol [56]. Therefore, observing Table 8, gallium adsorption on MCO1 can be attributed to a pure physical adsorption process, while gallium removal by clinoptilolite can be attributed to a physico-chemical adsorption process, rather than a pure physical or chemical adsorption process, or an ion-exchange process. A positive value of ∆S0 can be associated with structural changes in the interface between adsorbent and adsorbate.
Finally, regarding ∆G0, negative values indicate the spontaneous nature of the reaction. The adsorption is favoured, and it gets easier at higher temperatures. In the case of zeolites, this phenomenon becomes clearer.
Comparative between the materials assayed
Up to this point, the behaviour of both materials has been studied, evaluating their kind of adsorption, their mechanism, and their adsorption capacity. The results obtained throughout the study have been collected to decide what material would be better to use in a fixed bed, and to pre-concentrate a continuous gallium inlet stream. They are shown in Table 10:
As can be observed, the carbon MCO1 has better gallium adsorption capacity than the zeolite and the type of sorption is physical, so either the regeneration of the material or pre-concentration of gallium will be easier than using zeolite as adsorbent. Nevertheless, zeolite is the best option to be used in a fixed bed because it is cheaper, and its particle size is more suitable than the carbonaceous material. Additionally, zeolite is commercially available in a wide variety of sizes, which will allow designing a bed, which could be more easily scalable to the industrial size. In the case of carbon, to employ it in a fixed bed, it would be necessary to agglomerate it. A possible solution could be to create a hybrid material composed of HCPL and MCO1. In this way, it could combine the best properties of both materials.

4. Conclusions

In this study, the behavior of two different adsorbents have been tested as adsorbents to remove gallium from synthetic gallium aqueous solutions. The main conclusions obtained from this work can be summarized in the following points:
-
Concerning their structure, the carbonaceous materials have a larger specific surface area than the zeolitic materials. Their pores are well-defined and are wide enough to guarantee the entrance of gallium ions. In the case of zeolites, their pores are not as well defined, but their strength lie in their ion-exchange capacity.
-
MCO1 material is the best gallium adsorbent between both carbonaceous materials studied, due to its chemistry properties. Meanwhile, for zeolites, the best results were reached for the zeolite treated with acid (HCPL), since the adsorption of gallium could be carried out at a free pH, avoiding the competition between protons and metal ions.
-
All the materials studied have shown that the adsorption of Ga3+ follows the Pseudo-second-order kinetic model. The gallium diffusion process inside the materials is different compared to the gallium adsorption on carbonaceous materials. In all carbonaceous materials assayed, the limiting step is the adsorption process, but in the case of the zeolite it also has some diffusional limitation, depending on the region of time.
-
The adsorption equilibrium is better described by Double Langmuir for the MCO1 and Sips for HCPL. The saturation capacity reached is 6.5 and 4.9 mg/g for MCO1 and HCPL, respectively.
-
The thermodynamic parameters indicate the endothermic and spontaneous behavior of the gallium adsorption process at 25–70 °C for both materials.
-
The type of adsorption observed for MCO1 material is physisorption, while for HCPL it is physico-chemical adsorption or ion-exchange.
-
MCO1 material has shown better results for gallium removal than zeolite. Its mechanism, properties and type of sorption make it suitable for the pre-concentration of gallium, and consequently it facilitates its recovery. However, the material has disadvantages such as its price and particle size. Therefore, for these reasons, the strengths of each material could be employed to synthesize a hybrid material, combining the advantages of the individual solids.

Author Contributions

P.S.: data curation, writing—original draft, investigation. I.B.: data curation, writing—original draft. E.D.: formal analysis, data curation, writing—review & editing. J.M.G.: formal analysis, writing—review & editing. C.F.: investigation. N.G.: investigation. A.R.: formal analysis, writing—review & editing, resources, funding acquisition. All authors have read and agreed to the published version of the manuscript.

Funding

This investigation has been financed by the Ministry of Economy and Competitiveness CTQ2014-59011-R and CTM2014-53485-REDC (REMEWATER). PSG was supported by a FPU contract-fellowship (Formación de Profesorado Universitario) from Ministerio de Educación Cultura y Deporte (FPU 14/00500).

Data Availability Statement

They will be available on request.

Acknowledgments

The authors are grateful to the UCM research support centers (CAIs) for the XRD and XRF analyses. Special acknowledgement to ZeoCat Soluciones Ecológicas S.L.U. for supplying the clinoptilolite used in this research.

Conflicts of Interest

The authors declare no conflict of interest.

References

  1. Lahiri, S.; Meyappan, R.M.; Varadharaj, A. Gallium Recovery-Technological Alternatives. Bull. Electrochem. 1996, 12, 342–345. [Google Scholar]
  2. Zhou, H.; Zhang, J.; Zhang, C.; Feng, Q.; Zhao, S.; Ma, P.; Hao, Y. A review of the most recent progresses of state-of-art gallium oxide power devices. J. Semicond. 2019, 40, 11803. [Google Scholar] [CrossRef]
  3. Liu, Z.; Li, P.G.; Zhi, Y.S.; Wang, X.L.; Chu, X.L.; Tang, W.H. Review of gallium oxide based field-effect transistors and Schottky barrier diodes. Chin. Phys. B 2019, 28, 17105. [Google Scholar] [CrossRef]
  4. Ramanujam, J.; Singh, U.P. Copper indium gallium selenide based solar cells—A review. Energy Environ. Sci. 2017, 10, 1306–1319. [Google Scholar] [CrossRef]
  5. Suryavanshi, U.S.; Shukla, S.R. Adsorption of Ga(III) on oxidized coir. Ind. Eng. Chem. Res. 2009, 48, 870–876. [Google Scholar] [CrossRef]
  6. Ujaczki, É.; Courtney, R.; Cusack, P.; Krishna Chinnam, R.; Clifford, S.; Curtin, T.; O’Donoghue, L. Recovery of Gallium from Bauxite Residue Using Combined Oxalic Acid Leaching with Adsorption onto Zeolite HY. J. Sustain. Metall. 2019, 5, 262–274. [Google Scholar] [CrossRef] [Green Version]
  7. Lu, F.; Xiao, T.; Lin, J.; Ning, Z.; Long, Q.; Xiao, L.; Huang, F.; Wang, W.; Xiao, Q.; Lan, X.; et al. Resources and extraction of gallium: A review. Hydrometallurgy 2017, 174, 105–115. [Google Scholar] [CrossRef]
  8. Jaskula, B.W. Gallium. In Mineral Commodity Summaries 2020; United States Geological Survey: Reston, VA, USA, 2020; pp. 63–64. ISBN 9781411343627. [Google Scholar]
  9. Zhao, Z.; Yang, Y.; Xiao, Y.; Fan, Y. Recovery of gallium from Bayer liquor: A review. Hydrometallurgy 2012, 125–126, 115–124. [Google Scholar] [CrossRef]
  10. Jadhav, U.U.; Hocheng, H. A review of recovery of metals from industrial waste. J. Achiev. Mater. Manuf. Eng. 2012, 54, 159–167. [Google Scholar]
  11. Chegrouche, S.; Bensmaili, A. Removal of Ga(III) from aqueous solution by adsorption on activated bentonite using a factorial design. Water Res. 2002, 36, 2898–2904. [Google Scholar] [CrossRef]
  12. Auerbach, S.M.; Carrado, K.A.; Dutta, P.K. Handbook of Zeolite Science and Technology; CRC Press: New York, NY, USA, 2003; ISBN 0824740203. [Google Scholar]
  13. Zanin, E.; Scapinello, J.; de Oliveira, M.; Rambo, C.L.; Franscescon, F.; Freitas, L.; de Mello, J.M.M.; Fiori, M.A.; Oliveira, J.V.; Dal Magro, J. Adsorption of heavy metals from wastewater graphic industry using clinoptilolite zeolite as adsorbent. Process Saf. Environ. Prot. 2017, 105, 194–200. [Google Scholar] [CrossRef]
  14. Liang, Z.; Shi, W.; Zhao, Z.; Sun, T.; Cui, F. The retained templates as “helpers” for the spherical meso-silica in adsorption of heavy metals and impacts of solution chemistry. J. Colloid Interface Sci. 2017, 496, 382–390. [Google Scholar] [CrossRef]
  15. Liu, X.; Tian, R.; Ding, W.; He, Y.; Li, H. Adsorption selectivity of heavy metals by Na-clinoptilolite in aqueous solutions. Adsorption 2019, 25, 747–755. [Google Scholar] [CrossRef]
  16. Baninaam, M.; Ali-Hosseini, S.; Abbasian, A.R. Isothermal study of asphaltene adsorption over 4A, 13X, ZSM-5, clinoptilolite zeolites, and phoslock. Appl. Petrochem. Res. 2020, 10, 49–54. [Google Scholar] [CrossRef]
  17. Saadi, Z.; Fazaeli, R.; Vafajoo, L.; Naser, I.; Mohammadi, G. Promotion of clinoptilolite adsorption for azithromycin antibiotic by Tween 80 and Triton X-100 surface modifiers under batch and fixed-bed processes. Chem. Eng. Commun. 2020, 208, 328–348. [Google Scholar] [CrossRef]
  18. Kuroki, A.; Hiroto, M.; Urushihara, Y.; Horikawa, T.; Sotowa, K.I.; Alcántara Avila, J.R. Adsorption mechanism of metal ions on activated carbon. Adsorption 2019, 25, 1251–1258. [Google Scholar] [CrossRef]
  19. Barczak, M.; Michalak-Zwierz, K.; Gdula, K.; Tyszczuk-Rotko, K.; Dobrowolski, R.; Dąbrowski, A. Ordered mesoporous carbons as effective sorbents for removal of heavy metal ions. Microporous Mesoporous Mater. 2015, 211, 162–173. [Google Scholar] [CrossRef]
  20. Kyzas, G.Z.; Deliyanni, E.A.; Matis, K.A. Activated carbons produced by pyrolysis of waste potato peels: Cobalt ions removal by adsorption. Colloids Surf. A Physicochem. Eng. Asp. 2016, 490, 74–83. [Google Scholar] [CrossRef]
  21. Odisu, T.; Edomwonyi-Otu, L.C.; Anih, E.C. Comparative studies of adsorption of heavy metals from cement waste water using activated carbon from Palm Kernel Husk, coconut and groundnut shells. J. Appl. Sci. Environ. Manag. 2019, 23, 967. [Google Scholar] [CrossRef]
  22. Yunus, Z.M.; Othman, N.; Al-Gheethi, A.; Hamdan, R.; Ruslan, N.N. Adsorption of heavy metals from mining effluents using honeydew peels activated carbon; isotherm, kinetic and column studies. J. Dispers. Sci. Technol. 2020, 42, 715–729. [Google Scholar] [CrossRef]
  23. Nejadshafiee, V.; Islami, M.R. Intelligent-activated carbon prepared from pistachio shells precursor for effective adsorption of heavy metals from industrial waste of copper mine. Environ. Sci. Pollut. Res. 2020, 27, 1625–1639. [Google Scholar] [CrossRef] [PubMed]
  24. Roosen, J.; Mullens, S.; Binnemans, K. Chemical immobilization of 8-hydroxyquinoline and 8-hydroxyquinaldine on chitosan-silica adsorbent materials for the selective recovery of gallium from Bayer liquor. Hydrometallurgy 2017, 171, 275–284. [Google Scholar] [CrossRef]
  25. Hassanien, M.M.; Mortada, W.I.; Kenawy, I.M.; El-Daly, H. Solid Phase Extraction and Preconcentration of Trace Gallium, Indium, and Thallium Using New Modified Amino Silica. Appl. Spectrosc. 2017, 71, 288–299. [Google Scholar] [CrossRef]
  26. Zhao, F.; Zou, Y.; Lv, X.; Liang, H.; Jia, Q.; Ning, W. Synthesis of CoFe2O4 − Zeolite Materials and Application to the Adsorption of Gallium and Indium. J. Chem. Eng. Data 2015, 60, 1338–1344. [Google Scholar] [CrossRef]
  27. Zhang, Y.; Zhu, L.; Wang, Y.; Lou, Z.; Shan, W.; Xiong, Y.; Fan, Y. Preparation of a biomass adsorbent for gallium(III) based on corn stalk modified by iminodiacetic acid. J. Taiwan Inst. Chem. Eng. 2018, 91, 291–298. [Google Scholar] [CrossRef]
  28. Gao, L.; Wang, L.; Cao, Y.; Li, S. Persimmon peel-based ion-imprinted adsorbent with enhanced adsorption performance of gallium ions. Miner. Eng. 2022, 176, 107354. [Google Scholar] [CrossRef]
  29. Chai, N.; Gao, L.; Li, S.; Cao, Y.; Ma, Z.; Li, L.; Hu, M. In-suit ion-imprinted bio-sorbent with superior adsorption performance for gallium (III) capture. J. Clean. Prod. 2023, 387, 135861. [Google Scholar] [CrossRef]
  30. Cui, J.; Cong, X.; Li, X.; Chen, X.; Wang, Y.; Gao, J.; Xiong, Y. Chitosan derived layered porous carbon and its performance on gallium adsorption. J. Chem. Technol. Biotechnol. 2023, 98, 1387–1394. [Google Scholar] [CrossRef]
  31. Wang, Y.; Zhu, L.; Song, Y.; Lou, Z.; Shan, W.; Xiong, Y. Novel chitosan-based ions imprinted bio-adsorbent for enhanced adsorption of gallium(III) in acidic solution. J. Mol. Liq. 2020, 320, 114413. [Google Scholar] [CrossRef]
  32. Meng, J.; He, C.; Li, Y.; Zhou, J.; Li, J.; Zheng, C.; Zhao, J.; Fujita, T.; Ning, S.; Wei, Y. Enhanced adsorption and separation of gallium using silica-based P507-TBP/SiO2–P adsorbent from sulfuric acid solution. Micropor. Mesopor. Mat. 2021, 341, 110859. [Google Scholar] [CrossRef]
  33. Galán, J.; Rodríguez, A.; Gómez, J.M.; Allen, S.J.; Walker, G.M. Reactive dye adsorption onto a novel mesoporous carbon. Chem. Eng. J. 2013, 219, 62–68. [Google Scholar] [CrossRef]
  34. Thommes, M.; Kaneko, K.; Neimark, A.V.; Olivier, J.P.; Rodriguez-Reinoso, F.; Rouquerol, J.; Sing, K.S.W. Physisorption of gases, with special reference to the evaluation of surface area and pore size distribution (IUPAC Technical Report). Pure Appl. Chem. 2015, 87, 1051–1069. [Google Scholar] [CrossRef] [Green Version]
  35. Sing, K.S.W.; Williams, R.T. Review Physisorption Hysteresis Loops and the Characterization of Nanoporous Materials. Adsorpt. Sci. Technol. 2004, 22, 773–782. [Google Scholar] [CrossRef]
  36. Gómez, J.M.; Romero, M.D.; Fernández, T.M.; Díez, E. Immobilization of β-glucosidase in fixed bed reactor and evaluation of the enzymatic activity. Bioprocess Biosyst. Eng. 2012, 35, 1399–1405. [Google Scholar] [CrossRef] [PubMed]
  37. Wu, Z.; Webley, P.A.; Zhao, D. Comprehensive study of pore evolution, mesostructural stability, and simultaneous surface functionalization of ordered mesoporous carbon (FDU-15) by wet oxidation as a promising adsorbent. Langmuir 2010, 26, 10277–10286. [Google Scholar] [CrossRef]
  38. Ersoy, B.; Çelik, M.S. Electrokinetic properties of clinoptilolite with mono- and multivalent electrolytes. Microporous Mesoporous Mater. 2002, 55, 305–312. [Google Scholar] [CrossRef]
  39. Pretsch, C.; Seibl, S. Structure Determination of Organic Compounds; Springer: Berlin/Heidelberg, Germany, 2009; ISBN 978-3-540-93809-5. [Google Scholar]
  40. Pakuła, M.; Walczyk, M.; Biniak, S.; Światkowski, A. Electrochemical and FTIR studies of the mutual influence of lead(II) or iron(III) and phenol on their adsorption from aqueous acid solution by modified activated carbons. Chemosphere 2007, 69, 209–219. [Google Scholar] [CrossRef]
  41. Chen, C.; Gao, J.; Yan, Y. Observation of the type of hydrogen bonds in coal by FTIR. Energy Fuels 1998, 12, 446–449. [Google Scholar] [CrossRef]
  42. Fanning, P.E.; Vannice, M.A. A DRIFTS study of the formation of surface groups on carbon by oxidation. Carbon 1993, 31, 721–730. [Google Scholar] [CrossRef]
  43. Treacy, M.; Higgins, J. Powder pattern simulations of disordered intergrowths. In Collection of Simulated XRD Powder Patterns for Zeolites; Elsevier: Amsterdam, The Netherlands, 2007. [Google Scholar]
  44. Bahri, Z.; Rezai, B.; Kowsari, E. Selective separation of gallium from zinc using flotation: Effect of solution pH value and the separation mechanism. Miner. Eng. 2016, 86, 104–113. [Google Scholar] [CrossRef]
  45. Mihaly-Cozmuta, L.; Mihaly-Cozmuta, A.; Peter, A.; Nicula, C.; Tutu, H.; Silipas, D.; Indrea, E. Adsorption of heavy metal cations by Na-clinoptilolite: Equilibrium and selectivity studies. J. Environ. Manag. 2014, 137, 69–80. [Google Scholar] [CrossRef] [PubMed]
  46. Lagergen, S. About the theory of so-called adsorption of soluble substances. K. Sven. Vetensk. Handl. 1898, 24, 1–39. [Google Scholar]
  47. Ho, Y.S.; McKay, G. A Comparison of Chemisorption Kinetic Models Applied to Pollutant Removal on Various Sorbents. Process Saf. Environ. Prot. 1998, 76, 332–340. [Google Scholar] [CrossRef] [Green Version]
  48. Aharoni, C.; Tompkins, F.C. Kinetics of Adsorption and Desorption and the Elovich Equation. Adv. Catal. 1970, 21, 1–49. [Google Scholar] [CrossRef]
  49. Ackley, M.W.; Yang, R.T. Adsorption Characteristics of High-Exchange Clinoptilolites. Ind. Eng. Chem. Res. 1991, 30, 2523–2530. [Google Scholar] [CrossRef]
  50. Weber, W.J.; Morris, J.C. Kinetics of Adsorption on Carbon from Solution. J. Sanit. Eng. Div. ASCE 1963, 89, 31–60. [Google Scholar] [CrossRef]
  51. Giles, C.H.; MacEwan, T.H.; Nakhwa, S.N.; Smith, D. Studies in adsorption. Part XI. A system of classification of solution adsorption isotherms, and its use in diagnosis of adsorption mechanisms and in measurement of specific surface areas of solids. J. Chem. Soc. 1960, 846, 3973–3993. [Google Scholar] [CrossRef]
  52. Hinz, C. Description of sorption data with isotherm equations. Geoderma 2001, 99, 225–243. [Google Scholar] [CrossRef]
  53. Langmuir, I. The constitution and fundamental properties of solids and liquids. II. liquids. J. Am. Chem. Soc. 1917, 39, 1848–1906. [Google Scholar] [CrossRef] [Green Version]
  54. Freundlich, H.M.F. Over the Adsorption. J. Phys. Chem. 1906, 57, 385–471. [Google Scholar]
  55. Sips, R. On the Structure of a Catalyst Surface. II. J. Chem. Phys. 1950, 18, 1024–1026. [Google Scholar] [CrossRef]
  56. Ünlü, N.; Ersoz, M. Adsorption characteristics of heavy metal ions onto a low cost biopolymeric sorbent from aqueous solutions. J. Hazard. Mater. 2006, 136, 272–280. [Google Scholar] [CrossRef] [PubMed]
Figure 1. N2 adsorption-desorption isotherms at −196 °C. (a) Isotherms for mesoporous materials. (b) Isotherms for bare and modified clinoptilolite.
Separations 10 00349 g001
Figure 2. Zeta potential results for the adsorbents and metal ions.
Separations 10 00349 g002
Figure 3. FTIR spectra of adsorbents employed (a) carbons materials (b) zeolite materials.
Separations 10 00349 g003
Figure 4. Thermo-gravimetrical results of MCSG60A and MCO1.
Separations 10 00349 g004
Figure 5. XRD results for bare and modified zeolites.
Separations 10 00349 g005
Figure 6. SEM images of (a) MCSG60A (b) MC01 (c) CPL (d) H-CPL.
Separations 10 00349 g006
Figure 7. Gallium adsorption kinetic on the adsorbent: (a) Mesoporous carbons, (b) Clinoptilolite and acid-treated clinoptilolite. Conditions: 45 mg/L of Gallium, 25 °C, 10g/L of adsorbent, pH < 3.2.
Separations 10 00349 g007
Figure 8. Weber-Morris model fitting. (a) Carbonaceous materials and (b) Zeolitic materials.
Separations 10 00349 g008
Figure 9. Gallium adsorption isotherms. Conditions: 25 °C, 10 g/L of adsorbent dosage, free pH.
Separations 10 00349 g009
Figure 10. Effect of the temperature for gallium adsorption. Conditions: 50 mg/L of gallium, 10 g/L of adsorbent dosage and free pH.
Separations 10 00349 g010
Figure 11. Experimental data fitting of Equation (17).
Separations 10 00349 g011
Table 1. Isotherm parameters.
SBET (m2/g) Smicro (m2/g) Dpore (Å) VMicro (cm3/g) VSpecific (cm3/g)
MCSG60A911158600.071.12
MCO1365742700.080.89
CPL250-1.3 × 10−30.13
HCPL3911-6.3 × 10−30.15
Table 2. Composition (mol %) of the natural and treated clinoptilolite samples.
Chemical Composition (mol %)
Ion in ClinoptiloliteCPLHCPL
O42.0620.30
Si41.6159.44
Al6.869.16
K3.653.08
Ca2.594.01
Fe1.171.85
Na0.58-
Mg0.490.58
Si/Al6.066.49
Cat/Al1.371.21
Table 3. Gallium removal efficiency for different materials and conditions.
MaterialConditions% Ga RemovalReference
MCSG60A45 mg/L of Ga (III); 25 °C; 10 g/L of adsorbent dosage90Current work
MCO145 mg/L of Ga (III); 25 °C; 10 g/L of adsorbent dosage92Current work
CPL45 mg/L of Ga (III); 25 °C; 10 g/L of adsorbent dosage59Current work
HCPL45 mg/L of Ga (III); 25 °C; 10 g/L of adsorbent dosage73Current work
Oxidized coir50 mg/L of Ga (III); 32 °C; 2.5 g/L of adsorbent dosage71[5]
Activated bentonite400 mg/L of Ga (III); 20 °C; 25 g/L of adsorbent dosage99[11]
Persimmon-based IIP40 mg/L of Ga (III); 20 °C; 1 g/L of adsorbent dosage80[28]
Chitosan-derived layered porous carbon20 mg/L of Ga (III); 30 °C; 1 g/L of adsorbent dosage90[30]
Table 5. Fitting parameters of kinetic models.
MCSG60AMCO1CPLHCPL
Experimentalqe (mg/g)4.404.582.603.29
Pseudo-first-order kinetic modelqe (mg/g)0.290.791.041.34
k1 (min−1)0.080.121.13 × 10−31.11 × 10⁻³
R20.090.610.710.77
RMSE1.691.120.990.78
Pseudo-second-order kinetic modelqe (mg/g)4.394.592.623.31
k2 (g/mg·min)1.841.047.74 × 10−35.76 × 10⁻³
R20.990.990.990.99
RMSE (min·g/mg)0.040.0210.737.48
h (mg/g·min)35.4721.900.050.06
t1/2 (min)0.120.2149.3352.42
Elovich kinetic modelβ (mg/g·min)43.088.892.762.47
V0 (g/mg)1.697.270.320.47
R20.730.870.920.97
RMSE (mg/g)0.020.060.220.15
Table 6. Fitting parameters of Weber-Morris model.
MCSG60AMCO1CPLHCPL
Weber-Morris modelKI (mg/g·min0.5)0.0140.0600.110.11
KII (mg/g·min0.5)--2.5 × 10−32 × 10−3
CI (mg/g)4.294.190.330.80
CII (mg/g)--2.493.152
R20.650.620.920.91
RMSE (mg/g)0.020.120.180.20
Table 8. Fitting isotherm parameters.
MCO1HCPL
Experimentalqsat,I (mg/g)4.54.9
qsat,II (mg/g)6.5
Double Langmuirqsat,I (mg/g)4.59
qsat,II (mg/g)2.02
K1 (L/mg)2.47
A4.6 × 10−13
B7.42
R20.96
RMSE (mg/g)0.45
FreundlichKF (L/mg)2.762.46
nF4.866.12
R20.950.89
RMSE (mg/g)0.350.41
Langmuirqsat5 (mg/g) 4.96
bL (L/mg) 0.62
R2 0.96
RMSE (mg/g) 0.26
Sipsqsat (mg/g) 5.47
bS (L/mg) 0.49
nS 1.62
R2 0.99
RMSE (mg/g) 0.11
Table 9. Thermodynamic analysis of the gallium adsorption on MCO1.
Temperature (°C) MCO1HCPL
25∆G0 (kJ/mol)−5.1−2.4
30–35−5.1−2.9
50–55−6.6−7.0
60–70−8.0−9.4
∆H0 (kJ/mol)13.658.4
∆S0 (J/mol·K)61.9203.5
Table 10. Characteristics and properties obtained for both materials.
MCO1HCPL
PriceExpensiveCheap
Dosage (g/L)1010
Particle size (mm)Powder0.8 mm
Time to reach the equilibrium15 minAround 1 day
qsat (mg/g)6.54.9
Rate-controlling stepAdsorption processAdsorption process is the rate-controlling step but with diffusional limitations
ThermodynamicEndothermicEndothermic
Type of sorptionPhysical adsorptionPhysico-chemical adsorption
Disclaimer/Publisher’s Note: The statements, opinions and data contained in all publications are solely those of the individual author(s) and contributor(s) and not of MDPI and/or the editor(s). MDPI and/or the editor(s) disclaim responsibility for any injury to people or property resulting from any ideas, methods, instructions or products referred to in the content.

