Article

Development of a Fast and Sensitive UPLC–MS/MS Analytical Methodology for Fenebrutinib Estimation in Human Liver Microsomes: In Vitro and In Silico Metabolic Stability Evaluation

Department of Pharmaceutical Chemistry, College of Pharmacy, King Saud University, Riyadh 11451, Saudi Arabia
*
Author to whom correspondence should be addressed.
Separations 2023, 10(5), 302; https://doi.org/10.3390/separations10050302
Submission received: 12 April 2023 / Revised: 2 May 2023 / Accepted: 6 May 2023 / Published: 9 May 2023

Abstract

:
Fenebrutinib (GDC-0853; FNB) is an oral small molecule that was developed by Roche Pharmaceuticals to slow multiple sclerosis progression. FNB is a reversible bruton tyrosine kinase (BTK) inhibitor, which showed the maximum potency of BTK inhibitors in phase III clinical trials for multiple sclerosis. In the current study, a fast, specific, and sensitive UPLC-MS/MS method for FNB quantification in human liver microsomes (HLMs) was established with application to the evaluation of metabolic stability. The UPLC-MS/MS methodology was verified using the stated USFDA validation guidelines for bioanalytical methodologies that involve selectivity, linearity, accuracy and precision, carryover and extraction recovery, stability, and matrix effect. The FNB calibration curve displayed a linearity in the range from 1 ng/mL to 3000 ng/mL (y = 1.731x + 2.013; R2: 0.9954; RSD < 4.37%) in the HLMs matrix. The limit of quantification was 0.88 ng/mL, which verified the UPLC-MS/MS analytical method sensitivity. The intraday and interday precision and accuracy results of the developed UPLC-MS/MS method were −3.99–14.0% and 0.52–3.83%, respectively. FNB and savolitinib (SVB) (internal standard) were chromatographically separated utilizing an isocratic mobile phase system with a ZORBAX Eclipse plus-C18 (50 mm, 2.1 mm, and 1.8 μm) column. The metabolic stability parameters for FNB, involving high intrinsic clearance (58.21 mL/min/kg) and a short in vitro half-life (13.93 min), revealed the high extraction ratio of FNB. Reviewing the literature revealed that the current UPLC-MS/MS method is the first analytical method for FNB quantification in the HLMs matrix with application to the assessment of FNB metabolic stability.

Graphical Abstract

1. Introduction

Fenebrutinib (GDC-0853; FNB) is an oral small molecule that was developed by Roche Pharmaceuticals to slow multiple sclerosis progression by preventing certain immune cells (B-cells and microglia) from driving the inflammation that damages nerve cells [1]. Bruton tyrosine kinase (BTK) is an enzyme that is critical to the inflammatory activity of two types of immune cells (B-cells and microglia) that meaningfully participate in disease inflammation in both progressive and relapsing forms of multiple sclerosis [1]. FNB shows the maximum potency of BTK inhibitors in systemic lupus erythematosus. FNB is currently under investigation in phase II clinical trials and in phase III clinical trials for different types of multiple sclerosis [2,3]. FNB is known to pass through the blood-brain barrier, which is usually an issue for brain-targeting therapies. Unlike other BTK inhibitors being developed for multiple sclerosis, FNB has the unique character of reversible binding to its target [4], which may make FNB (Figure 1) safer than other drugs in the BTK inhibitor class [1].
Metabolic stability is the drug’s lability to metabolic reactions and is estimated using two parameters [in vitro half-life (t1/2) and intrinsic clearance (Clint)] in HLMs that were computed utilizing the in vitro t1/2 method [5,6], as it is the usually applied approach in in vitro drug metabolism incubations due to its easiness. If the tested drug displays a high rate of metabolism, it is expected to have a fast action and a small in vivo bioavailability value [7,8,9,10]. FNB is mostly metabolized by the liver by CYP3A (main enzyme) [11,12].
Adverse effects of FNB include four adverse effects: nausea, bleeding, vomiting, alanine aminotransferase elevation, and bruising [13]. Consequently, metabolic stability studies (in silico and in vitro) are required for establishing a new series of drugs with an improved profile for metabolic stability [14,15,16]. Upon reviewing the literature, there is no published article for a UPLC-MS/MS analytical methodology for FNB estimation or the application of metabolic stability assessment in the HLMs matrix. So as to evaluate the in vitro FNB metabolic stability, this research targeted establishing a UPLC-MS/MS analytical methodology. Protein precipitation methodology (ACN) was utilized for extracting FNB from the HLMs matrix. All validation parameters, for example, recovery, calibration, precision, and accuracy were tested following FDA guidelines. FNB was evaluated for its metabolic stability in the HLMs utilizing the in silico P450 model that is included in the StarDrop’s software package before the starting of the practical in vitro HLMs metabolic incubation to reveal the importance of the development of the UPLC-MS/MS method and to save work time and the available means [17]. Knowing the metabolic lability of FNB and the predicted reason for its lability allows the synthesis of new drugs with improved metabolic performance. The validated UPLC-MS/MS method was used for quantifying FNB in in vitro HLMs incubates for the estimation of in vitro t1/2 and the Clint of FNB [18].

2. Materials, Instruments and Methods

2.1. Materials and Instruments

Fenebrutinib (synonyms: GDC-0853; purity: 99.83%) and savolitinib (synonyms: AZD-6094; purity: 99.90%) were purchased from MedChem Express Company (Princeton, NJ, USA). Ammonium formate, ACN, formic acid, and HLMs (20 mg/mL) were procured from Sigma Aldrich Company (St. Louis, MO, USA). A water purification (Milli-Q plus) system was aquired from Millipore (Billerica, MA, USA) and was employed for obtaining water at HPLC grade.
The MassLynx software package (4.1, SCN 805) organized the UPLC-MS/MS analytical system, which is composed of an Acquity UPLC chromatographic system (H10UPH) and an Acquity Triple Quadrupole mass analyzer system (QBB1203). The UPLC-MS/MS system was utilized for the quantification of chromatographic peaks of the target analytes after they were extracted from the HLMs metabolic incubates. The analysis of the data was completed automatically using the QuanLynx manager. The tuning of the mass analyzer parameters of FNB and SVB was performed using IntelliStart® software. A vacuum pump from Sogevac® company (Murrysville, PA, USA) was utilized for vacuum generation inside the Acquity Triple Quadrupole MS. A nitrogen gas generator from Peak Scientific Company (Renfrewshire, Scotland, UK) was utilized for supplying nitrogen that was used as a drying gas for mobile phase droplets. Argon gas (99.99%) was utilized for fragmentation of the analytes inside the TQD mass analyzer.

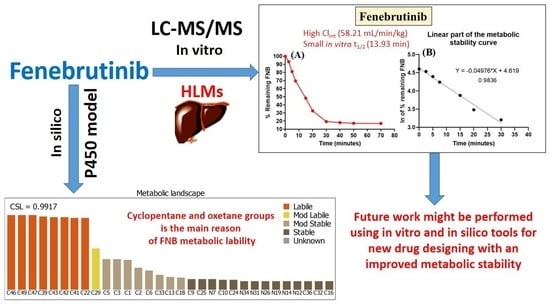
2.2. In Silico Assessment of FNB Metabolic Lability

The prediction of metabolic lability of FNB was performed utilizing the P450 metabolic model of the in silico StarDrop’s software package (Cambridge, MA, USA). The software also provides predictions about the metabolism lability of the chief seven isoforms of Cytochrome P450 (CYP2D5, CYP1A2, CYP3A4, CYP2C19, CYP2C9, CYP2E1, and CYP2C8). The results are displayed as composite site lability (CSL), revealing FNB metabolic lability. CSL is considered a significant feature in predicting the FNB metabolic lability before initiating the in vitro metabolic incubations to verify the value of the development of UPLC-MS/MS so as to save resources and time. The software is characterized by very simple operating steps. The FNB SMILES format was updated to the StarDrop software package for the CSL proposal using the P450 model. The CSL of FNB is calculated by the P450 metabolic software by collecting the individual atoms labilities, revealing the overall metabolic lability [19,20,21] utilizing Equation (1):
CSL = k t o t a l k t o t a l + k w
as kw is the rate constant for water formation.

2.3. UPLC-MS/MS Adjusted Characteristics

The mass spectrometric (MS) and liquid chromatographic (LC) characteristics were optimized to get the highest sensitivity and good elution of the FNB and SVB analytical peaks (Table 1). LC parameters involved in the analytical separation of FNB and SVB, such as mobile phase, stationary phase, and pH were attuned to attain maximum intensity and optimum separation of the analytical peaks. First, the mobile phase contains an organic phase and an aqueous phase. The aqueous phase (0.1% formic acid in H2O at pH 3.2) represented 50% of the mobile phase. Making the pH value higher than 3.2 resulted in chromatographic peak tailing and a long running time. The organic phase (Acetonitrile) represented 50% of the mobile phase. Making the percentage of ACN more than 50% revealed poor and overlapped chromatographic peaks, while reducing the percentage of ACN revealed a long retention time. Second, the selected chromatographic column was an Eclipse plus-C18 column (50 mm, 1.8 μm, and 2.1 mm). Different stationary phase columns were used as polar HILIC (normal phase column). However, neither FNB nor SVB was analytically separated or retained, and the good data were obtained using the selected column.
MS spectrometric parameters contributing to the detection of FNB and SVB were adjusted to get the maximum sensitivity of the analytes (FNB and SVB) peaks from the LC system after ionization in the positive ESI source. The tuning for the MS spectrometric parameters of FNB (C37H44N8O4) and SVB (Molecular formula: C17H15N9) was performed using the IntelliStart® software by direct infusion (fluidics and LC) of the stock solutions of FNB (1 µg/mL) and SVB (1 µg/mL) into the mobile phase. MRM mode (mass analyzer) was applied for the determination of FNB and SVB to enhance the sensitivity and selectivity of the current UPLC-MS/MS analytical method (Figure 2). All mass transition (MRM mode) and MS features, as well as FNB and SVB (IS), are shown in Table 2.

2.4. FNB Working Solutions

FNB and SVB are dissolved in the organic solvent (DMSO) at ≥23 mg/mL (34.60 mM) and ≥20.83 mg/mL (60.31 mM), respectively. Therefore, primary stock preparations of FNB and SVB at 1 mg/mL were completed in DMSO owing to the stability and solubility of FNB and SVB in DMSO. Multistep dilutions of the FNB (1 mg/mL in DMSO) using diluting solvent (mobile phase) were made preparing the first working solutions (WK) at 100 µg/mL (FNB WK1), 10 µg/mL (FNB WK2) and 1 µg/mL (FNB WK3). Sequential step dilutions of the SVB (1 mg/mL in DMSO) were completed to prepare SVB WK1 at 10 µg/mL.

2.5. FNB Plotted Calibration Standards

The deactivation (enzymatic reaction quenching) of HLMs dilution matrix was made before adding FNB and SVB to avoid the effect of the metabolism in studying the validation parameters. The deactivation of the HLMs was made using the organic solvent (DMSO), as it stopped metabolic pathways at 2% [22] with heating for 5 min at 50 °C, as slight heating quenched HLMs activity [23,24]. The HLMs dilution matrix was prepared by the dilution of 30 µL the deactivated HLMs matrix (1 mg/mL) to 1 mL with the incubation buffer that is formed of 0.1 M sodium phosphate buffer (pH 7.4) involving the metabolic cofactor (1 mM NADPH) to match the in vitro incubation mixture for the determination of metabolic stability. The preparation of FNB calibration standards was completed by sequential dilution of FNB (WK2 and WK3) using the prepared HLMs matrix, resulting in nine calibration points: 1, 15, 30, 50, 150, 300, 500, 1500, and 3000 ng/mL, maintaining the HLMs matrix volume at more than 90% of the standards to remove the influence of dilution. These FNB calibration points were used to establish a linear calibration curve. Four FNB were prepared in the same way and used as quality controls (QCs) including LLOQ (1 ng/mL), LQC (3 ng/mL), MQC (900 ng/mL), and HQC (2400 ng/mL). QCs were injected into the UPLC-MS/MS system as unknowns, and the concentration was determined through the regression equation of a concurrent plot of FNB calibration points. One hundred µL of SVB WK3 (1000 ng/mL) was added as the IS to 1 mL of calibration levels and the three QCs.

2.6. Protein Precipitation Methodology for Extracting FNB and SVB from the HLMs Incubation Matrix

The protein precipitation using ACN was selected as the best methodology for extracting FNB and SVB from the target matrix (HLMs). First, 2 mL of ACN was added to 1 mL of the prepared FNB standards, QCs, or incubation samples. Second, good shaking (5 min) was performed, followed centrifugation at 14,000 rpm (12 min at 4 °C) for clarifying the supernatants and collecting the precipitate at the bottom of the samples. Third, further purification of the collected supernatants was made using a 0.22 µm syringe filter into HPLC vials to approve the purity and suitability of different samples to be injected into the UPLC-MS/MS analytical system. Positive (HLMs matrix + SVB) and negative (HLMs matrix) controls were extracted utilizing the same steps followed above. These controls were utilized to reveal the lack of any interfering peaks from HLMs matrix components at the same retention times as FNB and SVB. A statistical FNB calibration curve was made by plotting the FNB to SVB (peak area ratio; y-axis) against the FNB nominal concentration (x-axis). The linear regression equation (y = ax + b; r2) was utilized for verifying the linearity of the plotted FNB calibration curve.

2.7. Validation Parameters of the Developed UPLC-MS/MS Methodology

The validation parameters of the established UPLC-MS/MS methodology were completed utilizing specificity, linearity, accuracy, precision, sensitivity, extraction recovery, matrix effect, and stability following the USFDA-reported guidelines [25].

2.7.1. Specificity of the Developed UPLC-MS/MS Method

The specificity validation feature was verified by injecting six negative controls into HLM matrix batches after extracting using protein precipitation methodology, followed by injecting 5 µL of the extracts into UPLC-MS/MS. Checking for interference peaks was performed in the generated chromatograms at the elution times of FNB or SVB by comparing the spiked HLM samples with the target drugs (FNB and SVB). The MRM mode of the mass analyzer was utilized so as to eliminate the carryover influences of FNB and SVB in the UPLC-MS/MS system, as approved by the injection of the negative control HLMs without FNB and SVB.

2.7.2. Sensitivity and Linearity of the Developed UPLC-MS/MS Method

The LOD and LOQ were estimated as reported in the Pharmacopeia via the standard deviation of the intercept (SD) and the slope (SL) of the established calibration curve utilizing Equations (2) and (3), respectively:
LOD = 3.3 × SD SL
LOQ = 10 × SD SL
The sensitivity and linearity validation parameters were validated by injecting freshly plotted calibration levels and QCs of FNB into HLMs matrix in one day and then back estimating all samples as unknowns utilizing the regression equation of every constructed linear curve. The linearity validation parameter was proven via the least squared statistical methodology to establish a regression equation (y = ax + b; R2).

2.7.3. Precision and Accuracy of the Established UPLC-MS/MS Analytical Method

The intraday and interday precision and accuracy validation parameters were confirmed by injecting 12 replicates of FNB QCs in one day and 6 replicates of FNB QCs in 3 days, respectively. Precision and accuracy values were calculated as % relative standard deviation (% RSD) and % error (%E) as expressed in Equations (4) and (5), respectively.
%   RSD = SD   Mean
%   Error = average   conc . nominal   conc .   nominal   conc . × 100

2.7.4. Extraction Recovery and Matrix Effect of the Developed UPLC-MS/MS Method

The effect of the HLMs on the degree of ionization of FNB and the extraction recovery validation parameter of FNB from the HLMs metabolic incubation matrix were evaluated by injecting the QCs into the UPLC-MS/MS chromatographic system. The validity of the extraction method for FNB and SVB was revealed by injecting six repeats of QCs in HLMs matrix (B) and comparing them with QCs that were made in the mobile phase (A). The percent recovery of FNB and SVB was determined as the ratio of B/A × 100. The influence of HLMs incubation matrix constituents on the extent of FNB or SVB ionization was tested by injecting two series of QCs. HLMs matrix (Series 1) was spiked with the LQC (3 ng/mL) and SVB (1000 ng/mL), while series 2 was completed utilizing the diluting solvent (mobile phase) rather than the HLMs matrix. The matrix effects (ME) and the IS normalized ME for FNB and SVB were computed using Equations (6) and (7), respectively.
ME   of   FNB   or   SVB = average   peak   area   ratio   Series   1 Series   2 × 100
IS   normalized   ME = ME   of   FNB ME   of   SVB   IS

2.8. Stability of the FNB Stack Samples

FNB stabilities in HLMs matrix and in stock samples were estimated utilizing laboratory circumstances that might affect the FNB concentration before UPLC-MS/MS analysis, including auto sampler storage, three freeze-thaw cycles, and short- and long-term storage.

2.9. In Vitro Determination of FNB Metabolic Stability

The in vitro FNB metabolic stability features (the Clint and in vitro t1/2) were calculated by the determination of the remaining % FNB after in vitro incubation with an active HLMs matrix that consists of an enzyme co-factor (NADPH) that initiates the in vitro metabolic reaction. The in vitro incubation of FNB and HLMs matrices were completed in five steps (condition, initiation, termination, IS addition, and extraction). Conditioning: pre-incubation of 1 µL of FNB (1 mM) with HLMs incubation matrix (without the enzyme co-factor) for 10 min at 37 °C to get the suitable conditions for in vitro metabolic incubation. Initiation: beginning the metabolic pathway was made through adding of 1 mM NADPH. Termination: stopping the in vitro metabolic pathway was completed by adding 2 mL of ACN as a protein precipitating agent. IS addition: 100 µL of SVB WK3 of (10 µg/mL) was added before ACN addition to eliminate the metabolic influence on the SVB concentration. Ending the metabolic incubation was performed at chosen time stopping points at: 0, 2.5, 7.5, 15, 20, 30, 40, 50, 60, and 70 min. Extraction: the same methodology for protein precipitation at Section 2.7.4 was followed for extracting FNB and SVB [26].
The FNB concentration in HLM metabolic incubations was estimated utilizing the linear regression equation of a plotted FNB calibration curve. The FNB metabolic stability curve was established by plotting the selected stopping time points (0 to 70 min) on the x-axis against the percentage FNB concentration remaining (y-axis). Then the points of the established curve that exhibited linearity (0–30 min) were chosen to construct another curve by plotting the natural logarithm (ln) of the percentage of FNB concentration remaining against the time points (0–30 min), revealing the slope value (rate constant) that was used to compute the in vitro t1/2 (ln2/ slope. Furthermore, the FNB Clint (µL/min/mg) was estimated [27], using a value of 26 g for liver tissue in each kilogram of body weight and a value of 45 mg of HLMs matrix in each gram of liver tissue [28] (Equation (8)).
Cl int ,   = 0.693 in   vitro   t 1 2 × mL   incubation mg   microsomes × mg   HLMs g   liver × g   liver Kg

3. Results and Discussion

3.1. In Silico Metabolic Stability Assessment of FNB Using P450 Metabolic Model

The P450 metabolic model of the StarDrop software package proposes the main metabolizing CYP3A4 isoform for FNB metabolism as expressed through the pie chart (Figure 3A). Regioselectivity maps reveal the supposed locations of metabolism for FNB (Figure 3B). The metabolic landscape (Figure 3C) proposes the FNB metabolic lability at the sensitive locations to provide the FNB metabolic rate [29,30,31]. The CSL (0.9917) approved the high FNB metabolic lability; thus, the current UPLC-MS/MS methodology was utilized for FNB in vitro metabolic stability determination (Figure 3). The results revealed that C46, C47, and C49 of the oxetane group and C39, C41, C42, and C43 of the cyclopentane group, and C22 of the N-methyl group are labile to metabolizing enzymes, while C29 of the hydroxymethyl group is moderately labile to metabolizing enzymes. The in silico outcomes revealed that cyclopentane and oxetane groups are the main reason for FNB metabolic lability, as exhibited by the CSL (0.9917, displaying high lability to metabolism) as in Figure 3, which harmonized with the results of the in vitro metabolic incubation (Section 3.4).

3.2. Establishing Steps of UPLC–MS/MS Methodology

SVB was chosen as the IS for the estimation of FNB in the HLMs metabolic incubation matrix owing to the following aims: First, FNB and SVB were successfully extracted from HLMs incubation matrix using the same method of extraction (protein precipitation), with the optimum percentage of recovery for FNB (100.73 ± 4.47%) and SVB (101.85 ± 2.68%). Second, the analytical peaks of SVB (0.71 min) and FNB (1.43 min) were eluted in 2 min. with a good resolution that revealed a rapid methodology, saving time and consuming less ACN (green chemistry). Third, both FNB and SVB are not prescribed together for the same patient with the same medical case. Therefore, the current UPLC-MS/MS could be used for in vivo experiments in humans (pharmacokinetics studies or TDM studies) of FNB. Many experiments were tested to choose the best parameters for extraction, separation, and analysis of FNB and SVB in an optimum shape and at a fast elution time, as shown in Table 3.
To improve the selectivity and sensitivity of the developed UPLC-MS/MS methodology, the MRM mass analyzer detection mode was used for the quantification of FNB and SVB so as to remove any interfering peaks from the HLMs matrix (Figure 3). No detectable carry-over was noticed for FNB in the HLMs negative and positive control MRM chromatograms (Figure 4A,C). Figure 4B exhibits the overlaid calibration curve MRM chromatograms of nine calibration standards (1 ng/mL to 3000 ng/mL).

3.3. Validation Parameters of the Current UPLC-MS/MS Analytical Methodology

3.3.1. Specificity of the Developed UPLC-MS/MS Analytical Methodology

The specificity validation parameter was proved by the perfect separation of the analytical peaks of FNB and SVB, as exhibited in Figure 4. Also, there were no interfering endogenous peaks from the HLMs matrix constituents at the FNB and SVB retention times (Figure 4A). No carry-over of FNB was observed in the negative control MRM chromatogram (Figure 4C).

3.3.2. Linearity and Sensitivity of the Developed UPLC-MS/MS Analytical Methodology

The LOD and LOQ were 0.29 ng/mL and 0.88 ng/mL, respectively. The linearity validation parameter was proved in the linear range of 1.0 to 3000.0 ng/mL (y = 1.731x + 2.013; R2: 0.9954). Weighting (1/x) was used to establish a linear relationship between the plotted calibration points. The RSD for the six FNB calibration curves (nine points) and three QCs was <4.37% (Table 4).

3.3.3. Precision and Accuracy of the UPLC-MS/MS Analytical Method

The intraday and interday accuracy and precision results of the established UPLC-MS/MS analytical method were −3.99–14.0% and 0.52–3.83%, respectively (Table 5) that were in the adequate range subsequent the FDA validation guidelines [30].

3.3.4. Matrix Effects of HLMs and FNB Extraction Recovery

The outcomes showed a high extraction recovery rate for FNB (102.35 ± 7.27 and RSD < 7.1%) and SVB (101.85 ± 2.68%). The HLMs matrix has no influence on the extent of FNB or SVB ionization. Using Equation (6), the HLMs involving FNB and SVB displayed a matrix effect of 103.63 ± 2.75 % and 100.67 ± 3.48%, respectively. Using Equation (7), the IS normalized ME was 1.03, which was accepted following the FDA validation features. Consequently, the previous results confirmed that the HLMs matrix has no influence on the extent of SVB or FNB ionization.

3.3.5. Stability of FNB in DMSO and HLMs Matrix

FNB showed good stability in DMSO (stock solution) after being stored for 28 days at −80 °C. Under various handling and storage parameters, the RSD % of all FNB samples was <2.92% (Table 6). There was no loss of FNB after auto sampler storage, short-term storage, long-term storage, and three freeze-thaw cycles. The data indicate that perfect stability for FNB has been obtained.

3.4. In Vitro Metabolic Incubations of FNB

In metabolic stability experiments, the FNB concentration (1 µM/mL) should be utilized in the metabolic incubation experiment to be less than the Michaelis–Menten constant to construct the linearity between the time of incubation and the rate of metabolism. Furthermore, HLMs at 1 mg/mL should be utilized in the in vitro metabolic incubation experiment to avoid protein binding. The FNB concentration in different metabolic incubates was computed using a concurrently plotted FNB calibration curve. The linear part (0–30 min) of the plotted curve (Figure 5A) was constructed to establish the other natural logarithmic curve (Figure 5B). The second curve slope (0.04976) and the linear regression equation (y = −0.04976x + 4.619 with R2 = 0.9836) were used for computing FNB in vitro t1/2 (ln2/ slope) (Table 7). So, in vitro t1/2 was 13.93 min. FNB Clint was 58.21 mL/min/kg, as computed in Equation (9).
CL int ,   = 0.693 in   vitro   t 1 2 × mL   incubation mg   microsomes × mg   microsomal   proteins g   liver × g   liver Kg   b .   w .
CL int ,   = 0.693 13.93 × 1 1 × 45 1 × 26 1
CL int ,   = 58.21   mL / min / kg
Following the scoring scale reported in McNaney et al. [27], FNB is a high-clearance drug (Clint was 58.21 mL/min/kg) that reveals the value of the established work. By utilizing different software (Cloe PK and the simulation software), these results might also be used to propose the FNB in vivo pharmacokinetics [32]. The in silico results of the P450 model of CSL (0.9917) exposed also high FNB metabolic lability that agreed with the high clearance value (Clint was 58.21 mL/min/kg) of in vitro metabolic incubation that is considered higher than some reported TKIs (ex Tandutinib) [33,34,35,36]. The in silico results revealed that cyclopentane and oxetane groups are the main reasons for FNB metabolic lability. In silico StarDrop software could be utilized in an effective protocol to confirm and propose practical in vitro metabolic experiments to spare resources and time, especially during the first stages for designing new drugs.

4. Conclusions

A validated UPLC-MS/MS analytical methodology was made for determining FNB in HLMs metabolic incubation matrix and was used for metabolic stability determination. It is the first UPLC-MS/MS analytical methodology published for FNB estimation in HLMs matrix. The current UPLC-MS/MS method exhibits reasonable sensitivity and selectivity. The developed methodology also exhibited high recovery of SVB and FNB from HLMs matrix using protein precipitation using organic solvent (ACN) as an extraction methodology. The use of less ACN in the mobile phase at a low flow rate and short running time makes the established methodology eco-friendliness. The in vitro HLMs metabolic incubations were completed to prove the results of the in silico software (P450 model of StarDrop software package). The outcomes of the metabolic stability of FNB [high CLint (58.21 mL/min/kg) and small in vitro t1/2 (13.93 min)] show that FNB is a high clearance ratio drug. Future work might be performed utilizing in vitro and in silico tools for new drug design with improved metabolic stability. The data and outcomes of the in silico tools matched the in vitro incubation outcomes of FNB, which verifies the capability of in silico metabolic work to save resources and effort.

Author Contributions

M.W.A., A.S.A., H.I.A. and A.A.K. designed the experimental study. M.W.A., A.M.A. and A.S.A. did the practical laboratory procedures and drafted the first version of the manuscript. M.W.A., A.M.A. and A.A.K. designed the plan of the work, methodology steps and processing of data. All authors read, reviewed and permitted the final draft manuscript to be published in Separations journal. All authors have read and agreed to the published version of the manuscript.

Funding

This study was funded by the Researcher Supporting Project Number (RSPD2023R760), King Saud University, Riyadh, Saudi Arabia.

Data Availability Statement

All data are available within the manuscript.

Ethical Approval

The use of HLMs that were procured commercially from Sigma company relieves it from the necessity of ethical approval.

Acknowledgments

The authors extend their appreciation to the Researcher Supporting Project Number (RSPD2023R760), King Saud University, Riyadh, Saudi Arabia for funding this research work.

Conflicts of Interest

The authors declare no conflict of interest.

Abbreviations

FNB, Fenebrutinib; SVB, savolitinib; ESI, electrospray ionization; BTK, bruton tyrosine kinase; Clint, intrinsic clearance; UPLC-MS/MS, ultra-performance liquid chromatography tandem mass spectrometry; IS, internal standard; HLMs, human liver microsomes; t1/2, half-life. MRM, multiple reaction monitoring.

References

  1. Isenberg, D.; Furie, R.; Jones, N.S.; Guibord, P.; Galanter, J.; Lee, C.; McGregor, A.; Toth, B.; Rae, J.; Hwang, O.; et al. Efficacy, Safety, and Pharmacodynamic Effects of the Bruton’s Tyrosine Kinase Inhibitor Fenebrutinib (GDC-0853) in Systemic Lupus Erythematosus: Results of a Phase II, Randomized, Double-Blind, Placebo-Controlled Trial. Arthritis Rheumatol. 2021, 73, 1835–1846. [Google Scholar] [CrossRef] [PubMed]
  2. Weber, M.; Harp, C.; Bremer, M.; Goodyear, A.; Crawford, J.; Johnson, A.; Bar-Or, A. Fenebrutinib demonstrates the highest potency of bruton tyrosine kinase inhibitors (BTKis) in phase 3 clinical development for multiple sclerosis (MS)(4437). Neurology 2021, 96, 4473. [Google Scholar]
  3. Bag-Ozbek, A.; Hui-Yuen, J.S. Emerging B-cell therapies in systemic lupus erythematosus. Ther. Clin. Risk Manag. 2021, 17, 39–54. [Google Scholar] [CrossRef] [PubMed]
  4. Crawford, J.J.; Zhang, H. Discovery and Development of Non-Covalent, Reversible Bruton’s Tyrosine Kinase Inhibitor Fenebrutinib (GDC-0853). In Complete Accounts of Integrated Drug Discovery and Development: Recent Examples from the Pharmaceutical Industry Volume 2; ACS Publications: Washington, DC, USA, 2019; pp. 239–266. [Google Scholar]
  5. Houston, J.B. Utility of in vitro drug metabolism data in predicting in vivo metabolic clearance. Biochem. Pharm. 1994, 47, 1469–1479. [Google Scholar] [CrossRef] [PubMed]
  6. Obach, R.S.; Baxter, J.G.; Liston, T.E.; Silber, B.M.; Jones, B.C.; MacIntyre, F.; Rance, D.J.; Wastall, P. The prediction of human pharmacokinetic parameters from preclinical and in vitro metabolism data. J. Pharm. Exp. 1997, 283, 46–58. [Google Scholar]
  7. Attwa, M.W.; Kadi, A.A.; Darwish, H.W.; Amer, S.M.; Alrabiah, H. A reliable and stable method for the determination of foretinib in human plasma by LC-MS/MS: Application to metabolic stability investigation and excretion rate. Eur. J. Mass Spectrom. 2018, 24, 344–351. [Google Scholar] [CrossRef]
  8. Darwish, H.W.; Kadi, A.A.; Attwa, M.W.; Almutairi, H.S. Investigation of metabolic stability of the novel ALK inhibitor brigatinib by liquid chromatography tandem mass spectrometry. Clin. Chim. Acta 2018, 480, 180–185. [Google Scholar] [CrossRef]
  9. Attwa, M.W.; Darwish, H.W.; Alhazmi, H.A.; Kadi, A.A. Investigation of metabolic degradation of new ALK inhibitor: Entrectinib by LC-MS/MS. Clin. Chim. Acta 2018, 485, 298–304. [Google Scholar] [CrossRef]
  10. Amer, S.M.; Kadi, A.A.; Darwish, H.W.; Attwa, M.W. LC–MS/MS method for the quantification of masitinib in RLMs matrix and rat urine: Application to metabolic stability and excretion rate. Chem. Cent. J. 2017, 11, 136. [Google Scholar] [CrossRef]
  11. Jones, N.S.; Yoshida, K.; Salphati, L.; Kenny, J.R.; Durk, M.R.; Chinn, L.W. Complex DDI by fenebrutinib and the use of transporter endogenous biomarkers to elucidate the mechanism of DDI. Clin. Pharmacol. Ther. 2020, 107, 269–277. [Google Scholar] [CrossRef]
  12. Durk, M.R.; Jones, N.S.; Liu, J.; Nagapudi, K.; Mao, C.; Plise, E.G.; Wong, S.; Chen, J.Z.; Chen, Y.; Chinn, L.W.; et al. Understanding the Effect of Hydroxypropyl-β-Cyclodextrin on Fenebrutinib Absorption in an Itraconazole–Fenebrutinib Drug–Drug Interaction Study. Clin. Pharmacol. Ther. 2020, 108, 1224–1232. [Google Scholar] [CrossRef]
  13. Estupiñán, H.Y.; Berglöf, A.; Zain, R.; Smith, C.E. Comparative analysis of BTK inhibitors and mechanisms underlying adverse effects. Front. Cell Dev. Biol. 2021, 9, 630942. [Google Scholar] [CrossRef] [PubMed]
  14. Krishna, M.V.; Padmalatha, K.; Madhavi, G. In Vitro Metabolic Stability of Drugs and Applications of LC-MS in Metabolite Profiling. In Drug Metabolism; Dunnington, K., Ed.; IntechOpen: Rijeka, Croatia, 2021. [Google Scholar]
  15. Wadhwa, G.; Krishna, K.V.; Taliyan, R.; Tandon, N.; Yadav, S.S.; Katiyar, C.; Dubey, S.K. Pre-clinical pharmacokinetic and pharmacodynamic modelling study of 4-hydroxyisoleucine using validated ultra-performance liquid chromatography-tandem mass spectrometry. RSC Adv. 2020, 10, 5525–5532. [Google Scholar] [CrossRef] [PubMed]
  16. Baranczewski, P.; Stańczak, A.; Sundberg, K.; Svensson, R.; Wallin, A.; Jansson, J.; Garberg, P.; Postlind, H. Introduction to in vitro estimation of metabolic stability and drug interactions of new chemical entities in drug discovery and development. Pharm. Rep. 2006, 58, 453–472. [Google Scholar]
  17. Tyzack, J.D.; Kirchmair, J. Computational methods and tools to predict cytochrome P450 metabolism for drug discovery. Chem. Biol. Drug Des. 2019, 93, 377–386. [Google Scholar] [CrossRef]
  18. Attwa, M.W.; AlRabiah, H.; Alsibaee, A.M.; Abdelhameed, A.S.; Kadi, A.A. An UPLC–ESI–MS/MS Bioanalytical Methodology for the Quantification of Gilteritinib in Human Liver Microsomes: Application to In Vitro and In Silico Metabolic Stability Estimation. Separations 2023, 10, 278. [Google Scholar] [CrossRef]
  19. Alrabiah, H.; Kadi, A.A.; Attwa, M.W.; Abdelhameed, A.S. A simple liquid chromatography-tandem mass spectrometry method to accurately determine the novel third-generation EGFR-TKI naquotinib with its applicability to metabolic stability assessment. Rsc Adv. 2019, 9, 4862–4869. [Google Scholar] [CrossRef]
  20. Kadi, A.A.; Darwish, H.W.; Abuelizz, H.A.; Alsubi, T.A.; Attwa, M.W. Identification of reactive intermediate formation and bioactivation pathways in Abemaciclib metabolism by LC-MS/MS: In vitro metabolic investigation. R. Soc. Open Sci. 2019, 6, 181714. [Google Scholar] [CrossRef] [PubMed]
  21. Attwa, M.W.; Kadi, A.A.; Abdelhameed, A.S.; Alhazmi, H.A. Metabolic stability assessment of new parp inhibitor talazoparib using validated lc–ms/ms methodology: In silico metabolic vulnerability and toxicity studies. Drug Des. Dev. Ther. 2020, 14, 783–793. [Google Scholar] [CrossRef]
  22. Busby, W.F., Jr.; Ackermann, J.M.; Crespi, C.L. Effect of methanol, ethanol, dimethyl sulfoxide, and acetonitrile on in vitro activities of cDNA-expressed human cytochromes P-450. Drug Metab. Dispos. 1999, 27, 246–249. [Google Scholar]
  23. Störmer, E.; Roots, I.; Brockmöller, J. Benzydamine N-oxidation as an index reaction reflecting FMO activity in human liver microsomes and impact of FMO3 polymorphisms on enzyme activity. Br. J. Clin. Pharm. 2000, 50, 553–561. [Google Scholar] [CrossRef] [PubMed]
  24. Fouin-Fortunet, H.; Tinel, M.; Descatoire, V.; Letteron, P.; Larrey, D.; Geneve, J.; Pessayre, D. Inactivation of cytochrome P-450 by the drug methoxsalen. J. Pharm. Exp. 1986, 236, 237–247. [Google Scholar]
  25. United State of America–Food and Drug Administration. Bioanalytical Method Validation Guidance for Industry. 2018. Available online: https://www.fda.gov/ucm/groups/fdagov-public/@fdagov-drugsgen/documents/document/ucm070107.pdf (accessed on 17 February 2022).
  26. Abdelhameed, A.S.; Attwa, M.W.; Kadi, A.A. Identification of Iminium Intermediates Generation in the Metabolism of Tepotinib Using LC-MS/MS: In Silico and Practical Approaches to Bioactivation Pathway Elucidation. Molecules 2020, 25, 5004. [Google Scholar] [CrossRef] [PubMed]
  27. McNaney, C.A.; Drexler, D.M.; Hnatyshyn, S.Y.; Zvyaga, T.A.; Knipe, J.O.; Belcastro, J.V.; Sanders, M. An automated liquid chromatography-mass spectrometry process to determine metabolic stability half-life and intrinsic clearance of drug candidates by substrate depletion. Assay Drug Dev. Technol. 2008, 6, 121–129. [Google Scholar] [CrossRef]
  28. Słoczyńska, K.; Gunia-Krzyżak, A.; Koczurkiewicz, P.; Wójcik-Pszczoła, K.; Żelaszczyk, D.; Popiół, J.; Pękala, E. Metabolic stability and its role in the discovery of new chemical entities. Acta Pharm. 2019, 69, 345–361. [Google Scholar] [CrossRef]
  29. Tan, L.; Kirchmair, J. Software for Metabolism Prediction. In Drug Metabolism Prediction; Kirchmair, J., Ed.; Wiley-VCH Verlag GmbH & Co. KGaA: Weinheim, Germany, 2014; pp. 27–52. [Google Scholar]
  30. Hunt, P.A.; Segall, M.D.; Tyzack, J.D. WhichP450: A multi-class categorical model to predict the major metabolising CYP450 isoform for a compound. J. Comput. Mol. Des. 2018, 32, 537–546. [Google Scholar] [CrossRef]
  31. Shin, Y.G.; Le, H.; Khojasteh, C.; Hop, C.E.C.A. Comparison of metabolic soft spot predictions of CYP3A4, CYP2C9 and CYP2D6 substrates using MetaSite and StarDrop. Comb. Chem. High Throughput Screen. 2011, 14, 811–823. [Google Scholar] [CrossRef]
  32. Leahy, D.E. Integrating invitro ADMET data through generic physiologically based pharmacokinetic models. Expert Opin. Drug Metab. Toxicol. 2006, 2, 619–628. [Google Scholar] [CrossRef]
  33. Attwa, M.W.; Al-Shakliah, N.S.; AlRabiah, H.; Kadi, A.A.; Abdelhameed, A.S. Estimation of zorifertinib metabolic stability in human liver microsomes using LC–MS/MS. J. Pharm. Biomed. Anal. 2022, 211, 114626. [Google Scholar] [CrossRef]
  34. Attwa, M.W.; Abdelhameed, A.S.; Alsaif, N.A.; Kadi, A.A.; AlRabiah, H. A validated LC-MS/MS analytical method for the quantification of pemigatinib: Metabolic stability evaluation in human liver microsomes. RSC Adv. 2022, 12, 20387–20394. [Google Scholar] [CrossRef]
  35. Mostafa, G.A.E.; Kadi, A.A.; AlMasoud, N.; Attwa, M.W.; Al-Shakliah, N.S.; AlRabiah, H. LC-MS/MS method for the quantification of the anti-cancer agent infigratinib: Application for estimation of metabolic stability in human liver microsomes. J. Chromatogr. B Anal. Technol. Biomed. Life Sci. 2021, 1179, 122806. [Google Scholar] [CrossRef] [PubMed]
  36. Attwa, M.W.; Abdelhameed, A.S.; Al-Shakliah, N.S.; Kadi, A.A. Lc-ms/ms estimation of the anti-cancer agent tandutinib levels in human liver microsomes: Metabolic stability evaluation assay. Drug Des. Dev. Ther. 2020, 14, 4439–4449. [Google Scholar] [CrossRef] [PubMed]
Figure 1. Chemical structures of 1. Fenebrutinib and 2. savolitinib (internal standard).
Separations 10 00302 g001
Figure 2. MRM mass spectrum of SVB with the predicted dissociation pattern (A). MRM mass spectrum of FNB with the predicted dissociation pattern (B).
Separations 10 00302 g002
Figure 3. These outcomes were generated using P450 metabolism model (StarDrop software). P450 model proposes the main metabolizing isoform (CYP3A4) for the in vitro FNB metabolic reactions as revealed by the pie chart (A). Regioselectivity map revealed the predicted locations of metabolic pathways for FNB (B). Metabolic landscape exhibiting CSL of FNB (0.9917) indicating the high metabolic lability (C).
Separations 10 00302 g003
Figure 4. Negative control (Blank HLMs incubation matrix) revealing no interfering analytical peaks at the of FNB and SVB retention times (A), MRM chromatograms of positive control (Blank HLMs plus SVB at 1000 ng/mL) (B), and overlaid calibration curve chromatograms of the in FNB calibration points (1, 15, 30, 50, 150, 300, 500, 1500 and 3000 ng/mL) (C) showing the SVB peak (1000 ng/mL; 0.71 min) and FNB peak (1.43 min).
Separations 10 00302 g004
Figure 5. The FNB metabolic stability curve in HLMs (A) and ln calibration curve revealing the slope (0.04976) (B).
Separations 10 00302 g005
Table 1. Analytical features of UPLC-MS/MS methodology.
Acquity UPLC Chromatographic System (H10UPH)Acquity TQD MS Mass Analyzer System (QBB1203)
Isocratic mobile phase50% acetonitrileESICone gas: 100 L/H
0.1%
HCOOH
50%Positive ESI
pH: 3.2
Injection volume: 5.0 μLDrying gas: nitrogen of high purity at 650 L/H flow rate at 350 °C
Flow rate: 0.2 mL/min.The extractor voltage: 3.0 (V)
ZORBAX Eclipse plus-C18 column2.1 mm i.d.The RF lens voltage: 0.1 (V)
1.8 μm particle sizeCapillary voltage: 4 KV
T: 22.0 ± 2.0 °CModeMRM
50.0 mm longCollision cellArgon gas (high purity) at 0.15 mL/min.
Table 2. MRM optimized features of FNB and SVB (IS).
TimeRetention TimeAnalyteMRM Transitions
Mass spectra segment0.0 to 1.2 minSVB (0.71 min)Savolitinib (SVB, IS)Qualification traces (m/z)346.1 → 318.1
CV a: 30 and CE b: 10
Quantification traces (m/z)346.1 → 145.2
CV: 30 and CE: 16
1.2 to 2.0 minFNB (1.43 min)Analyte: Fenebrutinib (FNB, IS)Qualification traces (m/z)665.3 → 647.4
CV: 58 and CE: 26
Quantification traces (m/z)665.3 → 236.2
CV: 58 and CE: 58
a Cone voltage (V), b Collision energy (eV).
Table 3. Summary of the trials targeted the best separation of FNB and SVB peaks.
AnalytesMethanolACNSolid Phase
Extraction
Protein
Precipitation
C8 ColumnC18 Column
SVB0.85 min0.71 minLow recoveryHigh recovery1.23 min0.71 min
Tailed peaksGood peak shapeNot precisePrecise resultsTailed peaksPerfect peak shape
FNB1.15 min1.43 minLow recoveryHigh recovery1.38 min1.43 min
OverlappedGood peak shapeNot precisePrecise resultsPerfect peak shapePerfect peak shape
SVB, Savolitinib; FNB, Fenebrutinib; ACN, Acetonitrile.
Table 4. Back-calculation results of six calibration curves (nine points) and three QCs of FNB.
FNB (ng/mL)AverageSDRSD %RE %Recovery
1(LLQC)1.140.010.8814.00114.00
3(LQC)2.880.061.92−3.9996.01
1514.750.493.33−1.6598.35
3030.601.344.372.00102.00
5049.010.801.64−1.9798.03
150150.522.011.340.35100.35
300299.622.920.98−0.1399.87
500495.663.240.65−0.8799.13
900 (MQC)890.944.760.53−1.0198.99
15001512.405.130.340.83100.83
2400 (HQC)2411.7312.640.520.49100.49
30003021.054.880.160.70100.70
% Recovery100.73 ± 4.47
Table 5. Precision and accuracy (intraday and interday) results of the UPLC-MS/MS methodology.
FNB (ng/mL)Intra-Day AssayInter-Day Assay
139002400139002400
Average1.142.88890.942411.731.132.90892.632412.10
SD0.010.064.7612.640.010.117.1637.93
Precision (%RSD)0.881.920.530.521.253.830.801.57
Accuracy (% RE)14.00−3.99−1.010.4913.00−3.27−0.820.50
Recovery (%)114.0096.0198.99100.49113.0096.7399.18100.50
Table 6. Stability of FNB in DMSO and HLMs matrix.
Stability ParameterLQC (3.0)HQC (2400.0)LQC (3.0)HQC (2400.0)LQC (3.0)HQC (2400.0)LQC (3.0)HQC (2400.0)
MeanSDRSD (%)Accuracy (%)
Short-Term Stability (4 h at room temperature)2.952420.970.0918.632.920.77−1.670.87
Freeze–Thaw Stability (three cycles at −80 °C)2.942416.770.0428.021.471.16−2.110.70
Auto-sampler Stability
(24 h at 15 °C)
2.962408.350.0327.540.901.14−1.220.35
Long-Term Stability (−80 °C for 28 d)2.942415.300.0422.731.270.94−2.170.64
Table 7. FNB metabolic stability parameters.
Time (min.)Mean a (ng/mL)X bln XLinearity Parameters
0623.45100.004.61Regression equation:
y = −0.04976x + 4.619
2.5578.2393.264.54
5517.3881.094.40R2 = 0.9836
7.5443.9769.594.24
15308.7448.393.88Slope: −0.04976
20207.9832.603.48
30123.8519.412.97t1/2: 13.93 min and
40115.7518.142.90Clint: 58.21 mL/min/kg
50110.3817.302.85
70108.8717.062.84
Notes: a Average of three determinations. b X: Average of the FNB % remaining of the three determinations.
Disclaimer/Publisher’s Note: The statements, opinions and data contained in all publications are solely those of the individual author(s) and contributor(s) and not of MDPI and/or the editor(s). MDPI and/or the editor(s) disclaim responsibility for any injury to people or property resulting from any ideas, methods, instructions or products referred to in the content.

