Article

Salting-Out Assisted Liquid-Liquid Extraction for UPLC-MS/MS Determination of Thyroxine and Steroid Hormones in Human Serum and Fish Plasma

by
Alemnesh Yirda Urge
1,2,
Daniela Maria Pampanin
1,
Maria Elena Martino
2,
David Lausten Knudsen
3 and
Cato Brede
1,3,4,*
1
Department of Chemistry, Bioscience and Environmental Engineering, University of Stavanger, N-4036 Stavanger, Norway
2
Department of Comparative Biomedicine and Food Science, University of Padua, 35122 Padua, Italy
3
Fishlab AS, N-4015 Stavanger, Norway
4
Department of Medical Biochemistry, Stavanger University Hospital, N-4068 Stavanger, Norway
*
Author to whom correspondence should be addressed.
Separations 2023, 10(4), 240; https://doi.org/10.3390/separations10040240
Submission received: 13 March 2023 / Revised: 30 March 2023 / Accepted: 3 April 2023 / Published: 5 April 2023
(This article belongs to the Special Issue Mass Spectrometry Development and Its Application in Bioanalysis)

Abstract

:
Measuring the level of steroid and thyroxine hormones is key to understanding organism health conditions. Liquid chromatography coupled with tandem mass spectrometry has become the method of choice for such hormone analyses in clinical laboratories. Detection of hormones at low levels typically requires a time-consuming sample preparation, such as liquid-liquid extraction followed by solvent evaporation and re-solubilization of the sample extract. Instead, we applied salting-out assisted liquid-liquid extraction (SALLE) for the extraction of thyroxine, testosterone, cortisone, and cortisol from human serum and fish plasma samples. SALLE allowed direct injection of sample extracts. Sodium chloride and ammonium sulfate were evaluated as salting-out reagents together with four different organic solvents. High extraction recovery and reduced matrix interference were achieved by using ammonium sulfate together with 10% methanol in acetonitrile. Limits of quantification were in the range of 0.1–0.2 ng/mL and signal responses were linear (R2 > 0.997) up to at least 100 ng/mL for all hormones. The method was applied for hormone measurements in fish plasma. In conclusion, SALLE combines the simplicity of crude protein precipitation with the high analyte enrichment of a liquid-liquid extraction. Here we have presented it as a novel sample preparation method for clinical laboratories where mass spectrometry is utilized in the field of endocrinology.

Graphical Abstract

1. Introduction

Physiological stress response includes the communication between tissues and cells that can occur via the central nervous system. This is accomplished in humans through the release of chemical messengers (namely, hormones) from the endocrine system [1]. The biosynthesis of cortisol is controlled by the hypothalamic-pituitary-adrenal axis (HPA-axis) [2]. Cortisol released from the adrenal glands follows a diurnal pattern with high serum concentrations in the morning and low serum concentrations during sleep. Disruption of the HPA-axis by disease, such as in Cushing’s disease, is the main indication for the measurement of circulating cortisol in humans.
Under stressful conditions fish also launch neurochemical signaling, such as the release of cortisol into the blood circulation via the activation of the hypothalamic-pituitary-interrenal axis (HPI-axis) [3]. Therefore, stressful conditions are measurable through hormone quantifications, for example, cortisol measurement is typically applied to evaluate stress in fish [4]. Previous studies have demonstrated that cortisol is responsible for both glucocorticoid and mineralocorticoid functions in teleost fish [5,6]. Cortisol therefore also plays a vital role in metabolic processes like osmoregulation, growth, and reproduction, as well as affecting healing and repair mechanisms in the skin, and proliferation and differentiation of gill epithelium cells. During seawater preadaptation (smoltification) of anadromous fish like Atlantic salmon (Salmo salar), plasma levels of glucocorticoids such as cortisol, cortisone, and corticosterone rise significantly [7,8].
The hypothalamic-pituitary-thyroid axis (HPT-axis), under the regulation of the thyroid gland, is responsible for the production of two essential hormones: triiodothyronine (T3) and tetraiodothyronine (thyroxine, T4) [9,10,11]. Thyroid hormones (THs) play important roles in fish biology, including growth and differentiation, maintenance of the body homeostasis, environmental adaptation, body fluid balance, nutrient metabolism, and metamorphosis for migration from freshwater to seawater (smoltification) in the larvae [9,10,12]. Furthermore, THs have a major role in the stress response of fish [13]. Recently Deal and Volkoff discovered that the nutritional status affected the thyroid axis and appetite regulators in goldfish [14]. Since steroid and thyroid hormones control such a wide range of metabolic responses, it is possible to gain insights into the physiological status of a fish by measuring the level of these hormones and their metabolites. Steroid hormones like cortisol, cortisone, and testosterone, but also THs, like thyroxine, could potentially be used as biomarkers of stress, sexual maturation, and smoltification [15].
The concentrations of steroid hormones [16,17,18] and THs [19] in biofluids have previously been measured mostly by immunoassay methods. However, those methods suffer from well-known issues such as antibody cross-reactivity with interference [20], limited multiplex capabilities, and inadequate selectivity for the detection of hormones at trace levels [21,22,23]. Clinical laboratories may therefore prefer to use ultra-performance liquid chromatography coupled with tandem mass spectrometry (UPLC-MS/MS) to overcome these issues. Methods based on UPLC-MS/MS are known to provide high selectivity and sensitivity for measurements of several hormones in the same analysis [19,24,25,26]. However, the bioanalytical method for small molecules, such as hormones in whole blood, plasma, or serum, needs pre-treatment to clean up the sample to remove potential interferences [27]. Solid-phase extraction (SPE) is one of the common sample preparation techniques widely used in the extraction of thyroxine and steroid hormones from fish plasma [19,28]. The main disadvantages of SPE are the high costs and a time-consuming procedure. Liquid-liquid extraction (LLE) is another useful sample extraction technique [26,29,30] that is considerably less expensive than SPE. However, in LLE, the solvent extract needs to be dried by evaporation, followed by re-solubilization with a water-miscible solvent that is compatible with the reversed phase LC separation.
UPLC-MS/MS analyses in clinical laboratories often require lengthy, demanding, and solvent-consuming steps such as LLE and SPE. Quicker and more direct sample preparation methods should be developed, ideally with less consumption of solvent. In the present work, we have therefore explored salting-out assisted liquid-liquid extraction (SALLE) for the measurement of thyroxine and steroid hormones in human serum and fish plasma. SALLE is basically a type of LLE but uses a water-miscible solvent instead of a non-polar solvent [31,32,33,34,35]. Usually, the addition of water-miscible solvents to serum is done to achieve protein precipitation (PPT) which is a straightforward but crude type of sample preparation. However, when adding enough salt into mixtures like these, the ion strength increases to such an extent that the solvent may no longer be miscible, and a phase separation occurs. Analytes with better solubility in the polar solvent will then be highly partitioned into the solvent phase. Therefore, by using water-miscible solvents and a salt-induced phase separation, SALLE combines the simplicity of PPT with the high extraction efficiency of LLE. The main advantage of the SALLE method over LLE is the possibility of using more polar extraction solvents to further increase extraction recovery of less hydrophobic analytes. With SALLE it is also possible to evaporate the solvent extract to achieve higher analyte enrichment. However, changing solvent is not necessary when using SALLE because the polar solvent can be injected directly into a reversed-phase LC separation column. An excellent illustration of these advantages can be found in a recent paper, where SALLE was found to be superior to LLE and PPT for the extraction of a wide range of phytochemicals from rat plasma [31]. Measurement of steroid hormones, including testosterone, in fish tissue, has also been reported previously with the application of SALLE [36]. However, so far there have not been any reports on the use of SALLE for the measurement of thyroxine or steroid hormones in serum and plasma.
We optimized SALLE for the UPLC-MS/MS measurement of thyroxine, cortisol, cortisone, and testosterone in human serum. In these experiments, either acetonitrile, acetone, 1-propanol, or 2-propanol were mixed with serum followed by the addition of saturated salt to induce phase separation. Relative extraction recovery and relative matrix effects were investigated by post-extraction spiking with isotopic labeled internal standards, similar to previously described experiments [37,38]. Saturated solutions of either ammonium sulfate or sodium chloride were evaluated as salting-out reagents. Fine-tuning of the SALLE method involved both a reduction of the acetonitrile solvent volume and the addition of a small amount of methanol, to increase analyte signal responses. The final method was validated by investigation of analytical performance characteristics such as repeatability, reproducibility, the limit of quantification (LOQ), as well as method recovery. As part of method validation, the advantages of the final SALLE protocol could be verified by comparing results with PPT and LLE. Finally, these hormones were quantified in the plasma of farmed Atlantic salmon kept in different net cages, to observe differences between groups. To the best of our knowledge, this is the first report on the use of SALLE for the simultaneous measurement of steroid hormones and thyroxine in serum or plasma.

2. Materials and Methods

2.1. Chemicals

Analytical grade formic acid (99–100%), HPLC grade acetonitrile (ACN), methanol (MeOH), 1-propanol, 2-propanol, and methyl tert-butyl ether (MTBE) were purchased from VWR International (Radnor, PA, USA). Thyroxine (99%), testosterone (99.5%), deuterium (D) labeled cortisol (D4 cortisol), D-labeled cortisone (D8 cortisone), and D-labeled testosterone (D3 testosterone) were obtained from Sigma-Aldrich (St. Louis, MO, USA). The two steroid hormones, cortisol (99.4%) and cortisone (97.9%) were obtained from Alfa Aesar (Ward Hill, MA, USA). 13C6 labeled thyroxine (13C6 thyroxine) was obtained from Toronto Research Chemicals (Toronto, ON, Canada). Analytical grade sodium chloride (NaCl) and ammonium sulfate ((NH4)2SO4) were purchased from Merck KGaA (Darmstadt, Germany). The Autonorm TM Immunoassay serum Liq L−1 (LOT 1605243) was provided by Sero AS (Billingstad, Norway). The purified water to 18.2 MOhm was from Elga lab water (High Wycombe, United Kingdom).

2.2. Stock and Calibration Standards Solutions

Separate stock solutions in methanol were initially prepared with the following concentrations: Cortisol (1.20 mg/mL), cortisone (1.15 mg/mL), and testosterone (1.08 mg/mL). Intermediate stock solutions were made from these by dilution of 1 mL into 25 mL methanol. The thyroxine (T4) stock solution was prepared with a concentration of 0.038 mg/mL in a 25 mL solvent mixture comprising of 10 mL water, 1 mL of 25% ammonium hydroxide, and 14 mL methanol. From a common mixture of stock solutions in methanol, the calibration standard solutions were prepared in water containing 20% (v/v) methanol at eight concentration levels within the ranges 0–100 ng/mL for cortisol, cortisone, and testosterone, and 0–200 ng/mL for T4. The internal standard working solution (ISTD) was prepared in methanol with the following concentrations: 67 ng/mL for D4 cortisol, 87 ng/mL for D8 cortisone, 72 ng/mL for D3 testosterone, and 48 ng/mL for 13C6 thyroxine.

2.3. Samples

The method was developed and validated by using the Autonorm Immunoassay Liq L−1 commercial quality control human serum (Sero AS, Billingstad, Norway). Plasma samples from adult Atlantic salmon were derived from three different open net pens of a commercial fish farm in southern Norway on the 23rd of June 2020 with a sea water temperature of 18.2 °C. The average weights of the fish were 1810, 2077, and 2085 g respectively from nets 1 to 3. Fish kept in nets 2 and 3 received a standard commercial feed containing 38% fat, while fish in net 1 received a feed with slightly higher levels of certain vitamins and immune-stimulating components. Before collecting blood as part of routine health monitoring, fish were transported live to the central barge at the fish farm by boat and then anesthetized by an overdose with Finquel (MS-222) before sampling. This procedure was lawful according to the Norwegian national aquaculture operations regulations (§34 of Akvakulturdriftskriften, https://lovdata.no/LTI/forskrift/2008-06-17-822 (accessed on 4th of April 2023)). Blood samples were taken by Vacuette containers (Greiner Bio-One GmbH, Kremsmünster, Austria), containing lithium-heparin anticoagulant. After centrifugation, fish plasma was kept frozen (−18 °C) until analysis.

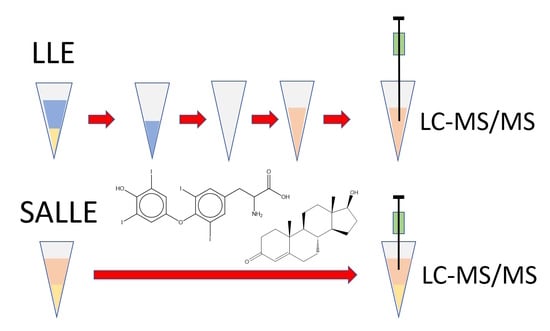
2.4. Sample Preparation

Both the optimization experiments and the final SALLE method were carried out in standard 2 mL microcentrifuge tubes made of polypropylene (cat# PCRP-020-500, Teknolab AS, Ski, Norway). For instrumental analysis, the solvent extracts were transferred to autosampler micro-vials with PTFE-lined caps (cat# 548-0440 and cat# 548-0034, VWR International, Leuven, Germany). The following steps were included in the final SALLE protocol:
  • Pipetting into a microcentrifuge tube:
    • 150 µL sample of either human serum, fish plasma, calibration standard, or blank water
    • 25 µL internal standard solution in methanol (ISTD)
    • 100 µL saturated ammonium sulfate
    • 225 µL acetonitrile (ACN).
  • Capping the tube, shaking for 1 min, and centrifuging for 10 min at 2300 G.
  • Pipetting 100 µL from the top phase solvent to an autosampler micro-vial, capping, and putting it into the UPLC-MS/MS instrument.

2.5. Instrumental Method Development

The UPLC-MS/MS instrumental analysis was performed with an Acquity ultra performance liquid chromatography (UPLC) system coupled with a Quattro Premier XE mass spectrometer (Waters, Milford. MA, USA). Chromatographic separation was achieved by gradient elution using a reversed-phase Acquity BEH C18 column with a 2.1 mm inner diameter (ID) and 100 mm length, containing 1.7 µm particles (Waters). Column and autosampler temperatures were 50 °C and 10 °C, respectively. The mobile phase was a mixture of (A) water containing 0.2% (v/v) formic acid and (B) methanol. Following injection of 10 µL sample extract, stepwise linear gradient elution was: 1% B (0 min), 50% B (0.1 min), 70% B (1.7 min), 80% B (2.1 min), 99% B (3.1–5 min), and 1% B (5.1–7 min). The mobile phase flow rate was 0.2 mL/min, except from 5.1 to 6.9 min where it was increased to 0.4 mL/min to faster regenerate the column. Data acquisition and processing were done by using MassLynx 4.1 (Waters).

2.6. Method Validation

The newly developed SALLE method was evaluated and validated according to the Eurachem Guide [39]. The linearity correlation coefficient (R2 > 0.99) was first established from the ratio of peak area to correspondent internal standard area for each analyte. Limits of detection (LOD) and limit of quantification (LOQ) were calculated from the mean and standard deviation from 10 replicates of a blank sample. Furthermore, the intra-day precision was investigated by calculating the variation between samples run within the same day, while the inter-day precision was calculated from the result of consecutive five working days with identical concentration and sample preparation procedures by the same analyst. To calculate the analyte recovery and accuracy of the established analytical procedure, three quality control human serum samples were prepared by spiking with a stock solution containing different concentrations of individual analytes as, low (i.e., 19 ng/mL of cortisol, 18 ng/mL of cortisone, 17 ng/mL of testosterone, and 40 ng/mL T4), medium (i.e., 29 ng/mL of cortisol, 28 ng/mL of cortisone, 26 ng/mL of testosterone, and 60 ng/mL T4) and high (i.e., 48 ng/mL of cortisol, 46 ng/mL of cortisone, 43 ng/mL of testosterone, and 100 ng/mL T4) concentrations. According to the product specifications, the assigned concentrations of hormones already present in this serum were as follows: 94 ng/mL of cortisol, 6.2 ng/mL of testosterone, and 65 ng/mL of T4. The recovery was investigated by comparing the ratio of the concentration of the spiked sample with the ratio of the non-spiked sample. The accuracy was calculated from the relative bias of the spiked sample.
For comparing the final SALLE protocol with PPT and LLE, both matrix effects and relative peak areas could be evaluated by adding the ISTD after the extractions. In the SALLE and PPT protocols, 100 µL of sample extract was removed from the extraction vial before adding ISTD. In the LLE protocol, as much as 200 µL MTBE solvent extract was evaporated to dryness before adding 100 µL acetonitrile and ISTD. For estimating matrix effects, internal standard peak areas were divided by the average internal standard peak area measured in solutions of ISTD added to 100 µL acetonitrile. The following pipetting steps were applied for the extractions:
  • SALLE:
    150 µL quality control human serum
    25 µL methanol (instead of ISTD)
    100 µL saturated ammonium sulfate
    225 µL ACN
  • PPT:
    150 µL quality control human serum
    25 µL methanol (instead of ISTD)
    325 µL ACN
  • LLE:
    150 µL quality control human serum
    25 µL methanol (instead of ISTD)
    325 µL MTBE

2.7. Data Analysis

Instrumental analysis and data processing was performed by using the MassLynx 4.1 and TargetLynx software (Waters). Peak integration and internal standard calibration were set up in TargetLynx, by using the primary MRM transition of the analytes in conjunction with one internal standard MRM transition, and data was subsequently exported as a text file. Data analysis and presentation were further performed by using Microsoft Office and OriginPro 2021b software (OriginLab Corporation, Northampton, MA, USA). Analyte solubility in various solvents was theoretically predicted by using the HSPiP 5.4.05 software (https://www.hansen-solubility.com/HSPiP (accessed on 4th of April 2023)), which is based on the Hansen solubility parameters [40].

3. Results

3.1. UPLC-MS/MS Instrumental Method

In the mass spectrometer, analytes were ionized and converted into protonated molecular ions by positive electrospray ionization (ESI+) with a capillary voltage of 3 kV. Detection was done by multiple reaction monitoring (MRM) with the transitions previously reported for cortisone, cortisol, and testosterone [41]. A total of three MRM transitions were explored for thyroxine. The one with the highest signal response (777.69 > 731.7) was chosen for the quantification of thyroxine. Optimized MRM transitions for analytes and their internal standards are shown in Table 1.

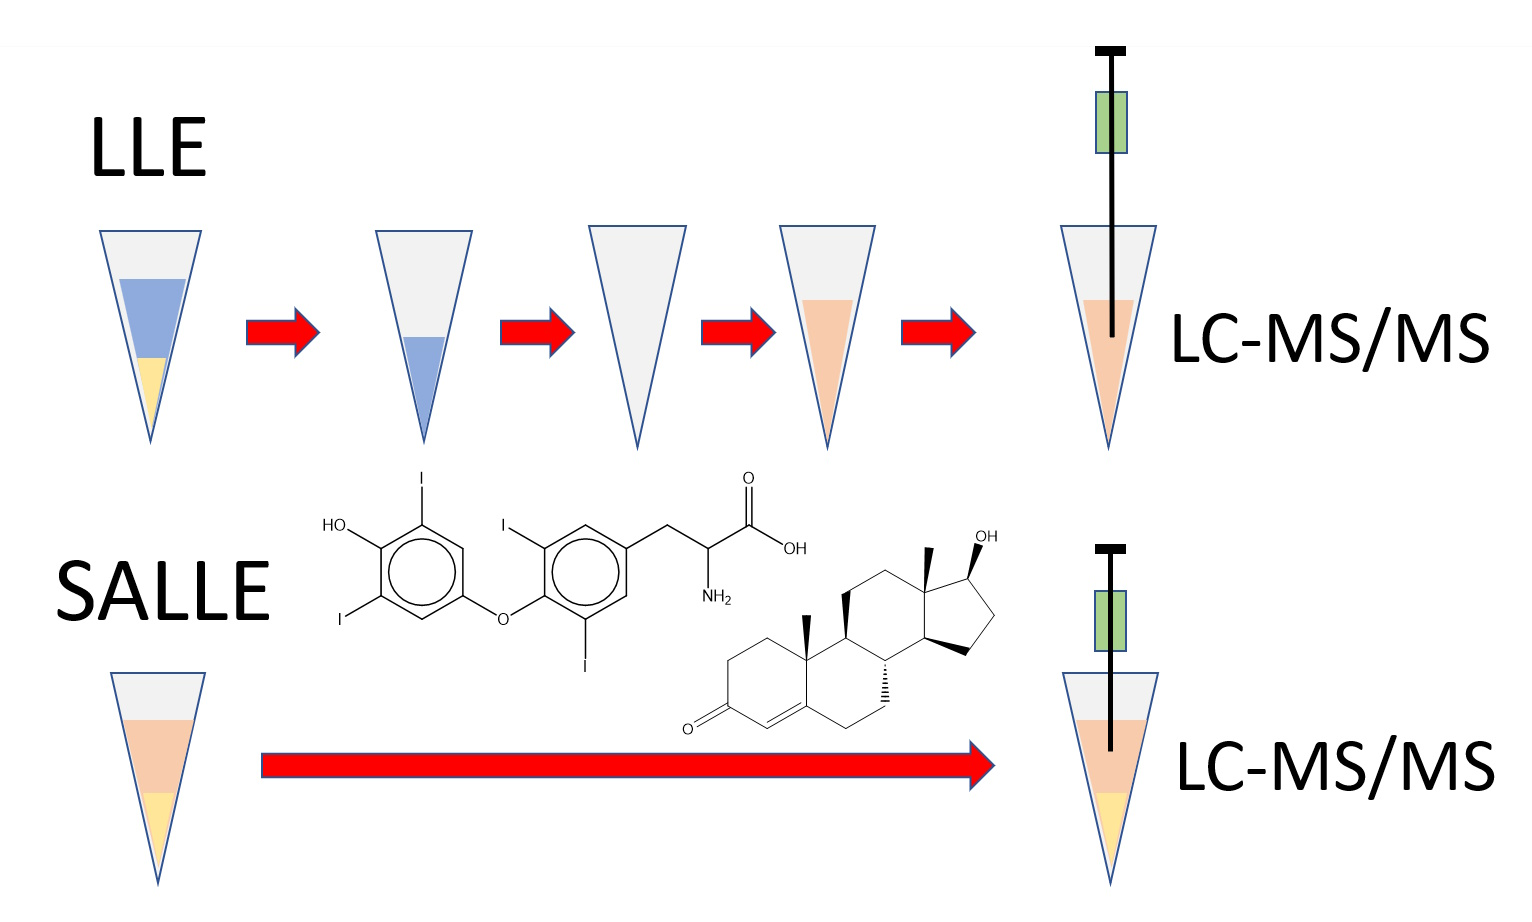
3.2. Exploring Solvents for the SALLE Method

SALLE optimization experiments were conducted by using saturated sodium chloride (NaCl) to assist the phase separation of solvent from the aqueous serum sample. Four different water-soluble organic solvents were tested: Acetonitrile (ACN), acetone, 1-propanol, and 2-propanol. Relative extraction recovery and relative matrix effects were investigated by post-extraction spiking with the internal standard (ISTD) working solution, similar to previously described experiments [37,38]. The amount of acetone was doubled to achieve clear phase separation. In these experiments, 300 µL solvent was added to a vial containing 150 µL of serum and 300 µL saturated NaCl. After the extraction, 100 µL of the solvent top phase was transferred to a new vial and mixed with a small volume (20 µL) of ISTD before the UPLC-MS/MS analysis. Therefore, it was possible to assess the relative extraction recovery by using the peak area ratio of the analyte and internal standard, as this ratio will be proportional to the concentration of analyte in the solvent extract. In the same experiment, information about relative matrix effects was obtained by the peak area of the internal standard, which was inversely proportional to the ion suppression caused by co-extracted matrix components. The highest internal standard peak areas, and hence the lowest ion suppression effects, were observed with ACN as the SALLE solvent (Figure 1A). Except for thyroxine, ACN also produced the highest extraction recoveries in the SALLE experiments (Figure 1B). 2-propanol was the solvent that produced the highest extraction recovery of T4 from the serum sample. ACN was found to be the most suitable solvent for SALLE, due to the observation of the lowest matrix effects combined with overall high extraction recovery for most of the analytes.

3.3. Ammonium Sulphate vs. Sodium Chloride

The phase separation with 300 µL acetonitrile was achieved when adding 300 µL of saturated NaCl to 150 µL of serum, as described above. With saturated (NH4)2SO4, it was possible to obtain a clear top solvent phase, by adding much less salt solution volume, typically in the range of 50–250 µL. The effect of salt concentration was investigated for producing maximum extraction recovery and minimum ion suppression. To 150 µL of serum and 300 µL ACN, the following volumes of saturated (NH4)2SO4 were added: 50, 100, 120, and 150 µL. This corresponded to salt concentrations of 17%, 33%, 40%, and 50% respectively (Figure 2A). Increasing the amount of (NH4)2SO4 resulted in a shrinking of the top solvent phase. Having this fact, slightly increasing the salt concentration from 38% to 42% resulted in the concentrated organic phase and clear phase separation. However, in our previous experiment, we observed that adding high concertation of NaCl increased the volume of the top phase.

3.4. Reducing Solvent Volume

The next goal was to increase the concentration of analyte in the top phase (namely, analyte enrichment) to reach high extraction recovery for improved detectability. Accordingly, the experiment was performed using different volumes of ACN (i.e., 250, 300, 400, 500, and 700 µL), which were added to the vial containing 150 µL of serum sample and before the addition of saturated (NH4)2SO4 (40%). Previous experiments found ACN with (NH4)2SO4 to produce high extraction efficiency and reduced matrix effects. Here, it was found that optimum analyte detectability was achieved when 250 µL of ACN was used (Figure 2B). This resulted in increasing analyte concentration and peak area, without losing signal caused by matrix effects. However, a further reduction in ACN solvent volume could in theory improve analyte detectability even more but was not practical due to the need for solvent removal from the 2 mL vials of a rather wide neck ID. In addition to ACN, a small amount of methanol was added to modify the solvent polarity. This resulted in increased extraction recovery as shown in Figure 2C.

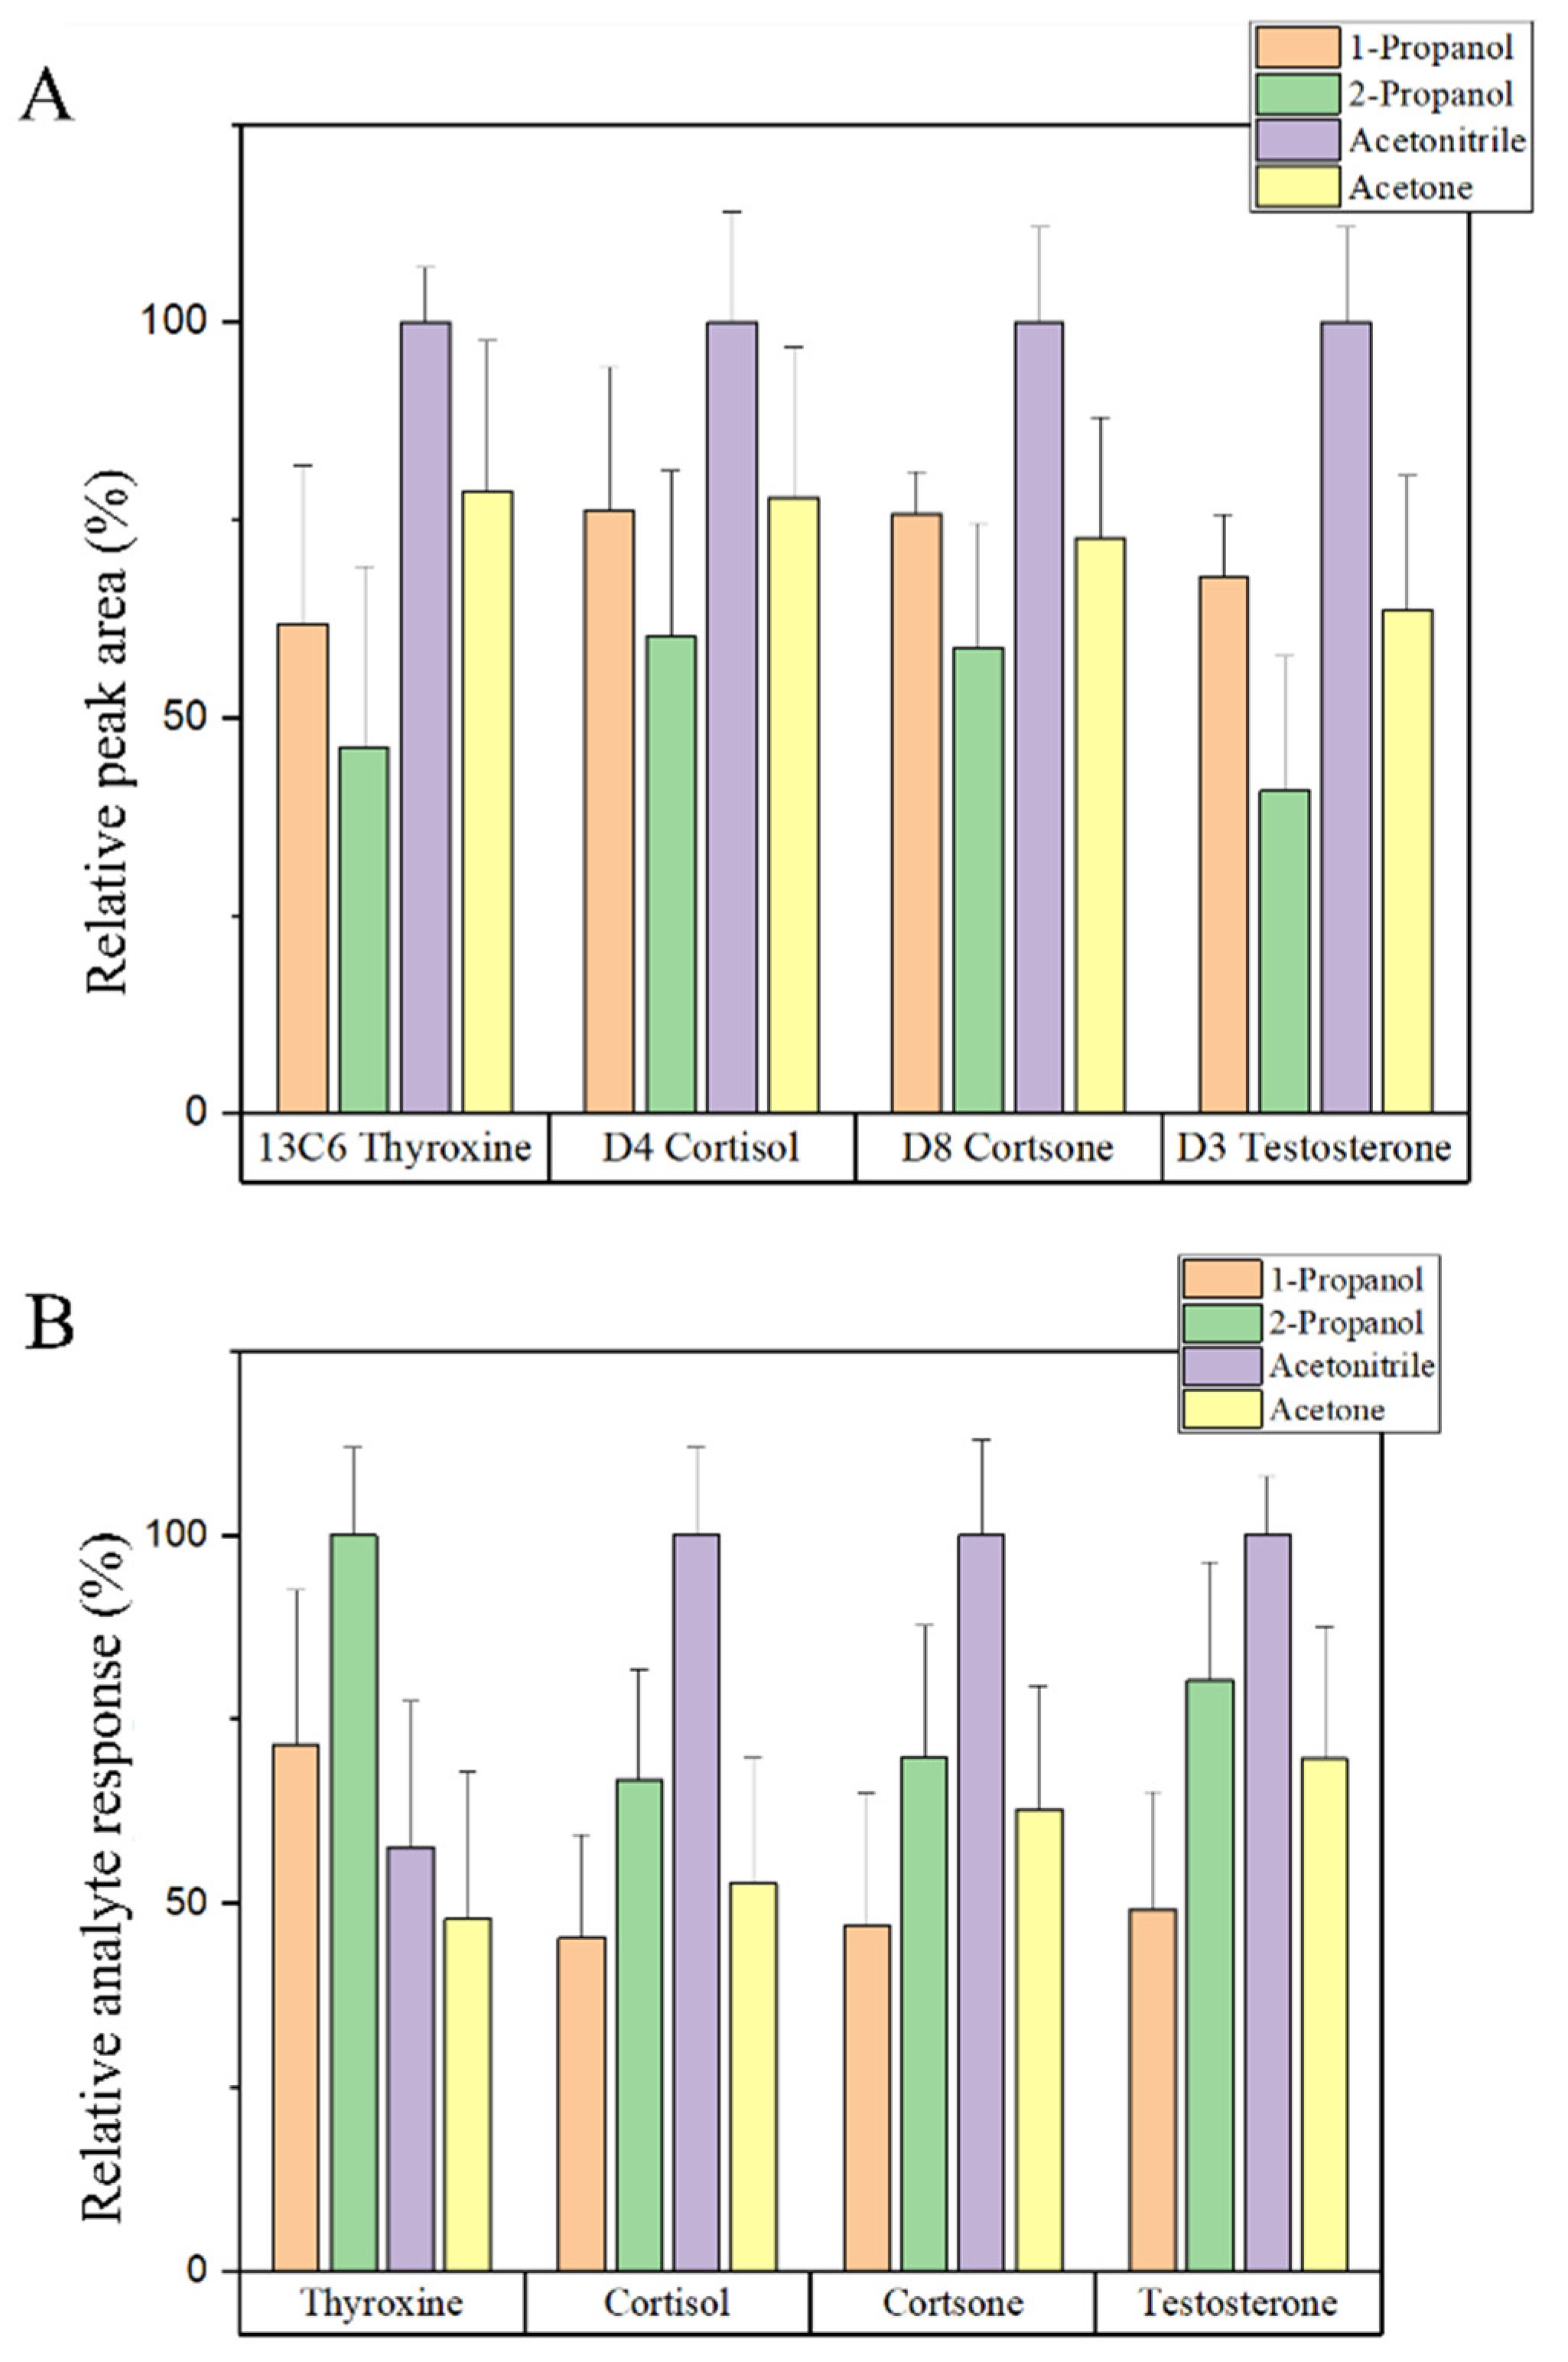
3.5. Method Validation

Results from method validation are shown in Table 2. Both linearity and linear ranges of the method were determined by using the calibration standard solution. Acceptable linearity was observed for all analytes, with coefficients of determination (R2) ranging from 0.997 to 0.999. Recovery testing indicated mostly acceptable bias at different spiking levels. The intra and inter-day variation of the method was evaluated by analyzing ten (n = 10) replicates of quality control (QC) samples. Relative standard deviation (RSD%) was found to be < 15% across all hormones. However, the RSD for cortisol was relatively high (17%) for the intermediate precision. This was caused by a minor interference in the MRM channel for the D4 cortisol internal standard. The LOQs were sufficiently low for the measurement of these hormones in human serum and fish plasma. MRM-chromatograms from the analysis of calibration standard, human serum, and fish plasma are shown in Figure 3. These were all fully processed by the final SALLE protocol. The standard sample (Figure 3A) was prepared with the following analyte concentrations: 10.8 ng/mL testosterone, 25.0 ng/mL thyroxine, 12.0 ng/mL cortisol, and 11.5 ng/mL cortisone. The measured levels in the human serum sample (Figure 3B) were as follows: 5.1 ng/mL testosterone, 82.3 ng/mL thyroxine, 83.0 ng/mL cortisol, and 14.5 ng/mL cortisone. The measured levels in the fish plasma sample (Figure 3C) were as follows: 0.2 ng/mL testosterone, 2.1 ng/mL thyroxine, 98.7 ng/mL cortisol, and 32.9 ng/mL cortisone.
We conducted an experiment to compare the final SALLE protocol with both PPT using acetonitrile and LLE using methyl tert-butyl ether (MTBE). The same amount of isotopically labeled internal standard was added to equal volumes (100 µL) of solvent extracts, which allowed the calculation of matrix effects. Except for thyroxine, the highest internal standard areas were observed for SALLE (Figure 4A). Quite insignificant ion suppression was observed for PPT and LLE, while SALLE appeared to be associated with ion enhancement for detection of cortisol, cortisone, and testosterone. When compared to PPT, both LLE and SALLE produced much higher peak areas for the endogenous hormones extracted from the human serum control sample (Figure 4B). The analyte responses relative to the highest among all extraction methods are directly proportional to the relative extraction recoveries. In this experiment, these were calculated to be: LLE (cortisol 96%, cortisone 97%, testosterone 98%, and thyroxine 7%), PPT (cortisol 39%, cortisone 40%, testosterone 38%, and thyroxine 56%), and SALLE (cortisol 66%, cortisone 71%, testosterone 66%, and thyroxine 97%).

3.6. Measurements in Fish Plasma

The final aim of the study was to evaluate the future application of the validated method for fish plasma samples and to test if it was possible to observe significant differences at the group level. The mean level of cortisol was found to be noticeably higher in fish plasma obtained from net number 2 (Table 3). Cortisone, which is a metabolite of cortisol, was also elevated in fish plasma from the same net. A significantly higher mean level of thyroxine was found in fish plasma from net 1 as compared to net 3. No significant differences were observed in the mean testosterone levels across groups.

4. Discussion

MS detection was with positive electrospray ionization (ESI+), similar to previous studies [19,25,30,42]. MRM transitions were based on the [M+H]+ protonated molecular ion. No significant levels of sodium adducts [M+Na]+ or ammonium adducts [M+NH4]+ were detected for any of the analytes. The LC separation was achieved with 7 min cycle time, including column equilibration. Hence, the current method was suitable for analyzing a relatively large number of samples in a short period of time and had a high throughput in comparison with other approaches [19,29,43,44]. In exploiting the potential of this fast LC separation, steps for a quick and effective sample preparation method were required.
The first and most important parameter to consider when developing the SALLE method is the selection of extraction solvent and salting-out reagent. We conducted a series of post-extraction spiking experiments, where isotopic labeled internal standards were added after the extraction. The relative matrix effects were assessed by the relative peak areas of the isotopic labeled internal standards (Figure 1A). In the same experiments, the peak area ratio of the analyte to the internal standard was recorded (analyte response). Thus, the experiments also produced information about relative analyte responses, which are proportional to relative analyte extraction recoveries (Figure 1B). The combination of these two parameters was originally referred to as process efficiency [37]. We observed the highest extraction recovery into ACN for cortisol, cortisone, and testosterone, while thyroxine was most efficiently extracted into 2-propanol (Figure 1B). Interestingly, this observation correlated with the basic solubility theory of “like dissolves like”. Indeed, the Hansen solubility parameters (HSP) for thyroxine had a better match with 2-propanol than with acetonitrile, especially regarding a rather high hydrogen bonding (Table 4). On the other hand, ACN is low on hydrogen bonding and high on polarity and thus would provide a better overall δP and δH match for cortisol and cortisone. Testosterone is low on both polarity and hydrogen bonding, and therefore its solubility parameters are located somewhat between the two solvents. As observed, ACN was only slightly more efficient than 2-propanol for extracting testosterone.
We found ACN to be the best extraction solvent due to its ability to produce a clear top phase, high extraction recovery for most (Figure 1B), and lowest ion suppression for all hormones (Figure 1A). The serum contains matrix components such as proteins and lipids, including triglycerides and phospholipids. With SALLE, we observed protein partitioning into the bottom aqueous phase and some protein precipitation in the layer between the two phases. A special advantage of using ACN for sample extractions is the fact that triglycerides that are very soluble in non-polar solvents are virtually insoluble in ACN. Furthermore, ACN is known to be a poor solvent for phospholipids in comparison with some other water-miscible solvents such as methanol or ethanol [45]. Phospholipids are common interferences and are often detrimental to the analysis of plasma samples by LC-MS [30]. In the present work, ACN was yet again found to be a good solvent for SALLE, similar to previous findings [31,32,38]. Additionally, its low boiling point, low viscosity, low toxicity, and effective deproteinization has made ACN a popular general-purpose solvent for LC-MS/MS work [35,46]. The selection of a suitable salt for phase separation is another important issue for the application of SALLE. In this study, the efficiency of (NH4)2SO4 was high both in terms of phase separation and prevention of emulsions, when compared with NaCl. This may be due to (NH4)2SO4 having a high solubility in water and thus increasing ionic strength [46]. The SALLE method with ACN as extraction solvent and (NH4)2SO4 as salting-out reagent was, therefore, further optimized in terms of salt concentration, the volume of organic solvent, and the addition of methanol. Methanol was added to increase the extractability of analytes. In our study, it was found that 10% methanol could be added to the ACN for providing a satisfactory high extraction recovery while keeping ion suppression at a minimum. In contrast, Li et al. [31] reported that the addition of 10% methanol to ACN resulted in ion suppression when compared to ACN alone. However, in their work, the salt added was ammonium acetate and not (NH4)2SO4 as in the present work. Further fine-tuning of the SALLE method by decreasing solvent volume resulted in enhanced analyte detectability. An ACN volume of only 250 µL resulted in a very concentrated top phase and provided a practical minimum volume for manual removal of the solvent or direct injection in the UPLC-MS/MS. The optimum extraction efficiency was achieved when 40% of saturated (NH4)2SO4 (i.e 100 µL of salt solution) and 250 µL of ACN were added. At a lower salt concentration, the water started entering the top phase.
The optimized SALLE method for UPLC-MS/MS analysis was validated according to the Eurachem guideline. This showed high linearity (R2 > 0.997) for all hormones. The LOD and LOQ also showed that the method is sensitive enough to detect and quantify hormones in small concentrations. The LODs for testosterone and cortisol were comparable with the LODs previously reported [26,30].
The comparison of SALLE with PPT and LLE revealed very high peak areas for all hormones extracted by the new method (Figure 4B). Interestingly, the extraction of thyroxine from serum by using LLE resulted in a very low peak area. Such a low extraction recovery was likely due to the poor solubility of thyroxine in the non-polar MTBE, as evidenced by the large difference in δH between thyroxine and MTBE (Table 4). Clearly, thyroxine is extracted more efficiently by SALLE, where the extraction solvent is ACN. Although ACN is more polar than MTBE, this observation could not be fully explained by comparison of HSPs, because the difference in solubility between thyroxine and ACN still seems to be quite large (Table 4). However, thyroxine has three ionizable functional groups which will make its solubility somewhat more difficult to predict. Theoretical enrichment factors across the extraction experiments were as follows: 44% (SALLE), 20% (PPT), and 62% (LLE). Except for thyroxine, these theoretical enrichment factors correlated with the average relative extraction recoveries, as shown by linear correlation coefficients and significance levels: Cortisol (r = 0.995, p = 0.064), cortisone (r = 0.999, p = 0.014), and testosterone (r = 0.992, p = 0.079). Based on theoretical enrichment factors, and the observed relative extraction recoveries, it was expected that peak areas would in fact be higher for LLE than for SALLE. Interestingly, a rather high degree of ion enhancement was observed for the extraction of cortisol, cortisone, and testosterone by SALLE (Figure 4A). This caused peak areas to be more comparable for SALLE and LLE, when extracting these steroid hormones from the human serum sample (Figure 4B).
The new method was applied to Atlantic salmon plasma samples. Significantly elevated mean plasma levels of cortisol and cortisone indicated a higher stress level in fish from net 2. In lack of in-house established normal reference ranges, we compared this elevated cortisol level of 89.2 ± 7.9 ng/mL with findings of other studies. In one previous report, the baseline levels of cortisol in the plasma of Atlantic salmon were found to be below 50 ng/mL [47]. Furthermore, it has been shown that cortisol elevations in fish plasma in response to acute stressors can range from 30 to 300 ng/mL [7]. The reason behind the increased level in net 2 is unknown, as no different care was given to fish at that site. It is known that greater cortisol levels can be found after brief handling, as shown in rainbow trout. Anadromous salmonid fishes, for example, appear to be especially sensitive to certain stressors, particularly physical disturbances [7]. At present we can only hypothesize that the stress was caused by handling and/or transportation, such as an extended time for the live fish kept in the tank during transportation from sea to the central barge. The routine health monitoring of these fish did not reveal any differences between the nets. However, it will be important to follow up on similar stress events in the future, as they could lead to decreased immune competence and be a sign of impaired health of the fish [48]. In future work, it will also be interesting to study the correlation with cortisol measurements in alternative sample materials, such as fish feces [49].
Our new method is about to be implemented for future medical research at Stavanger University Hospital in Norway. Here, the preliminary investigations from the analysis of 29 human serum samples have shown low relative mean bias for cortisol (7%) and testosterone (−3%) in comparison with other laboratories participating in the same quality control program. We are planning to expand the current SALLE method to include more steroid hormones for measurement in human serum samples and to report data on their method validation.

5. Conclusions

SALLE was optimized for thyroxine and steroid hormone measurement and was performed simply by mixing human serum or fish plasma with internal standard, saturated ammonium sulfate, and acetonitrile. After shaking and centrifugation, the solvent extract was injected directly into the UPLC-MS/MS instrument. The new method was briefly validated and applied for measurement in fish plasma. It enabled the discovery of significant differences in hormone levels across fish net cages and indicated a higher stress level in one net. By including many steroid hormones of clinical interest and by using robot pipetting into microplates, we believe SALLE can become a useful tool for endocrinology research in clinical laboratories.

Author Contributions

Conceptualization, A.Y.U., D.M.P., M.E.M., D.L.K. and C.B.; methodology, A.Y.U., D.M.P., M.E.M., D.L.K. and C.B.; validation, A.Y.U., D.M.P., M.E.M., D.L.K. and C.B.; formal analysis, A.Y.U. and C.B.; investigation, A.Y.U., D.M.P., D.L.K. and C.B.; resources, A.Y.U., D.M.P., M.E.M., D.L.K. and C.B.; data curation, A.Y.U., D.M.P., D.L.K. and C.B.; writing—original draft preparation, A.Y.U., D.M.P. and C.B.; writing—review and editing, A.Y.U., D.M.P., M.E.M., D.L.K. and C.B.; visualization, A.Y.U. and C.B.; supervision, D.M.P., M.E.M., D.L.K. and C.B.; project administration, D.M.P., D.L.K. and C.B. All authors have read and agreed to the published version of the manuscript.

Funding

This research received no external funding.

Institutional Review Board Statement

Not applicable.

Informed Consent Statement

Not applicable.

Data Availability Statement

Not applicable.

Acknowledgments

The authors would like to thank Trude A. Sandvik and Asgeir Husa at Fürst Medisinsk Laboratorium AS, as well as Christian Thorstensen at Oslo University Hospital, for their kind donations of instruments.

Conflicts of Interest

The authors declare no conflict of interest.

References

  1. Russell, G.; Lightman, S. The Human Stress Response. Nat. Rev. Endocrinol. 2019, 15, 525–534. [Google Scholar] [CrossRef] [Green Version]
  2. Liyanarachchi, K.; Ross, R.; Debono, M. Human Studies on Hypothalamo-Pituitary-Adrenal (HPA) Axis. Best Pract. Res. Clin. Endocrinol. Metab. 2017, 31, 459–473. [Google Scholar] [CrossRef] [PubMed]
  3. Carbajal, A.; Reyes-López, F.E.; Tallo-Parra, O.; Lopez-Bejar, M.; Tort, L. Comparative Assessment of Cortisol in Plasma, Skin Mucus and Scales as a Measure of the Hypothalamic-Pituitary-Interrenal Axis Activity in Fish. Aquaculture 2019, 506, 410–416. [Google Scholar] [CrossRef]
  4. Sadoul, B.; Geffroy, B. Measuring Cortisol, the Major Stress Hormone in Fishes. J. Fish Biol. 2019, 94, 540–555. [Google Scholar] [CrossRef] [PubMed] [Green Version]
  5. Mommsen, T.P.; Vijayan, M.M.; Moon, T.W. Cortisol in Teleosts: Dynamics, Mechanisms of Action, and Metabolic Regulation. Rev. Fish Biol. Fish. 1999, 9, 211–268. [Google Scholar] [CrossRef]
  6. Cabrera-Busto, J.; Mancera, J.M.; Ruiz-Jarabo, I. Cortisol and Dexamethasone Mediate Glucocorticoid Actions in the Lesser Spotted Catshark (Scyliorhinus canicula). Biology 2022, 11, 56. [Google Scholar] [CrossRef]
  7. Barton, B.A. Stress in Fishes: A Diversity of Responses with Particular Reference to Changes in Circulating Corticosteroids. Integr. Comp. Biol. 2002, 42, 517–525. [Google Scholar] [CrossRef]
  8. Ciani, E.; von Krogh, K.; Nourizadeh-Lillabadi, R.; Mayer, I.; Fontaine, R.; Weltzien, F.-A. Sexual Maturation in Atlantic Salmon Male Parr May Be Triggered Both in Late Summer and Early Spring under Standard Farming Conditions. Aquaculture 2021, 544, 737086. [Google Scholar] [CrossRef]
  9. Blanton, M.L.; Specker, J.L. The Hypothalamic-Pituitary-Thyroid (HPT) Axis in Fish and Its Role in Fish Development and Reproduction. Crit. Rev. Toxicol. 2007, 37, 97–115. [Google Scholar] [CrossRef]
  10. Deal, C.K.; Volkoff, H. The Role of the Thyroid Axis in Fish. Front. Endocrinol. 2020, 11, 596585. [Google Scholar] [CrossRef]
  11. Ortiga-Carvalho, T.M.; Chiamolera, M.I.; Pazos-Moura, C.C.; Wondisford, F.E. Hypothalamus-Pituitary-Thyroid Axis. In Comprehensive Physiology; John Wiley and Sons, Ltd.: Hoboken, NJ, USA, 2016; pp. 1387–1428. ISBN 978-0-470-65071-4. [Google Scholar]
  12. Chen, X.; Walter, K.M.; Miller, G.W.; Lein, P.J.; Puschner, B. Simultaneous Quantification of T4, T3, RT3, 3,5-T2 and 3,3′-T2 in Larval Zebrafish (Danio rerio) as a Model to Study Exposure to Polychlorinated Biphenyls. Biomed. Chromatogr. 2018, 32, e4185. [Google Scholar] [CrossRef] [Green Version]
  13. Peter, M.C.S. The Role of Thyroid Hormones in Stress Response of Fish. Gen. Comp. Endocrinol. 2011, 172, 198–210. [Google Scholar] [CrossRef]
  14. Deal, C.K.; Volkoff, H. Response of the Thyroid Axis and Appetite-Regulating Peptides to Fasting and Overfeeding in Goldfish (Carassius auratus). Mol. Cell. Endocrinol. 2021, 528, 111229. [Google Scholar] [CrossRef]
  15. Cao, Y.; Tveten, A.-K.; Stene, A. Establishment of a Non-Invasive Method for Stress Evaluation in Farmed Salmon Based on Direct Fecal Corticoid Metabolites Measurement. Fish Shellfish Immunol. 2017, 66, 317–324. [Google Scholar] [CrossRef] [Green Version]
  16. Taylor, A.E.; Keevil, B.; Huhtaniemi, I.T. Mass Spectrometry and Immunoassay: How to Measure Steroid Hormones Today and Tomorrow. Eur. J. Endocrinol. 2015, 173, D1–D12. [Google Scholar] [CrossRef] [Green Version]
  17. Karashima, S.; Osaka, I. Rapidity and Precision of Steroid Hormone Measurement. J. Clin. Med. 2022, 11, 956. [Google Scholar] [CrossRef]
  18. Hillebrand, J.J.; Wickenhagen, W.V.; Heijboer, A.C. Improving Science by Overcoming Laboratory Pitfalls With Hormone Measurements. J. Clin. Endocrinol. Metab. 2021, 106, e1504–e1512. [Google Scholar] [CrossRef]
  19. Noyes, P.D.; Lema, S.C.; Roberts, S.C.; Cooper, E.M.; Stapleton, H.M. Rapid Method for the Measurement of Circulating Thyroid Hormones in Low Volumes of Teleost Fish Plasma by LC-ESI/MS/MS. Anal. Bioanal. Chem. 2014, 406, 715–726. [Google Scholar] [CrossRef] [Green Version]
  20. Ghazal, K.; Brabant, S.; Prie, D.; Piketty, M.-L. Hormone Immunoassay Interference: A 2021 Update. Ann. Lab. Med. 2022, 42, 3–23. [Google Scholar] [CrossRef]
  21. Hoofnagle, A.N.; Wener, M.H. The Fundamental Flaws of Immunoassays and Potential Solutions Using Tandem Mass Spectrometry. J. Immunol. Methods 2009, 347, 3–11. [Google Scholar] [CrossRef] [Green Version]
  22. Shi, J.; Bird, R.; Schmeling, M.W.; Hoofnagle, A.N. Using Mass Spectrometry to Overcome the Longstanding Inaccuracy of a Commercially-Available Clinical Testosterone Immunoassay. J. Chromatogr. B 2021, 1183, 122969. [Google Scholar] [CrossRef] [PubMed]
  23. Braunstein, G.D. Spurious Serum Hormone Immunoassay Results: Causes, Recognition, Management. touchREV. Endocrinol. 2022, 18, 141–147. [Google Scholar] [CrossRef]
  24. Blackwell, B.R.; Ankley, G.T. Simultaneous Determination of a Suite of Endogenous Steroids by LC-APPI-MS: Application to the Identification of Endocrine Disruptors in Aquatic Toxicology. J. Chromatogr. B 2021, 1163, 122513. [Google Scholar] [CrossRef] [PubMed]
  25. Hansen, M.; Luong, X.; Sedlak, D.L.; Helbing, C.C.; Hayes, T. Quantification of 11 Thyroid Hormones and Associated Metabolites in Blood Using Isotope-Dilution Liquid Chromatography Tandem Mass Spectrometry. Anal. Bioanal. Chem. 2016, 408, 5429–5442. [Google Scholar] [CrossRef] [PubMed]
  26. Nouri, M.-Z.; Kroll, K.J.; Webb, M.; Denslow, N.D. Quantification of Steroid Hormones in Low Volume Plasma and Tissue Homogenates of Fish Using LC-MS/MS. Gen. Comp. Endocrinol. 2020, 296, 113543. [Google Scholar] [CrossRef]
  27. Moein, M.M.; El Beqqali, A.; Abdel-Rehim, M. Bioanalytical Method Development and Validation: Critical Concepts and Strategies. J. Chromatogr. B 2017, 1043, 3–11. [Google Scholar] [CrossRef]
  28. Budzinski, H.; Devier, M.H.; Labadie, P.; Togola, A. Analysis of Hormonal Steroids in Fish Plasma and Bile by Coupling Solid-Phase Extraction to GC/MS. Anal. Bioanal. Chem. 2006, 386, 1429–1439. [Google Scholar] [CrossRef]
  29. Domenech-Coca, C.; Mariné-Casadó, R.; Caimari, A.; Arola, L.; del Bas, J.M.; Bladé, C.; Rodriguez-Naranjo, M.I. Dual Liquid-Liquid Extraction Followed by LC-MS/MS Method for the Simultaneous Quantification of Melatonin, Cortisol, Triiodothyronine, Thyroxine and Testosterone Levels in Serum: Applications to a Photoperiod Study in Rats. J. Chromatogr. B 2019, 1108, 11–16. [Google Scholar] [CrossRef]
  30. Woźniak, B.; Matraszek-Żuchowska, I.; Witek, S.; Posyniak, A. Development of LC-MS/MS Confirmatory Method for the Determination of Testosterone in Bovine Serum. J. Vet. Res. 2017, 61, 81–89. [Google Scholar] [CrossRef] [Green Version]
  31. Li, M.; Wang, H.; Huan, X.; Cao, N.; Guan, H.; Zhang, H.; Cheng, X.; Wang, C. Simultaneous LC-MS/MS Bioanalysis of Alkaloids, Terpenoids, and Flavonoids in Rat Plasma through Salting-out-Assisted Liquid-Liquid Extraction after Oral Administration of Extract from Tetradium ruticarpum and Glycyrrhiza uralensis: A Sample Preparation Strategy to Broaden Analyte Coverage of Herbal Medicines. Anal. Bioanal. Chem. 2021, 413, 5871–5884. [Google Scholar] [CrossRef]
  32. Li, M.; Zhuang, B.; Lu, Y.; An, L.; Wang, Z.-G. Salt-Induced Liquid–Liquid Phase Separation: Combined Experimental and Theoretical Investigation of Water–Acetonitrile–Salt Mixtures. J. Am. Chem. Soc. 2021, 143, 773–784. [Google Scholar] [CrossRef]
  33. Tang, Y.Q.; Weng, N. Salting-out Assisted Liquid-Liquid Extraction for Bioanalysis. Bioanalysis 2013, 5, 1583–1598. [Google Scholar] [CrossRef]
  34. Valente, I.M.; Gonçalves, L.M.; Rodrigues, J.A. Another Glimpse over the Salting-out Assisted Liquid–Liquid Extraction in Acetonitrile/Water Mixtures. J. Chromatogr. A 2013, 1308, 58–62. [Google Scholar] [CrossRef]
  35. Zhang, J.; Wu, H.; Kim, E.; El-Shourbagy, T.A. Salting-out Assisted Liquid/Liquid Extraction with Acetonitrile: A New High Throughput Sample Preparation Technique for Good Laboratory Practice Bioanalysis Using Liquid Chromatography–Mass Spectrometry. Biomed. Chromatogr. 2009, 23, 419–425. [Google Scholar] [CrossRef]
  36. Wang, H.; Zhou, X.; Zhang, Y.; Chen, H.; Li, G.; Xu, Y.; Zhao, Q.; Song, W.; Jin, H.; Ding, L. Dynamic Microwave-Assisted Extraction Coupled with Salting-out Liquid-Liquid Extraction for Determination of Steroid Hormones in Fish Tissues. J. Agric. Food Chem. 2012, 60, 10343–10351. [Google Scholar] [CrossRef]
  37. Buhrman, D.L.; Price, P.I.; Rudewicz, P.J. Quantitation of SR 27417 in Human Plasma Using Electrospray Liquid Chromatography-Tandem Mass Spectrometry: A Study of Ion Suppression. J. Am. Soc. Mass Spectrom. 1996, 7, 1099–1105. [Google Scholar] [CrossRef] [Green Version]
  38. Kvamsøe, M.M.; Hansen, K.R.; Skadberg, Ø.; Vethe, N.T.; Brede, C. Salting Out-Assisted Liquid–Liquid Extraction for Liquid Chromatography–Tandem Mass Spectrometry Measurement of Tacrolimus, Sirolimus, Everolimus, and Cyclosporine a in Whole Blood. Ther. Drug Monit. 2020, 42, 695–701. [Google Scholar] [CrossRef]
  39. Magnusson, B.; Örnemark, U. Eurachem Guide: The Fitness for Purpose of Analytical Methods—A Laboratory Guide to Method Validation and Related Topics, 2nd ed.; Eurachem: Gembloux, Belgium, 2014; ISBN 978-91-87461-59-0. [Google Scholar]
  40. Hansen, C.M. Hansen Solubility Parameters—A User’s Handbook, 2nd ed.; CRC Press: Boca Raton, FL, USA, 2007; ISBN 978-0-429-12752-6. [Google Scholar]
  41. Nadarajah, N.; Skadberg, Ø.; Adaway, J.; Brede, C. Multiplexed Analysis of Steroid Hormones in Saliva by LC-MS/MS with 2-Hydrazinopyridine Derivatization. Clin. Mass Spectrom. 2017, 4–5, 1–10. [Google Scholar] [CrossRef]
  42. Boggs, A.S.P.; Bowden, J.A.; Galligan, T.M.; Guillette, L.J.; Kucklick, J.R. Development of a Multi-Class Steroid Hormone Screening Method Using Liquid Chromatography/Tandem Mass Spectrometry (LC-MS/MS). Anal. Bioanal. Chem. 2016, 408, 4179–4190. [Google Scholar] [CrossRef] [Green Version]
  43. Ke, Y.; Bertin, J.; Gonthier, R.; Simard, J.-N.; Labrie, F. A Sensitive, Simple and Robust LC–MS/MS Method for the Simultaneous Quantification of Seven Androgen- and Estrogen-Related Steroids in Postmenopausal Serum. J. Steroid Biochem. Mol. Biol. 2014, 144, 523–534. [Google Scholar] [CrossRef]
  44. Yong, S.; Chen, Y.; Lee, T.K.; Lee, H.K. Determination of Total Thyroxine in Human Serum by Hollow Fiber Liquid-Phase Microextraction and Liquid Chromatography–Tandem Mass Spectrometry. Talanta 2014, 126, 163–169. [Google Scholar] [CrossRef] [PubMed]
  45. Alzweiri, M.; Watson, D.G.; Robertson, C.; Sills, G.J.; Parkinson, J.A. Comparison of Different Water-Miscible Solvents for the Preparation of Plasma and Urine Samples in Metabolic Profiling Studies. Talanta 2008, 74, 1060–1065. [Google Scholar] [CrossRef] [PubMed] [Green Version]
  46. Jafari, S.A.; Entezari, M.H. Salting out in ACN/Water Systems: Hofmeister Effects and Partition of Quercetin. J. Mol. Liq. 2020, 312, 113331. [Google Scholar] [CrossRef]
  47. Jutfelt, F.; Olsen, R.E.; Björnsson, B.T.; Sundell, K. Parr–Smolt Transformation and Dietary Vegetable Lipids Affect Intestinal Nutrient Uptake, Barrier Function and Plasma Cortisol Levels in Atlantic Salmon. Aquaculture 2007, 273, 298–311. [Google Scholar] [CrossRef]
  48. Barton, B.A.; Iwama, G.K. Physiological Changes in Fish from Stress in Aquaculture with Emphasis on the Response and Effects of Corticosteroids. Annu. Rev. Fish Dis. 1991, 1, 3–26. [Google Scholar] [CrossRef]
  49. Meling, V.A.; Berge, K.; Knudsen, D.L.; Rønning, P.O.; Brede, C. Monitoring Farmed Fish Welfare by Measurement of Cortisol as a Stress Marker in Fish Feces by Liquid Chromatography Coupled with Tandem Mass Spectrometry. Molecules 2022, 27, 2481. [Google Scholar] [CrossRef]
Figure 1. Results from post-extraction spiking experiments revealing the effect of using different solvents. Relative internal standard peak areas (A) show the relative degrees of matrix effects causing ion suppression noticed by peak area reduction. Relative analyte response (B) is the relative peak area ratio (analyte/internal standard) and is directly proportional to relative extraction recovery. Data are reported as mean + standard deviation, n = 3.
Separations 10 00240 g001
Figure 2. Effect of different optimization parameters on the SALLE extraction recovery as measured by peak area response (n = 3 for all). (A) The effect of saturated ammonium sulfate solution when added to different concentrations, (B) the effect of acetonitrile (ACN) volume, and (C) the effect of methanol concentration in the acetonitrile.
Separations 10 00240 g002
Figure 3. MRM-chromatograms in the order of top to bottom of testosterone, thyroxine, cortisol, cortisone, and isotopically labeled internal standards combined. (A) standard sample containing: 10.8 ng/mL testosterone, 25.0 ng/mL thyroxine, 12.0 ng/mL cortisol, and 11.5 ng/mL cortisone. (B) human serum containing: 5.1 ng/mL testosterone, 82.3 ng/mL thyroxine, 83.0 ng/mL cortisol, and 14.5 ng/mL cortisone. (C) fish plasma containing: 0.2 ng/mL testosterone, 2.1 ng/mL thyroxine, 98.7 ng/mL cortisol, and 32.9 ng/mL cortisone.
Separations 10 00240 g003
Figure 4. Comparison of the final SALLE protocol with both LLE using MTBE and PPT using ACN, for the extraction of thyroxine and steroid hormones from a human serum control sample. (A) shows matrix effects (%) relative to measurement in pure acetonitrile and (B) shows average peak area (%) relative to the highest peak area among all the extraction methods. Data are reported as mean + standard deviation, n = 4.
Separations 10 00240 g004
Table 1. Optimized multiple reaction monitoring (MRM) transitions (parent ion to daughter ion), dwell times, cone voltage, collision energy (CE), and retention times for detection and quantification of analytes and isotopic labeled internal standards.
Compound NameMolecule Mass (Da)Parent ion (m/z)Daughter
Ion (m/z)
Dwell Time (s)Cone Voltage (V)CE
(eV)
Retention
Time (min)
Cortisol362.21363.2121.10.01533232.87
D4 Cortisol 367.2121.10.01533232.87
Cortisone360.19361.2163.10.01538252.7
D8 Cortisone 369.21690.01538252.7
Testosterone288.21289.397.10.01533203.63
D3Testosterone 292.297.10.01533203.63
Thyroxine776.87777.69731.70.01545253.2
777.69604.90.01545403.2
777.693510.01545453.2
13C6 thyroxine 783.69737.70.01545253.2
Table 2. Precision is expressed by the relative standard deviation (RSD %), relative bias (%), the limit of detection (LOD), the limit of quantification (LOQ), linearity, and linear range.
ParametersThyroxineCortisolCortisoneTestosterone
Precision
(RSD %)
Repeatability13141413
Intermediate 13171413
Relative bias (%)low761279696
medium92558190
high957587102
LOD (ng/mL)0.040.020.070.01
LOQ (ng/mL)0.180.150.120.08
Linearity (R2)0.997–0.9990.998–0.9990.998–0.9990.999
Liner range (ng/mL)0.18–2000.15–1000.12–1000.08–100
Table 3. The mean value of total thyroxine, cortisol, cortisone, and testosterone in the fish plasma samples from three different nets. Results are reported as mean + standard error (SE).
Mean + SE (ng/mL)
NnThyroxineCortisolCortisoneTestosterone
Net 1932.28 + 0.38 a14.1 + 1.8 b13.8 + 1.1 a0.32 + 0.04 a
Net 2 931.79 + 0.25 ab89.2 + 7.9 a32.9 + 0.7 b0.28 + 0.04 a
Net 3931.23 + 0.19 b21.1 + 2.2 b18.5 + 1.4 c0.32 + 0.04 a
Note: N = number of samples from each net, n = number of replicates. For each analyte in the same column, two mean values are significantly different (p < 0.05) between nets when they have different superscripts (a–c).
Table 4. Hansen solubility parameters for solvents and hormones [40].
Hansen Solubility Parameters
SubstanceδD (Dispersion)δP (Polarity)δH (Hydrogen Bonding)
Thyroxine
Testosterone
23.4
18.6
5.2
5.4
13.5
6.2
Cortisol
Cortisone
19.2
19.7
10.1
11.8
9.2
7.8
Acetonitrile15.3186.1
Methanol14.712.322.3
Acetone15.510.47
1-propanol166.817.4
2-propanol15.86.116.4
MTBE14.84.35
Disclaimer/Publisher’s Note: The statements, opinions and data contained in all publications are solely those of the individual author(s) and contributor(s) and not of MDPI and/or the editor(s). MDPI and/or the editor(s) disclaim responsibility for any injury to people or property resulting from any ideas, methods, instructions or products referred to in the content.

