Article

Analysis of Sugars in Honey Samples by Capillary Zone Electrophoresis Using Fluorescence Detection

Department of Inorganic and Analytical Chemistry, University of Debrecen, Egyetem ter 1., H-4032 Debrecen, Hungary
*
Author to whom correspondence should be addressed.
Separations 2023, 10(3), 150; https://doi.org/10.3390/separations10030150
Submission received: 7 February 2023 / Revised: 15 February 2023 / Accepted: 19 February 2023 / Published: 23 February 2023

Abstract

:
The applicability of capillary electrophoresis (CE) with light-emitting diode-induced fluorescence detection (LEDIF) for the separation of sugars in honey samples was studied. An amount of 25 mM ammonium acetate (pH 4.5) with 0.3% polyethylene oxide (PEO) was found to be optimal for the efficient separation of carbohydrates. 8-aminopyrene-1,3,6-trisulfonic acid (APTS) was used for the labeling of the carbohydrate standards and honey sugars for fluorescence detection. The optimized method was applied in the quantitative analysis of fructose and glucose by direct injection of honey samples. Apart from the labeling reaction, no other sample preparation was performed. The mean values of the fructose/glucose ratio for phacelia honey, acacia honey and honeydew honey were 0.86, 1.61 and 1.42, respectively. The proposed method provides high separation efficiency and sensitive detection within a short analysis time. Apart from the labeling reaction, it enables the injection of honeys without sample pretreatment. This is the first time that fluorescence detection has been applied for the CE analysis of sugars in honeys.

Graphical Abstract

1. Introduction

Honey is a natural, aqueous, supersaturated sugar substance produced by honeybees. It also contains other minor substances, such as minerals, enzymes, vitamins, organic acids, amino acids, flavonoids and phenolic acids. Honey is used as a nutritional product, but it can also exert several health-benefitting effects. The main components of honey are carbohydrates, representing around 85–97% of its weight. A significant part is made up of mainly fructose and glucose. Small amounts of other monosaccharides (galactose, mannose), disaccharides (maltose, sucrose, beta-trehalose) and oligosaccharides (melezitose, maltotriose, panose, erlose, isomaltotriose, theanderose) are present in honey [1,2].
The determination of sugars is a common approach for describing the quality of honey. The principle of classical chemical methods for the analysis of carbohydrates is based on the fact that reducing sugars (non-reducing carbohydrates can become reducing via hydrolyzation) react with other compounds to form precipitates or colored complexes, which can be determined by titration, gravimetric and spectrophotometric techniques [3,4]. The main disadvantages of the classical chemical methods are that carefully controlled, time consuming reaction parameters must be provided.
Separation techniques are the most powerful methods for the identification and quantification of carbohydrates, of which chromatographic methods, especially normal phase [5], anion-exchange [6], and hydrophilic interaction [7] high-performance liquid chromatography have been employed. A refractive index detector is commonly used in chromatographic analysis of sugars [8,9,10].
Capillary electrophoresis (CE) has emerged as an alternative tool for the analysis of carbohydrates. It provides high separation efficiency within a short analysis time, and low sample volume consumption. CE allows for the direct injection of real samples without any pretreatment. On the other hand, carbohydrate analysis by CE is quite challenging in terms of separation and detection. Most carbohydrates have no charge or absorbing chromophores in the UV-VIS regions. In recent years, different strategies have been developed to overcome these limitations [11,12,13]. The use of borate buffers with direct UV detection is the simplest way to analyze carbohydrates. Borate forms complexes with the vicinal hydroxyl groups of sugars, converting them into anions. This complex shows increased UV sensitivity at 191–195 nm [14]. The detection of carbohydrate-borate complexes can also be carried out using electrochemical methods (amperometric, contactless conductivity) [15]. Another possibility for making carbohydrates amenable to CE analysis is the use of strong alkaline background electrolytes (BGEs). Using a BGE with a pH above the pKa of the sugars ensures that their hydroxyl groups are dissociated; hence, sugars can migrate as anions in capillary zone electrophoresis (CZE) [16]. Different detection modes can be applied, such as indirect UV [17], fluorescence detection [18], electrochemical detection [19], and mass spectrometry (MS) [20]. The main merit of the indirect UV mode is that no time-consuming derivatization procedure is required; however, the limit of detection (LOD) is weaker than that of fluorescence detection. The laser-induced fluorescence (LIF) or LEDIF detection mode can ensure high sensitivity. The most frequent fluorescent labeling reaction is reductive amination [21]. There are several types of labeling reagents (8-aminopyrene-1,3,6-trisulfonic acid (APTS), 8-aminonaphthalene-1,3,6-trisulfonic acid (ANTS), aminonaphthalene-2-sulfonic acid (ANA), and 4-amino-5-hydroxynaphthalene-2,7-disulfonic acid (AHNS)) that can be used depending on the excitation and emission wavelengths [22]. APTS is a popular derivatizing agent because it can be excited with the commonly used argon-ion laser set at 488 nm and emitting at 520 nm. Furthermore, it adds three negative charges to the molecule, allowing for the possibility of CZE separation [23,24,25].
There are many examples of CE-based honey analysis in the literature, but very few of them deal with the determination of sugars. Indirect CE–UV was used by Rizelio et al. for the determination of fructose, glucose and sucrose in seven multifloral honey samples using 20 mM sorbic acid, 0.2 mM cetyltrimethylammonium bromide (CTAB) and 40 mM sodium hydroxide (NaOH) at pH 12.2. The detection limits for the three analytes were in the range of 0.022 to 0.029 g/L [26]. The drawbacks of indirect CE-UV are that the baseline is often not stable, and the sensitivity is worse compared to the fluorescence detection mode. A BGE consisting of 10 mM sodium benzoate and 1.5 mM CTAB, with a pH of 12.4, was applied for the simultaneous determination of fructose, glucose and sucrose in honey, using the indirect UV detection mode. The LOD for fructose, glucose and sucrose were 0.58 g/L, 0.67 g/L and 0.12 g/L, respectively [27]. The molar ratios of carbohydrates in 10 kinds of honey were determined by CZE after reductive, UV-active derivatization reactions with 1-phenyl-3-methyl-5-pyrazolone (PMP). Eleven PMP-labeled aldoses were separated in 200 mM borate-4% methanol at pH 11.0 [28]. A graphene–cobalt microsphere (CoMS) hybrid paste electrode was used for the detection of carbohydrates in three honey samples, for which the separation medium was 75 mM NaOH [29].
To the best of our knowledge, fluorescence detection has not yet been applied for the analysis of sugars in honeys. In this work, we applied APTS for the labeling of honey sugars. We optimized a CZE method for the separation of labeled sugars. The aim of this work was to demonstrate the applicability of CE for the determination of APTS-labeled sugars in honey samples.

2. Materials and Methods

2.1. Chemicals

All chemicals were of analytical grade. Ammonium acetate, hydrochloric acid (HCl), NaOH, PEO (average Mv~90,000 g/mol), 6-aminocaproic acid (EACA), hydroxypropyl methylcellulose (HPMC), APTS, sodium cyanoborohydride (NaBH3CN), tetrahydrofuran (THF), acetic acid, fructose, mannose, glucose, galactose, maltose, arabinose, xylose, ribose, and galactose were obtained from Sigma Aldrich (St. Louis, MO, USA). Different types of honey samples (phacelia honey, acacia honey, honeydew honey) were a kind offer from Hungarian producers. The ladder standard, malto-oligosaccharides composed of 1 to 7 glucose units, was made from β-cyclodextrin by acetolysis.

2.2. Instrumentation

CE separations were carried out using a 7100 CE System (Agilent, Waldbronn, Germany) coupled to UV and LEDIF (Zetalif Picometrics) detectors. Separations were performed using a fused-silica capillary (Polymicro, Phoenix, AZ, USA) of 65 cm, 50 cm × 50 µm i.d. The precondition procedure was 1 M HCl for 5 min, BGE for 5 min. Hydrodynamic sample injection (50 mbar × 2 s) was carried out at the anodic end of the fused silica capillary. For the electrophoretic separation, −30 kV was used. Fluorescence detection was performed by an LED-induced fluorescence detector; the excitation and emission wavelengths were 480 nm and 520 nm, respectively. The photomultiplier’s high voltage was set to 700 V. For UV, on-capillary detection at a wavelength of 240 nm was chosen. Chemstation version B.04.02 software (Agilent) was used for operating the CE instrument and for processing the results.

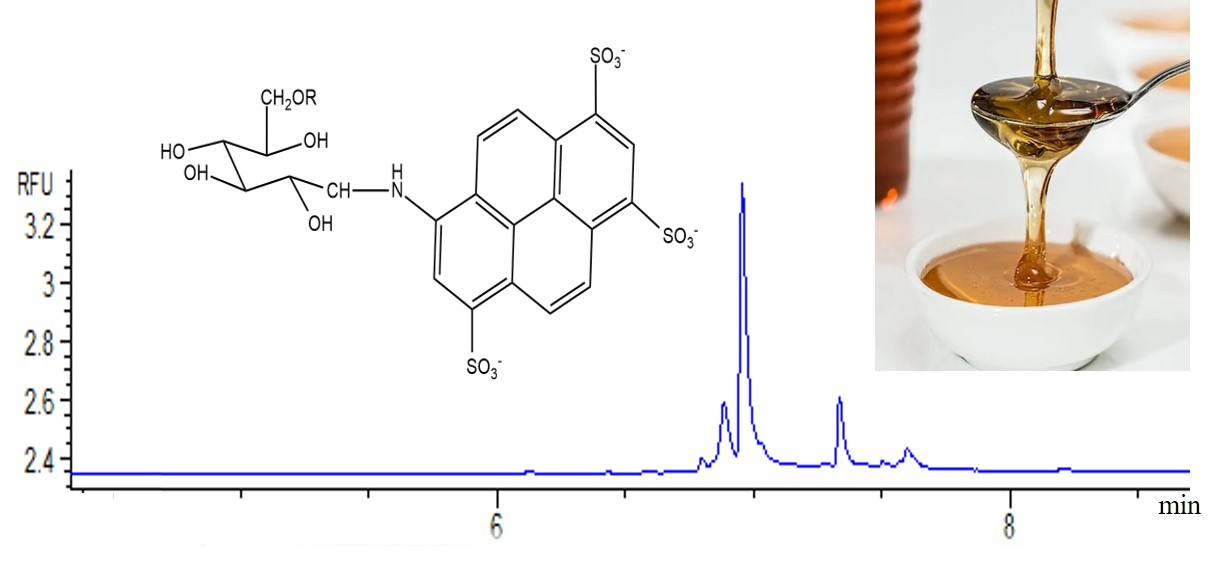
2.3. Sample Preparation for Fluorescence Detection

The derivatization by APTS was carried out according to the recipe of Evangelista [30]; only minor modifications were made, mainly regarding the incubation and the amount of reagents. For the labeling reaction, 0.5 mg of the carbohydrate standard and 1 mg of the honey sample were measured and were dissolved in a mixture of 6 µL of 20 mM APTS (in 15% acetic acid) and 2 µL of 1 M NaBH3CN (in THF) solution. In the first step, a Schiff base was formed, which was reduced to a secondary amine by NaBH3CN. The samples were homogenized using a vortex and then incubated for 1 h at 50 °C. The reaction was stopped by adding 92 µL of distilled water into the labeling reaction. The reaction mixtures were further diluted before direct sample injection.

3. Results and Discussion

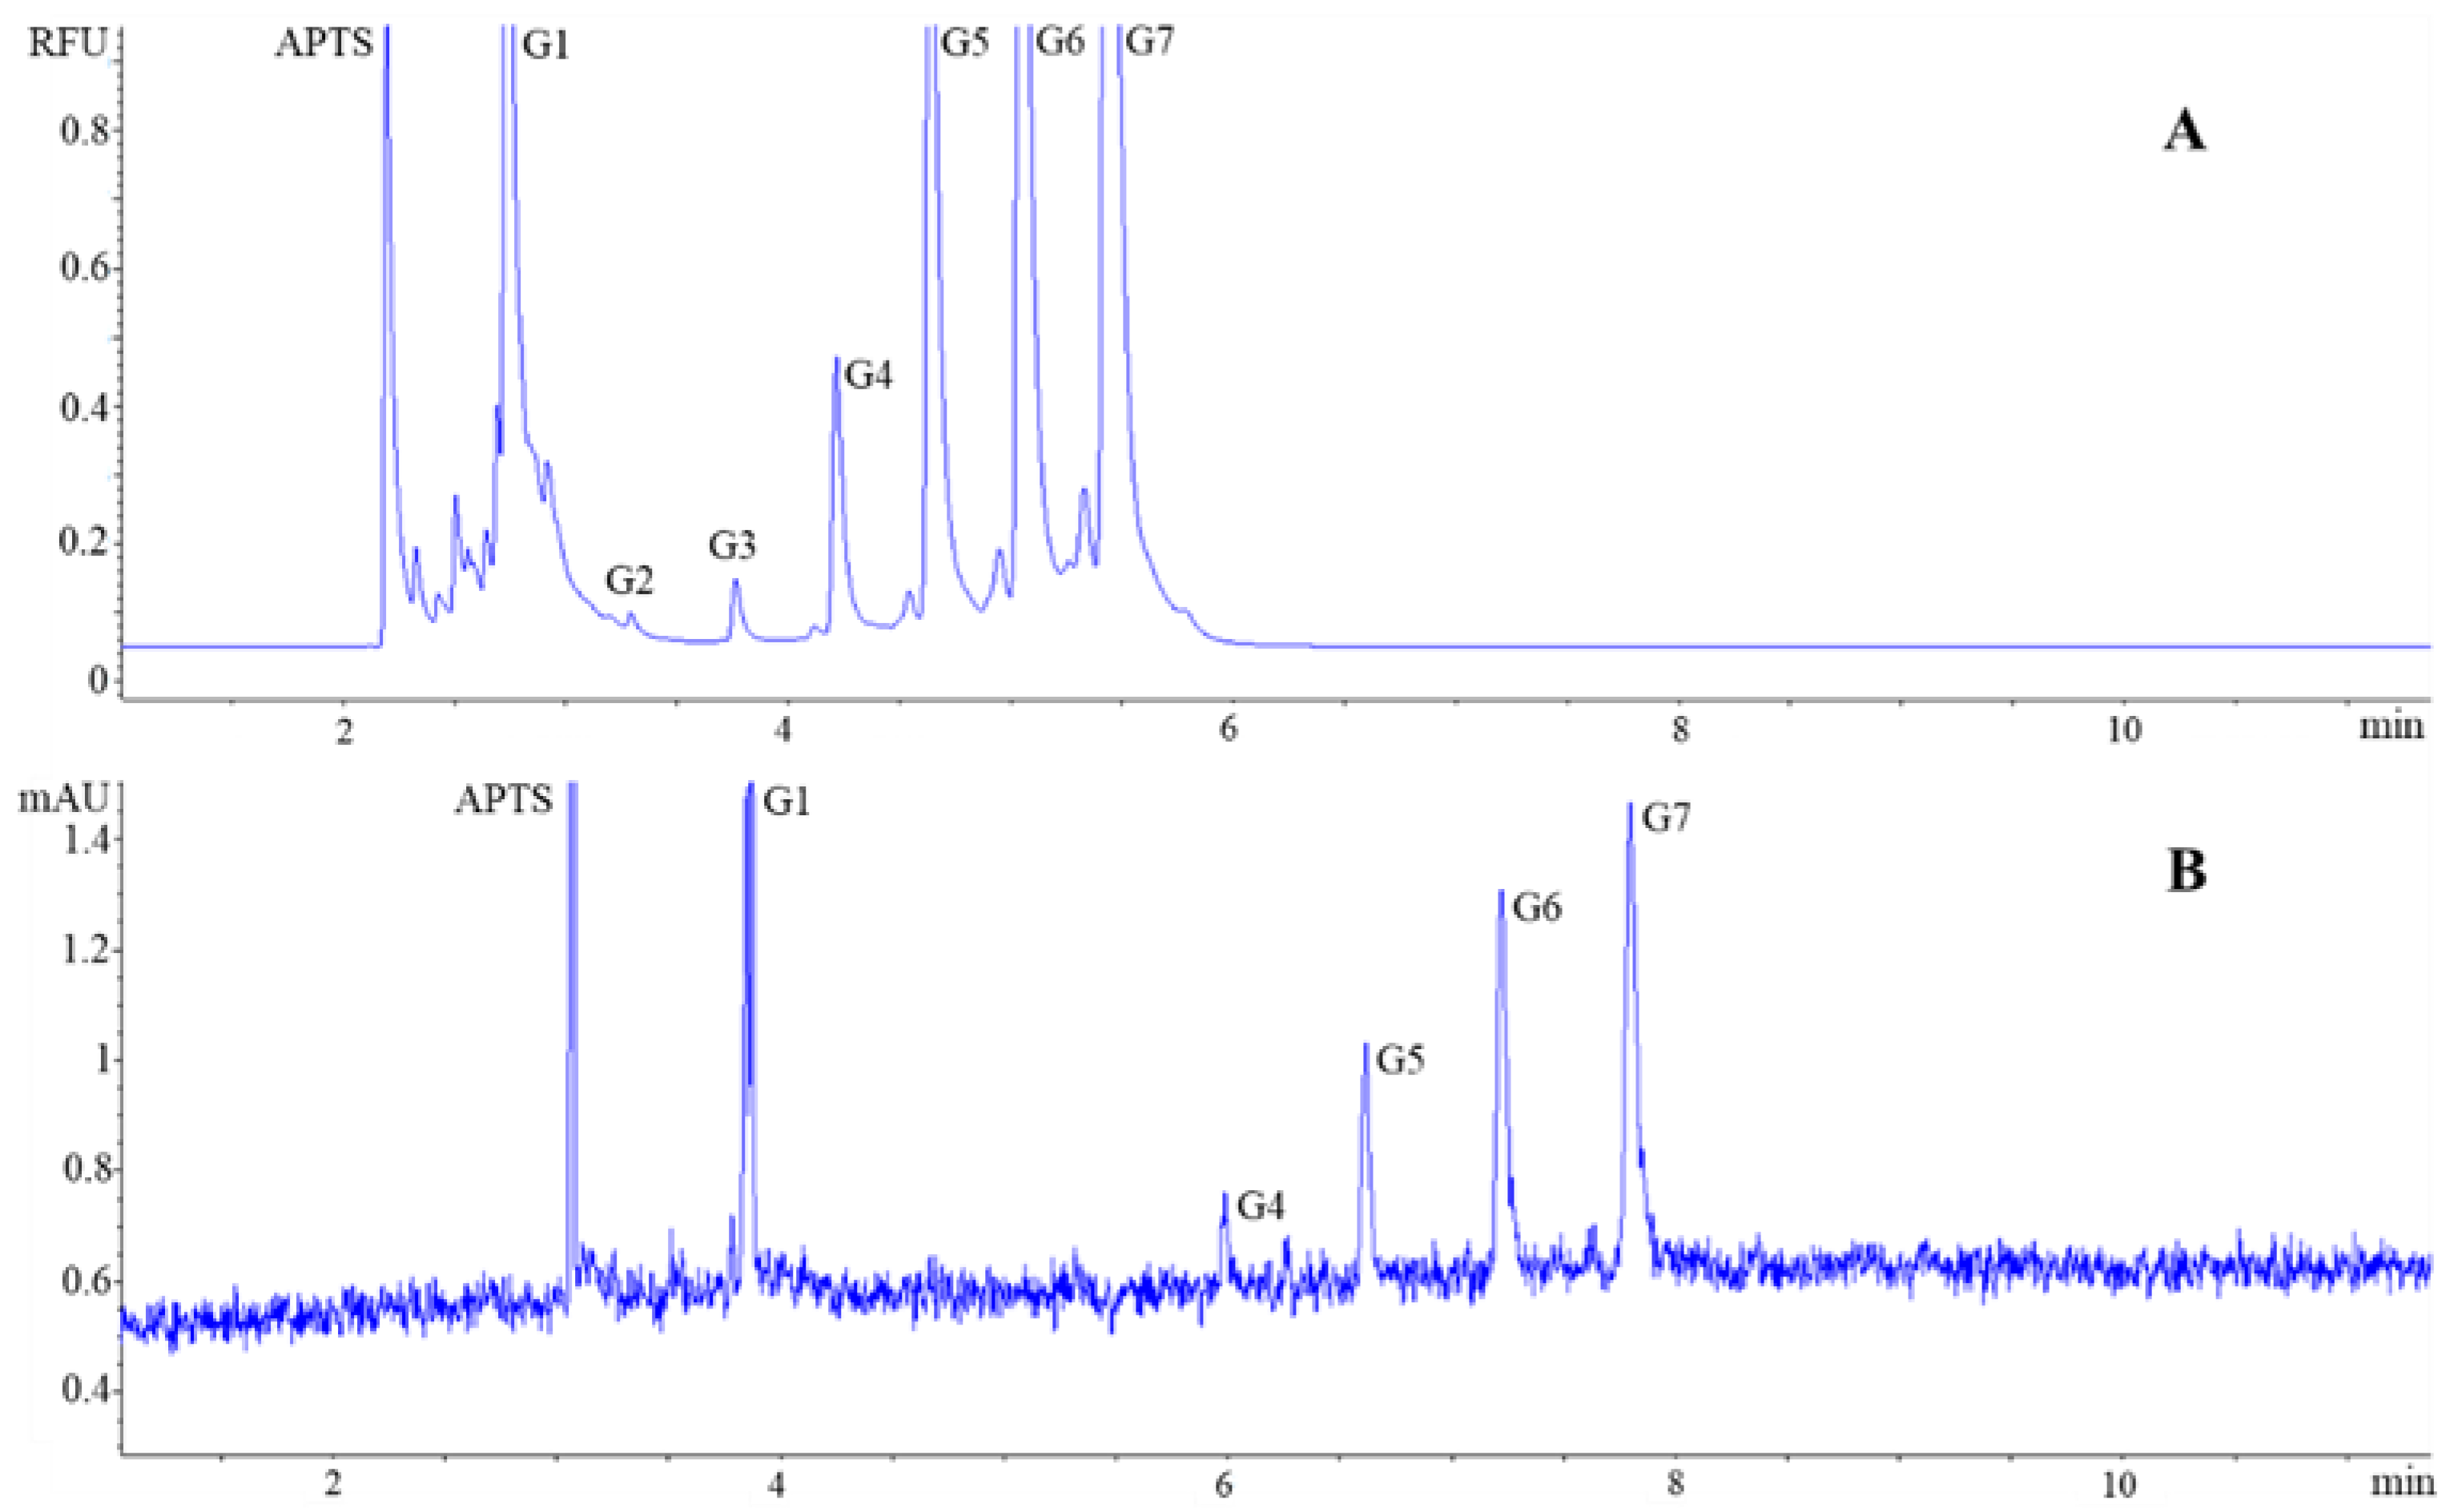
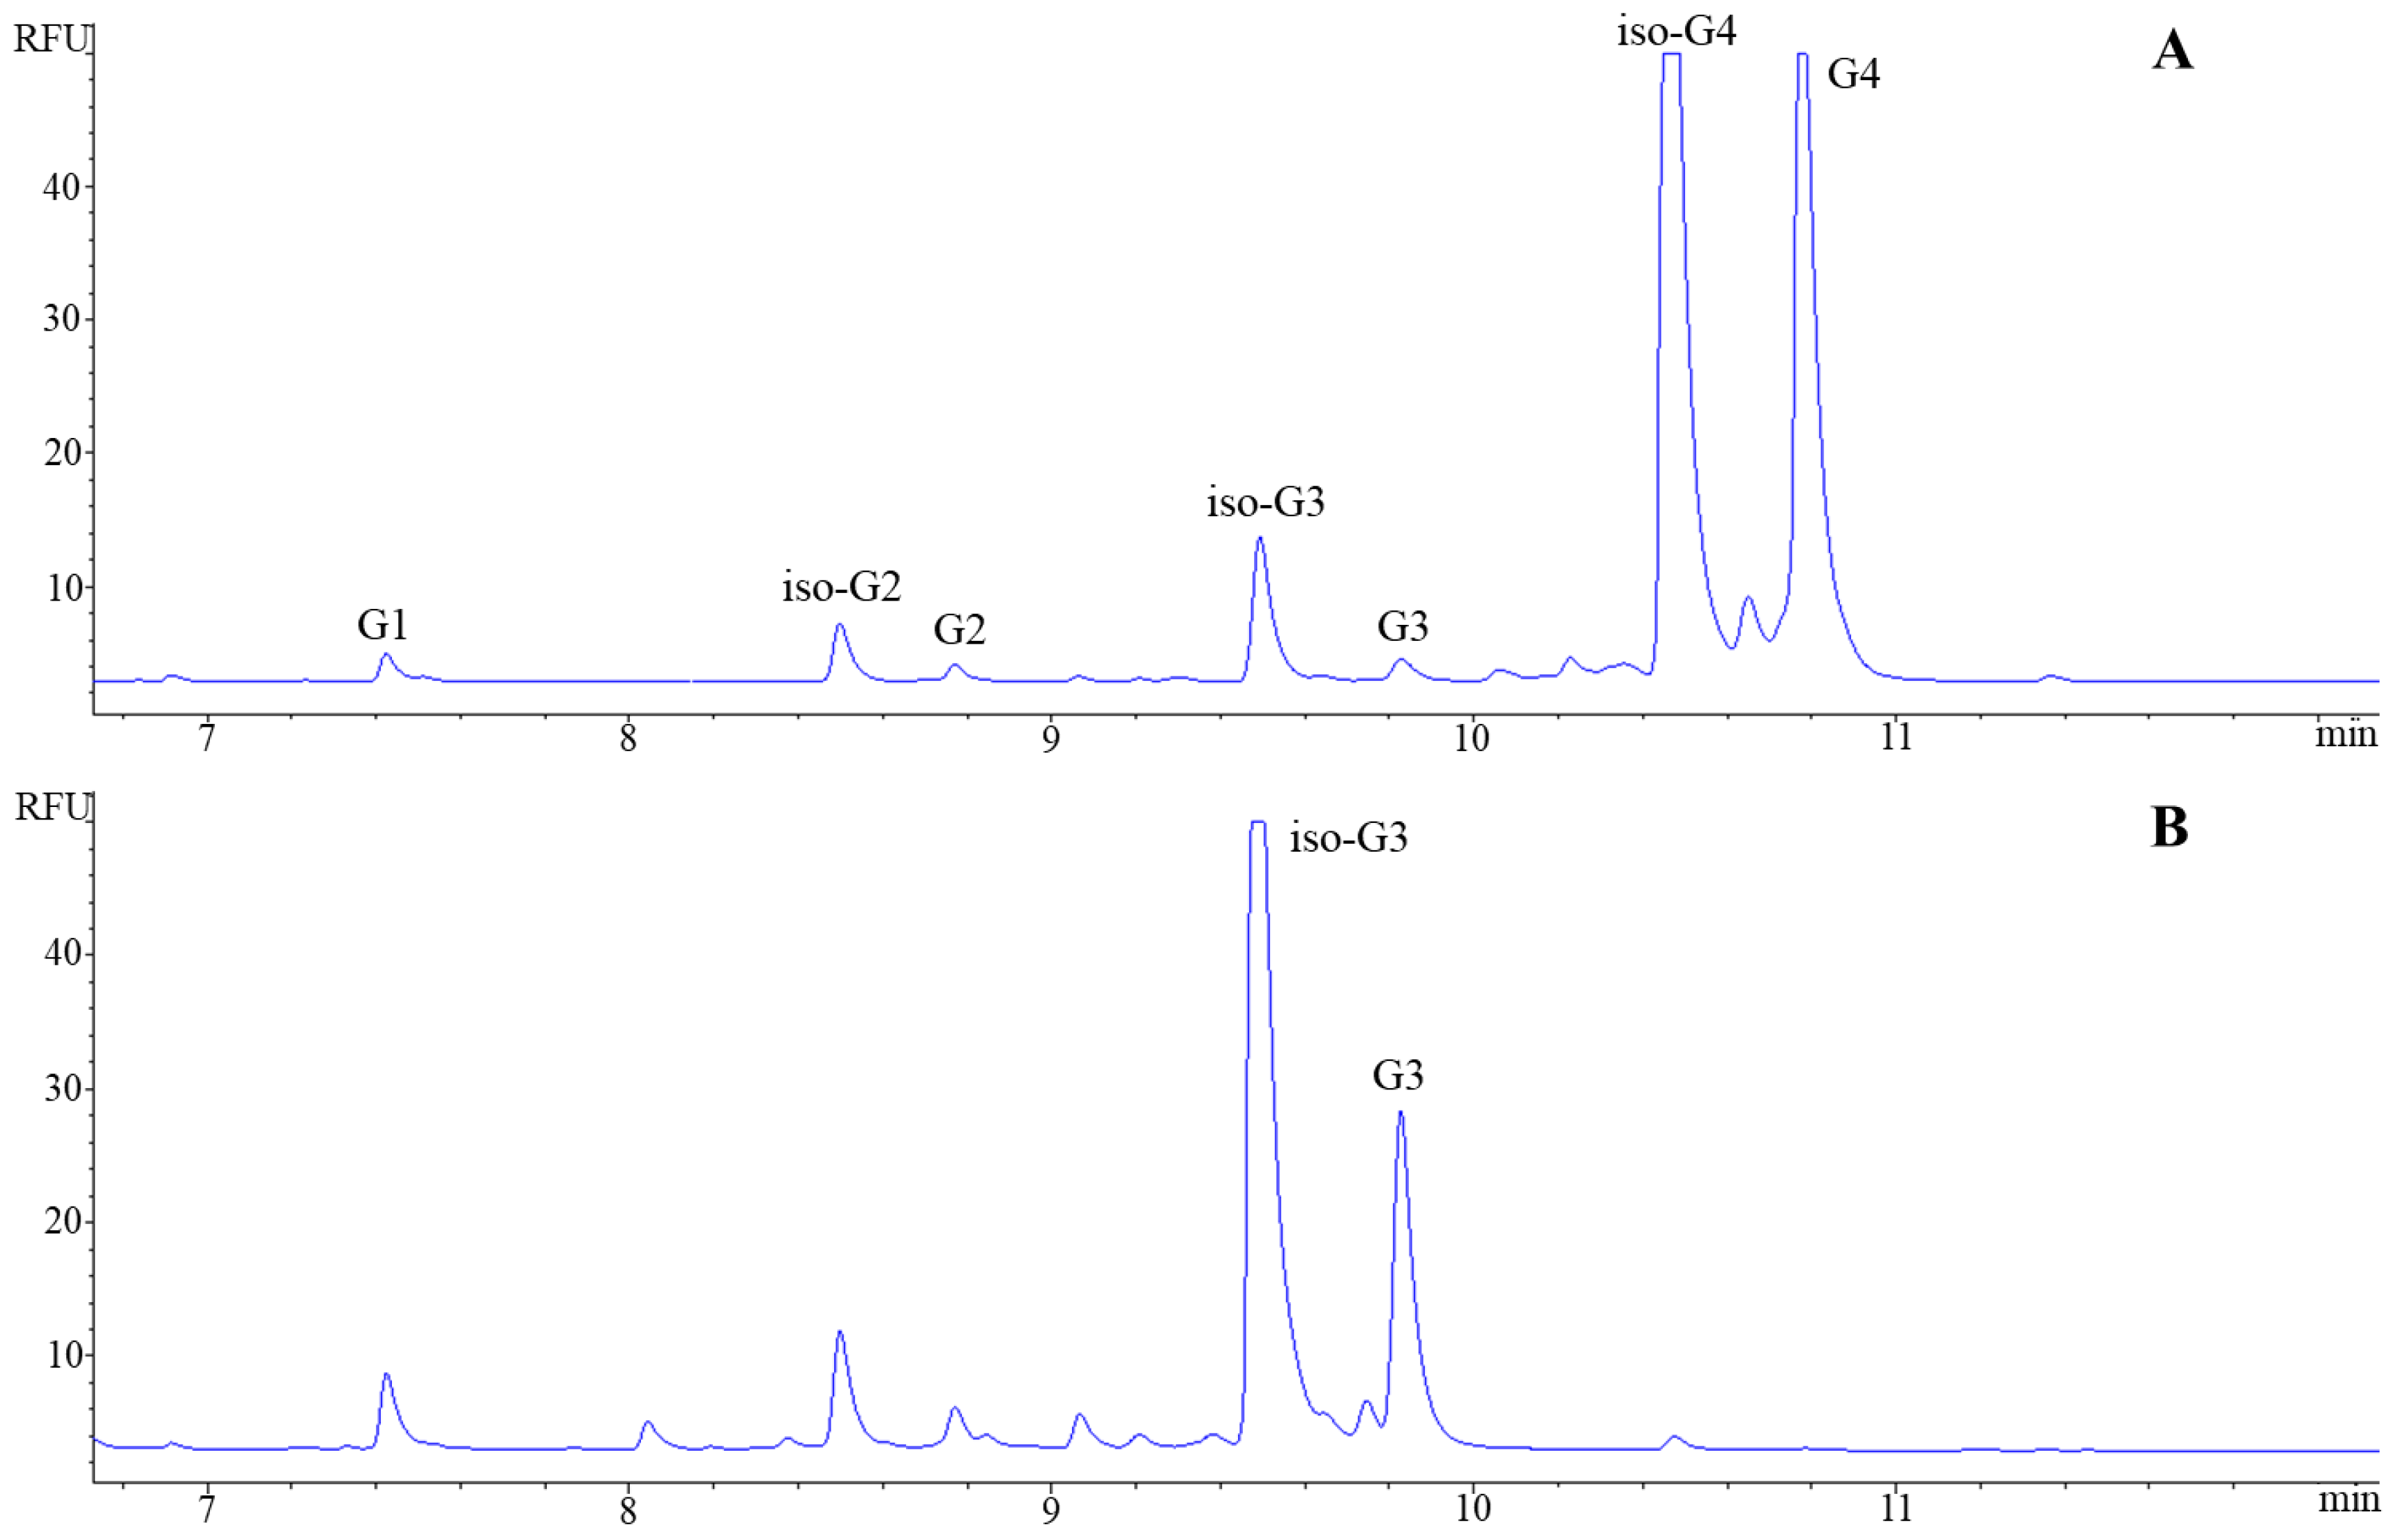
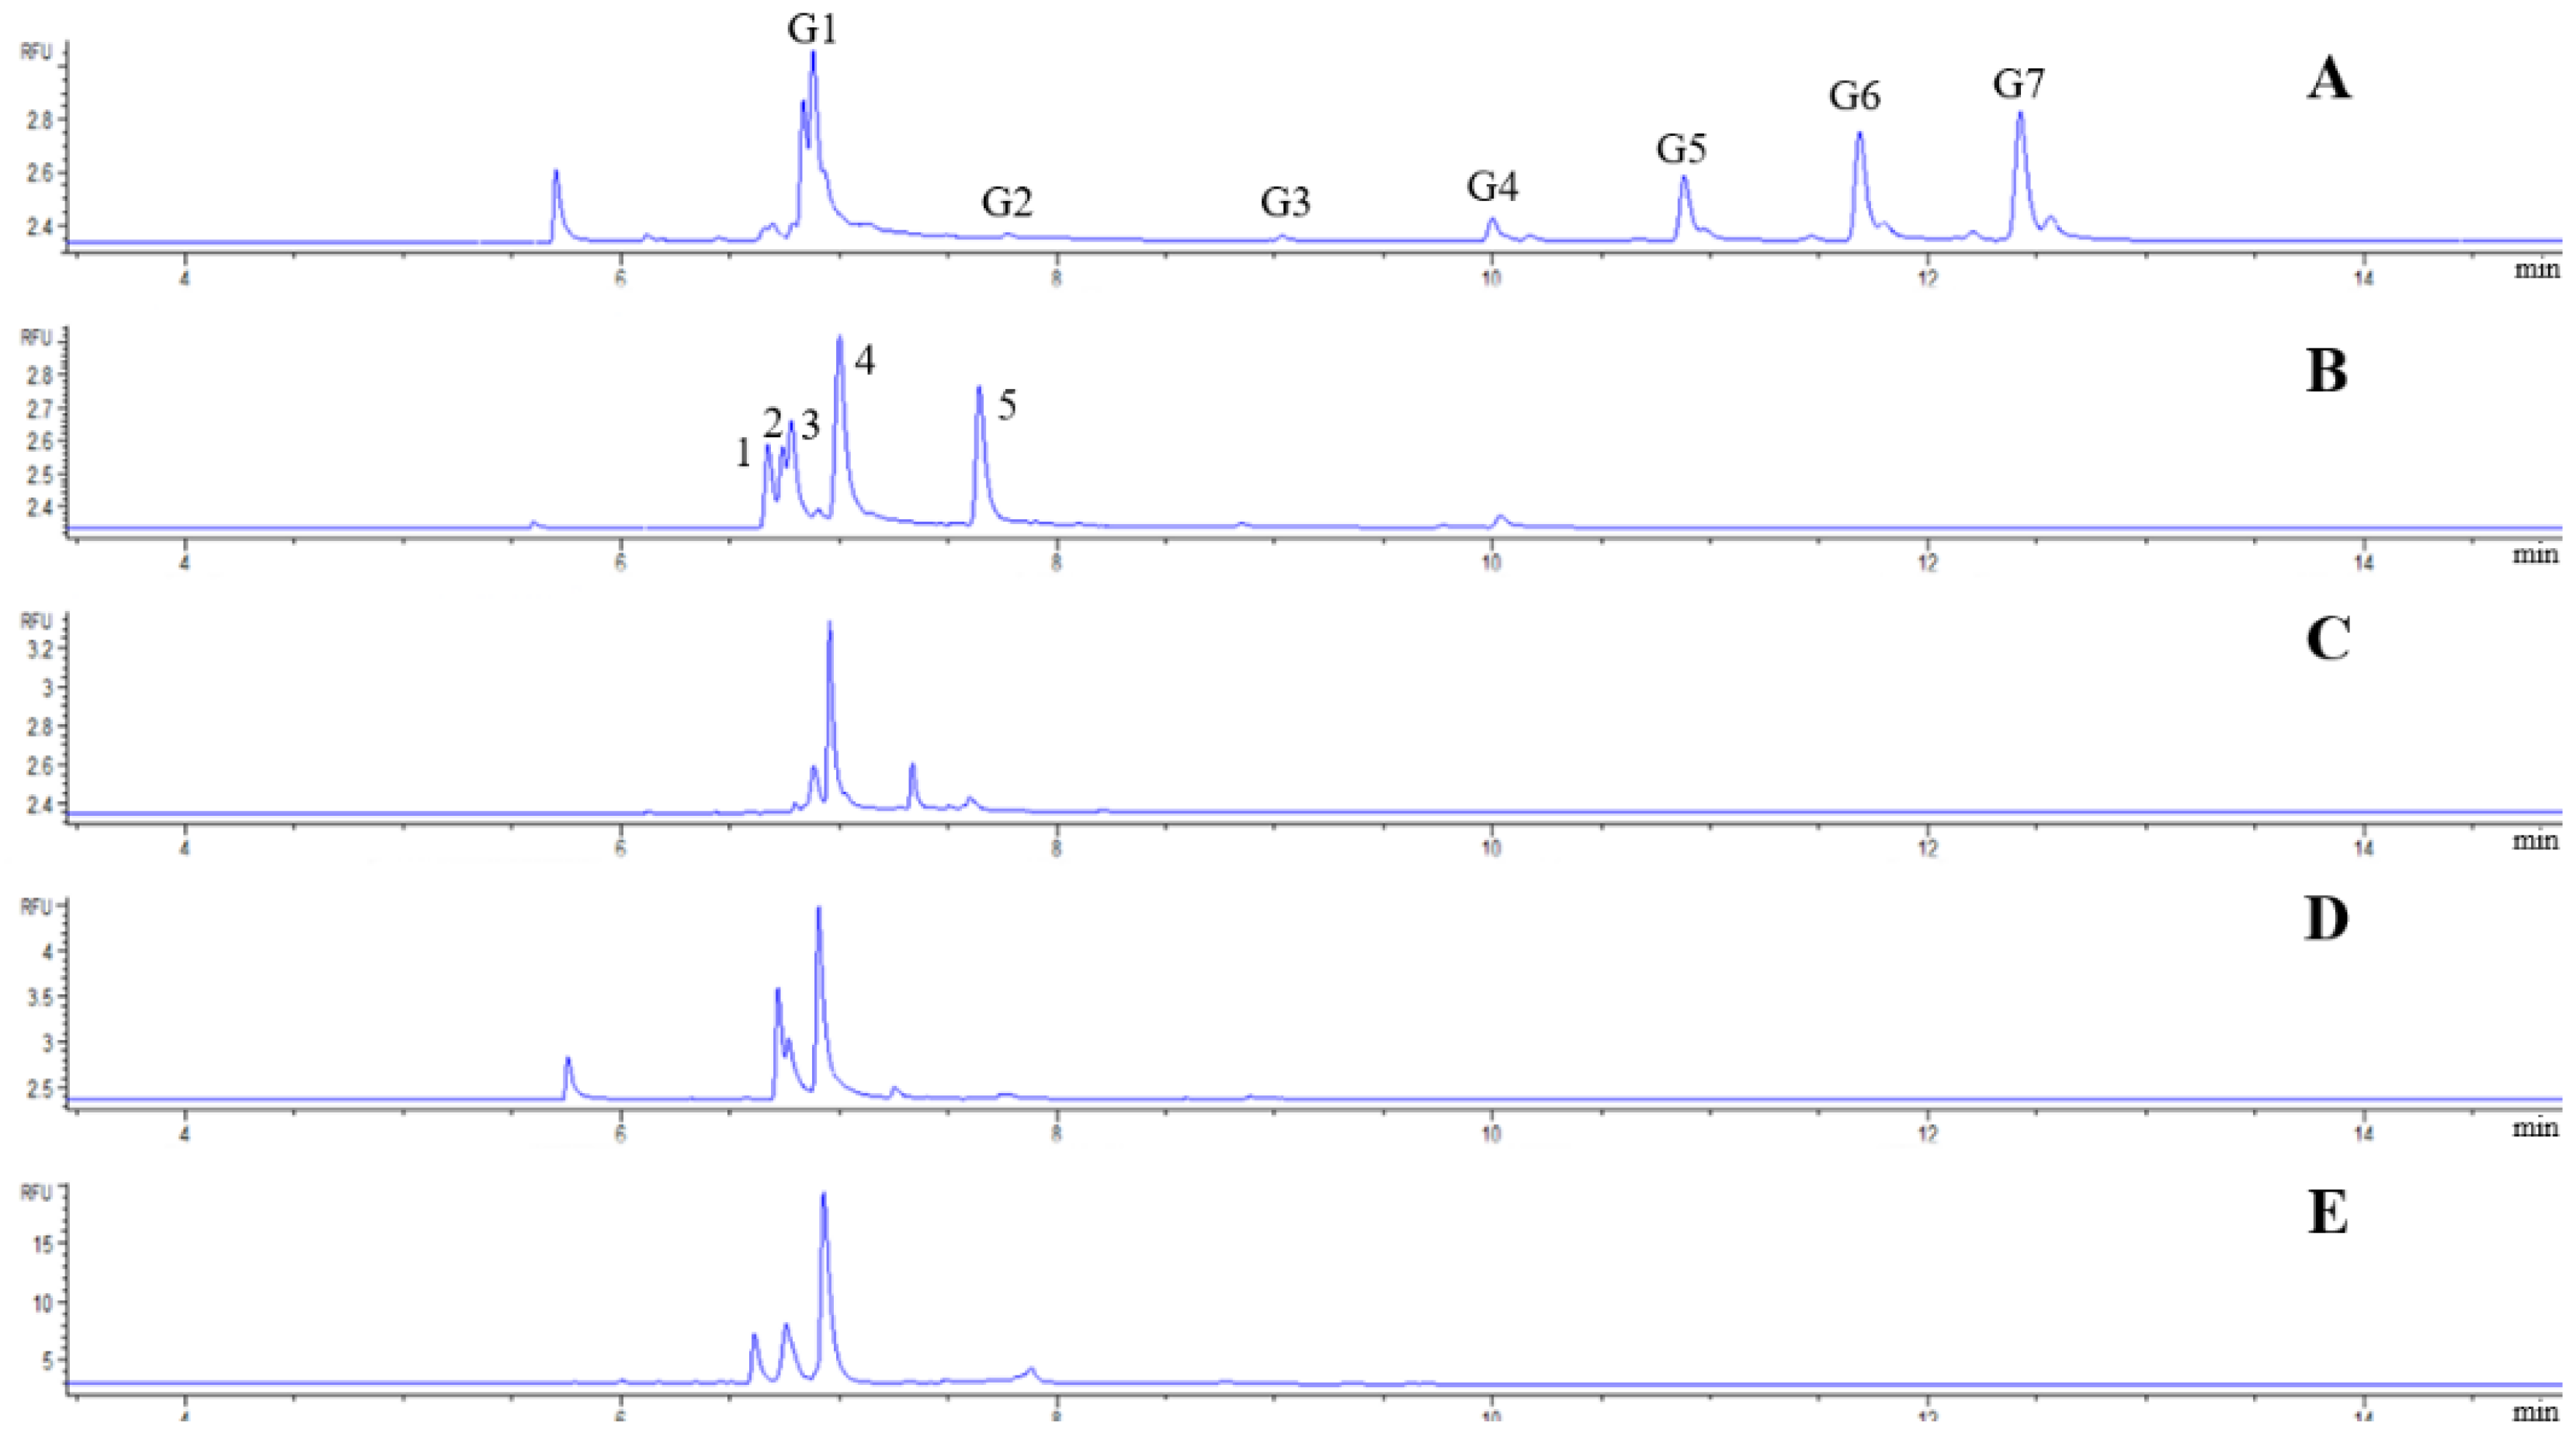
3.1. CZE Separations of APTS-Labeled Carbohydrates

Fluorescence detection provides extremely sensitive detection for the analysis of sample injection plugs in the nanoliter range. As depicted in Figure 1, for the carbohydrate components, the LEDIF detection resulted in a high analytical response signal with very little baseline noise (Figure 1A), while detection at 240 nm yielded a small signal with high baseline noise (Figure 1B). The signal-to-noise ratio was much lower (S/N = 30) compared to fluorescence detection, where S/N was 81,000. Although UV detection is made possible by derivatization, it allows three orders of magnitude of lower sensitivity based on the calculated S/N values.
When labeling carbohydrates, derivatization should not simply be done for detectability; it is crucial to select a fluorophore that renders the labeled sugar component charged. The tagged sugar molecule gains three negative charges, since APTS has three sulfonate groups, enabling their migration in the electric field. Good resolution was achieved in a short migration window using a simple acetate buffer (pH 4.5) in the case of the analysis of the carbohydrate ladder containing oligomers of 1 to 7 glucose units (Figure 1). The electric field is applied under reversed polarity to drive anions toward the detection window. The separation relies on differences in charge-to-size ratio. All labeled sugar components possess a triple negative charge, but their molecular masses are different, so their electrophoretic mobilities differ, as well. The characteristic electrophoretic peak pattern is due to the method of sample production. The intensity decreases as the number of glucose units decreases. After the ring opening of β-CD, with 7 glucose units, an oligosaccharide composed of 7 glucose units was formed in the largest amount. During acidic decomposition, a decreasing amount of shorter oligosaccharides was formed, and glucose was present in high concentration in the sample due to the cleavage of glucose units (Figure 1B).
A four-component carbohydrate mixture (glucose, fructose, mannose and maltose) most often found in honey was investigated using the same BGE that proved optimal in separating the members of the carbohydrate ladder (Figure 2A). The disaccharide maltose appeared as a peak well separated from the monosaccharides upon application of a simple ammonium acetate buffer, but no adequate resolution was obtained in the case of the three monosaccharides (Figure 2A). All three monosaccharides are hexoses (C6H12O6), and their molar masses are the same (M = 180 g/mol); hence, there is no big difference in their electrophoretic mobility, which explains the merging of the peaks. The separation of fructose from mannose and glucose can be attributed to the fact that electrophoretic mobility is also determined by the shape and hydrodynamic radius of the particle. The use of simple, additive-free buffers does not always provide adequate resolution for sugars with the same number of carbon atoms [31].
In order to increase the selectivity, PEO (average Mv~90,000) was added into the BGE, as a result of which a suitable resolution was achieved for the three hexoses (Figure 2B). The effect of PEO on the enhancement of the separation is complex [32]. Due to its neutral polymer nature, it is connected to the inner surface of the fused silica capillary by secondary bonds, so it has a surface modification effect. The neutral coating suppresses the adsorption of the negatively charged components to protonated silanol groups. PEO also has a sieving effect by increasing the viscosity of the BGE. The increase in migration times is due to these effects (Figure 2B).
6-aminocaproic acid (EACA) as a buffer in CE has a selectivity-enhancing effect, which is related to its ion-pair-forming property [33,34]. A significant improvement in resolution was observed compared to the analysis in acetate, although it did not provide baseline resolution (Figure 2C). To improve the selectivity for aldoses, an HPMC linear polymer was added to the 40 mM EACA buffer at a concentration of 0.02%. The cellulose derivative improved the resolution between glucose and mannose and extended the analysis time compared to the PEO-containing buffer (Figure 2D). The effect of HPMC in increasing the separation efficiency is similar to that of PEO. From among the BGEs investigated, 25 mM ammonium acetate-0.3% PEO 90,000 (pH 4.5) provided the best separation and the best resolution values (Supplementary Material Table S1); therefore, this BGE was applied for further analyses.
The use of PEO enabled the separation of positional isomers of oligosaccharides, as well. Two samples of maltotetraose (G4)- isomaltotetraose (isoG4) and maltotriose (G3)-isomaltotriose (isoG3) were analyzed (Figure 3A,B). In the case of G3 and G4, the monosaccharide units are connected by an α(1-4) bond, whereas in the isoG3 and isoG4, the position of the bond is different; the glucose units are linked by an α(1-6) bond. Since the electrophoretic mobility is also influenced by the shape of the particle, it was possible to separate the G3 and G4 from their positional isomers possessing the same mass and charge but different form. The α(1-4) linkage affords an elongated, thinner molecular shape; therefore the friction coefficients of G3 and G4 are higher, so their electrophoretic mobility is lower than that of their isomers. The spherical shape of the isomers led to lower friction coefficients and, as a result, higher migration speed (Figure 3A,B).
During method development, sample injection was also examined, since the honey samples were introduced into the capillary without any sample preparation procedure, except for the labeling reaction. Electrokinetic sample introduction of a standard carbohydrate solution with 5 kV × 5 s delivered the same amount of each carbohydrate into the capillary as hydrodynamic injection by 50 mbar × 2 s (Supplementary Material Figure S1). The ratio of individual carbohydrates did not vary when electrokinetic injection was applied because there is no difference in the charge of APTS-labeled sugars. It is possible to examine APTS-marked sugar components in samples of honey via electrokinetic injection.
The calibration curves and analytical performance data are given for two sugars (fructose and glucose) that are present in honey in the largest amounts (Table 1). The calculated LOD and limit of quantitation (LOQ) in the range of ng/mL enable a more sensitive determination than what is usually available with UV-VIS spectrophotometric detection in the case of CE (μg/mL). The relative standard deviation (RSD%) values of migration time were around 0.5, whereas RSD% values of area were between 2.5 and 4.4. The theoretical plate number data correspond to the separation efficiency expected from CE (Table 1).

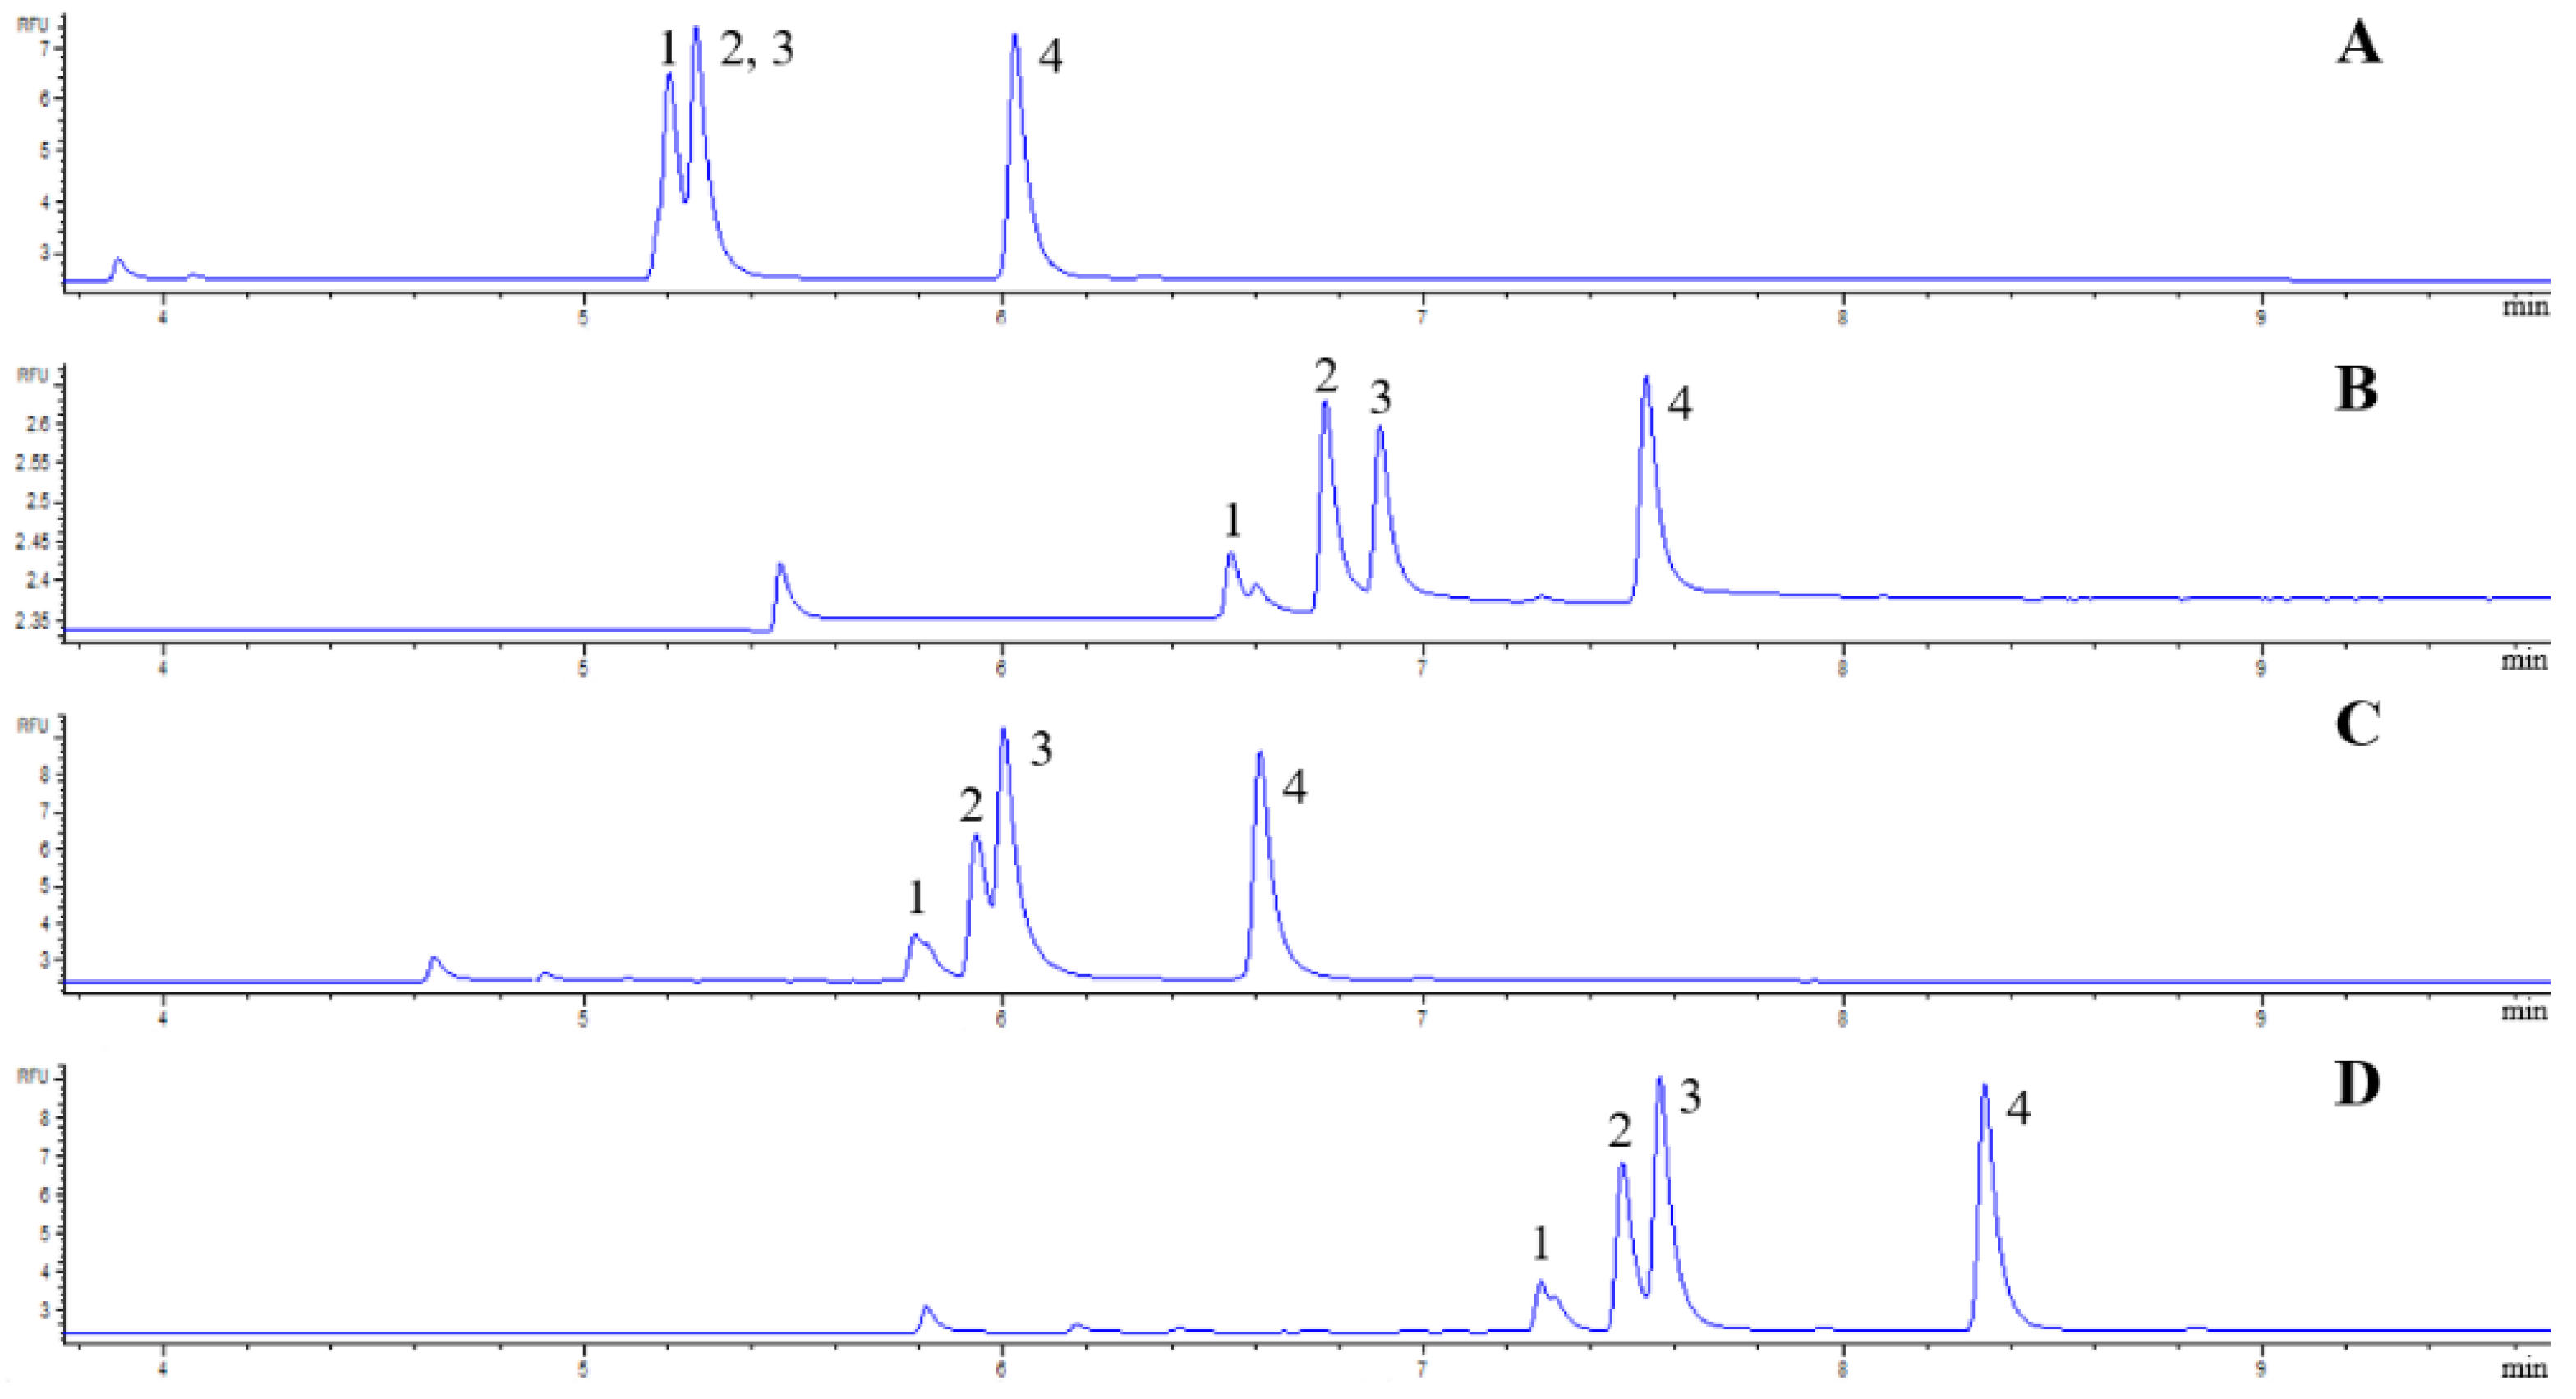
3.2. Analysis of Sugars in Honey Samples

The sugar content of three different honey samples (phacelia honey, honeydew honey, and acacia honey) was analyzed by CE-LEDIF using ammonium acetate with a PEO additive as a BGE (Figure 4C–E). The sugar content of honeys was characterized using a carbohydrate ladder (Figure 4A) and a standard mixture containing five carbohydrates (arabinose, xylose, ribose, galactose and maltose) (Figure 4B). All three honeys contain two monosaccharides in higher concentrations, and other sugars appeared in smaller concentrations in the monosaccharide region (G1), according to the ladder (Figure 4C–E). This corresponds well with the literature data showing that honey consists of about 90% sugars, mainly glucose and fructose. Identification of glucose and fructose peaks in honeys was performed by standard addition. This is illustrated through the example of phacelia honey, wherein the addition of fructose resulted in an enhancement in the peak height of fructose, which is proportional to the added amount (Supplementary Material Figure S2). Apart from glucose and fructose, other sugars were not identified by spiking. The fructose and glucose content of honey in mass percentages and their relative proportion data were given using the prepared calibration curves (Table 2). The fructose-to-glucose ratio is one of the most important data for describing the quality of honeys [2,35]. Honey is crystallized when this ratio is less than 1.2. This data reveals which honey contains more glucose and indicates how likely it is to crystallize. Phacelia honey had the highest glucose content and the lowest fructose-to-glucose ratio. Honey is in a liquid state if the fructose-to-glucose ratio exceeds 1.2, so phacelia honey crystallized, whereas acacia and honeydew honeys retained their liquid characters due to the lower glucose content. Honeydew honey differed from phacelia and acacia honey in terms of monosaccharide composition. It had a lower carbohydrate content (Table 2). Honeydew honey is not of flower nectar origin, and, actually, this difference in origin is what causes the diversity in composition. Honeydew is excreted by aphids and other insects, and this excreted, sticky substance is collected by bees.
In addition to monosaccharides, the presence of small amounts of disaccharides was confirmed in the honey samples using the carbohydrate ladder (Figure 4C–E). According to the literature, maltose, sucrose, maltulose, nigerose, kojibose, trehalose and turanose are the disaccharides that are most commonly found in honey [1,2]. None of the disaccharide peaks visible on the electropherogram come from sucrose; because sucrose is not a reducing disaccharide, it cannot be labeled by APTS. According to the carbohydrate ladder, the electropherograms between G1 and G2 showed the positional isomers of the disaccharides. The honeys analyzed contained very trace amounts of trisaccharides. Less than 0.1% of the total monosaccharide amount was made up by the peaks migrating at the G3 location.
The evaluation of the greenness of analytical methods was performed by the Analytical Greenness calculator (AGREE). The obtained score was 0.74, which is in the middle of the AGREE pictogram with values close to 1; the green color indicates that the applied CE-LEDIF analytical procedure has little environmental impact [36,37,38].

4. Conclusions

In this work, we studied the possibilities of determining the sugar composition of honey samples by capillary electrophoresis with light-emitting diode-induced fluorescence detection (CE-LEDIF). We applied 8-aminopyrene-1,3,6-trisulfonic acid (APTS) for the labeling of honey sugars, which made possible not only the sensitive detection but also the electrophoretic separation. LEDIF detection allowed for the determination of sugars with high sensitivity (~30 ng/mL limit of quantitation (LOQ) values). The effect of background electrolyte (BGE) additives on the separation efficiency was investigated, and the addition of polyethylene oxide (PEO) improved the resolution of labeled sugars having the same carbon number. We determined the glucose and fructose content of three different types of honey samples. The CE-LEDIF method has the potential to be a suitable platform for the routine analysis of honey samples in food and biology laboratories. Although the developed method is well suited for the determination of sugar components which are presented in honey, the method does not allow for the direct determination of sucrose, which plays a major role in the adulteration of honey. Further developments are needed for the determination of non-reducing disaccharides, for instance, sucrose (after enzymatic hydrolysis). We plan to analyze honey samples of different ages and different geographical origin.

Supplementary Materials

The following supporting information can be downloaded at: https://www.mdpi.com/article/10.3390/separations10030150/s1. Table S1: The comparison of resolutions using different BGEs. The analysis conditions were the same as stated in Figure 2. Figure S1: The CZE-LEDIF determinations of a mixture of four carbohydrates using hydrodynamic (A) and electrokinetic injection (B). The analysis conditions were the same as stated in Figure 2B. Injection: +5 kV × 5 s (S1B), samples: 1: fructose, 2: glucose, 3: mannose, 4: maltose, (*): APTS. Figure S2: Identification of fructose peak in honey using standard addition. The analysis conditions were the same as stated in Figure 2B. Sample: 1: fructose, 2: glucose, (*): APTS, (S2A) phacelia honey, (S2B) phacelia honey spiked with fructose, (S2A’, S2B’) narrow scale of electropherograms of (A, B).

Author Contributions

Conceptualization, M.A., G.G. and Z.S.; methodology, M.A.; investigation, M.A.; writing—original draft preparation, M.A.; writing—review and editing, C.N.; supervision, G.G., Z.S. and C.N. All authors have read and agreed to the published version of the manuscript.

Funding

The research presented in the article was carried out within the framework of the National Research, Development and Innovation Office (K127931 and K142134), Hungary.

Data Availability Statement

Data available upon request from the authors.

Acknowledgments

The authors acknowledge the financial support provided to this project by the National Research, Development and Innovation Office (K127931 and K142134), Hungary.

Conflicts of Interest

The authors declare no conflict of interest.

Abbreviations

capillary electrophoresis (CE); light-emitting diode-induced fluorescence detection (LEDIF); polyethylene oxide (PEO); 8-aminopyrene-1,3,6-trisulfonic acid (APTS); ultraviolet-visible (UV-VIS); background electrolyte (BGE); acid dissociation constant (pKa); capillary zone electrophoresis (CZE); mass spectrometry (MS); limit of detection (LOD); laser-induced fluorescence detection (LIF); 8-aminonaphthalene-1,3,6-trisulfonic acid (ANTS); aminonaphthalene-2-sulfonic acid (ANA); 4-amino-5-hydroxynaphthalene-2,7-disulfonic acid (AHNS); cetyltrimethylammonium bromide (CTAB); sodium hydroxide (NaOH); 1-phenyl-3-methyl-5-pyrazolone (PMP); graphene–cobalt microsphere (CoMS); hydrochloric acid (HCl); 6-aminocaproic acid (EACA); hydroxypropyl methylcellulose (HPMC); sodium cyanoborohydride (NaBH3CN); tetrahydrofuran (THF); signal-to-noise ratio (S/N); numbers of glucose residues of the malto-oligosaccharide ladder standard (GX); maltotetraose (G4); isomaltotetraose (isoG4); maltotriose (G3); isomaltotriose (isoG3); limit of quantitation (LOQ); relative standard deviation (RSD%).

References

  1. Samarghandian, S.; Farkhondeh, T.; Samini, F. Honey and health: A review of recent clinical research. Phcog. Res. 2017, 9, 121–127. [Google Scholar] [PubMed]
  2. Machado de-Melo, A.A.; Bicudo de Almeida-Muradian, L.; Sancho, M.T.; Pascual-Mate, A. Composition and properties of Apis mellifera honey: A review. J. Apic. Res. 2018, 57, 5–37. [Google Scholar] [CrossRef]
  3. Asquieri, E.R.; Gomes de Moura, A.S.; Dianiny de Cassia, S.M.; Batista, R.D. Comparison of titulometric and spectrophotometric approaches towards the determination of total soluble and insoluble carbohydrates in foodstuff. Carpathian J. Food Sci. Technol. 2019, 11, 69–79. [Google Scholar]
  4. BeMiller, J.N. Chapter 10-Carbohydrate Analysis, Food Analysis; Springer: Berlin/Heidelberg, Germany, 2010; pp. 147–177. [Google Scholar]
  5. Slimestad, R.; Vagen, I.M. Thermal stability of glucose and other sugar aldoses in normal phase high performance liquid chromatography. J. Chromatogr. A 2006, 1118, 281–284. [Google Scholar] [CrossRef]
  6. Cordella, C.; Militao, J.S.L.T.; Clement, M.C.; Drajnudela, P.; Cabrol-Bass, D. Detection and quantification of honey adulteration via direct incorporation of sugar syrups or bee-feeding: Preliminary study using high-performance anion exchange chromatography with pulsed amperometric detection (HPAEC-PAD) and chemometrics. Anal. Chim. Acta 2005, 531, 239–248. [Google Scholar] [CrossRef]
  7. Hetricka, E.M.; Kramer, T.T.; Risleya, D.S. Evaluation of a hydrophilic interaction liquid chromatography design space for sugars and sugar alcohols. J. Chromatogr. A 2017, 1489, 65–74. [Google Scholar] [CrossRef]
  8. Weiβ, K.; Alt, M. Determination of single sugars, including inulin, in plants and feed materials by high-performance liquid chromatography and refraction index detection. Fermentation 2017, 3, 36. [Google Scholar]
  9. Al-Sanea, M.M.; Gamal, M. Critical analytical review: Rare and recent applications of refractive index detector in HPLC chromatographic drug analysis. Microchem. J. 2022, 178, 107339. [Google Scholar] [CrossRef]
  10. Jalaludin, I.; Kim, J. Comparison of ultraviolet and refractive index detections in the HPLC analysis of sugars. Food Chem. 2021, 365, 130514. [Google Scholar] [CrossRef]
  11. Suzuki, S.; Honda, S. A tabulated review of capillary electrophoresis of carbohydrates. Electrophoresis 1998, 19, 2539–2560. [Google Scholar] [CrossRef]
  12. Rassi, Z.E. Recent developments in capillary electrophoresis and capillary electrochromatography of carbohydrate species. Electrophoresis 1999, 20, 3134–3144. [Google Scholar] [CrossRef]
  13. Lu, G.; Crihfield, C.L.; Gattu, S.; Veltri, L.M.; Holland, L.A. Capillary electrophoresis separations of glycans. Chem. Rev. 2018, 118, 7867–7885. [Google Scholar] [CrossRef] [PubMed] [Green Version]
  14. Arentoft, A.M.; Michaelsen, S.; Sorensen, H. Determination of oligosaccharides by capillary zone electrophoresis. J. Chromatogr. A 1993, 652, 517–524. [Google Scholar] [CrossRef]
  15. Honda, S. Separation of neutral carbohydrates by capillary electrophoresis. J. Chromatogr. A 1996, 720, 337–351. [Google Scholar] [CrossRef]
  16. Mantovani, V.; Galeotti, F.; Maccari, F.; Volpi, N. Recent advances in capillary electrophoresis separation of monosaccharides, oligosaccharides, and polysaccharides. Electrophoresis 2018, 39, 179–189. [Google Scholar] [CrossRef]
  17. Soga, T.; Serwe, M. Determination of carbohydrates in food samples by capillary electrophoresis with indirect UV detection. Food Chem. 2000, 69, 339–344. [Google Scholar] [CrossRef]
  18. Kakehia, K.; Funakuboa, T.; Suzukia, S.; Odaa, Y.; Kitada, Y. 3-Aminobenzamide and 3-aminobenzoic acid, tags for capillary electrophoresis of complex carbohydrates with laser-induced fluorescent detection. J. Chromatogr. A 1999, 863, 205–218. [Google Scholar] [CrossRef]
  19. Carvalho, A.Z.; da Silva, J.A.F.; do Lago, C.L. Determination of mono- and disaccharides by capillary electrophoresis with contactless conductivity detection. Electrophoresis 2003, 24, 2138–2143. [Google Scholar] [CrossRef]
  20. Campa, C.; Coslovi, A.; Flamigni, A.; Rossi, M. Overview on advances in capillary electrophoresis-mass spectrometry of carbohydrates: A tabulated review. Electrophoresis 2006, 27, 2027–2050. [Google Scholar] [CrossRef]
  21. Starr, C.M.; Masada, R.I.; Hague, C.; Skop, E.; Klock, J.C. Fluorophore-assisted carbohydrate electrophoresis in the separation, analysis, and sequencing of carbohydrates. J. Chromatogr A 1996, 720, 295–321. [Google Scholar] [CrossRef]
  22. Paulus, A.; Klockow, A. Detection of carbohydrates in capillary electrophoresis. J. Chromatogr. A 1996, 720, 353–376. [Google Scholar] [CrossRef] [PubMed]
  23. Guttman, A. Analysis of monosaccharide composition by capillary electrophoresis. J. Chromatogr. A 1997, 763, 271–277. [Google Scholar] [CrossRef] [PubMed]
  24. Olajos, M.; Hajos, P.; Guenther, K.; Bonn, G.K.; Guttman, A. Sample preparation for the analysis of complex carbohydrates by multicapillary gel electrophoresis with light emitting diode induced fluorescence detection. Anal. Chem. 2008, 80, 4241–4246. [Google Scholar] [CrossRef] [PubMed]
  25. Shaheen, R.; Senn, J.P. Quantification of polysaccharides in water using capillary electrophoresis. Int. J. Environ. Anal. Chem. 2005, 85, 177–198. [Google Scholar] [CrossRef]
  26. Rizelio, V.M.; Tenfen, L.; Silveira, R.; Valdemiro, L.; Gonzaga, L.V.; Costa, A.C.O.; Fett, R. Development of a fast capillary electrophoresis method for determination of carbohydrates in honey samples. Talanta 2012, 93, 62–66. [Google Scholar] [CrossRef] [Green Version]
  27. Dominguez, M.A.; Jacksen, J.; Emmer, A.; Centurion, M.E. Capillary electrophoresis method for the simultaneous determination of carbohydrates and proline in honey samples. Microchem. J. 2016, 129, 1–4. [Google Scholar] [CrossRef]
  28. Lua, Y.; Hub, Y.; Wangc, T.; Yanga, X.; Zhaoc, Y. Rapid determination and quantitation of compositional carbohydrates to identify honey by capillary zone electrophoresis. J. Food 2017, 15, 531–537. [Google Scholar] [CrossRef] [Green Version]
  29. Liang, P.; Sun, M.; He, P.; Zhang, L.; Chen, G. Determination of carbohydrates in honey and milk by capillary electrophoresis in combination with graphene–cobalt microsphere hybrid paste electrodes. Food Chem. 2016, 190, 64–70. [Google Scholar] [CrossRef]
  30. Chen, F.T.; Dobashi, T.S.; Evangelista, R.A. Quantitative analysis of sugar constituents of glycoproteins by capillary electrophoresis. Glycobiology 1998, 8, 1045–1052. [Google Scholar] [CrossRef] [Green Version]
  31. Volpi, N. Capillary Electrophoresis of Carbohydrates, from Monosaccharides to Complex Polysaccharides; Springer: Berlin/Heidelberg, Germany, 2011. [Google Scholar]
  32. Horvath, J.; Dolnik, V. Polymer wall coatings for capillary electrophoresis. Electrophoresis 2001, 22, 644–655. [Google Scholar] [CrossRef]
  33. Hamm, M.; Wang, Y.; Rustandi, R.R. Characterization of N-Linked glycosylation in a monoclonal antibody produced in NS0 cells using capillary electrophoresis with laser-induced fluorescence detection. Pharmaceuticals 2013, 6, 393–406. [Google Scholar] [CrossRef] [PubMed] [Green Version]
  34. Bunz, S.C.; Rapp, E.; Neususs, C. Capillary electrophoresis/mass spectrometry of APTS-labeled glycans for the identification of unknown glycan species in capillary electrophoresis/laser-induced fluorescence systems. Anal. Chem. 2013, 85, 10218–10224. [Google Scholar] [CrossRef] [PubMed]
  35. Manikis, I.; Thrasivoulou, A. The relation of physicochemical characteristics of honey and the crystallization sensitive parameters. Apiacta 2001, 36, 106–112. [Google Scholar]
  36. Gamal, M.; Naguib, I.A.; Panda, D.S.; Abdallah, F. Comparative study of four greenness assessment tools for selection of greenest analytical method for assay of hyoscine N-butyl bromide. Anal. Methods 2021, 13, 369–380. [Google Scholar] [CrossRef]
  37. Pena-Pereira, F.; Wojnowski, W.; Tobiszewski, M. AGREE—Analytical GREEnness metric approach and software. Anal. Chem. 2020, 92, 10076–10082. [Google Scholar] [CrossRef]
  38. Plotka-Wasylka, J.; Wojnowsk, W. Complementary green analytical procedure index (ComplexGAPI) and software. Green Chem. 2021, 23, 8657–8665. [Google Scholar] [CrossRef]
Figure 1. The CZE electropherograms of an APTS-labeled malto-oligosaccharide ladder standard using LEDIF (A) and UV (B) detection. The GX numbers indicate the numbers of glucose residues of the ladder. Conditions: fused silica capillary, ltot: 50 cm × 50 µm id, leff: 30 cm (A), 42 cm (B), BGE: 25 mM ammonium acetate (pH 4.5), separation voltage: −30 kV, injection: 50 mbar × 2 s, preconditioning: 1 M HCl for 5 min, BGE for 5 min washing. LEDIF detection was performed at 480 nm excitation/520 nm emission, UV detection was performed at 240 nm.
Separations 10 00150 g001
Figure 2. The CZE separations of a mixture of four carbohydrates using LEDIF detection. Conditions: fused silica capillary, ltot: 65 cm × 50 µm id, leff: 45 cm, BGE: (A) 25 mM ammonium acetate (pH 4.5), (B) 25 mM ammonium acetate-0.3% PEO (pH 4.5), (C) 40 mM EACA (pH 4.5), (D) 40 mM EACA-0.02% HPMC (pH 4.5), separation voltage: −30 kV, injection: 50 mbar × 2 s, preconditioning: 1 M HCl for 5 min, BGE for 5 min washing. LEDIF detection was performed at 480 nm excitation/520 nm emission. Sample: 1: fructose, 2: glucose, 3: mannose, 4: maltose.
Separations 10 00150 g002
Figure 3. The analysis of isomaltotetraose (A) and isomaltotriose (B) by CZE-LEDIF. The analysis conditions were the same as stated at Figure 2B.
Separations 10 00150 g003
Figure 4. CZE-LEDIF determination of APTS-labeled sugars in model solutions and in honeys. (A) G7 malto-oligosaccharide ladder, (B) mixture solution of arabinose (1), xylose (2), ribose (3), galactose (4), maltose (5), (C) phacelia honey, (D) acacia honey, (E) honeydew honey. The analysis conditions were the same as stated at Figure 2B.
Separations 10 00150 g004
Table 1. Analytical performance data of fructose and glucose. The analysis conditions were the same as stated at Figure 2B.
GlucoseFructose
Regression equation0.078x − 0.27360.044x − 11.39
Correlation coefficient0.99880.9916
LOD (ng/mL)8.898.76
LOQ (ng/mL)29.629.2
Range (ng/mL)30–100030–1000
RSD %, (N = 5)time0.4960.509
area2.482.82
Theoretical plate number 110,140215,657
Table 2. The comparison of fructose and glucose content and their proportion in phacelia honey, acacia honey, honeydew honey, n = 3 (each of them). The analysis conditions were the same as stated at Figure 2B.
Concentration (m/m%)
Phacelia honeyAcacia honeyHoneydew honey
Glucose37.8 ± 1.526.7 ± 1.119 ± 0.76
Fructose32.7 ± 1.343.2 ± 1.727.1 ± 1
Fructose/Glucose0.861.611.42
n = 3
Disclaimer/Publisher’s Note: The statements, opinions and data contained in all publications are solely those of the individual author(s) and contributor(s) and not of MDPI and/or the editor(s). MDPI and/or the editor(s) disclaim responsibility for any injury to people or property resulting from any ideas, methods, instructions or products referred to in the content.

