Abstract
In this project, a prompt, efficient, and effective method for Cd2+ ions extraction from different food and water samples using magnetic dispersion-based solid phase extraction by functionalized iron oxide nanoparticles was proposed. Iron oxide nanoparticles were synthesized through the co-precipitation method followed by functionalization with tetraethyl orthosilicate (TEOS) and 3-aminopropyl silane (APTES) to obtain Fe3O4@SiO2@APTES. This composite was characterized through different techniques, including vibrating sample magnetometer, dynamic light scattering, zeta potential, FTIR, SEM, XRD, and BET. Variables studied were pH, temperature, sorbent amount, sonication time, and sample and eluent volume affecting the sorption efficacy of freshly synthesized sorbent. Plackett–Burman design was utilized for the identification of significant factors for microextraction of target analyte, while the central composite design was utilized for the optimization of significant factors. Detection and quantification limits obtained were 0.17 and 0.58 μgL−1, respectively, with an enhancement factor of 83.5. Under optimum conditions, Fe3O4@SiO2@APTES showed good stability even after >80 adsorption/desorption cycles run while maintaining over 96% analyte recoveries. The developed method was validated by assessing certified reference materials and standard addition methodology for Cd2+ detection in real samples. To confirm the precision, repeatability (RSDr) and reproducibility (RSDR) were calculated and found as <3.0 (n = 7) and <7.5 (n = 15), respectively. Furthermore, in accordance with the ISO/IEC 17025 recommendations, the validation was also confirmed through a “bottom-up” approach while considering all possible uncertainties in data.
1. Introduction
Heavy metals exist naturally in the environment, but anthropogenic activities elevate the concentration of these elements [1]. These elements cause detrimental effects on human health as well as on the biotic and abiotic environment causing several diseases in living organisms and lowering the quality of water. Pollution caused by heavy metals in the water bodies is a serious environmental threat, as they are highly toxic even at low concentrations, tend to bioaccumulate in tissues, and are non-biodegradable [2]. Effluents from industries, sewage systems, and tanneries contaminate water bodies. Among the commonly found heavy metals in water bodies, cadmium toxicity is one of the most prevalent problems globally, and its intake causes chronic pulmonary diseases, renal failure, and prostate diseases. Cadmium toxicity also causes several syndromes, liver impairment, and mutation in genes that causes problems in the development of the fetus [3,4]. Cadmium poisoning is a global health-related problem and is considered harmful to multiple organs. Cadmium exposure may occur through water, food, air, and even soil [5]. Some drugs and nutritional supplements may also lead to Cd contamination [6]. Its chronic exposure can directly affect the central nervous, cardiovascular, respiratory, reproductive, and excretory system and may cause cancer [5]. Cadmium exposure occurs through consuming contaminated food and water, leading to longstanding health problems.
Many classical methods have been used to reduce the contamination caused by heavy metals, including membrane separation, filtration, electrochemical treatment, ultrafiltration, ion exchange as well as adsorption [7]. Solid-phase extraction is widely employed for heavy metal remediation for several samples, including aqueous media [8]. Sorbents for the removal of heavy metals include a variety of materials, clays, bio-composites, and activated carbons [9]. These materials are not generally used for the adsorption process due to low efficiency, smaller adsorption capacity, and unavailability in the bulk form [10]. To cope with these limitations and ensure safe methods for conditioning wastewater, nanoparticles, and nanocomposites are widely used, such as composite made up of iron oxide chitosan zero-valent iron nanocomposites and activated carbon, silica-coated iron oxide nanocomposites, which are effective due to their high adsorption capacity [11,12].
Magnetic solid-phase dispersion is widely used for the remediation of heavy metals from waste waters using nanosorbents as these particles provide high surface area, offers higher adsorption capacity, and are cost-effective materials that efficiently extract heavy metal ions even if present in trace amount [7,13]. Iron oxide-based nanoparticles have a great potential for the removal of contaminants because they are cost-effective, easily synthesized, and modified [14]. Properties of iron oxide nanoparticles include a higher surface area-to-volume ratio and less toxicity in nature; they are chemically inert, biocompatible, and super-paramagnetic in nature [15]. Iron oxide nanoparticles attained prime importance due to easy separation of particles from sample solution when an external magnetic field is employed for regeneration [16]. Several methodologies have been used to synthesize nanoparticles, including co-precipitation, emulsion, sol-gel process, hydrothermal, and chemical vapor deposition, to obtain desired properties, tunable size, structure, and shape [17].
The co-precipitation process for the synthesis of iron oxide nanoparticles is the easiest and quite proficient chemical route. Synthesis of magnetite typically takes place by mixing a stoichiometric mixture of ferric and ferrous salts in aqueous media [18]. By regulating pH, temperature, nature of salt used, and ionic strength, the size and structure of nanoparticles are easily tuned. The co-precipitation process involves the synchronized procedures of growth coarsening, agglomeration, and nucleation process [19]. However, naked iron oxide nanoparticles are prone to oxidation and form aggregates [20]. Surface modification of magnetic nanoparticles with a particular ligand enhances the selectivity and makes it a suitable sorbent. Iron oxide nanoparticles are modified by different methods, for example, the addition of functionalities such as carboxylic group, aldehydes, doping of metal ions, and coating of organic polymers, surfactant, and silica [21]. Inert coating of materials such as SiO2 for surface modification of magnetic iron oxide nanoparticles is employed, which inhibits the formation of aggregates in liquid media and enhances chemical stability. Metal iron oxide nanoparticles have adsorptive properties, which can be improved by adding functional groups to their surface. Iron oxide coated with silica results in less agglomeration, higher stability, and minimum cytotoxic effect [22]. Different silanes are employed for introducing silica on iron oxide nanoparticles, such as tetraethyl orthosilicate (TEOS), aminopropyl silane (APTES), sodium silicate, etc. [23,24].
Analytical data are usually accompanied by several known and unknown errors called uncertainties. The presence of such errors leads to the dispersion of results; thus, their exact estimation is of prime importance. So far, the estimation of uncertainty has been applied to the analytical results only [25]. In the case of the determination of trace analytes, validation through the estimation of uncertainty is considered a unique tool, which can be performed either by bottom-up or top-bottom approach. The former approach measures all possible uncertainty sources individually, while the latter combines all sources together [26,27,28].
In this work, amine functionalized Fe3O4@SiO2 nanoparticles were utilized as sorbents for fast and efficient preconcentration of Cd2+ ions. Synthesized nanosorbent was characterized by Fourier transformed infrared (FT-IR) spectroscopy, SEM analysis, and XRD spectroscopy. Magnetic properties, zeta potential, and hydrodynamic size of the sorbent were also studied. Functionalization of the sorbent enhanced its stability and adsorption capacity. The Plackett–Burman design was utilized to find out the optimum conditions for the adsorption of Cd2+ ions via response surface methodology [29]. Finally, synthesized nanosorbent was applied for preconcentration of Cd2+ ions in different water and food samples.
2. Experimental Procedure
2.1. Reagents and Solutions
All reagents utilized were of analytical grade. Fe(NO3)3.9H2O, FeSO4.7H2O, NaOH, tetraethyl orthosilicate (TEOS), 3-aminopropyl silane (APTES), ethanol, ammonium hydroxide, potassium hydroxide, and hydrochloric acid were purchased from Merck (Darmstadt, Germany) and used without further purification. A standard solution of Cd2+ of 1000 mgL−1 was purchased from Fluka Kamica (Buchs, Switzerland).
2.2. Instrumentation
For FT-IR analysis, PerkinElmer UATR Spectrum Two™ was used. The crystalline structure and phase of IONPs were analyzed by using PANalytical X-ray diffractometer model 3040/60 X’Pert PRO operated at 45 kV and 40 mA source having CuKα (λ = 1.54 Å) radiation at step width of 0.02° over angle range of 10–80°. SEM analysis of iron oxide and functionalized iron oxide nanoparticles was carried out by JSM5910 manufactured by JEOL, Japan, with the energy of 30 kV, whose maximum magnification is 300,000× with the maximum resolving power of 2.3 nm.
Dynamic light scattering and zeta-potential measurements were performed via Zetasizer Nano ZSP from Malvern Instruments (Malvern Panalytical Ltd, Malvern, Worcestershire, UK) with the aid of Malvern Zetasizer software (v7.13). The specific surface area of Fe3O4@SiO2@APTES was assessed through BET (Autosorb-iQ-MP/XR by Quantachrome Instruments, Anton Paar QuantaTec Inc. Florida, Boynton Beach, FL, USA) along with N2 as adsorbate at 77 K. Magnetic parameters were investigated through vibrating sample magnetometer (Model-EV9) with ±15 KOe applied field at 25 °C. For the determination of preconcentrated Cd2+ ions flame atomic absorption spectrometer (PerkinElmer AAnalystTM 700, (PerkinElmer Inc., Waltham, MA, USA) was used.
2.3. Synthesis of Surface Modified Iron Oxide Nanoparticles (Fe3O4@SiO2@APTES)
2.3.1. Synthesis of Iron Oxide Nanoparticles
Synthesis of iron oxide nanoparticles was carried out by using the co-precipitation method. The aqueous solution with 0.02 M of Fe(NO3)3.9H2O and 0.01 M was prepared. The solutions of 0.02 M of Fe(NO3)3.9H2O and 0.01 M FeSO4.7H2O were mixed together in a ratio of 2:1. The solution was continuously stirred for better homogeneity at 80 °C for 30 min. Then, the precipitating agent NaOH (3 M) was added dropwise to the solution. The stirring is continued for 2 h at 80 °C at pH 11. Synthesized precipitates were filtered and washed several times with distilled water. The nanoparticles were dried overnight at 80 °C in the electric oven. The nanoparticles were obtained in bulk form and were ground with the help of a pestle and mortar [2,15]. A percent yield of 95.7% was obtained for Fe3O4 through the co-precipitation method.
2.3.2. Surface Modification of Iron Oxide Nanoparticles
Tetraethyl orthosilicate (TEOS) and ethanol were dissolved in a proportion of 1:1. 1 g of Fe3O4 was added to a 15 mL suspension of TEOS and ethanol. Ammonium hydroxide was added to this dispersion to adjust pH 11. The mixture was continuously stirred magnetically for 24 h. The product obtained was silica-coated iron oxide nanoparticles (Fe3O4@SiO2) which were washed numerous times with ethanol and water. The product was dried at 60 °C in an electric oven [30]. The yield for Fe3O4@SiO2 at the end of this step was 91.8%.
2.3.3. Functionalization of Fe3O4@SiO2 with APTES
Briefly, 1 g of silica-coated iron oxide nanoparticles was dispersed in a mixture of ethanol, water, and APTES taken in a ratio of 1:1:1. The mixture was stirred for 5 h at 50 °C. pH of the mixture was adjusted to 11 by adding 0.2 M solution of KOH dropwise. The product obtained was washed with a mixture of ethanol and distilled water several times. Amine functionalized silica-coated iron oxide nanoparticles obtained were dried at 60 °C in an electric oven. The overall percent yield observed was 89.7% for Fe3O4@SiO2 @APTES.
2.4. Microextraction Procedure for Cadmium Ions
The extraction of Cd2+ ions from aqueous solutions was studied in batch mode adsorption. During the sorption step, 50 mgL−1 of Cd2+ solution was used. pH of the Cd2+ solution was adjusted using a 0.1 M solution of sodium hydroxide and hydrochloric acid which was added dropwise. The synthesized sorbent was added to the analyte solution, which was sonicated for a few minutes to ensure complete adsorption of Cd2+ from the solution. Finally, the beaker containing the mixture was left undisturbed until the sorbent aggregated and settled at the bottom of the beaker. Clear solution was disposed of. Then 0.1 M HCl was added to the sorbent for elution of Cd2+ ions, and the mixture was shaken and kept under the influence of a magnetic field to aggregate the sorbent. The clear solution obtained was taken out and analyzed by FAAS to determine the amount of Cd2+.
2.5. Experimental Design Methodology
To study the effect of variables that influence the process of adsorption, each factor must be studied in correspondence with non-linear effects and the interaction among these factors. Multivariate experimental design, in comparison with traditional approaches, permit the optimization of more than one variable simultaneously. This procedure is quick as the number of experiments is reduced, making it cost-effective as well.
2.5.1. Plackett–Burman Design
Plackett–Burman design is an optimization tool for screening significant factors which have an impact on the efficacy and potency of the proposed technique. Minitab software v17.1 (Minitab Inc., State College, PA, USA) was used for designing the experiment. This design yields a proficient, prompt, and potent optimization approach contrary to the univariate process. The two levels of Plackett–Burman design with a set of twenty-four experiments were used to identify the optimum factors. The empirical data were evaluated using Minitab 17.1.
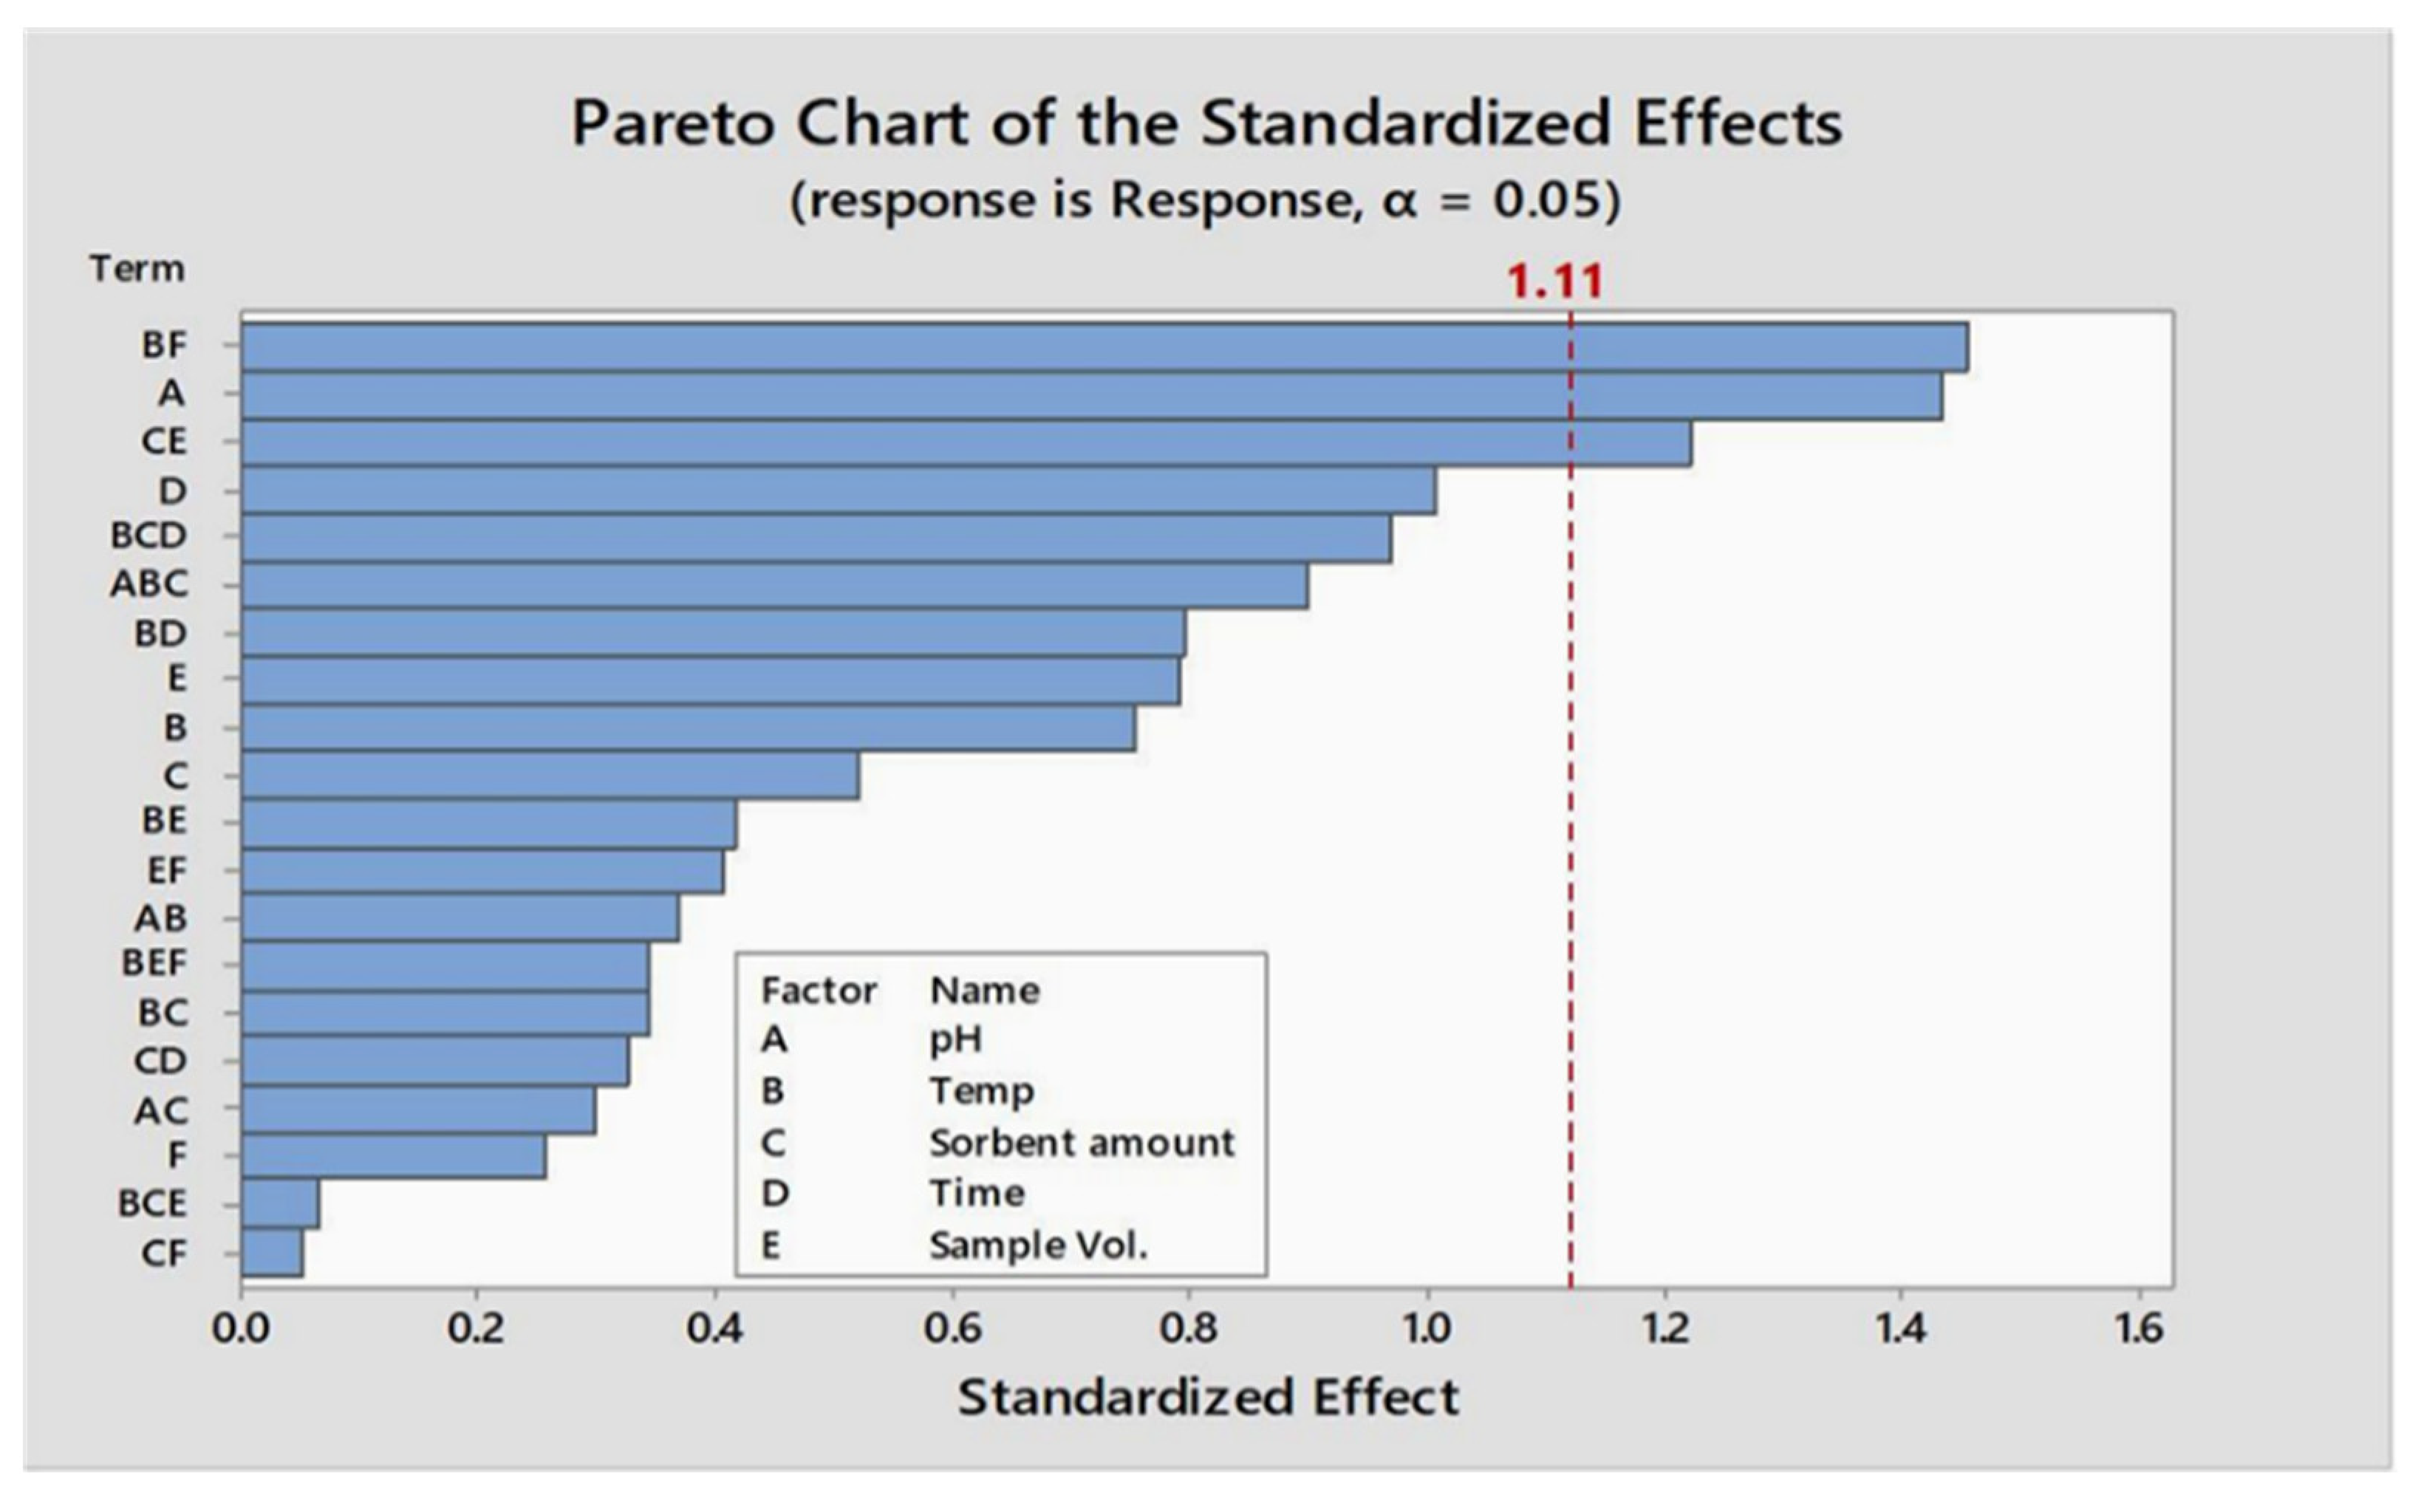
Lower (−) and higher (+) levels of factors and results obtained during their optimization through the Plackett–Burman matrix are shown in Table 1a and b, respectively. A standardized pareto chart is devised to illustrate the results of the Plackett–Burman design (Figure 1). Parameters that have an impact on adsorption efficacy on the devised procedure are evident and were identified where the absolute magnitude of given parameters are represented by the horizontal bars. The fitted quadratic response model is shown below as Equation (1):

Table 1.
(a) Factors and levels used in the factorial design. (b) Design matrix and the results of % R (n = 5).

Figure 1.
Pareto chart of the factorial experimental design for the analysis of parameter.
Here “y” is the predicted response, while xi and xj are coded values of independent factors. Regression coefficients for intercept, linear, quadratic, and interaction terms are shown as β0, βi, βij, and βii, respectively, while “ε” is the random error.
2.5.2. Central Composite Design
The CCD method involves the combination of a two-level factorial design and some extra points, i.e., star points with at least one central point of the experiment. Many different points, such as rotatability and orthogonality, are obtained from this reference central point to adjust quadratic equations. The central composite design is the most recognized experimental design for second-order models, as it allows one to draw a conclusion with a small set of experiments and provides good results. In this study, Minitab 17.1 version and STATISTICA were used for analyzing data obtained from experimental design and response obtained.
3. Results and Discussions
3.1. Characterization Studies
3.1.1. Fourier Transformed Infrared Spectra
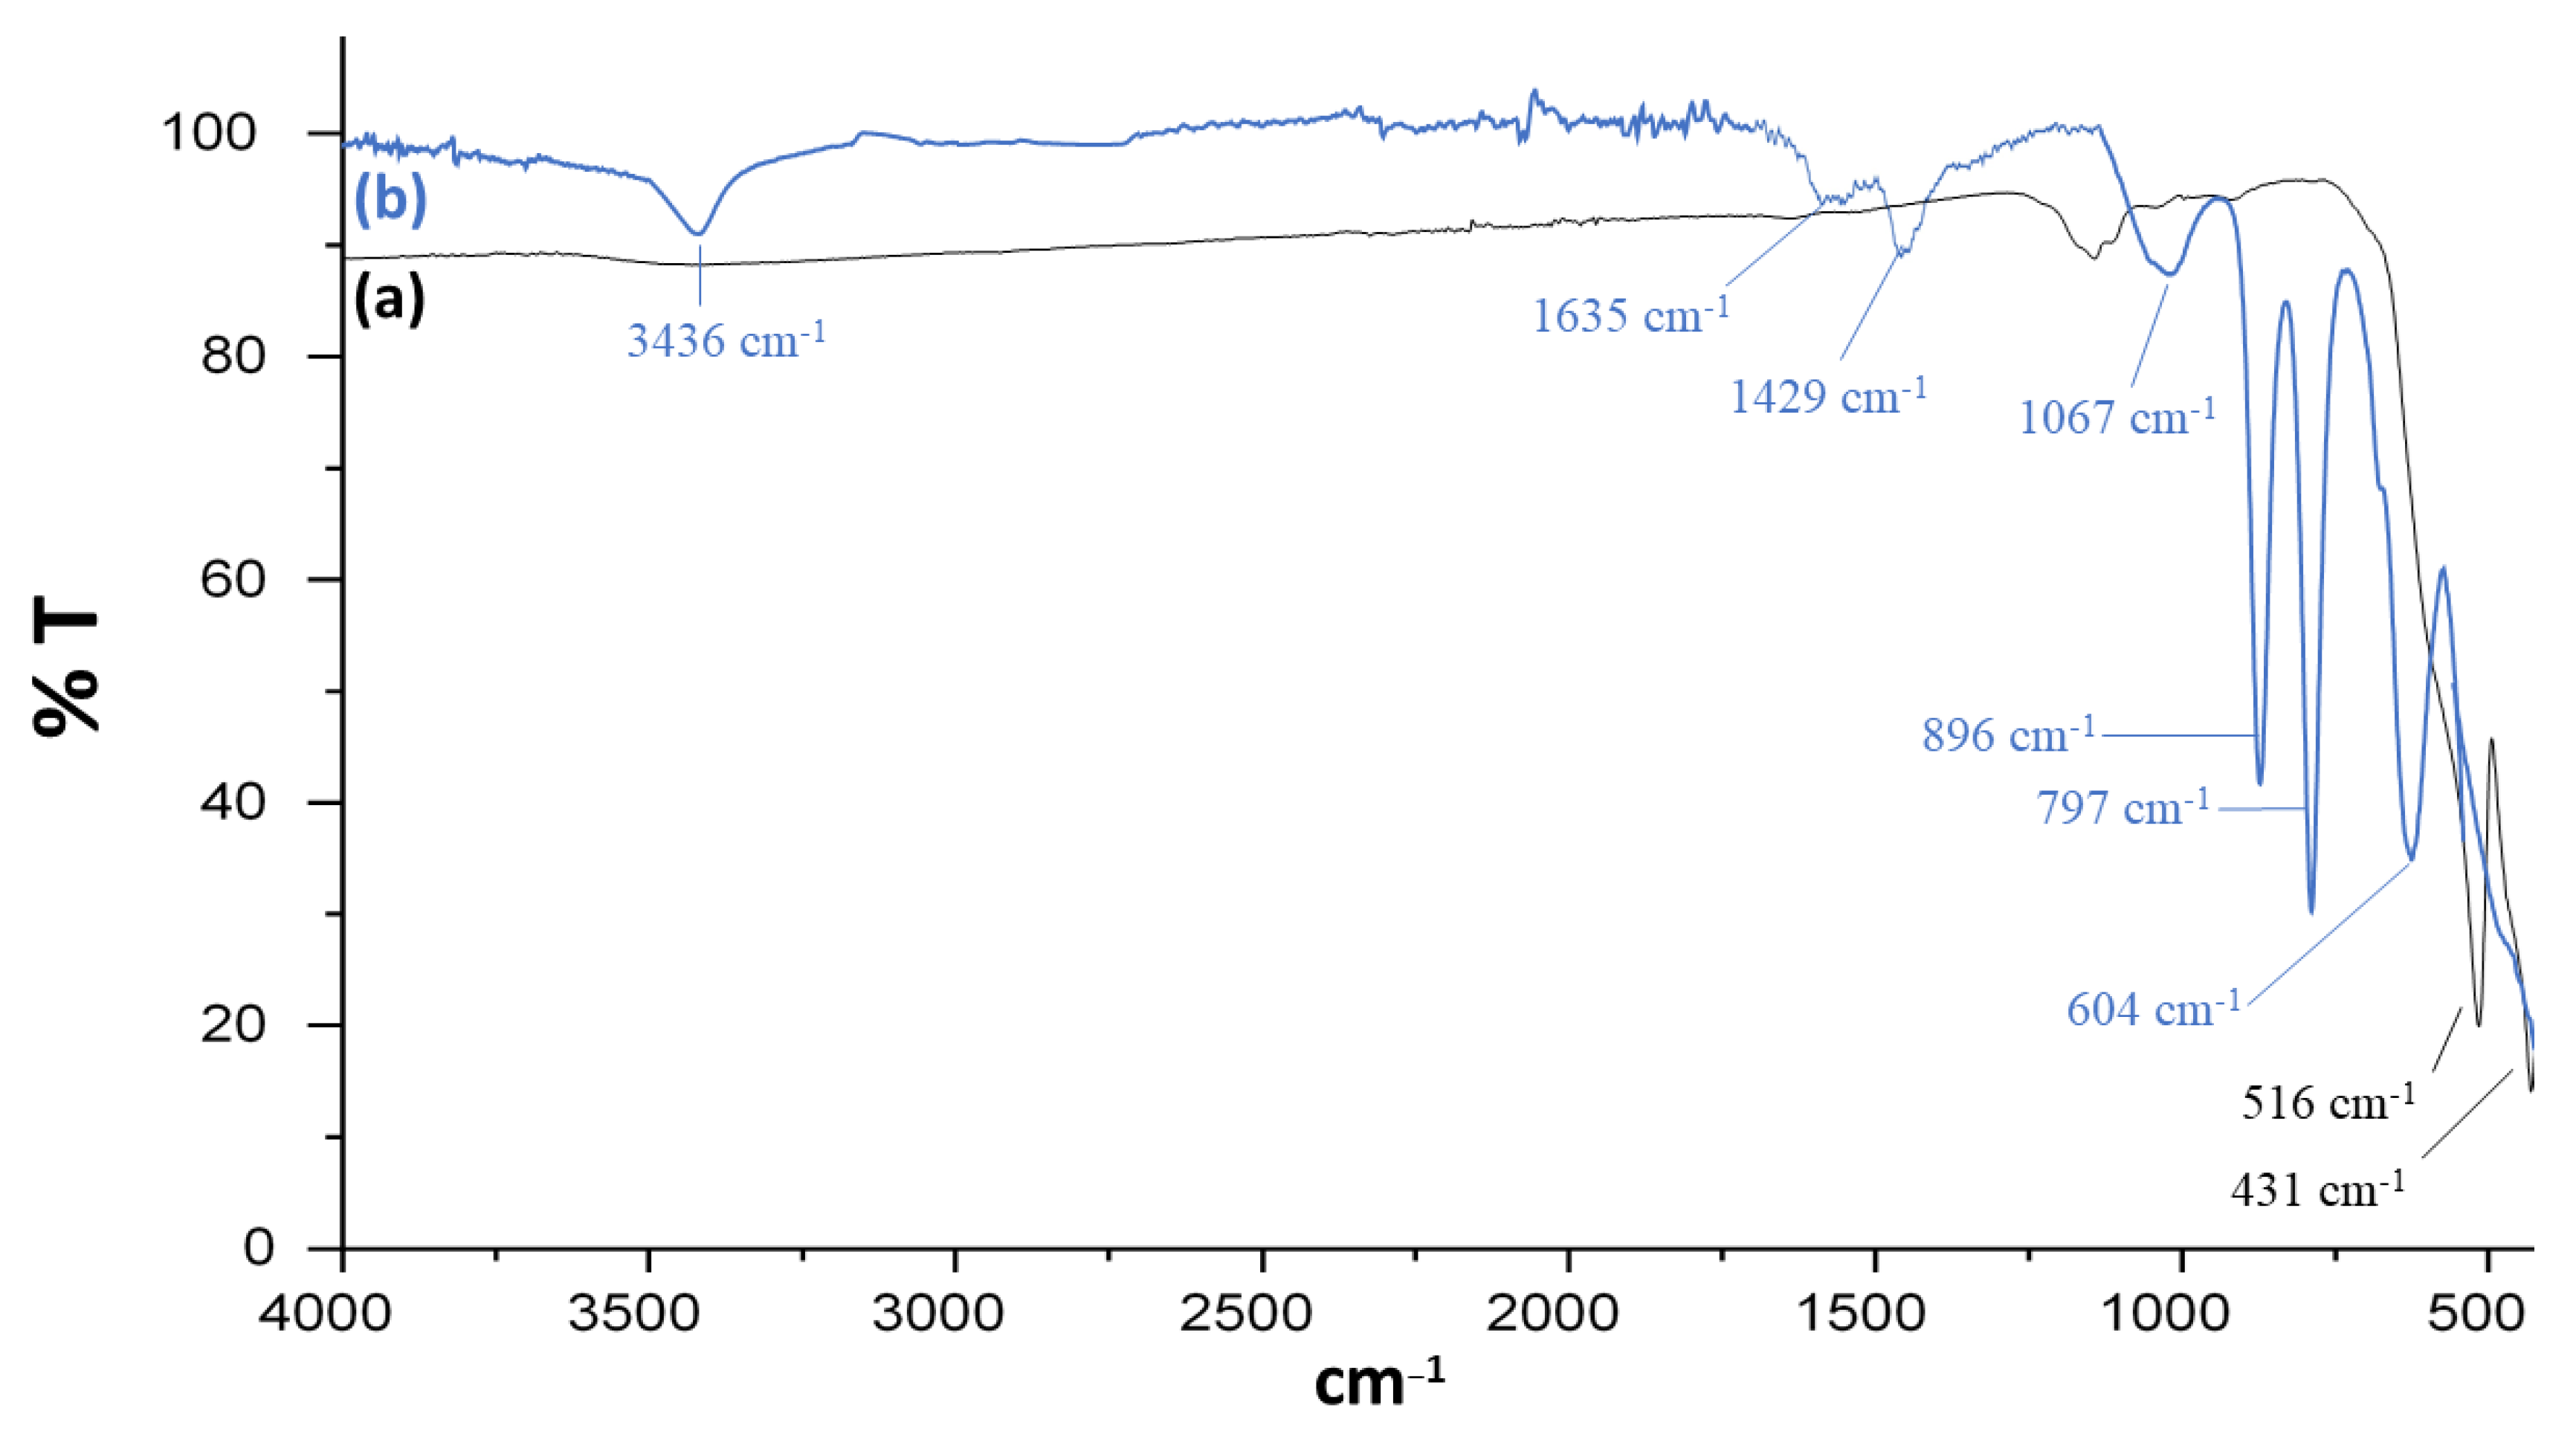
FT-IR spectra were obtained between 500 and 4000 cm−1. In Figure 2a, the presence of sharp peaks at 516 and 431 cm−1 confirms the presence of the Fe-O bond in bare iron oxide nanoparticles. Spectrum of Fe3O4@SiO2@APTES (Figure 2b) shows new peaks, which indicates the presence of Si-O and Si-O-Si bonds which is the result of surface modification of iron oxide nanoparticles. Band at 604 cm−1 is associated with the vibration of the Fe-O bond. The peaks at 797 and 896 cm−1 show symmetric and asymmetric vibrations of Si-O-Si, respectively [31,32]. The band at 1067 cm−1 is responsible for the asymmetric stretching vibration of Si-O [33]. The bands at 3436 cm−1 and 1635 cm−1 could be attributed to the presence of -NH2 stretching and bending, respectively [34,35]. Similarly, the absorption band at near 1429 cm−1 may be attributed to bending vibrations of the -NH2 group in the Fe3O4@SiO2@APTES composite [36].
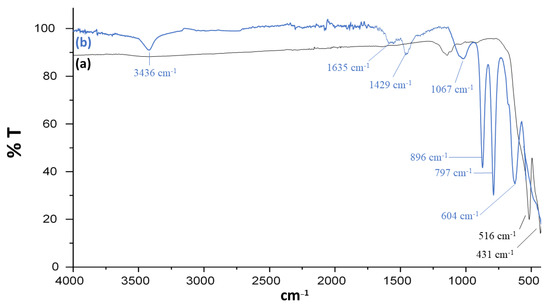
Figure 2.
FT-IR spectra of (a) Fe3O4 and (b) Fe3O4@SiO2@APTES.
3.1.2. SEM
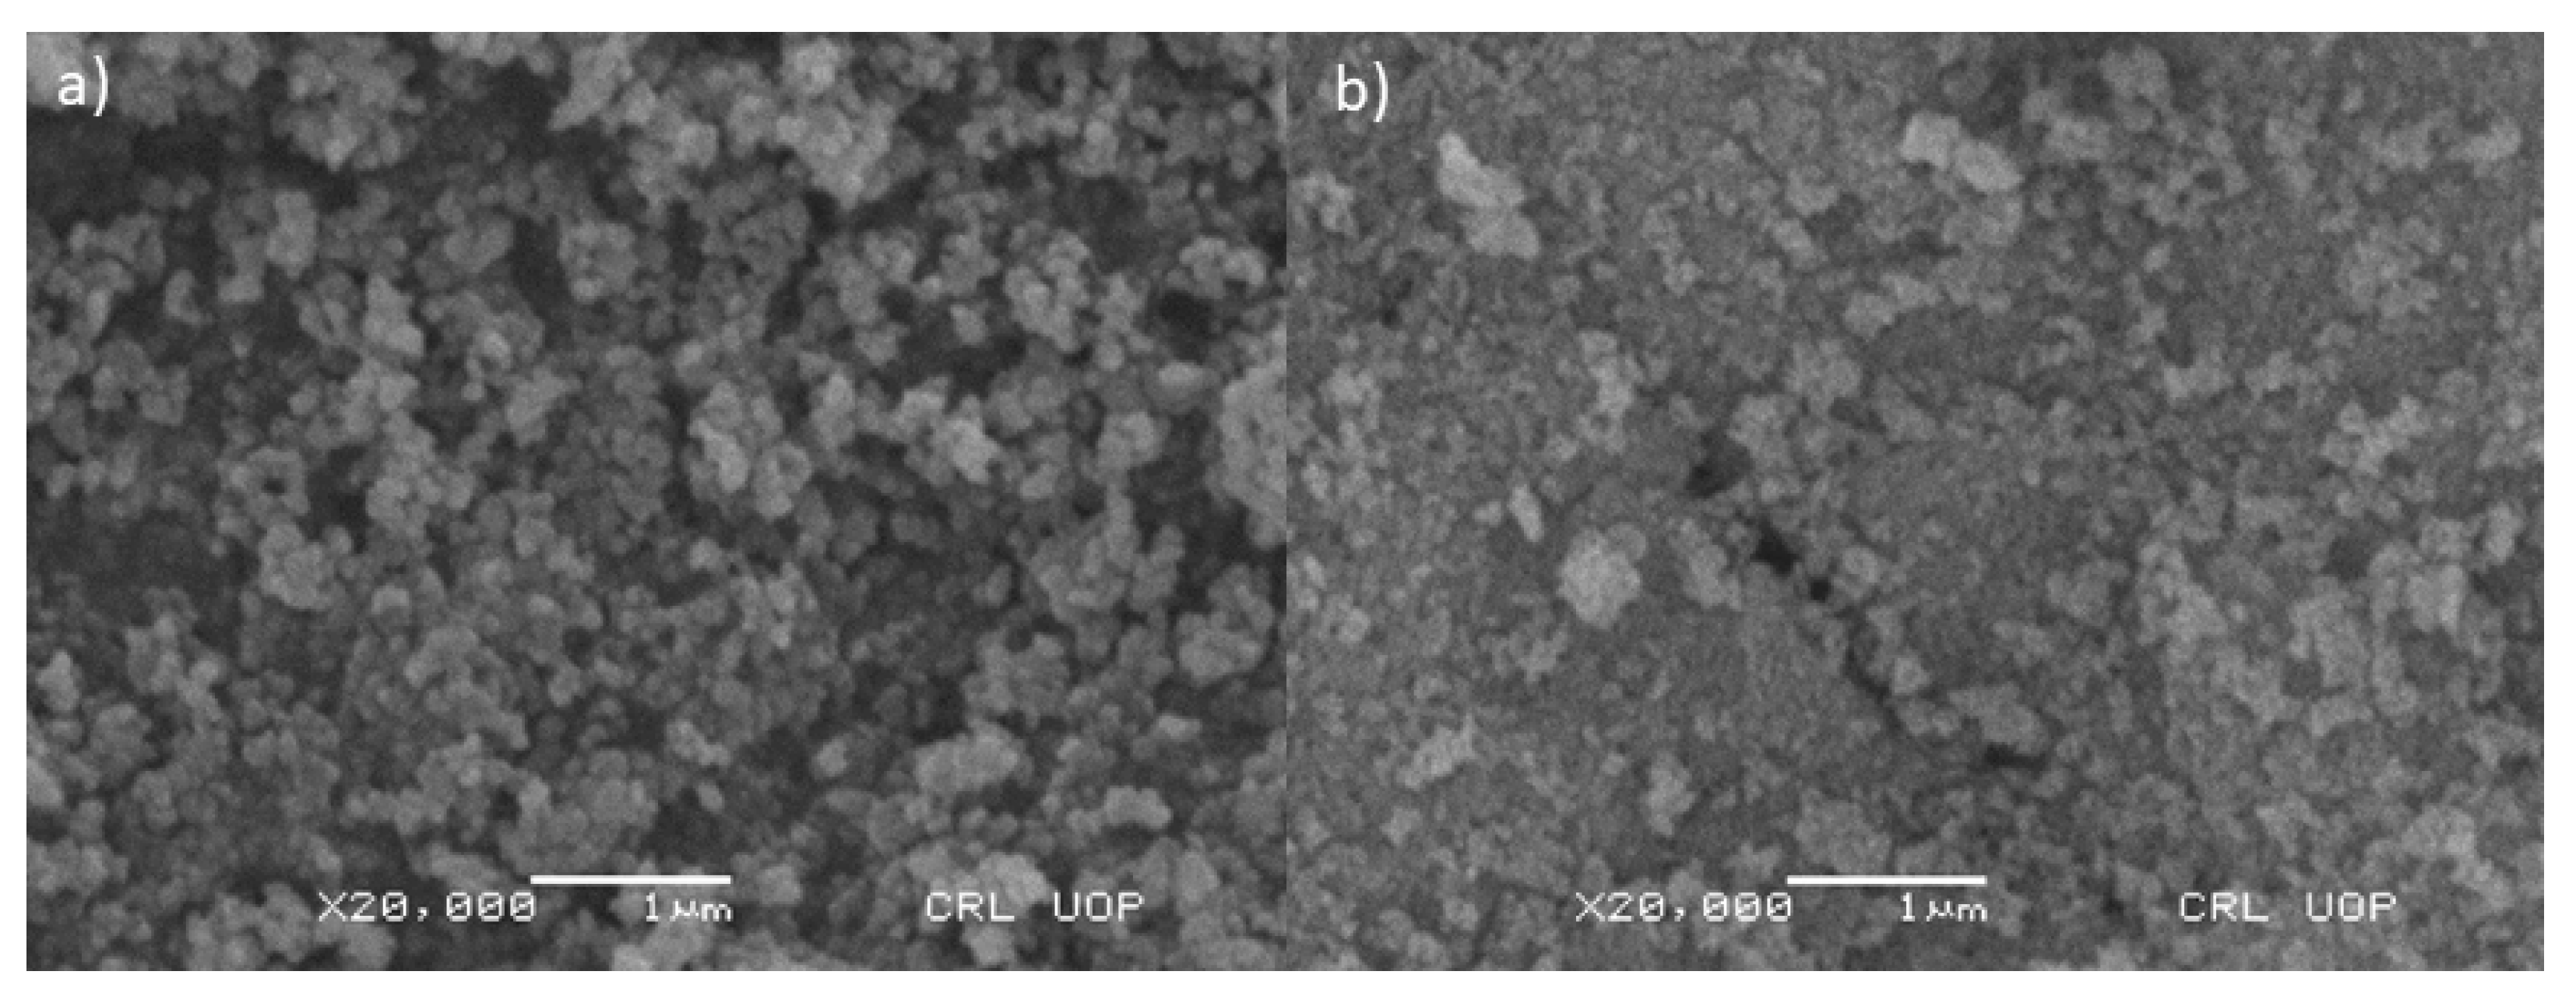
SEM images obtained show that the particles of iron oxide nanoparticles (Fe3O4) and functionalized iron oxide nanoparticles (Fe3O4@SiO2@APTES) are homogenously distributed. Figure 3a,b confirms that the size of synthesized nanoparticles lies in the range of nanometers. According to the images obtained by SEM analysis, the particles are granular in their morphology. The specific surface area of the adsorbent assessed through BET was found to be 187.5 m2 g−1, whereas the adsorption capacity was 165.2 mg g−1.

Figure 3.
SEM micrographs of (a) Fe3O4 and (b) Fe3O4@SiO2@APTES.
3.1.3. X-ray Diffraction Pattern
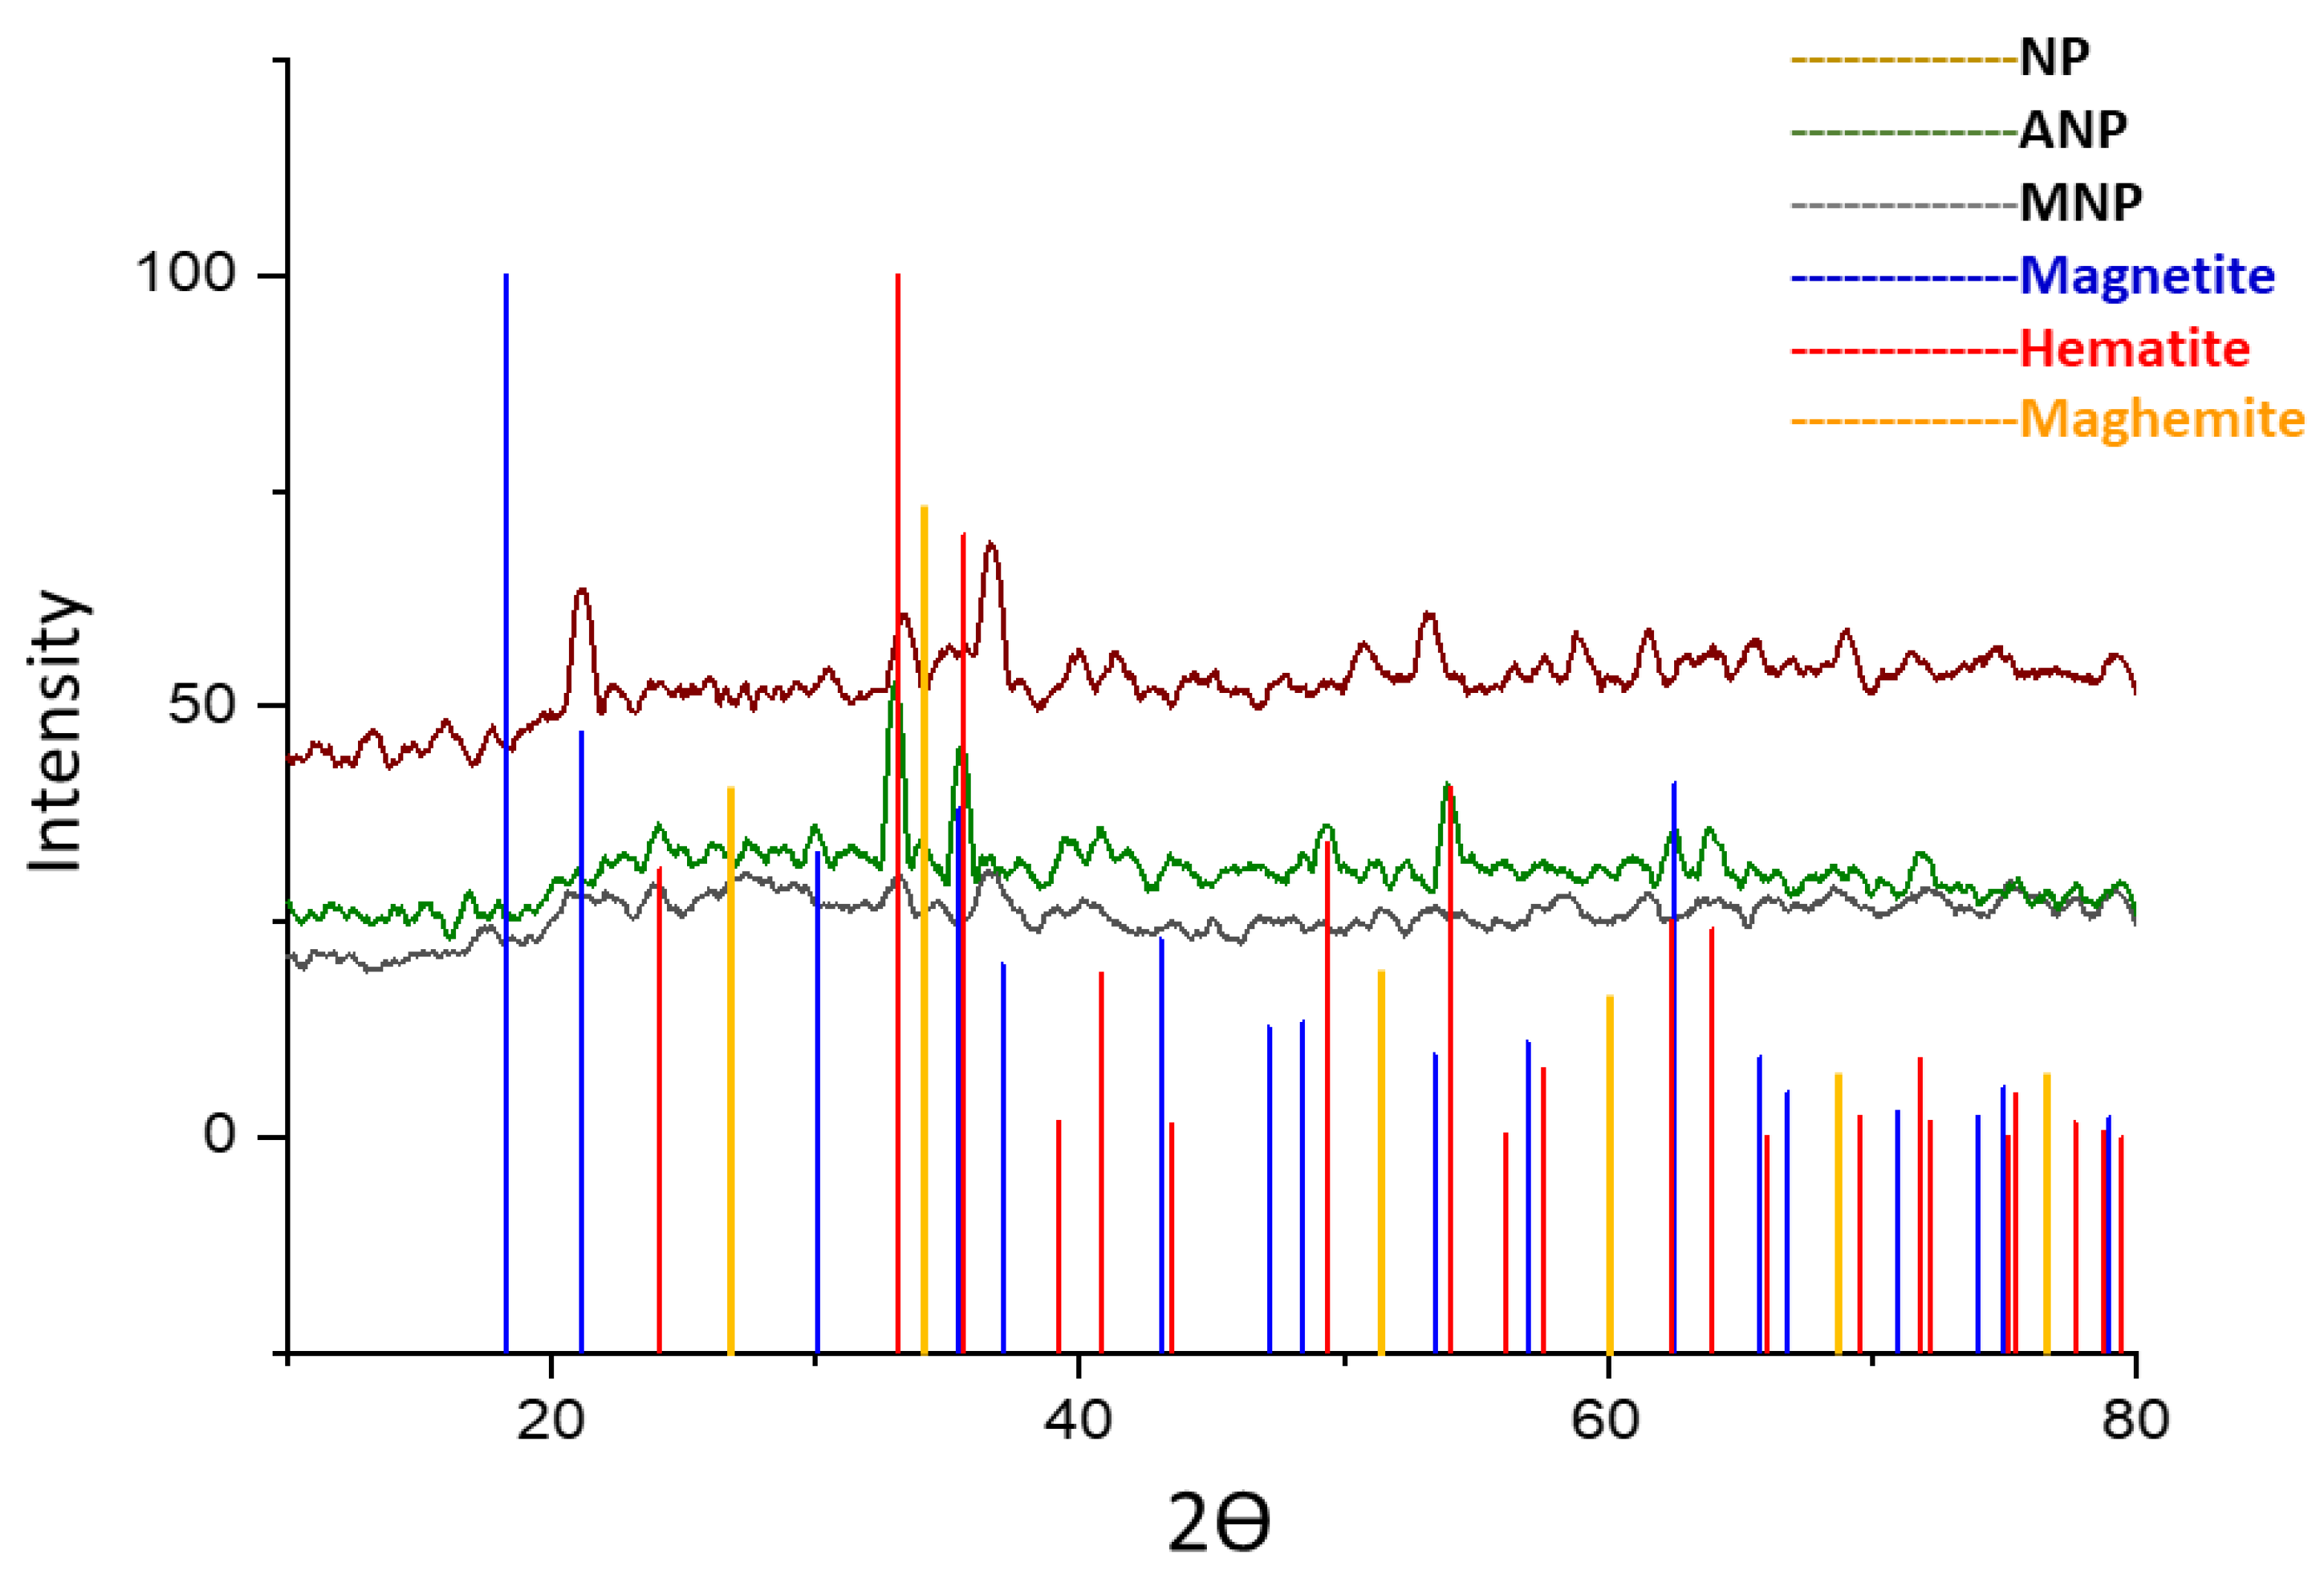
The synthesized nanoparticles, when analyzed with XRD analysis, revealed that the sample is amorphous in nature because the product was not subjected to heat treatment [37]. The results in Figure 4 indicated the presence of short-range crystal order within the crystals of a few net plane periods resulting in the line broadening β of reflections being larger. Surface modification of these nanoparticles altered its amorphous nature to crystalline, indicating the presence of Fe2O3 and Fe3O4 mixture as all peaks in the figure could be indexed to Fe2O3 and Fe3O4 the parent nanoparticles of Fe3O4@SiO2@APTES.

Figure 4.
X-ray diffraction patterns for NP (unannealed Fe3O4), ANP (annealed Fe3O4), and MNP (Fe3O4@SiO2@APTES).
3.1.4. Dynamic Light Scattering Analysis
Hydrodynamic properties of both bare iron oxide nanoparticles (Fe3O4) and modified iron oxide nanoparticles (Fe3O4@SiO2@APTES) were studied by light scattering. As shown in Figure 5a,b, the hydrodynamic diameter of bare iron oxide nanoparticles is 356 nm, which is reduced to 206.9 nm after surface modification. This size reduction renders to increased colloidal stability of nanoparticles. Bare iron oxide nanoparticles have a higher concentration of hydroxyl ions, making them hydrophilic and resulting in greater hydrodynamic size, whereas modified iron oxide nanoparticles lost the hydroxyl ions in the process of condensation, resulting in less hydrophilicity and aggregation, reducing their hydrodynamic size [38].
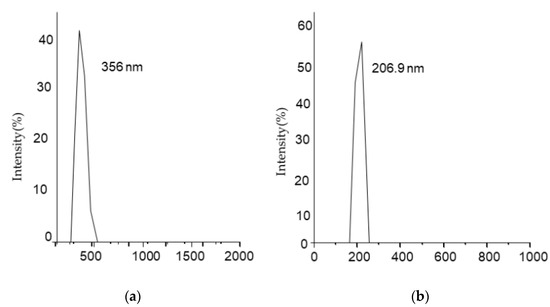
Figure 5.
Dynamic light scattering (DLS) measurement for (a) Fe3O4 and (b) Fe3O4@SiO2@APTES.
3.1.5. Zeta Potential
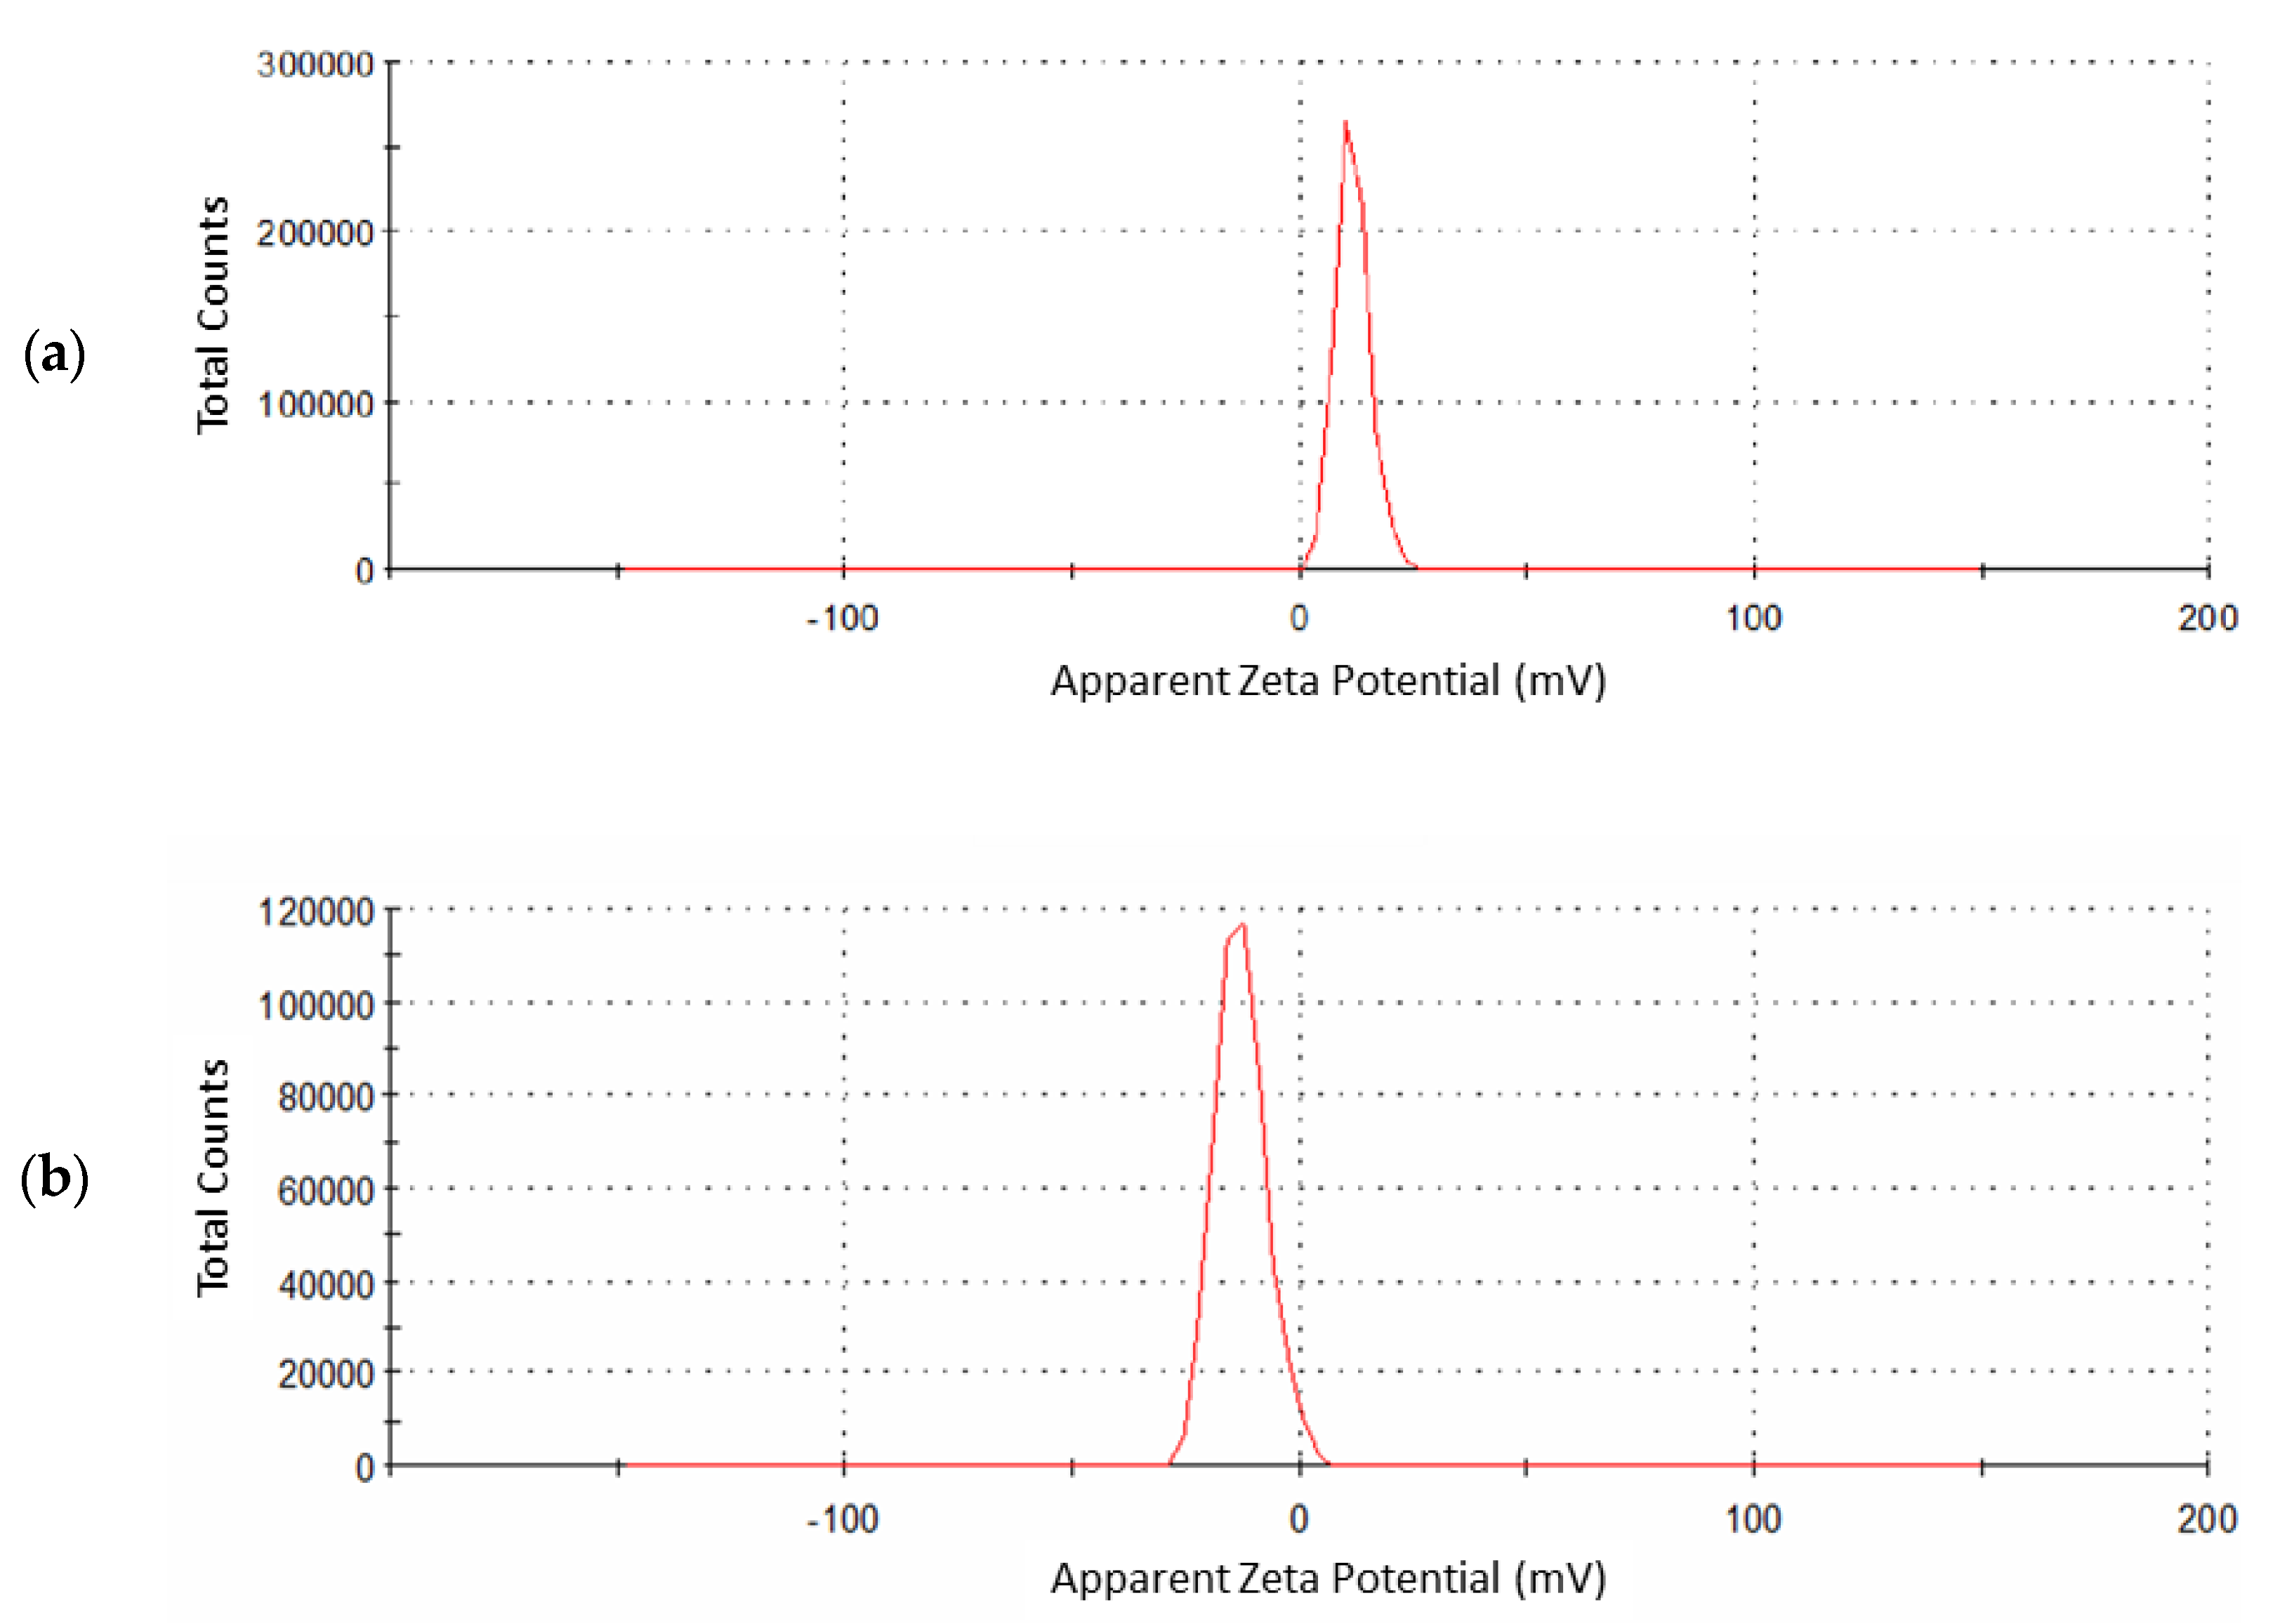
Zeta potential analyzer is used to determine the surface charge of nanoparticles. Bare iron oxide nanoparticles have a +11 mV zeta potential (Figure 6a). As a result of the surface modification of these nanoparticles, zeta potential is decreased to −12.9 mV in the case of Fe3O4@SiO2@APTES (Figure 6b). The negative charge on Fe3O4@SiO2@APTES is one of the prime factors for easy dispersion of these nanoparticles in water, as a negative zeta value results in high stability and good dispersion in aqueous media [39]. During the surface modification of iron oxide nanoparticles, hydroxyl content was reduced; as a result, there was no agglomeration.
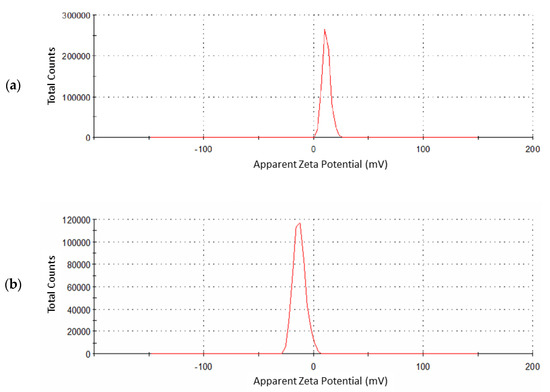
Figure 6.
Zeta potential measurement for (a) Fe3O4 and (b) Fe3O4@SiO2@APTES.
3.1.6. Vibrating Sample Magnetometer
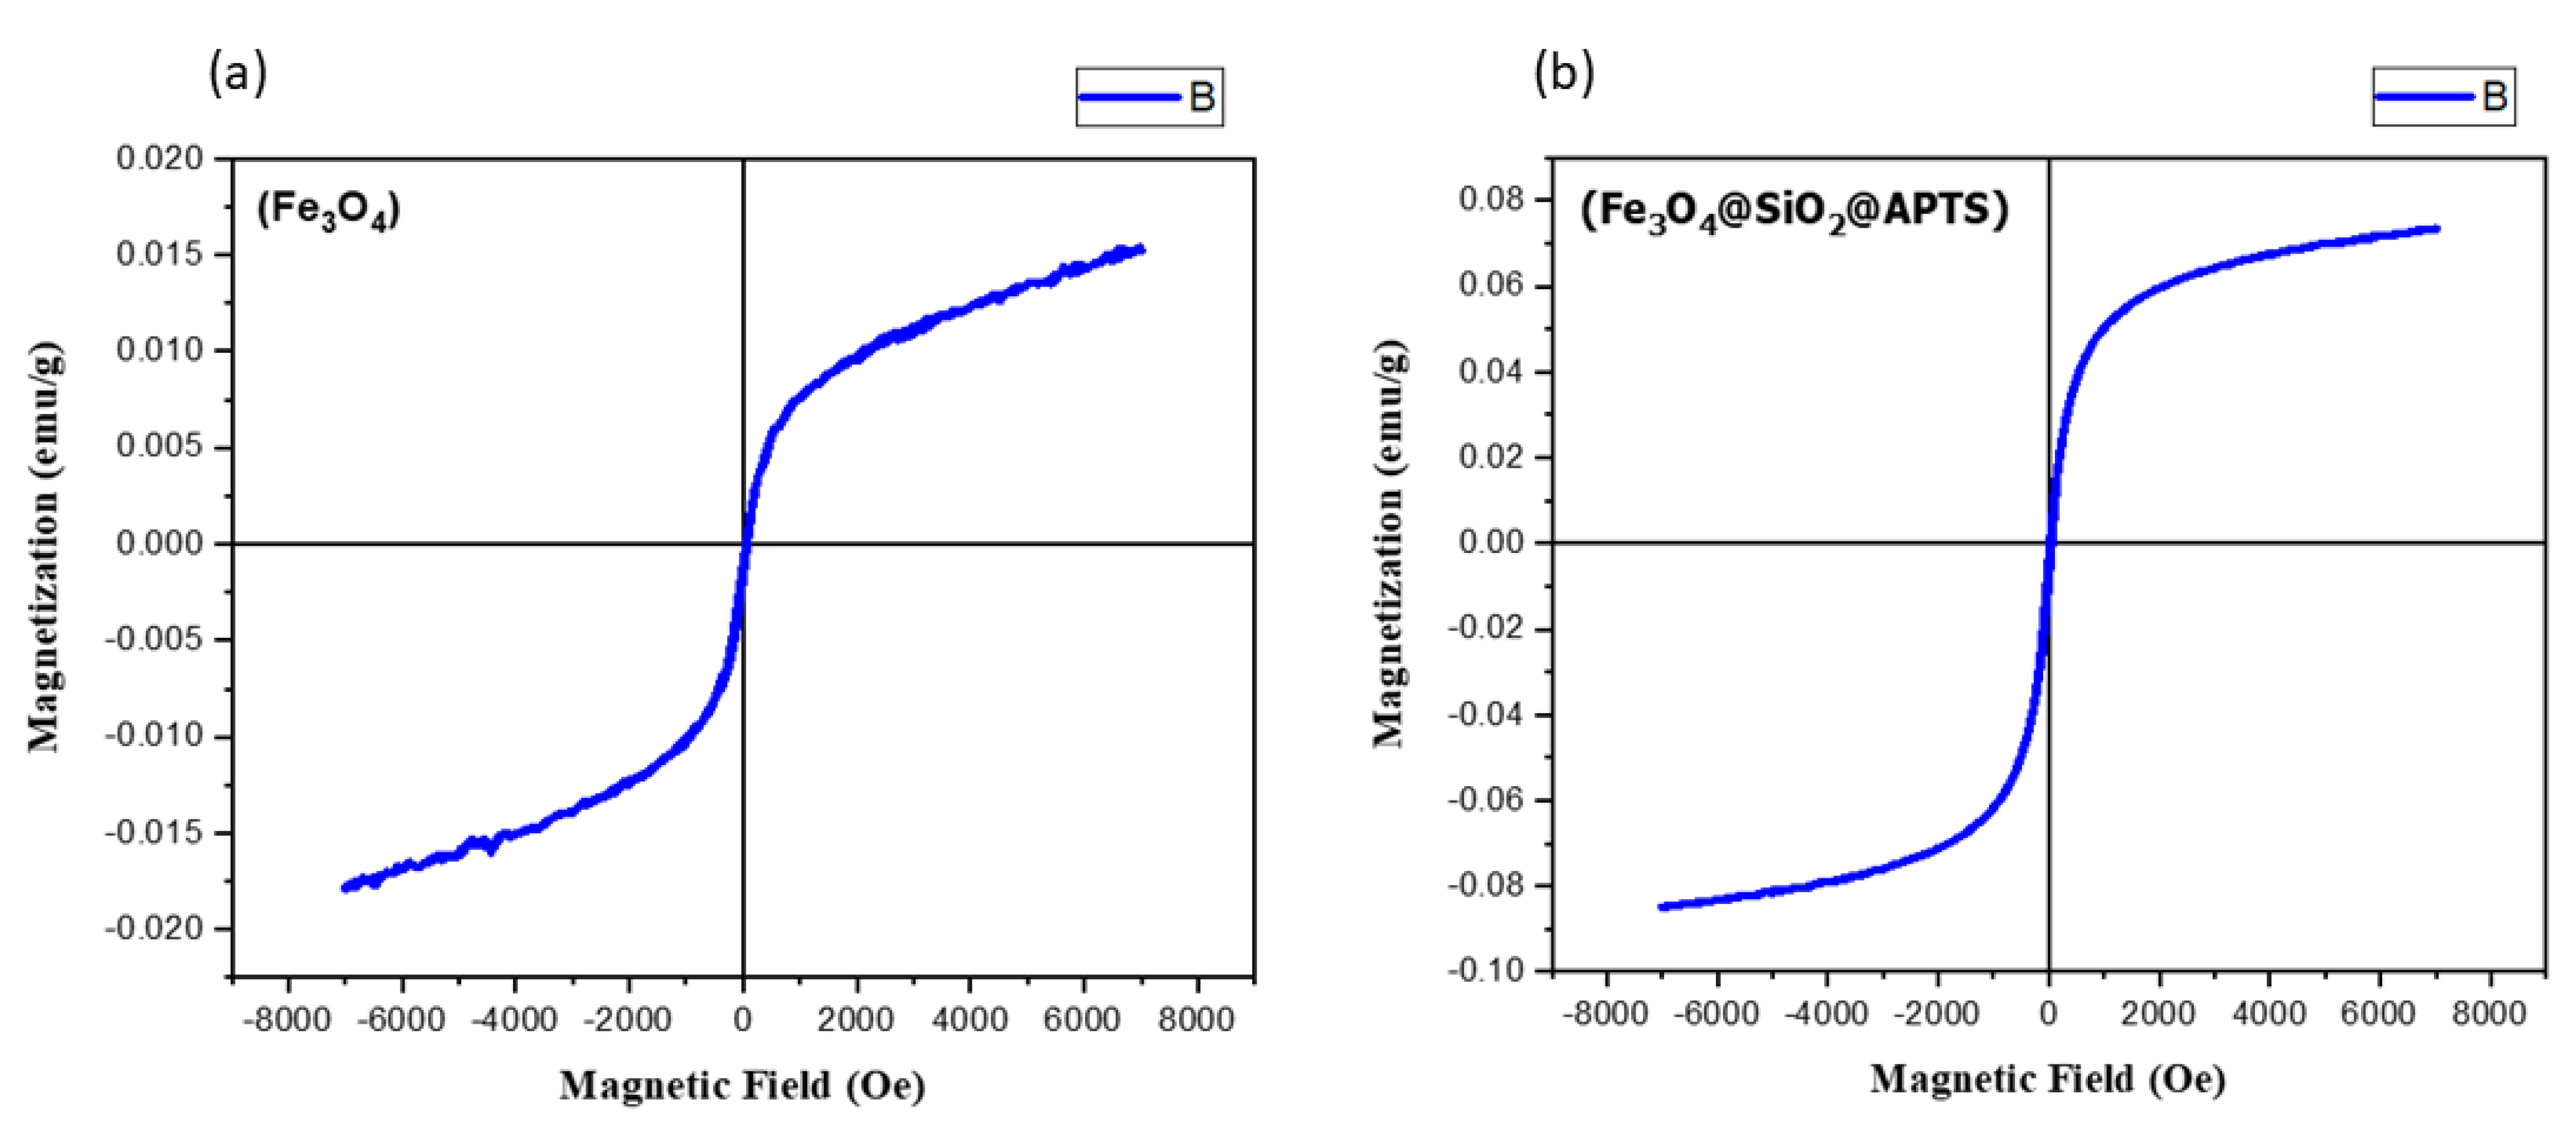
The values of saturation magnetization, remanent magnetization, and coercivity of bare iron oxide nanoparticles (Fe3O4) in Figure 7 show that these nanoparticles are more magnetic in nature than modified iron oxide nanoparticles (Fe3O4@SiO2@APTES). Bare iron oxide nanoparticles are permanent magnets, as they have high remanence and coercivity. The magnetization of nanoparticles is reduced after surface modification of these nanoparticles.

Figure 7.
VSM magnetization curves for (a) Fe3O4 and (b) Fe3O4@SiO2@APTES.
3.2. Optimization of Experimental Parameters via Multivariate Strategy
Analytical parameters that can affect the potency of Cd2+ adsorption by Fe3O4@SiO2@APTES were optimized using a multivariate strategy. Simultaneous optimization of analytical factors yields better recovery of analyte. The optimized parameters were pH, temperature, amount of sorbent, sonication time, the volume of sample, and eluent volume for magnetic dispersion-based solid-phase extraction of Cd2+ ions through Fe3O4@SiO2@APTES.
3.2.1. Central Composite Design
To optimize the factors, a two-level Plackett–Burman design comprising 24 experiments was used. In contrast with full factorial design, the number of experiments is reduced significantly for optimization. Six factors were primarily subjected to optimization. The Pareto chart (Figure 1) revealed that five out of six are significant. Significant parameters were further studied by central orthogonal composite design.
A set of 28 experiments was established via a central orthogonal composite design with 4 degrees of freedom. These experiments were performed for the optimization of conditions for magnetic dispersion-based solid-phase microextraction and confirmation of mutual interaction among these factors. These 28 experiments led to the optimization of significant factors (i.e., pH, temperature, amount of sorbent, sonication time, and eluent volume), and recoveries of Cd2+ are given in Table 2. In all the experiments of CCD 10 mL of sample, volume was utilized for analysis. At the optimal values of these factors, recovery of the analyte is maximum, whereas a decrease in % recovery is observed when any of the factors in the experiment has the highest or lowest value.
Table 2.
Central orthogonal composite design for the set of factors.
3.2.2. Response Surface Methodology
Three-dimensional graphs were generated from the data attained from the central composite design by response surface methodology using STATISTICA 8. The set of experiments fabricated for CCD is shown in the table; along with the central composite design, the % recovery of Cd2+ ions acquired is also inscribed.
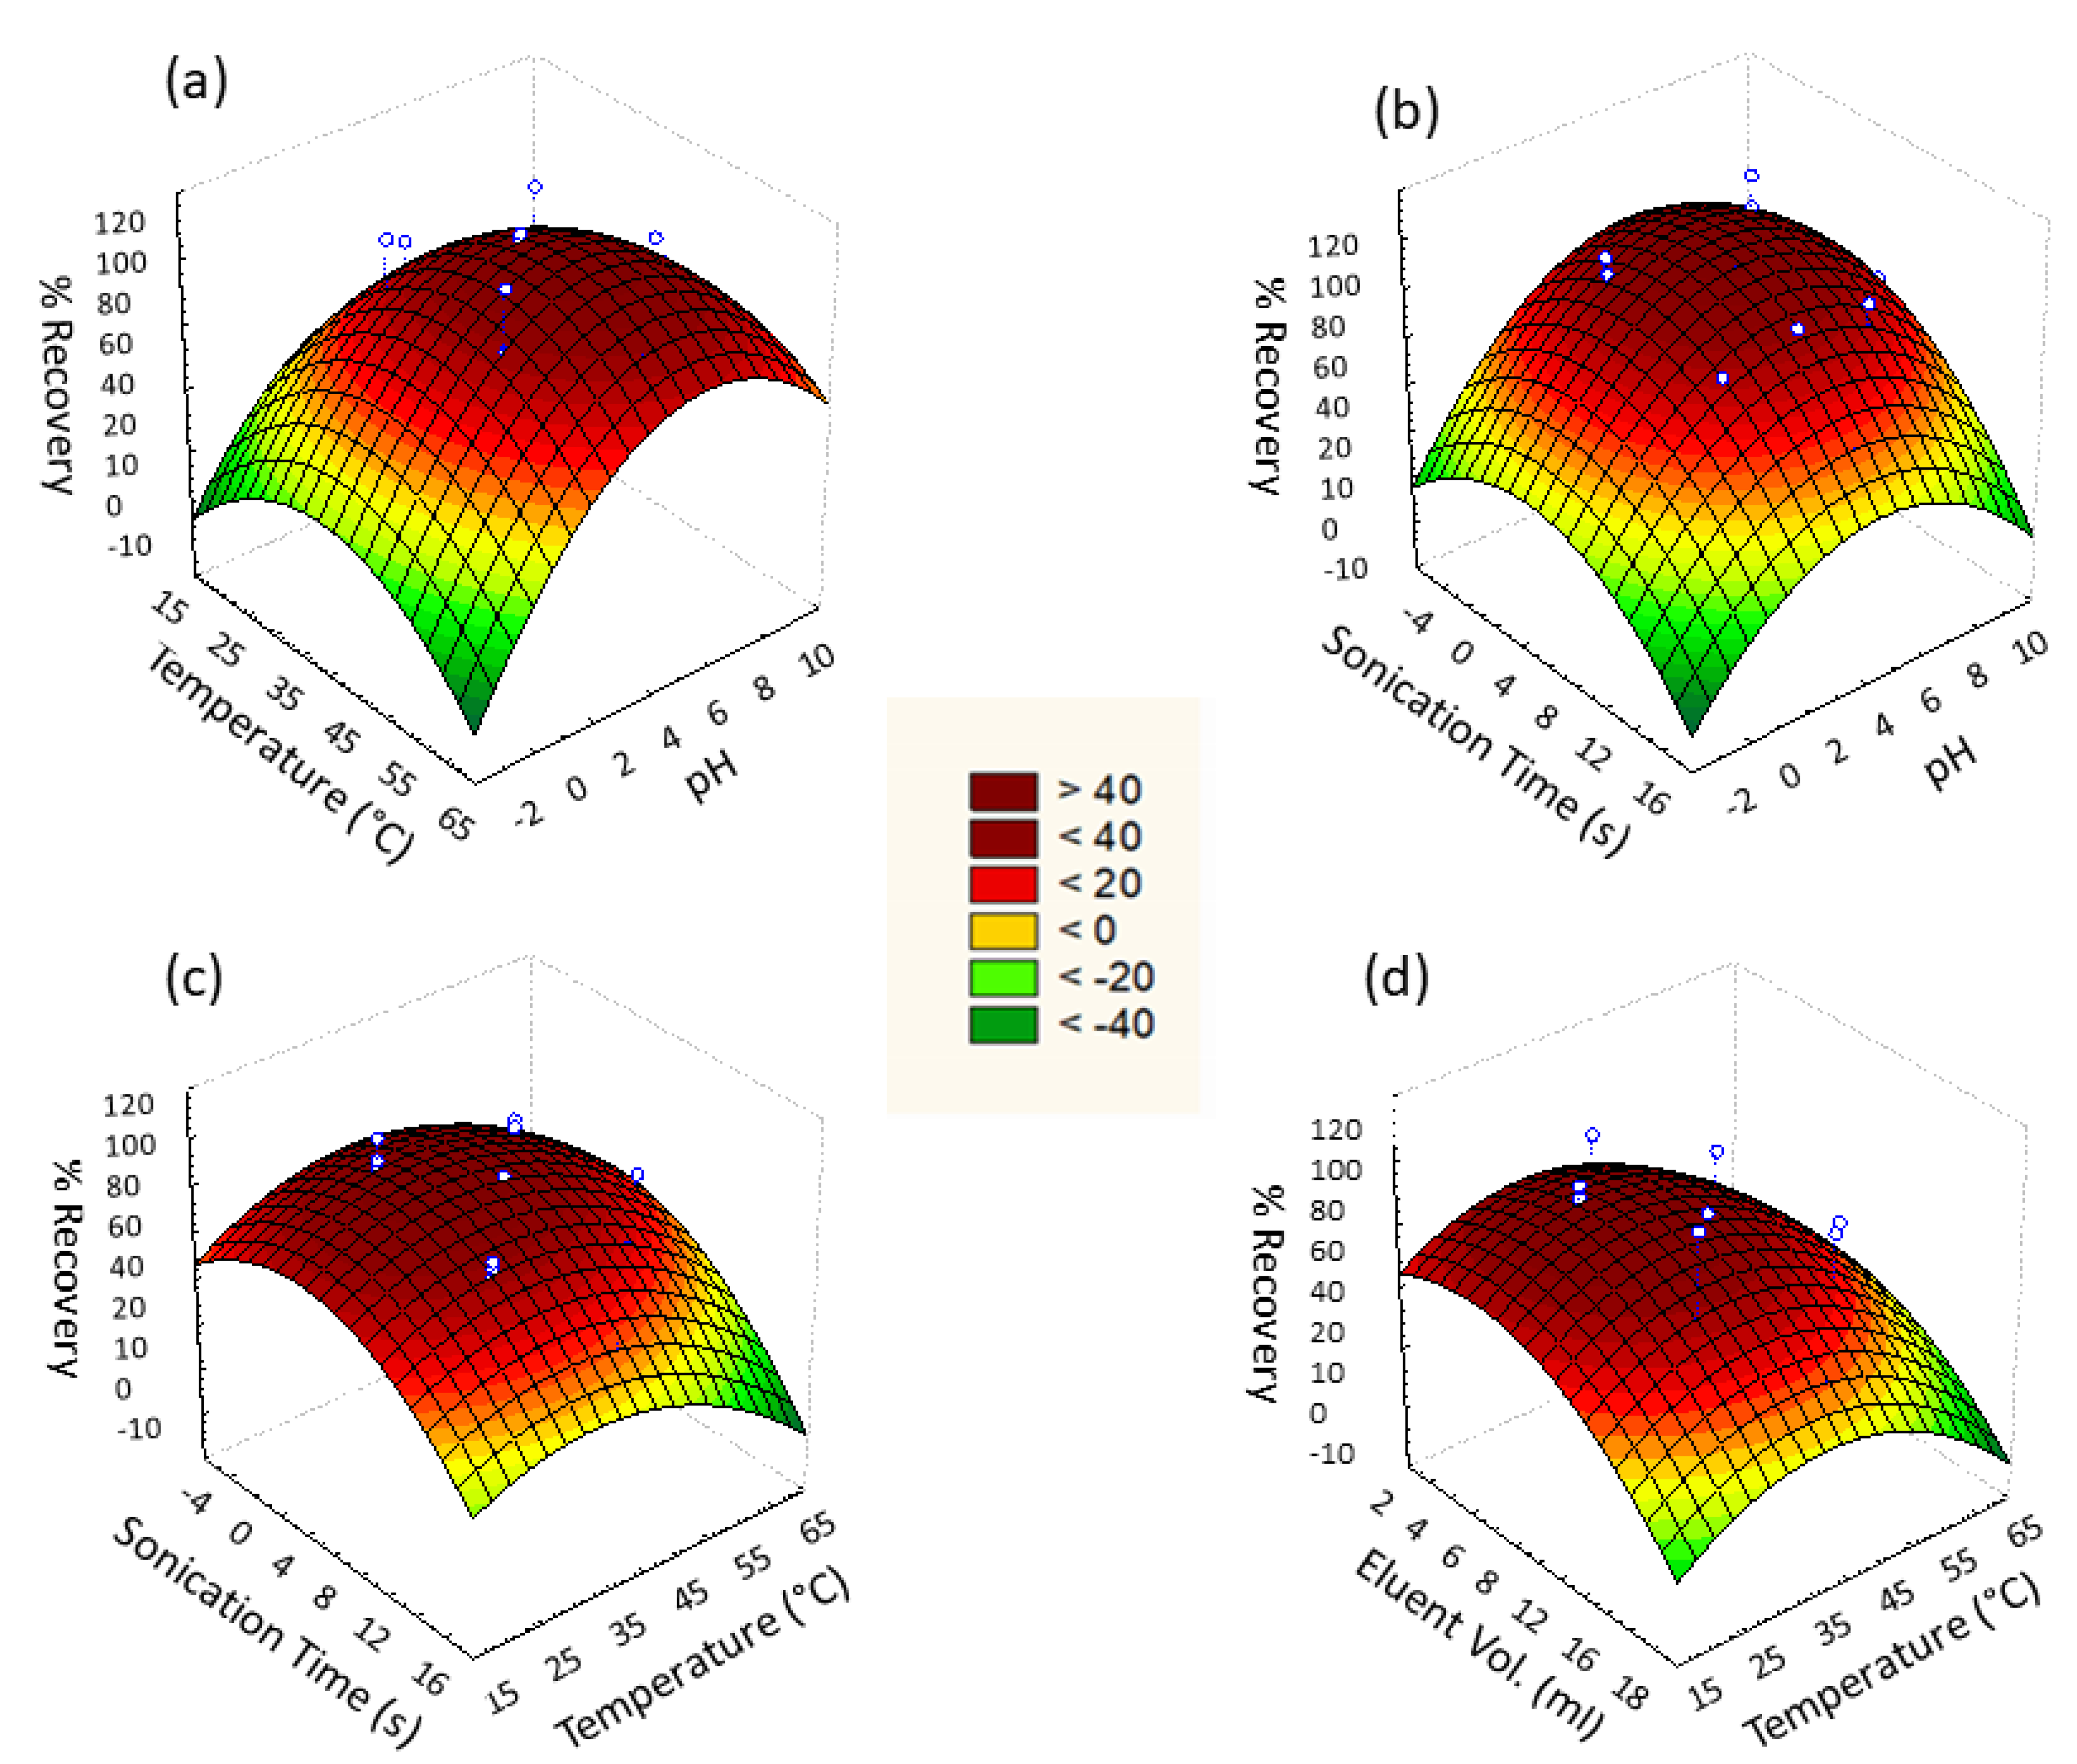
Figure 8 represents the response surface for given pairs of variables A/B, A/D, B/D, and B/F to attain maximum % recovery of Cd2+ ions. Quadratic equations for given pairs of variables were acquired from 3D response surface graphs that reveal the interactive effect of paired variables.
% Recovery [A/B] = −58.8 + 14.9x + 3.8y − 1.2x2 − 0.07xy − 0.05y2
% Recovery [A/D] = −6.2 + 12.2x + 5.9y − 1.3x2 + 0.2xy − 0.4y2
% Recovery [B/D] = −26.9 + 2.9x + 5.0y − 0.04x2 + 0.03xy − 0.3y2
% Recovery [B/F] = −38.9 + 3.0x + 4.8y − 0.04x2 − 0.01xy − 0.2y2

Figure 8.
Three-dimensional (3D) surface response for % recovery against (a) pH vs. temperature, (b) pH vs. sonication time, (c) temperature vs. sonication time, and (d) temperature vs. eluent volume.
The adsorption efficacy of Cd2+ by Fe3O4@SiO2@APTES was affected by varying pH. Cd2+ adsorption under the influence of varying pH ranging from 2 to 8 was evaluated to determine the optimum pH at which maximal adsorption occurs. Analysis revealed that maximum adsorption took place at pH 4.5 (Figure 8a and Equation (2)). At highly acidic pH 2–4, protonation occurs, which reduces the number of active sites for Cd2+ by binding H+ with –NH2 as well as repulsion of Cd2+ due to its positive charge. At pH greater than 4.5, precipitation of Cd2+ in the form of Cd(OH)2 is observed due to the presence of an excess of hydroxyl ions in the media.
Adsorption of Cd2+ by Fe3O4@SiO2@APTES was ultrasonic assisted; thus, this factor was also studied. The range of sonication time during analysis was taken as 2 min for lower level while 10 min for higher level for a fixed concentration of cadmium ions. Response surface plot of sonication time against pH and temperature revealed 6 min as the optimum time for sonication (Figure 8b). Dispersion of nanosorbent resulted in increased interaction of sorbent and cadmium ion leading to maximum sorption of analyte. Along with pH, the temperature had a significant effect on the magnetic solid phase extraction of cadmium ions by Fe3O4@SiO2@APTES. To determine the optimum temperature for adsorption, analysis of cadmium ions by synthesized sorbent was carried out in the range of 30–50 °C, and the results are shown in Figure 8c. Maximum analyte recoveries were observed at 40 °C, which was considered the optimum value.
The effect of eluent is the only variable of the elution step studied in the designed experiment for Cd2+ desorption, whereas eluent concentration (0.1 M HCl) and elution time were kept constant throughout the analysis. The Pareto chart revealed the significance of eluent volume; therefore, the effect of eluent volume was studied by using response surface methodology. The effect of eluent volume on Cd2+ desorption was analyzed in the range of 5–15 mL to find the optimum eluent volume at which maximum elution occurs. It is shown in Figure 8d that the elution of the analyte was affected by the varying volume of eluent. The maximum analyte was eluted when 10 mL of eluent was added. Large the volume of eluent, the more it extracts cadmium ions from the adsorbent by providing more interaction sites [30].
The amount of Fe3O4@SiO2@APTES nanosorbent was optimized for efficient microextraction and preconcentration of Cd2+ ions. Two levels of sorbent amount were utilized: a lower level of 20 mg and a higher level of 40 mg for affixed. Though this factor was found insignificant by the Pareto chart, thus 30 mg of it was used throughout all experiments. However, the increase in efficacy of adsorption is gradual as there are unsaturated active sites, a characteristic of batch adsorption [40].
3.3. Interference Study
The efficiency of magnetic dispersion-based solid phase extraction developed for microextraction and preconcentration of Cd2+ was studied in the presence of several coexisting ions. The results in Table 3 have shown that in the presence of external ions, above 97% Cd2+ recoveries were observed. Thus, it revealed that there is no pronounced effect of these coexisting ions on the percentage recovery of the target analyte.
Table 3.
Effect of interfering ions on Cd2+ analytical response.
3.4. Analytical Figures of Merit
The calibration curve was linear in the range of 0.58–200 μgL−1 (R2 = 0.998). The limit of detection (calculated as three times the standard deviation of the blank signals) was 0.17 μgL−1, whereas the limit of quantification (calculated as ten times the standard deviation of the blank signals) was 0.58 μgL−1. The precision in terms of repeatability (RSDr) and reproducibility (RSDR) was evaluated. Recoveries of spiked samples assessed on the same and for 5 alternate days were compared to check the RSDr (intra-assay precision) and RSDR (between-day precision), respectively. The method detection limit (MDL) is the minimum concentration of analyte determined with 99% confidence as concentration > 0 and was found by assessing the spiked water samples at a level yielding 3 × SD/n; calculated as (). Method quantitation limit (MQL) was obtained as 3.34 × MDL or assessing the spiked water samples at a level yielding 10 × SD/n. Another term, the Enhancement factor (EF), calculated as the ratio of calibration curve slopes after and before extraction, was found to be 83.5. All these figures of merit are presented in Table 4. Furthermore, the adsorption capacity of the proposed technique was compared with some literature-reported techniques used for the removal of Cd2+. In comparison to natural sorbents, excellent adsorption was observed with the proposed sorbent (Table 5). Though comparable adsorption capacity was observed in the case of EDA-MP microspheres, overall best results were obtained with Fe3O4@SiO2@APTES.
Table 4.
Analytical figures of merit for Cd2+ extraction followed by detection.
Table 5.
Comparison of adsorption capacity for reported sorbents to the developed sorbent.
3.5. Validation and Estimation of Uncertainty for the Determination of Cd2+
Prior to applications of newly developed analytical procedures for routine analysis, these are recommended to be validated. The purpose of this validation is to evaluate the trueness of the approximation of systematic errors. The aim is to make the developed techniques free of systematic errors. To study the feasibility of the developed method, the standard addition method was applied for validation under the optimum condition to determine Cd2+ in real samples. Real samples were collected and prepared for analysis where known quantities of analyte were added for determination of Cd2+ through the proposed extraction procedure followed by atomic absorption spectrophotometry. The efficiency of the proposed procedure was also confirmed by analyzing the different certified reference materials, and the results, along with estimated uncertainties, are shown in Table 6.
Table 6.
Validation of designed experiment through standard addition method (n = 6).
Uncertainty provides a range where true value being measured lies and is generally determined as a degree of data reliability. Bottom-up and top-bottom are the two approaches recommended by ISO for the estimation of uncertainty in analytical data [56,57]. The bottom-up approach is followed for the direct estimation of the uncertainty by analyzing certified reference material with known concentration and uncertainty [58]. Estimation of expanded uncertainty is subjected to the validation of the newly proposed procedure considering all the possible sources of error in analytical data and categorizing them in the following four terms.
Expanded uncertainty can be calculated as:
tα/2,eff is the tcritical and can be substituted with coverage factor (kRM = 2 at 95% confidence interval), while URM is the uncertainty of reference material (IRM) [27]. Uprec is the uncertainty in the reproducibility of the method, and the standard deviation for “n” replicates is expressed as Srep. WECC factor (ωn), which is a correction factor in case n < 10, differs from the unity [27,28]. Best recoveries with the least uncertainties were obtained for trace levels of Cd2+.
4. Conclusions
In this work, amine functionalized Fe3O4@SiO2 nanoparticles were freshly synthesized and employed for magnetic separation of Cd2+. The proposed sorbent has a high surface area, adsorption capacity, and stability, which led to reasonable results by using a small amount of sorbent for the microextraction of the target analyte. Even after 80 experiments, above 96% analyte recoveries were achieved, which shows the excellent stability of the developed sorbent. The application of chemometrics for the optimization and bottom-up approach for the estimation of uncertainties resulted in prompt and reliable validation with excellent reproducibility and least errors. Fe3O4@SiO2@APTES showed high sensitivity, selectivity, and higher tolerance towards interfering ions when employed for real samples.
Author Contributions
Methodology, F.S. and M.G.; Software, F.S.; Validation, F.S. and M.G.; Formal analysis, F.S. and M.G.; Investigation, F.S. and M.G.; Resources, F.S.; Data curation, F.S.; Writing—original draft, F.S. and M.G; Visualization, F.S.; Supervision, F.S.; Project administration, F.S.; Funding acquisition, F.S. All authors have read and agreed to the published version of the manuscript.
Funding
The authors extend their appreciation to the Deputyship for Research and Innovation, Ministry of Education in Saudi Arabia, for funding this research work (Project number INST068).
Data Availability Statement
Not applicable.
Acknowledgments
The authors extend their appreciation to the Deputyship for Research and Innovation, Ministry of Education in Saudi Arabia, for funding this research work (Project number INST068). We also acknowledge King Faisal University and the Department of Chemistry, COMSATS University Islamabad, Abbottabad Campus, for providing the research facilities to complete this project.
Conflicts of Interest
Authors declare no conflict of interest.
References
- Massadeh, A.M.; El-Rjoob, A.-W.O.; Gharaibeh, S.A. Analysis of selected heavy metals in tap water by inductively coupled plasma-optical emission spectrometry after pre-concentration using chelex-100 ion exchange resin. Water Air Soil Pollut. 2020, 231, 243. [Google Scholar] [CrossRef]
- Sodipo, B.K.; Aziz, A.A. One minute synthesis of amino-silane functionalized superparamagnetic iron oxide nanoparticles by sonochemical method. Ultrason. Sonochem. 2018, 40, 837–840. [Google Scholar] [CrossRef] [PubMed]
- Jafari Kang, A.; Baghdadi, M.; Pardakhti, A. Removal of cadmium and lead from aqueous solutions by magnetic acid-treated activated carbon nanocomposite. Desalination Water Treat. 2016, 57, 18782–18798. [Google Scholar] [CrossRef]
- Qu, J.; Meng, X.; Zhang, Y.; Meng, Q.; Tao, Y.; Hu, Q.; Jiang, X.; You, H.; Shoemaker, C.A. A combined system of microwave-functionalized rice husk and poly-aluminium chloride for trace cadmium-contaminated source water purification: Exploration of removal efficiency and mechanism. J. Hazard. Mater. 2019, 379, 120804. [Google Scholar] [CrossRef]
- Rahimzadeh, M.; Rahimzadeh, M.; Kazemi, S.; Moghadamnia, A. Cadmium toxicity and treatment: An update. Casp. J. Intern. Med. 2017, 8, 135–145. [Google Scholar]
- Dugheri, S.; Mucci, N.; Bonari, A.; Marrubini, G.; Cappelli, G.; Ubiali, D.; Campagna, M.; Montalti, M.; Arcangeli, G. Liquid phase microextraction techniques combined with chromatography analysis: A review. Acta Chromatogr. 2020, 32, 69–79. [Google Scholar] [CrossRef]
- Hashemzadeh, M.; Nilchi, A.; Hassani, A.H. Synthesis of novel surface-modified hematite nanoparticles for lead ions removal from aqueous solution. Mater. Chem. Phys. 2019, 227, 279–290. [Google Scholar] [CrossRef]
- Ge, F.; Li, M.-M.; Ye, H.; Zhao, B.-X. Effective removal of heavy metal ions Cd2+, Zn2+, Pb2+, Cu2+ from aqueous solution by polymer-modified magnetic nanoparticles. J. Hazard. Mater. 2012, 211, 366–372. [Google Scholar] [CrossRef]
- Božić, D.; Stanković, V.; Gorgievski, M.; Bogdanović, G.; Kovačević, R. Adsorption of heavy metal ions by sawdust of deciduous trees. J. Hazard. Mater. 2009, 171, 684–692. [Google Scholar] [CrossRef]
- Manyangadze, M.; Chikuruwo, N.; Chakra, C.; Narsaiah, T.; Radhakumari, M.; Danha, G. Enhancing adsorption capacity of nano-adsorbents via surface modification: A review. South Afr. J. Chem. Eng. 2020, 31, 25–32. [Google Scholar] [CrossRef]
- Suo, L.; Dong, X.; Gao, X.; Xu, J.; Huang, Z.; Ye, J.; Lu, X.; Zhao, L. Silica-coated magnetic graphene oxide nanocomposite based magnetic solid phase extraction of trace amounts of heavy metals in water samples prior to determination by inductively coupled plasma mass spectrometry. Microchem. J. 2019, 149, 104039. [Google Scholar] [CrossRef]
- Zhao, X.; Shi, Y.; Wang, T.; Cai, Y.; Jiang, G. Preparation of silica-magnetite nanoparticle mixed hemimicelle sorbents for extraction of several typical phenolic compounds from environmental water samples. J. Chromatogr. A 2008, 1188, 140–147. [Google Scholar] [CrossRef] [PubMed]
- Parham, H.; Zargar, B.; Rezazadeh, M. Removal, preconcentration and spectrophotometric determination of picric acid in water samples using modified magnetic iron oxide nanoparticles as an efficient adsorbent. Mater. Sci. Eng. C 2012, 32, 2109–2114. [Google Scholar] [CrossRef] [PubMed]
- Rose, L.C.; Suhaimi, H.; Mamat, M.; Lik, T.Z. Synthesis and characterization of oleic acid surface modified magnetic iron oxide nanoparticles by using biocompatible w/o microemulsion for heavy metal removal. AIP Conf. Proc. 2017, 1885, 020113. [Google Scholar]
- Dados, A.; Paparizou, E.; Eleftheriou, P.; Papastephanou, C.; Stalikas, C. Nanometer-sized ceria-coated silica–iron oxide for the reagentless microextraction/preconcentration of heavy metals in environmental and biological samples followed by slurry introduction to ICP-OES. Talanta 2014, 121, 127–135. [Google Scholar] [CrossRef]
- Parham, H.; Zargar, B.; Shiralipour, R. Fast and efficient removal of mercury from water samples using magnetic iron oxide nanoparticles modified with 2-mercaptobenzothiazole. J. Hazard. Mater. 2012, 205, 94–100. [Google Scholar] [CrossRef]
- Petcharoen, K.; Sirivat, A. Synthesis and characterization of magnetite nanoparticles via the chemical co-precipitation method. Mater. Sci. Eng. B 2012, 177, 421–427. [Google Scholar] [CrossRef]
- Bhateria, R.; Singh, R. A review on nanotechnological application of magnetic iron oxides for heavy metal removal. J. Water Process Eng. 2019, 31, 100845. [Google Scholar] [CrossRef]
- Mahmoudi, M.; Simchi, A.; Milani, A.; Stroeve, P. Cell toxicity of superparamagnetic iron oxide nanoparticles. J. Colloid Interface Sci. 2009, 336, 510–518. [Google Scholar] [CrossRef]
- Zhu, N.; Ji, H.; Yu, P.; Niu, J.; Farooq, M.; Akram, M.W.; Udego, I.; Li, H.; Niu, X. Surface modification of magnetic iron oxide nanoparticles. Nanomaterials 2018, 8, 810. [Google Scholar] [CrossRef]
- Xu, H.; Yuan, H.; Yu, J.; Lin, S. Study on the competitive adsorption and correlational mechanism for heavy metal ions using the carboxylated magnetic iron oxide nanoparticles (MNPs-COOH) as efficient adsorbents. Appl. Surf. Sci. 2019, 473, 960–966. [Google Scholar] [CrossRef]
- Liang, S.; Wang, Y.; Yu, J.; Zhang, C.; Xia, J.; Yin, D. Surface modified superparamagnetic iron oxide nanoparticles: As a new carrier for bio-magnetically targeted therapy. J. Mater. Sci. Mater. Med. 2007, 18, 2297–2302. [Google Scholar] [CrossRef] [PubMed]
- Maleki, B.; Baghayeri, M.; Ghanei-Motlagh, M.; Zonoz, F.M.; Amiri, A.; Hajizadeh, F.; Hosseinifar, A.; Esmaeilnezhad, E. Polyamidoamine dendrimer functionalized iron oxide nanoparticles for simultaneous electrochemical detection of Pb2+ and Cd2+ ions in environmental waters. Measurement 2019, 140, 81–88. [Google Scholar] [CrossRef]
- Ghaemi, N.; Madaeni, S.S.; Daraei, P.; Rajabi, H.; Zinadini, S.; Alizadeh, A.; Heydari, R.; Beygzadeh, M.; Ghouzivand, S. Polyethersulfone membrane enhanced with iron oxide nanoparticles for copper removal from water: Application of new functionalized Fe3O4 nanoparticles. Chem. Eng. J. 2015, 263, 101–112. [Google Scholar] [CrossRef]
- Moser, J.; Wegscheider, W.; Sperka-Gottlieb, C. Quantifying the measurement uncertainty of results from environmental analytical methods. Fresenius’ J. Anal. Chem. 2001, 370, 679–689. [Google Scholar] [CrossRef] [PubMed]
- Díaz, A.; Vàzquez, L.; Ventura, F.; Galceran, M.T. Estimation of measurement uncertainty for the determination of nonylphenol in water using solid-phase extraction and solid-phase microextraction procedures. Anal. Chim. Acta 2004, 506, 71–80. [Google Scholar] [CrossRef]
- Maroto, A.; Boqué, R.; Riu, J.; Rius, F.X. Estimation of measurement uncertainty by using regression techniques and spiked samples. Anal. Chim. Acta 2001, 446, 131–143. [Google Scholar] [CrossRef]
- Shah, F.; Shah, M.R.; Khan, R.A.; Ismail, B.; Khan, A.M.; Khan, A.R.; Ajaz, H. Sonochemically synthesized green sorbent for the simultaneous removal of trace metal ions: Application and estimation of measurement uncertainty through bottom-up approach. N. J. Chem. 2017, 41, 11695–11700. [Google Scholar] [CrossRef]
- Tadjarodi, A.; Abbaszadeh, A.; Taghizadeh, M.; Shekari, N.; Asgharinezhad, A.A. Solid phase extraction of Cd (II) and Pb (II) ions based on a novel functionalized Fe3O4@ SiO2 core-shell nanoparticles with the aid of multivariate optimization methodology. Mater. Sci. Eng. C 2015, 49, 416–421. [Google Scholar] [CrossRef]
- Kurczewska, J.; Cegłowski, M.; Schroeder, G. Preparation of multifunctional cascade iron oxide nanoparticles for drug delivery. Mater. Chem. Phys. 2018, 211, 34–41. [Google Scholar] [CrossRef]
- Chitra, K.; Annadurai, G. Rapid capture and exemplary detection of clinical pathogen using surface modified fluorescent silica coated iron oxide nanoparticles. Biocybern. Biomed. Eng. 2014, 34, 230–237. [Google Scholar] [CrossRef]
- Shafqat, S.S.; Khan, A.A.; Zafar, M.N.; Alhaji, M.H.; Sanaullah, K.; Shafqat, S.R.; Murtaza, S.; Pang, S.C. Development of amino-functionalized silica nanoparticles for efficient and rapid removal of COD from pre-treated palm oil effluent. J. Mater. Res. Technol. 2019, 8, 385–395. [Google Scholar] [CrossRef]
- Bayat, A.; Shakourian-Fard, M.; Ehyaei, N.; Hashemi, M.M. A magnetic supported iron complex for selective oxidation of sulfides to sulfoxides using 30% hydrogen peroxide at room temperature. RSC Adv. 2014, 4, 44274–44281. [Google Scholar] [CrossRef]
- Gemeay, A.H.; Keshta, B.E.; El-Sharkawy, R.G.; Zaki, A.B. Chemical insight into the adsorption of reactive wool dyes onto amine-functionalized magnetite/silica core-shell from industrial wastewaters. Environ. Sci. Pollut. Res. 2020, 27, 32341–32358. [Google Scholar] [CrossRef] [PubMed]
- Aljarrah, M.; Al-Harahsheh, M.S.; Mayyas, M.; Alrebaki, M. In situ synthesis of quaternary ammonium on silica-coated magnetic nanoparticles and its application for the removal of uranium (VI) from aqueous media. J. Environ. Chem. Eng. 2018, 6, 5662–5669. [Google Scholar] [CrossRef]
- Pylypchuk, I.V.; Kessler, V.G.; Seisenbaeva, G.A. Simultaneous removal of acetaminophen, diclofenac, and Cd (II) by Trametes versicolor laccase immobilized on Fe3O4/SiO2-DTPA hybrid nanocomposites. ACS Sustain. Chem. Eng. 2018, 6, 9979–9989. [Google Scholar] [CrossRef]
- Cao, X.; Prozorov, R.; Koltypin, Y.; Kataby, G.; Felner, I.; Gedanken, A. Synthesis of pure amorphous Fe2O3. J. Mater. Res. 1997, 12, 402–406. [Google Scholar] [CrossRef]
- Ahangaran, F.; Navarchian, A.H. Recent advances in chemical surface modification of metal oxide nanoparticles with silane coupling agents: A review. Adv. Colloid Interface Sci. 2020, 286, 102298. [Google Scholar] [CrossRef]
- Periakaruppan, R.; Chen, X.; Thangaraj, K.; Jeyaraj, A.; Nguyen, H.H.; Yu, Y.; Hu, S.; Lu, L.; Li, X. Utilization of tea resources with the production of superparamagnetic biogenic iron oxide nanoparticles and an assessment of their antioxidant activities. J. Clean. Prod. 2021, 278, 123962. [Google Scholar] [CrossRef]
- Ehrampoush, M.H.; Miria, M.; Salmani, M.H.; Mahvi, A.H. Cadmium removal from aqueous solution by green synthesis iron oxide nanoparticles with tangerine peel extract. J. Environ. Health Sci. Eng. 2015, 13, 84. [Google Scholar] [CrossRef]
- Kwikima, M.M.; Mateso, S.; Chebude, Y. Scientific African. Environment 2021, 36, 60. [Google Scholar]
- Kumar, U.; Tripathi, B.; Sharma, A.; Kumar, R.; Sreenivasa, B.; Singh, R.; Bandyopadhyay, M. Sorption of Cadmium from Aqueous Solution using Pre-Treated Rice Husk. Bioresour. Technol. 2006, 97, 104–109. [Google Scholar] [CrossRef] [PubMed]
- Memon, J.R.; Memon, S.Q.; Bhanger, M.; Memon, G.Z.; El-Turki, A.; Allen, G.C. Characterization of banana peel by scanning electron microscopy and FT-IR spectroscopy and its use for cadmium removal. Colloids Surf. B Biointerfaces 2008, 66, 260–265. [Google Scholar] [CrossRef]
- Álvarez-Ayuso, E.; García-Sánchez, A. Removal of cadmium from aqueous solutions by palygorskite. J. Hazard. Mater. 2007, 147, 594–600. [Google Scholar] [CrossRef] [PubMed]
- Yavuz, Ö.; Guzel, R.; Aydin, F.; Tegin, I.; Ziyadanogullari, R. Removal of Cadmium and Lead from Aqueous Solution by Calcite. Pol. J. Environ. Stud. 2007, 16, 467–471. [Google Scholar]
- Lodeiro, P.; Cordero, B.; Barriada, J.L.; Herrero, R.; De Vicente, M.S. Biosorption of cadmium by biomass of brown marine macroalgae. Bioresour. Technol. 2005, 96, 1796–1803. [Google Scholar] [CrossRef]
- Herrero, R.; Cordero, B.; Lodeiro, P.; Rey-Castro, C.; de Vicente, M.S. Interactions of cadmium (II) and protons with dead biomass of marine algae Fucus sp. Mar. Chem. 2006, 99, 106–116. [Google Scholar] [CrossRef]
- Parsons, J.G.; Hernandez, J.; Gonzalez, C.M.; Gardea-Torresdey, J. Sorption of Cr (III) and Cr (VI) to high and low pressure synthetic nano-magnetite (Fe3O4) particles. Chem. Eng. J. 2014, 254, 171–180. [Google Scholar] [CrossRef]
- Huang, Z.; Wang, X.; Yang, D. Adsorption of Cr(VI) in wastewater using magnetic multiwall carbon nanotubes. Water Sci. Eng. 2015, 8, 226–232. [Google Scholar] [CrossRef]
- FA, I.A.-K.; Abusharkh, B.; Khaled, M.; Atieh, M.; Nasser, M.; Saleh, T.; Agarwal, S.; Tyagi, I.; Gupta, V. Adsorptive removal of cadmium (II) ions from liquid phase using acid modified carbon-based adsorbents. J. Mol. Liq. 2015, 204, 255–263. [Google Scholar]
- Mohammadi, S.Z.; Baghelani, Y.M.; Mansori, F.; Shamspur, T.; Afzali, D. Dispersive liquid-liquid microextraction for the simultaneous separation of trace amounts of zinc and cadmium ions in water samples prior to flame atomic absorption spectrometry determination. Química Nova 2012, 35, 198–202. [Google Scholar] [CrossRef]
- Norouzian Baghani, A.; Mahvi, A.H.; Gholami, M.; Rastkari, N.; Delikhoon, M. One-Pot synthesis, characterization and adsorption studies of amine-functionalized magnetite nanoparticles for removal of Cr (VI) and Ni (II) ions from aqueous solution: Kinetic, isotherm and thermodynamic studies. J. Environ. Health Sci. Eng. 2016, 14, 1–12. [Google Scholar] [CrossRef] [PubMed]
- Budimirović, D.; Veličković, Z.S.; Bajić, Z.; Milošević, D.L.; Nikolić, J.B.; Drmanić, S.Ž.; Marinković, A.D. Removal of heavy metals from water using multistage functionalized multiwall carbon nanotubes. J. Serb. Chem. Soc. 2017, 82, 1175–1191. [Google Scholar] [CrossRef]
- Zhou, F.; Feng, X.; Yu, J.; Jiang, X. High performance of 3D porous graphene/lignin/sodium alginate composite for adsorption of Cd (II) and Pb (II). Environ. Sci. Pollut. Res. 2018, 25, 15651–15661. [Google Scholar] [CrossRef] [PubMed]
- Wang, Y.; Gao, S.; Zang, X.; Li, J.; Ma, J. Graphene-based solid-phase extraction combined with flame atomic absorption spectrometry for a sensitive determination of trace amounts of lead in environmental water and vegetable samples. Anal. Chim. Acta 2012, 716, 112–118. [Google Scholar] [CrossRef]
- Ellison, S.L.; Holcombe, D.G.; Burns, M. Response surface modelling and kinetic studies for the experimental estimation of measurement uncertainty in derivatisation© Copyright LGC (Teddington) Ltd. 2000. Analyst 2001, 126, 199–210. [Google Scholar] [CrossRef]
- ISO/IEC 17025; General requirements for the competence of testing and calibration laboratories. ISO International Organization for Standardization: Geneva, Switzerland, 2006.
- Analytical Methods Committee. Uncertainty of measurement: Implications of its use in analytical science. Analyst 1995, 120, 2303–2308. [Google Scholar] [CrossRef]

Disclaimer/Publisher’s Note: The statements, opinions and data contained in all publications are solely those of the individual author(s) and contributor(s) and not of MDPI and/or the editor(s). MDPI and/or the editor(s) disclaim responsibility for any injury to people or property resulting from any ideas, methods, instructions or products referred to in the content. |
© 2023 by the authors. Licensee MDPI, Basel, Switzerland. This article is an open access article distributed under the terms and conditions of the Creative Commons Attribution (CC BY) license (https://creativecommons.org/licenses/by/4.0/).