Article

Spectroscopic Tracking of the Characteristics of Microplastic-Derived Dissolved Organic Matter

School of Metallurgy and Environment, Central South University, Changsha 410083, China
*
Author to whom correspondence should be addressed.
Separations 2023, 10(2), 101; https://doi.org/10.3390/separations10020101
Submission received: 10 January 2023 / Revised: 28 January 2023 / Accepted: 30 January 2023 / Published: 1 February 2023

Abstract

:
Microplastic-derived dissolved organic matter (MP-DOM) has received increasing attention in recent years. In this study, the fluorescence excitation-emission matrix (EEM) combined with parallel factor analysis (PARAFAC) was used to track the leaching behavior of polyethylene (PE), polyvinyl chloride (PVC), polypropylene (PP), polyethylene terephthalate (PET), and polystyrene (PS) MP-DOM. After seven days of leaching, PVC reached a leaching concentration of 7.59 mg/L, and the other four microplastics reached approximately 4.5~4.7 mg/L. The leaching activity of PVC was considerably more active in an alkaline environment and under UV irradiation. All the fluorescence signals of MP-DOM components were located in the protein/phenol-like fluorescence region. The fact that C1 and C2 were found in every microplastic revealed that these substances took up quite a large proportion of MP-DOM. Protein/phenolic substances in MP-DOM showed different binding ability with different heavy metals, which can be realized from the log K values calculated for Cr3+ (3.99–5.51), Cu2+ (3.06–4.83), Cd2+ (3.76–4.41), and Fe3+ (3.11–5.03). This work introduced more MP-DOM samples, and offered spectroscopic insight into the characteristics and environmental fate of MP-DOM at a molecular level. Furthermore, this study displayed the potential applicability of using the integrated methods to track the MP-DOM formation process and environmental behavior in natural aquatic systems.

1. Introduction

Plastics, the polymerization product of various monomers and additives, are a global environmental threat of wide concern. Over 8.3 billion tons of plastics have been produced since the 1950s, with up to 86% having received improper treatment, leading to substantial discharge of plastic debris into aquatic systems [1,2,3,4]. According to previous studies, the most commonly detected plastics in the environment are polyethylene (PE), polyvinyl chloride (PVC), polypropylene (PP), polyethylene terephthalate (PET), and polystyrene (PS) [5]. As the large plastic pieces break down to a tiny size, microplastics (MPs), with a size ranging from 1 µm to 5 mm [6], are formed and accumulate as a new contaminant. Due to their durability, immense specific surface area, and flexible mobility, MPs are a perfect vector to carry pollutants such as heavy metals, and offer a habitat for microorganisms in the form of biofilms [7,8]. MPs can also be ingested by marine and freshwater organisms, and thus penetrate entire biological systems through the food chain and food web, causing neurotoxicity and genotoxicity, in addition to reduced feeding, filtration, survival, and reproductive abilities [9,10,11].
It is well acknowledged that MPs are widely distributed in various aquatic environments, including lakes, rivers, and oceans. During the long-term transportation and migration process in water, degradation of MPs can be accelerated by factors such as hydrolysis, photodegradation, and biodegradation [12,13,14]. Among these factors, chemical decomposition (particularly by photodegradation [13]) plays the most important role [15]. Studies have indicated that PET and polyamide (PA) microplastic fibers showed remarkable fragmentation and surface roughness changes following UV irradiation [16]. In addition to UV exposure, pH is also a considerable environmental condition in microplastic degradation process. Studies have revealed that pH has a significant impact on the leachability of plastic materials, and the turbidity of the leachate reached the highest level at a pH level of 9 [17].
Through the prolonged process of degradation, it is inevitable that microplastic-derived dissolved organic matter (MP-DOM) is released into the aquatic phase. MP-DOM mainly includes polymer-derived DOM and additives, for instance, bisphenol A(BPA) and di-(2-ethylhexyl)phthalate (DEHP) [18,19]. After entering the aquatic system, the interaction of MP-DOM with trace metals is considered to be inevitable [8,20]. Abundant functional groups in DOM can serve as heterogeneous sites for metals [21]. Thus, the fate, transportation, and toxicity of metals can be affected by interaction with DOM. To date, few studies have attempted to investigate the formation, distribution, and environmental behaviors of MP-DOM, and the species of plastic being researched are very limited. Therefore, further research is urgently needed to gather more information about various kinds of MP-DOM, and there is a research gap in exploring the interactions between MP-DOM and trace metals.
The fluorescence excitation-emission matrix (EEM) has been validated as a useful tool to probe the fluorescence features and dynamics of natural organic matter (NOM) [22]. Abundant and interwoven fluorescence information is revealed by this technique, allowing for deeper insight into the molecular structure of DOM. Coupled with parallel factor analysis (PARAFAC), it is a convenient approach for deciphering high-dimension EEM data and reducing the disruption of some environment factors. Although many studies have successfully applied fluorescence spectroscopy combined with parallel factor analysis (EEM-PARAFAC) to characterize and differentiate DOM with various sources [23,24,25], few attempts have been made in the field of MP-DOM detection and identification, and this work clearly needs greater confirmation and empirical expansion. Previous studies have shown the possibilities of using EEM-PARAFAC for detecting MP-DOM originating from PVC and PS polymers [18], but the applicability of this technique on other MPs remains unclear. This study aimed at filling this gap by conducting laboratory-based experiments on multiple kinds of MPs under controlled conditions. Given the inherent advantages of fluorescence spectroscopy, such as its high sensitivity, stable performance, simple pretreatment, and feasibility, in addition to the global issue of microplastic pollution, attempts to use EEM as a MP-DOM analytical method have significant utility.
Based on the above background, the objectives of this study were to: (1) compare the leaching degree and fluorescent spectral properties of a variety of different commercial microplastics including PP, PE, PET, PS, and PVC; (2) investigate and evaluate the effects of light and pH on the leaching behavior of microplastics, typified by PVC, by setting different leaching conditions; and (3) explore and compare the binding behaviors of different fluorescent components within MP-DOM towards four kinds of metals, namely, iron, copper, cadmium, and chromium.

2. Materials and Methods

2.1. Microplastics

To collect information of some typical MP-DOM, 5 kinds of commercial plastics, namely, PS, PP, PE, PVC, and PET, were selected as representative MPs in this study. The plastics were purchased from Sinopec. Group, China, as white powder with a diameter of 75 µm.

2.2. Leaching Experiments

To simulate the aquatic environment of a freshwater system, the leaching solution was artificial fresh water, which mimics the ion composition of natural freshwater: NaHCO3 (96 mg/L), CaSO4 (47.4 mg/L), MgSO4·7H2O (122.86 mg/L), and KCl (4 mg/L) [26]. The pH of leaching solution was 8.0. With the aim of identifying the fluorescence signature of MP-DOM, the added dose of microplastic (5 g/L) was determined in reference to previous research [27,28]. The dose was relatively higher than the background level in a natural aquatic environment.
The leaching experiments were divided into 2 groups. In the first experiment, the aim of the experiment was to compare different leaching behaviors of the 5 selected MPs, so the variable in this experiment was the type of MP. Five plastic materials were added to the leaching solution (1 L), and the leaching system was contained in 2 L glass beakers, then shaken in a horizontal shaker for 7 days at ambient temperature under natural light. In the other experiment, the main concern was the impact of pH and UV light on DOM leaching, so the experiment procedures were basically the same, but the added microplastic material was PVC, as PVC-DOM displayed a better fluorescence response in a previous experiment. In the pH-controlled experiment, the pH of leaching solution was tuned to 5.0, 7.0, and 9.0 using 0.1 M NaOH or HCl, all leached under natural light. In the light-controlled experiment, an 8W-UVA lamp (Sankyo Denki, F8T5BL) was used to provide UV irradiation. Dark and natural light conditions were used. After 7 days of constant leaching, the mixing solution was then filtered through a 0.45 µm organic nylon membrane to collect MP-DOM samples.

2.3. Fluorescence Quenching Experiments

The MP-DOM solutions were obtained by diluting three types of MP-DOM samples (PP-, PVC-, and PS-DOM) to a fixed DOC concentration (5 mg/L). Cd2+, Cr3+, Cu2+, and Fe3+ stock solutions (1.0 mM) were prepared by dissolving CdCl2·2.5H2O, CrCl3·6H2O, CuCl2·2H2O, and FeCl3 with deionized water.
To obtain a series of metal concentration gradients (0, 10, 20, 50, 75, 100, 120, 150, and 200 μM), different volumes of metal stock solutions were added to the DOM solutions, The final volume was kept at 25 mL. The pH value of mixtures was tuned to 7.0. Then, the mixed solutions were transferred to a shaker to equilibrate in the dark for 24 h.
The modified Stern–Volmer model is a popular fluorescence quenching model used to calculate the complexation parameters that reflect the metal-binding ability of certain DOM [29,30]. The parameters that related to the binding affinity and conditional stability constants were calculated by the equation:
F 0 F 0 F = 1 f K M + 1 f
where F0, F, f, [M], and K refer to the initial fluorescence intensity of the sample without metal, the measured fluorescence intensity with metal, the initial fluorophore fraction participating in the binding, the metal concentration, and the conditional stability constant, respectively. The logarithms of K and f were estimated from the linear plot of F0/∆F against 1/[M].

2.4. Analytical Methods

The DOC concentrations of the samples were measured using a TOC analyzer (TOC-L, Shimadzu, Japan). The samples were acidified to pH 2.0 with 1 M HCl and were stored at 4 °C before measurement. The standard solution was formulated by potassium hydrogen phthalate (KHP), and used daily to ensure the accuracy of the TOC analyzer.
The fluorescence EEM spectra landscape of MP-DOM samples was obtained using a fluorescence spectrophotometer (F-4600, Hitachi, Japan). The emission wavelength ranged from 250 to 650 nm, with a step increase of 5 nm. The excitation wavelength increased from 200 to 500 nm with a 5 nm step. The scanning rate was 12,000 nm min−1, while the slit width was 10 nm. In order to eliminate the inner-filter correction, the UV absorption coefficient at 254 nm was controlled below 0.05 cm−1.
The EEM datasheets were imported and analyzed by PARAFAC modeling using MATLAB R2018b (Mathworks, Natick, MA, USA) with the drEEM Toolbox [31]. The number of components was determined by the core consistency test.

3. Results and Discussion

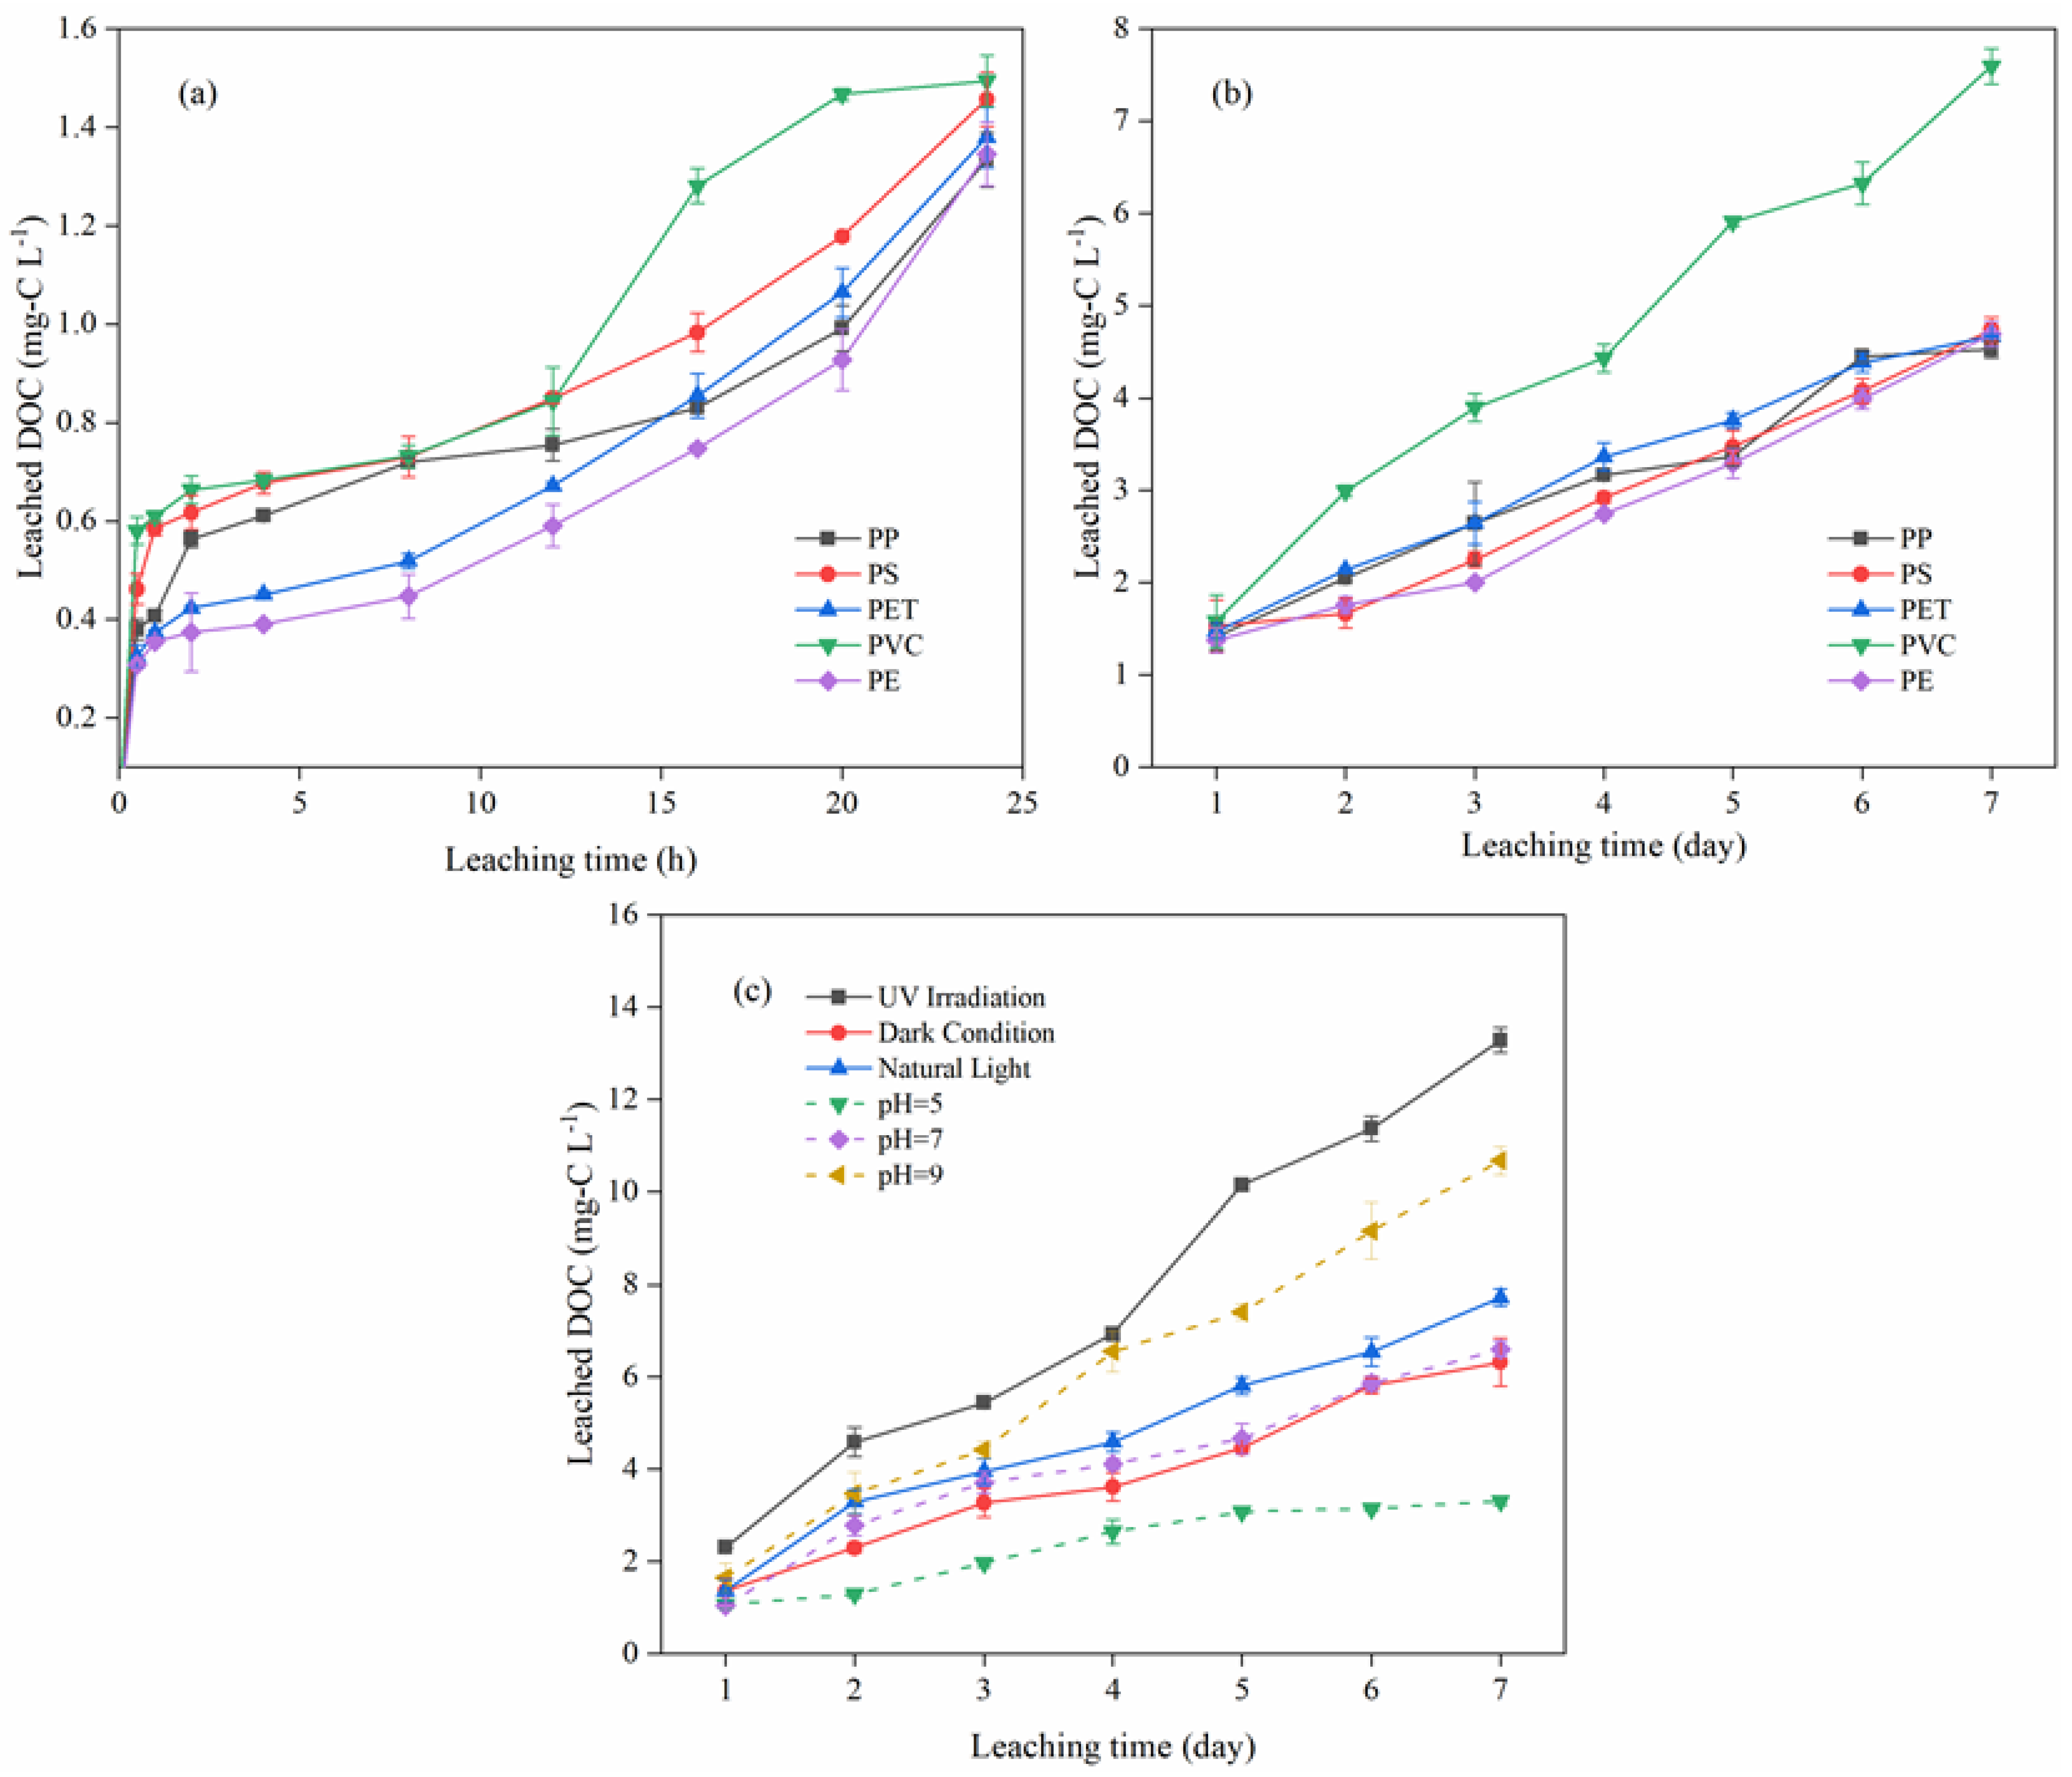
3.1. DOC Leaching from the Microplastics

3.1.1. Different Types of Microplastics

It was observed that the DOC concentration of the microplastics reached more than 1 mg/L after merely 24 h of leaching, with the highest being PVC (1.49 mg/L) and the lowest being PP (1.33 mg/L) (Figure 1a). In one day, the concentration of DOC produced from different microplastics did not differ much, which indicates that the amount of DOM produced by any microplastic is not negligible.
It can be also concluded that microplastics can produce and release dissolved organic substances very quickly after contact with the aquatic environment, especially PVC-MPs, which can produce DOC of 0.58 mg/L after 30 min in water.
During the 7 days of the continual leaching process, the DOC concentrations of all five microplastics showed different degrees of increasing trends (Figure 1b). While the initial leaching concentrations of PP, PE, and PET were basically the same at about 1.3 mg/L, the PVC and PS microplastics both showed slightly higher DOC levels, which were 1.6 and 1.5 mg/L respectively. After 7 days of leaching, PVC reached a concentration of 7.6 mg/L, and the other four microplastics reached approximately 4.5~4.7 mg/L at the same time. Furthermore, the rate of increasing trends varied largely with different microplastic types. The PVC leaching rate was much higher than that of the other plastic species.
The DOC concentration results of the five types of microplastic indicate that, regardless of the plastic type, considerable amounts of organic compounds could be broken off and emerge in an aquatic environment after constant contact with water, and some plastic, such as PVC, may yield relatively more. Lee et al. [18] reported that PS and PVC commercial plastics reached a concentration of more than 10.0 and 17.0 mg/L, respectively, after 24 days of the leaching process. These forms of detectable organic matter may be the potential precursors to the formation of carcinogenic disinfection by-products (DBPs), and may influence the migration, binding, and chemical reactivity of micropollutants in terrestrial and marine systems [32]. Chen et al. [33] previously reported that PE-DOM and PS-DOM exerted a significant inhibition on sulfamethoxazole photodegradation. In view of the fact that PVC-MP displayed a more obvious and clearer leaching trend, it was chosen as the representative in the leaching condition experiments.

3.1.2. Factors concerning DOC Leaching of Microplastic

The light and the pH conditions were considered in this study. It can be observed that the pH had a significant impact on the dissolution and leaching process of PVC-MP (Figure 1c). Compared to other conditions, the leaching process of PVC-MP was suppressed in a weakly acidic environment with a pH level of 5, and reached only 3.3 mg/L on day 7. In contrast, the leaching concentration showed the most dramatic increase when pH = 9, which ended at 10.7 mg/L on day 7, nearly 3 times the amount when pH = 5.
It is presumed that the PVC-MP leaching process may be more active in an alkaline environment, which can be attributed to the solubility of additives in PVC particles. This observation is consistent with a previous study, which claimed that the dose of benzophenone-3 (BP-3) leaching from polyethylene MP fragments was higher when pH = 8 than when pH = 6, because BP-3 additives had a higher solubility (pK(a) = 7.07) when pH = 8 [34].
The effect of light conditions on the initial leaching concentration was more dramatic than that of pH. Over time it was seen that the DOC concentration was considerably higher under UV light than other light conditions. It can be concluded that, after 7 days of irradiation, the DOC concentration under UV light reached 13.3 mg/L, nearly 2 times the amount in dark condition (6.3 mg/L), while in the natural light condition, the value was 7.7 mg/L. Zhu et al. [35] also corroborated the stimulating effect of light on the leaching of PS, which could release 25.3 mg/L plastic-derived DOM into the aqueous phase during 68 days of leaching. The enhanced leaching result with UV light can be attributed to the photochemical cleavage process of PVC microplastic, in which the surface of micro-sized plastic particles become more vulnerable and then dissolve into the aqueous phase. UV light has ample energy to trigger the radical chain mechanism and subsequently produce initial free radicals, which induces C−C and C−H bonds to break from the polymer chain [36]. Song et al. [37] demonstrated that low-density polyethylene (LDPE), PS, and PP plastic debris underwent significant surface fragmentation under 12 months of simulated sunlight exposure.

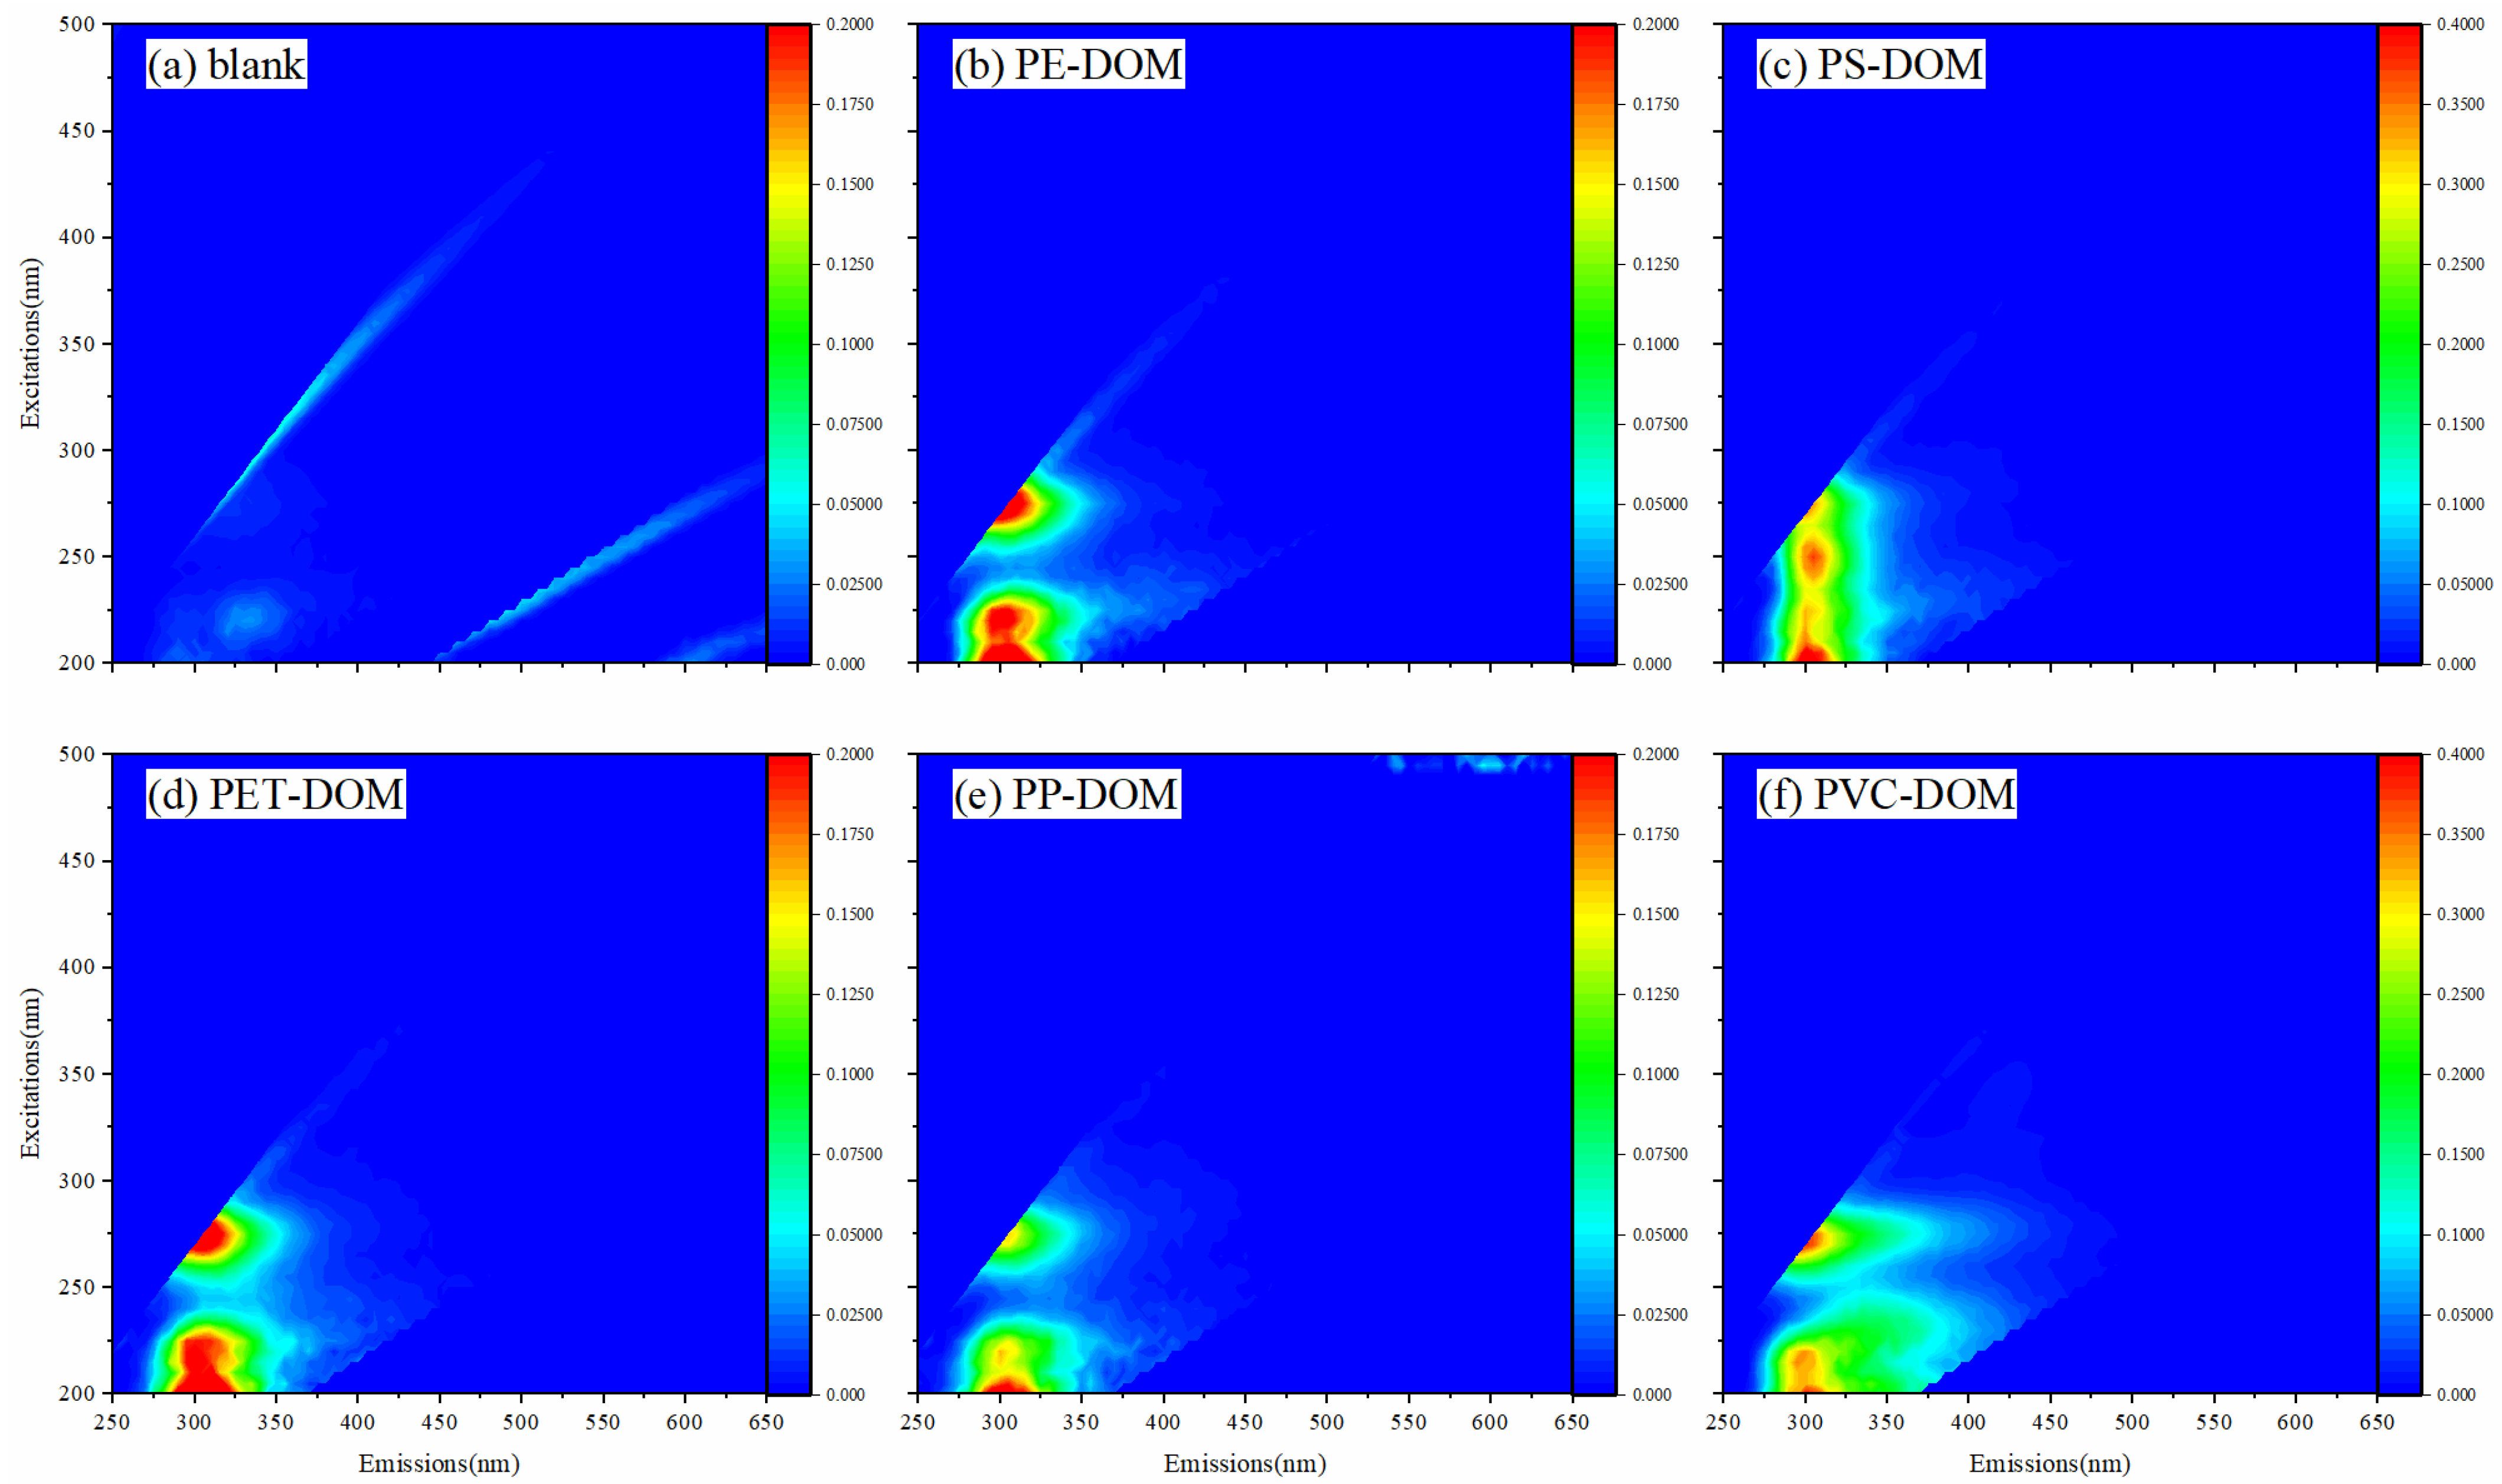
3.2. Fluorescence EEMs

3.2.1. Different Types of Microplastics

Fluorescence EEM has been widely used to probe the chemical composition and transaction of DOM, because of its high efficiency and sensitivity [38]. Fluorescence EEMs of the five types of MP-derived DOM after 7 days of leaching are shown in Figure 2. Since there was no fluorescence peak for the blank sample (Figure 2a), it is certain that the fluorescence signals detected in Figure 2 were originated from MP-DOM. It can be observed that the fluorescence characteristics of the three MP-DOMs, i.e., PE-DOM (Figure 2b), PP-DOM (Figure 2e), and PET-DOM (Figure 2d), were basically alike. For these three MPs, there was a prominent fluorescence peak T located at Ex/Em = 265–280 nm/305 nm, with peak intensity of 0.2595 R.U. for PE-DOM. The position of the other two peaks, i.e., peak B1 (Ex/Em = 215–225 nm/305 nm) and peak B2 (Ex/Em = 200–210 nm/305 nm), fell in the protein-like fluorescence region. The intensities of B1 and B2 for PE-DOM were 0.2121 and 0.3179 R.U. respectively. The PET-DOM showed fluorescence intensities of 0.2652, 0.2137, and 0.2094 R.U. for peaks T, B1, and B2, respectively. For PP-DOM, although the peak positions lied in the same position as the previous two, the peak intensity was significantly weaker. Furthermore, during the leaching process, PP-MP powder showed obvious hydrophobicity, which may result in the less prominent peaks for the fluorescent signature. In comparison, PS-DOM had an additional fluorescence peak at Ex/Em = 240–260 nm/305 nm, with peak intensity of 0.3451 R.U. (Figure 2c).
The fluorescence response of PVC-DOM was the strongest among all MPs (Figure 2f). PVC-DOM contained two obvious peaks, peak B1 (Ex/Em = 260–280 nm/305 nm) and peak B2 (Ex/Em = 200–230 nm/305 nm, 0.4014 R.U.). Peak B1 was located at the same peak position as the previous ones for PP-DOM, PE-DOM, and PET-DOM, but with much higher peak intensity (0.3811R.U.).
According to the literature, phenols and polycyclic aromatic hydrocarbons can serve as a source of fluorescence signals in the region where Em < 380 nm, and can explain the presence of peaks T and B [39]. In a previous study by Lee et al. [18], four components were identified during leaching of PS and PVC plastics. Peaks T and B of all five kinds of MPs in this research matched well with the location of C1 and C4, which represent the DOM generated from DEHP and BPA, respectively. Therefore, it was further validated that the C1 and C4 fluorescence matter could be utilized as a fluorescence probe to track the additives. The larger intensity of C1 and C2 components in PVC-DOM implies that PVC may contain more chemical additives, thus leading to the relatively higher DOC concentration in Figure 1a. Another conclusion is that the fluorescence characteristic of MP is highly correlated to the additives it contains and its hydrophobicity.

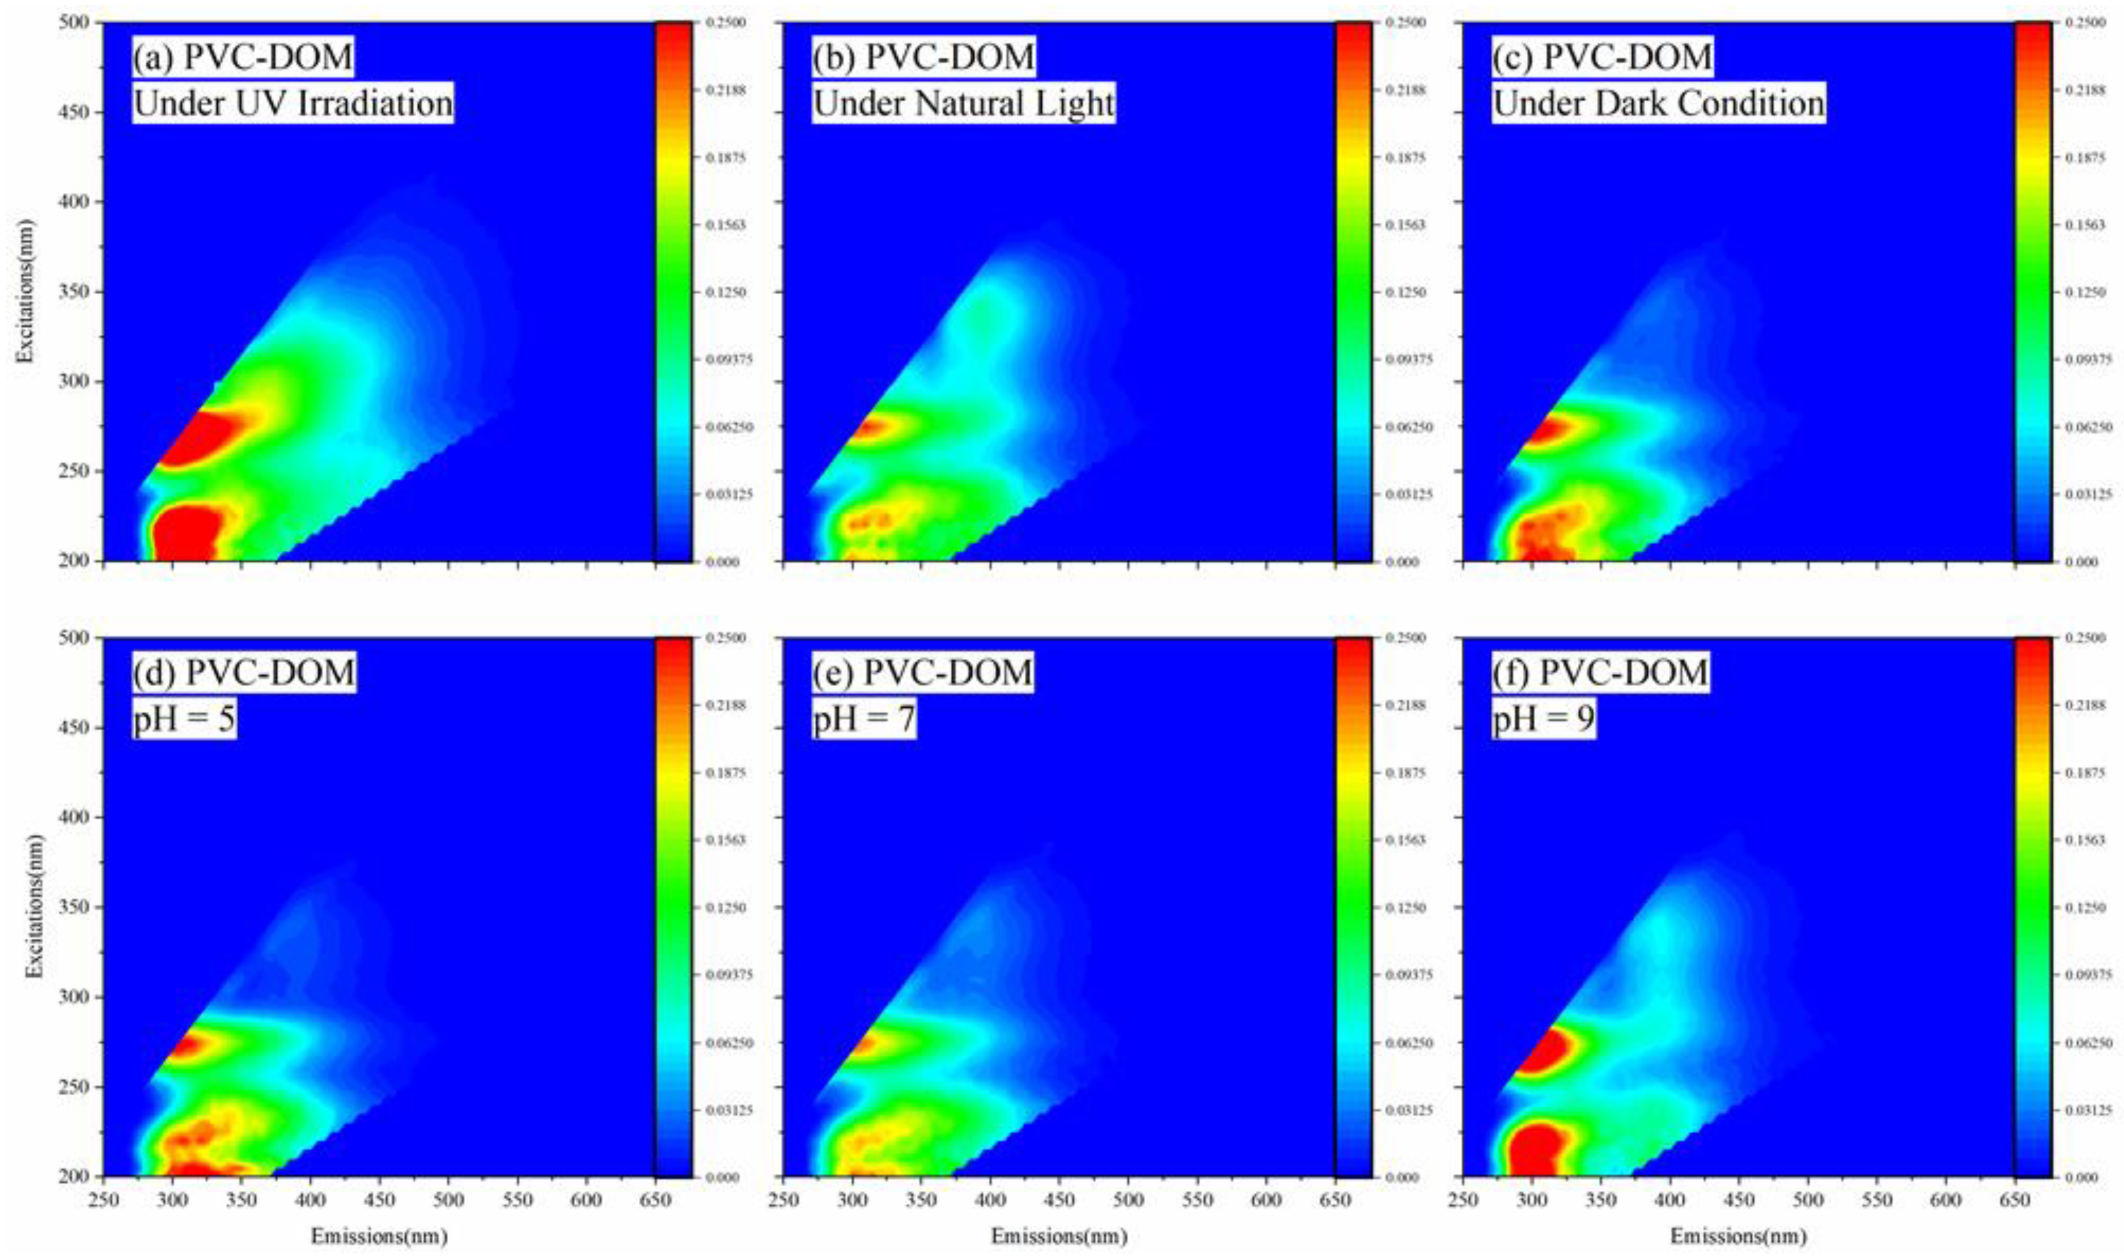
3.2.2. PVC-DOM under Different Leaching Conditions

The effect of light and pH leaching conditions on PVC-DOM can be observed more visually using fluorescence spectrograms (Figure 3). Regardless of the leaching conditions, the fluorescence intensity showed different degrees of enhancement, and the fluorescence range showed a tendency to expand in all cases (Figure 3). This indicates that, as time extended, a non-negligible quantity of fluorescent DOM substances from the MP particles dissolved into the natural water system.
A comparison of the fluorescence spectrograms showed that the effect of UV illumination on the leaching of MP-DOM was much more pronounced than that of other conditions (Figure 3a). The peak B1 intensity after 7 days (0.6327 R.U.) was nearly 2.5 times the intensity under natural light conditions (0.2469 R.U.).
It is also noteworthy that the fluorescence signatures appeared in the humic-like region after 7 days of UV irradiation, suggesting the humic-like DOM was linked with the photodegradation of PVC-MPs. Recent studies have declared that MP-DOM fluorescence signaling can be closely related to the photo-aging process of MP [18,33,40]. The fluorescence intensity of PVC-DOM solubilization under dark conditions was not very different from that under natural conditions. In addition, in the pH leaching conditions experiment, a more significant increase in fluorescence intensity was observed after 7 days of leaching when pH = 9 (Figure 3f). Combined with the results of DOC tests, it can be assumed that the PVC degradation process may be accelerated under alkaline environment.

3.3. Metal-Binding Characteristics of Different Fluorescent Components

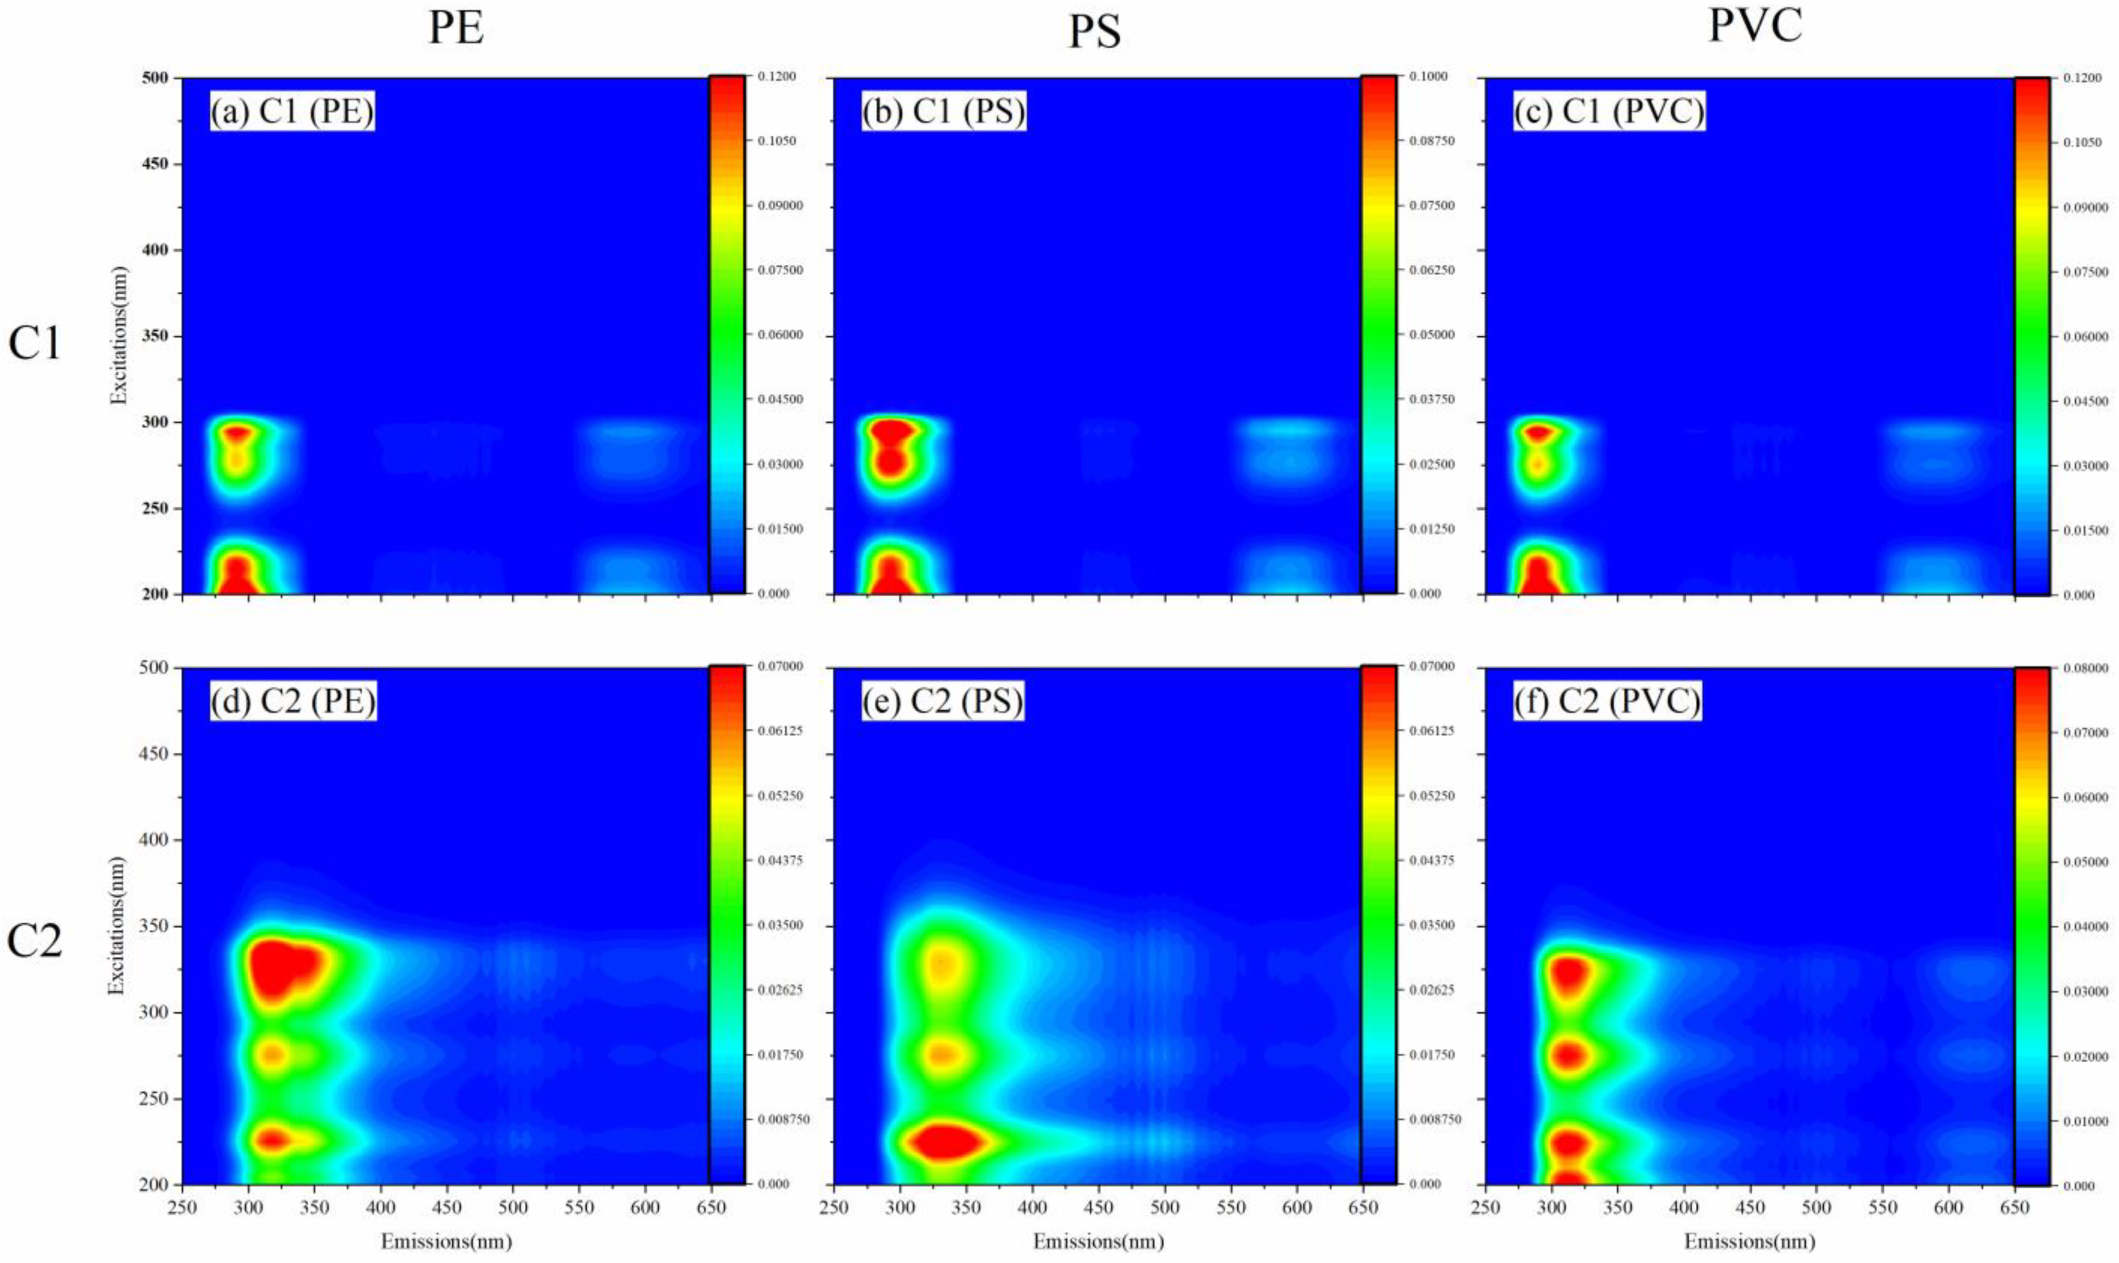
3.3.1. Fluorescent Components Identified by PARAFAC Modeling

PARAFAC modeling was applied to identify the individual components in MP-DOM derived from PE, PS, and PVC. A two-component model for three plastics is displayed in Figure 4. For each plastic type, component 1(C1) fell in the same region, peaking at 205(295, 275, 215)/290(Ex/Em) (Figure 4a–c). Component 2(C2) differed according to the specific MPs. It is of interest that PE and PS shared a peak location of C2 at 325(225, 275)/320 nm(Ex/Em) (Figure 4d,e), while for PS the peak intensity at 225/320 nm(Ex/Em) was more obvious. For PVC, C2 was located at 325(225, 225, 275)/320 nm(Ex/Em) (Figure 4f). All these components were located in the protein/phenol-like fluorescence region. Due to the presence of the protein/phenol-like region in EEM plots of MP-DOM, the aromatic carboxyl groups and phenolic OH groups in the MP-DOM structure may serve as the binding sites to form highly stable complexes with metal ions. The result of C1 corresponded well to the fluorescence response of C4 in Lee’s research [14], indicating the possibility of utilizing C1 as a fluorescence indicator of the BPA additives. The fact that C1 was found in every MP revealed that this substance takes up quite a large proportion of MP-DOM. C2 is another commonly found fluorescence compound in MP-DOM. This aligns with the similar occurrence in previous reports [18,33], suggesting that C2 is most likely to originate from DEHP, an additive in microplastics.

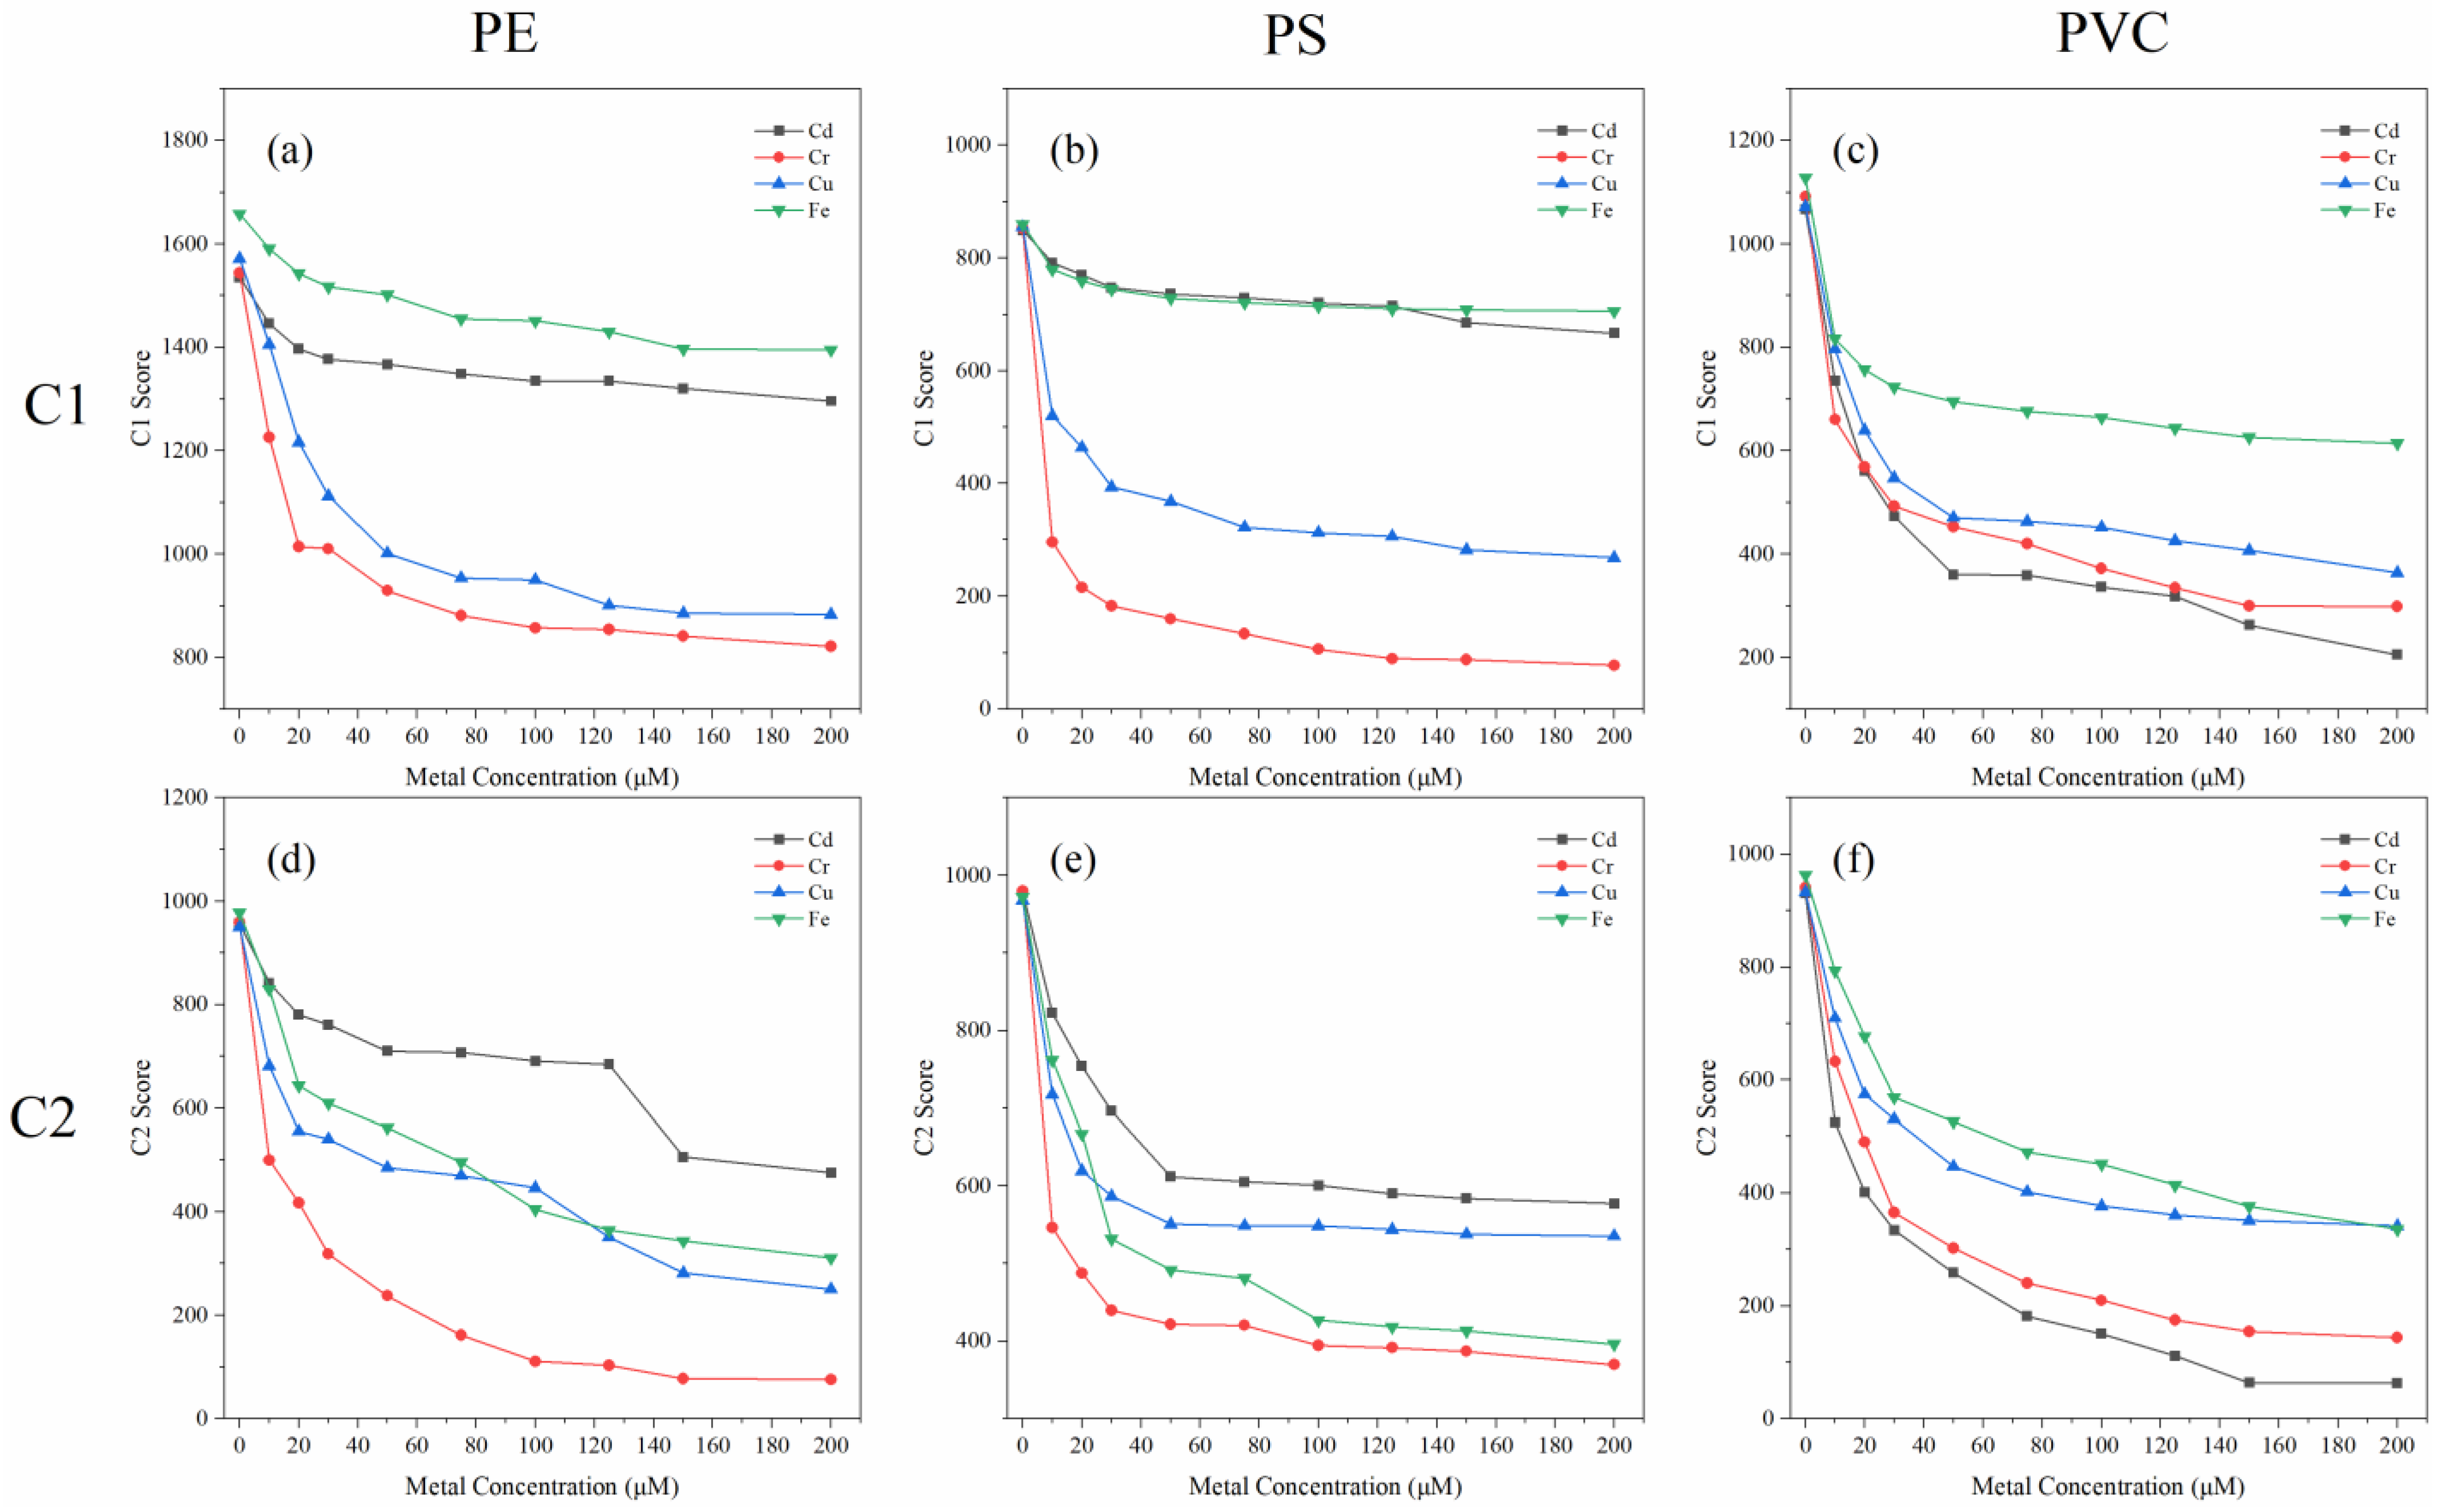
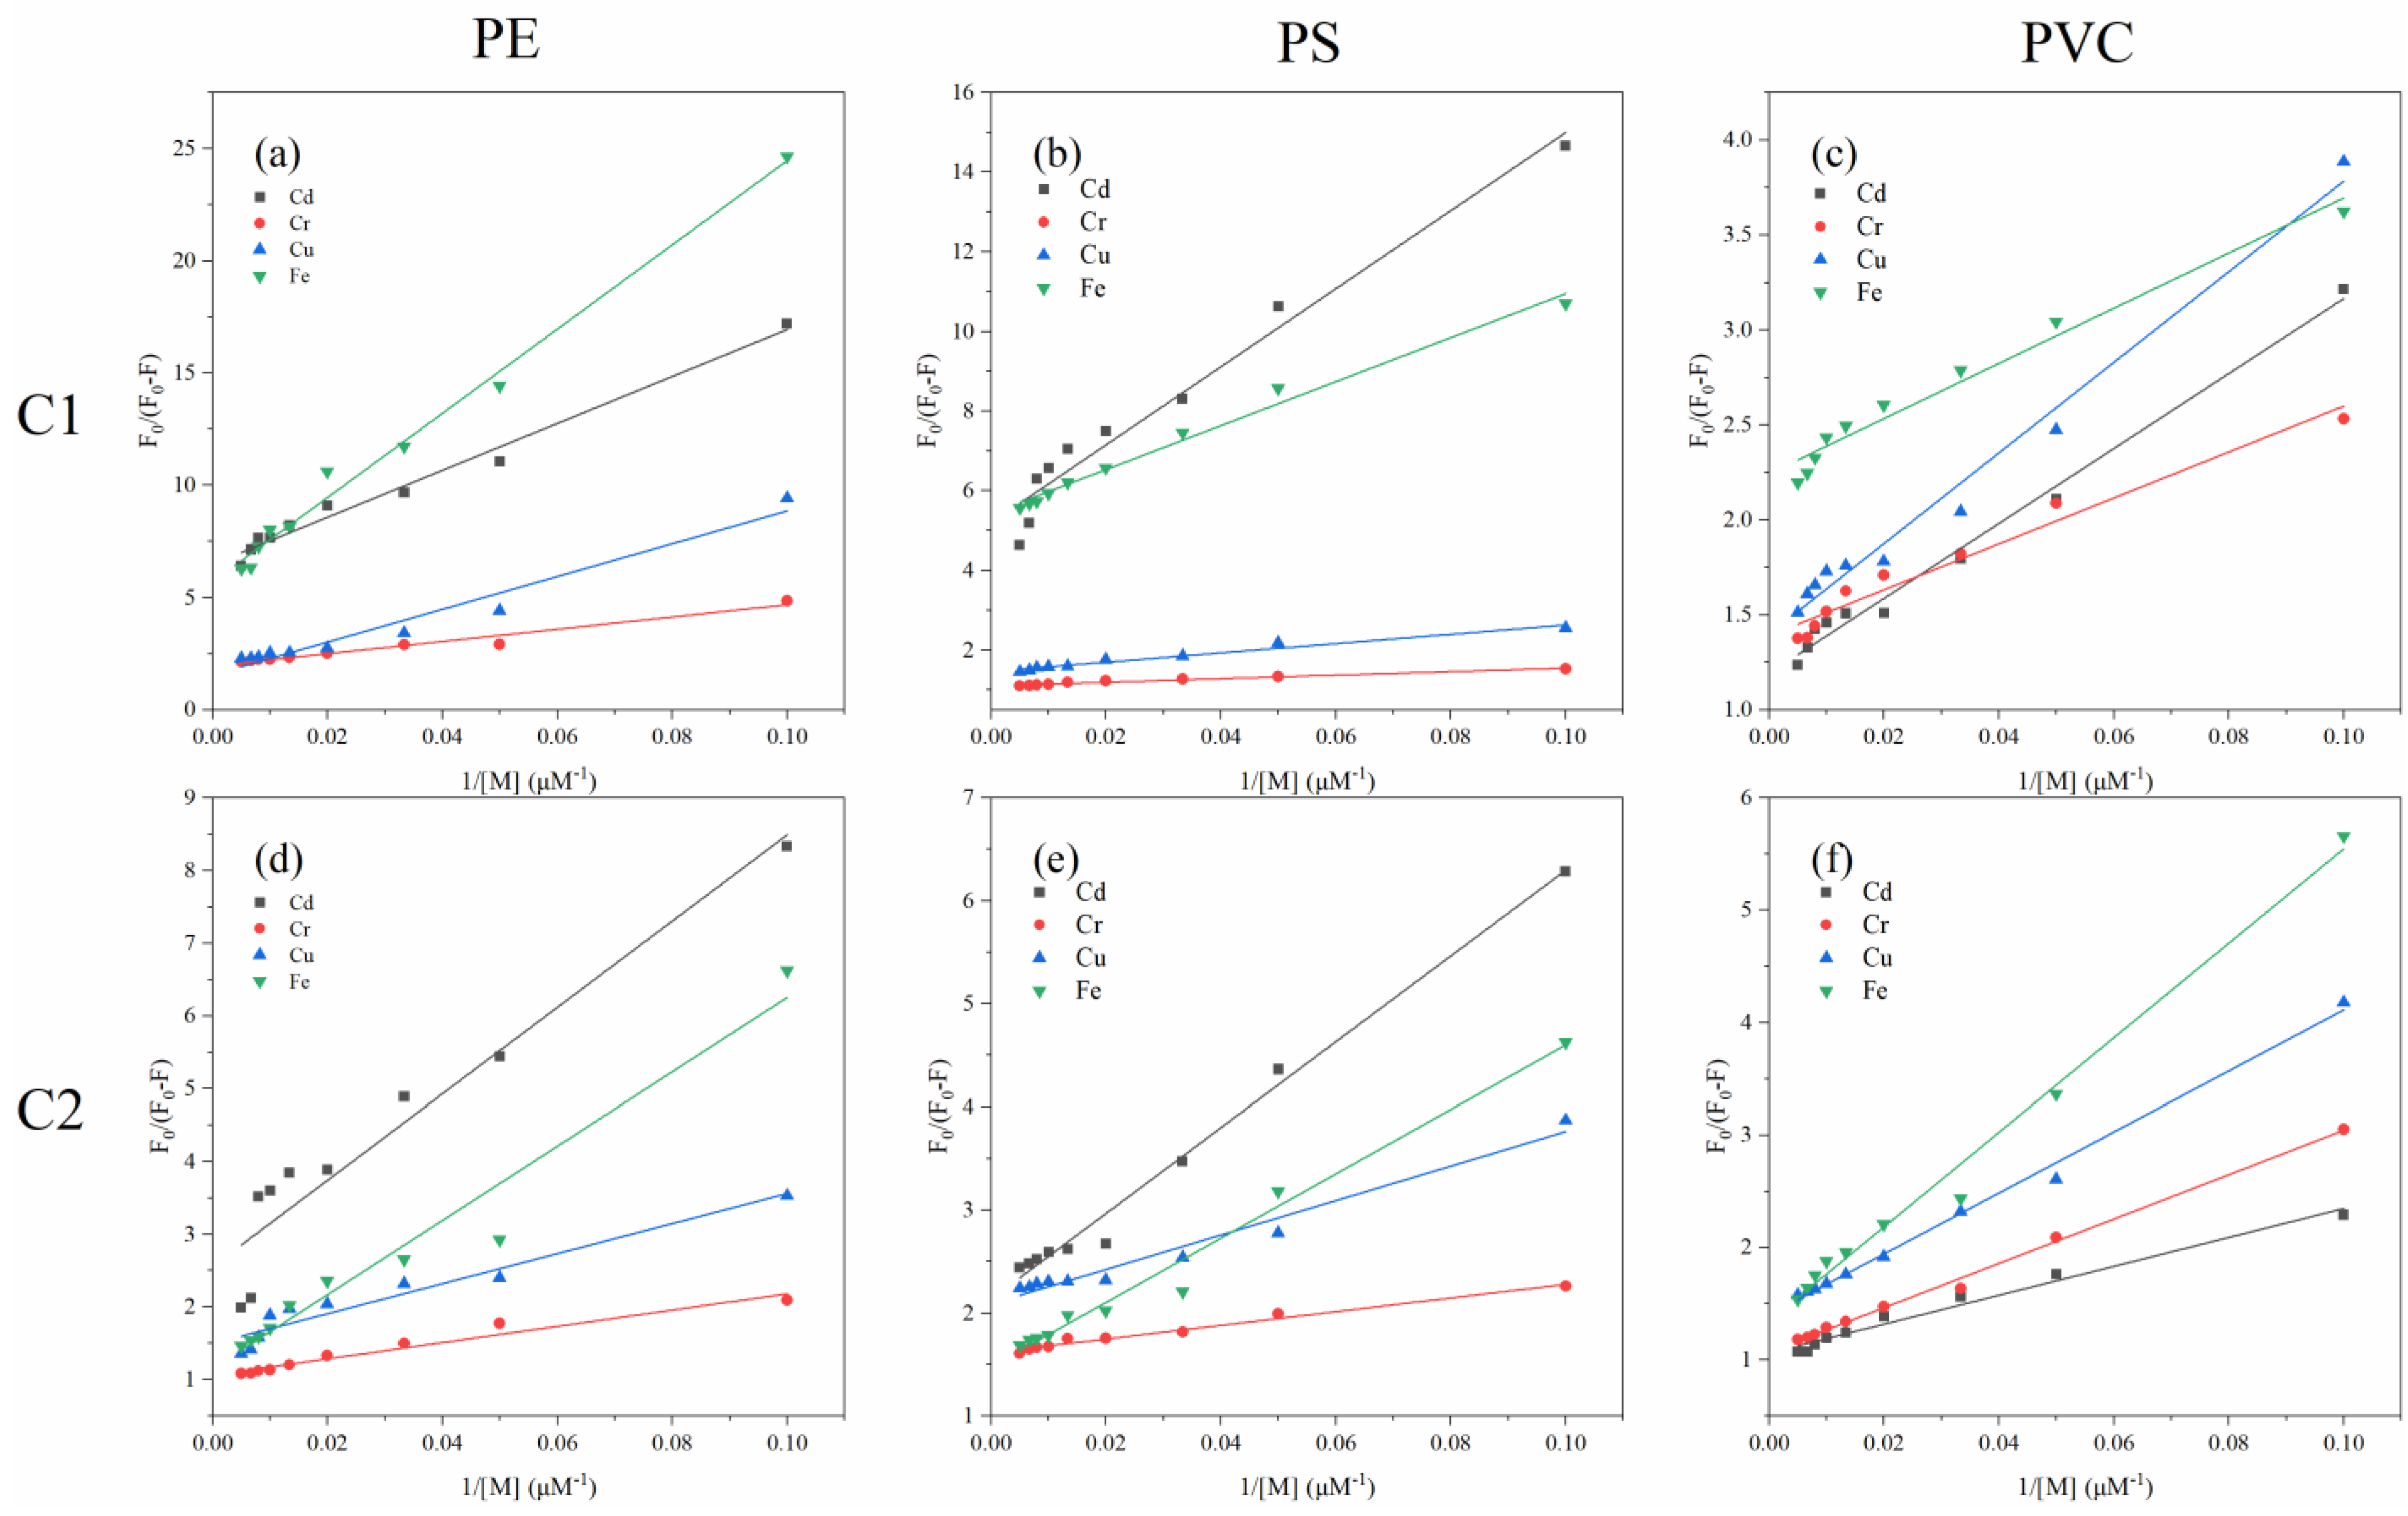
3.3.2. Fluorescence Quenching Behavior of Different Fluorescent Components

The quenching trend of fluorescence components C1 and C2 after the addition of metal ions is shown in Figure 5. For every type of MP, the addition of different metals affected the quenching curves of both components to distinct degrees (Table 1).
It is noteworthy that, upon the addition of chromium, components C1 and C2 showed a pronounced degree of fluorescence quenching for all microplastics. For example, components C1 and C2 showed the largest extent of quenching, with 46.81% for C1 and 96.14% for C2 in PE-DOM, while the abatement ratios were 90.94% and 62.26%, respectively, for PS-DOM. Even for PVC-DOM, the extent of quenching for C1 and C2 showed a reduction of up to 72.67% and 84.67%, respectively (Table 1). In addition, a negligible extent of fluorescence quenching was observed for component C1 in PE-DOM and PS-DOM after the addition of cadmium (as low as 15.62% for C1 in PE and 21.55% for C1 in PS). On the contrary, the effect of cadmium on the quenching extent of both components in PVC-DOM was the largest, at 80.79% for C1 and 93.24% for C2, respectively. Similarly, apart from cadmium, C1 in PE-DOM and PS-DOM was also insensitive to iron, with a low reduction ratio of 15.88% and 17.95%, respectively.
The fluorescence scores of C1 and C2 decreased continuously with increasing metal concentration regardless of the type of metal, which strongly suggested that the phenol/protein-like components contained structures that actively participated in the metal binding process [41]. In addition, the decrease in C2 was larger than that in C1 for all plastic types, which indicates that the C2 component is more sensitive to metal ions than C1. For C1 in PE-DOM, the order of decrease in fluorescence scores was Cr > Cu > Cd > Fe (Figure 5a), while that for C2 was Cr > Cu > Fe > Cd (Figure 5d), indicating that PE-DOM had a stronger binding ability to chromium. For PS-DOM, the decreasing orders of fluorescence intensity of C1 (Figure 5b) and C2 (Figure 5e) were Cr > Cu > Cd > Fe and Cr > Fe > Cu > Cd, respectively, indicating that PS-DOM also had stronger combining affinity with chromium. Regarding PVC-DOM, the decreasing orders for C1 (Figure 5c) and C2 (Figure 5f) were Cd > Cr > Cu > Fe and Cd > Cr > Fe > Cu, which suggested that PVC-DOM contained more binding sites with cadmium. In conclusion, the complexation mechanism and binding ability during the interaction process between heavy metal and MP-DOM can be greatly influenced by the metal types, the MP-DOM types, and the perturbation of environmental factors.
To study the differences in the binding properties of the two fluorescent components from three types of MP-DOM with different metals, the modified Stern–Volmer equation was used to calculate the binding parameters for each metal based on the fluorescence scores of the individual components engaged in fluorescence quenching (Table 2 and Figure 6). The F0/F0-F values obtained from fluorescence quenching experiments of each component in MP-DOM showed a very significant linear correlation with 1/[M], and the results for the binding parameters of each metal are listed in Table 2.
The fluorescent components in different MP-DOM samples had a range of binding constants. For PE-DOM, the ranges of variation of C1 and C2 were 3.06–4.27 and 3.11–4.55, respectively. For PS-DOM, the ranges were 3.97–5.51 and 3.94–5.49, respectively, whereas for PVC-DOM, the binding stability constants of the C1 component were 4.07–5.03 and the variation of C2 ranged from 3.46 to 4.40 (Table 2). It is clear that the range of log K values was related to the type of metal as well as the fluorescent component. The results of high binding constants suggested that phenolic and protein substances in MP-DOM can strongly interact with metals, thus affecting the migration fate of metals in natural and engineered systems. In a previous report, the extent of DOM interaction with heavy metals was correlated with the number of ligand sites, and the log K values were proportional to the level of strong ligand sites (hydroxyl, sulfur-, and nitrogen-containing groups, etc.) [42]. Since nitrogen-containing groups were mainly present in protein-like substances, the high binding constants and f values in the table can be explained.
For the same plastic type, it can be observed that the binding constants of chromium were the highest in both PE-DOM and PS-DOM, with 4.27 and 4.55, respectively, for the former, and 5.51 and 4.49 for the latter. For PVC-DOM, the highest values of log K were associated with cadmium and ion, with 4.10 and 5.03, respectively. This was consistent with the trend in the previous quenching curves; this indicates that PE-DOM and PS-DOM had a greater tendency to bind with chromium and the complexation process was more stable, whereas C1 of PVC-DOM had a stronger complexation affinity for cadmium, and C2 of PVC-DOM had a stable complexation preference for iron. However, overall, the log K values of MP-DOM showed significant differences with different metals and components (Figure 6).
Even if the PARAFAC analysis method was successfully applied in this study, the conclusions have limitations as the laboratory-based experiments have inherent flaws and the leaching time in this study was not long enough. Further investigation of the metal binding mechanism should be undertaken. To investigate the environmental behaviors and chemical compositions of MP-DOM, further simulation experiments are needed.

4. Conclusions

In this work, the fluorescence EEM-PARAFAC analysis method was used to track the leaching behavior of multiple microplastic-derived DOMs and their ability to bind with metals. The following conclusions can be drawn:
(1) Five types of MPs, i.e., PE, PVC, PP, PET, and PS rapidly produced MP-DOM at certain concentrations during leaching, among which the leaching rate and concentration level of PVC were much higher than those of others.
(2) UV irradiation greatly promoted the cleavage of MPs and consequently accelerated the release of more PVC-DOM. Moreover, the leaching of PVC-DOM was promoted under alkaline conditions.
(3) The interaction between plastic-derived DOM and heavy metals, including Cu, Fe, Cr, and Cd, was demonstrated by the fluorescence quenching method. EEM-PARAFAC identified two specific fluorescent components in three MP-DOMs from PS, PE, and PVC. Both components were located in the protein/phenolic fluorescence region.
(4) The interaction of each component of MP-DOM with the four metals showed large differences depending on the metal type and plastic type. Both PE-DOM and PVC-DOM showed a tendency to bind to chromium, while PVC-DOM showed a high binding affinity for cadmium and iron.
The above results show the potential applicability of using an integrated approach of EEM combined with PARAFAC to follow the formation process of MP-DOM and the complexation behavior with metals in aquatic systems. The metal binding sequences for multiple MP-DOMs clearly demonstrated the different binding properties of individual components. Furthermore, the EEM-PARAFAC techniques are helpful for investigating the environmental behaviors and risks of MP-DOM and designing favorable strategies for reasonable applications of plastics.

Author Contributions

M.Y.: Investigation, Experiment design and operation, Data curation, Writing—original draft, Methodology, Project administration. H.X.: Investigation, Data curation. K.Z.: Conceptualization, Writing—original draft, Supervision. C.P.: Supervision, Resources, Methodology. Y.T.: Investigation, Data curation. W.C.: Conceptualization, Data curation, Validation, Writing—original draft, Writing—review and editing, Funding acquisition. All authors have read and agreed to the published version of the manuscript.

Funding

This work was financially supported by the National Science Foundation of China (22276217), and the Fundamental Research Funds for the Central Universities of Central South University.

Data Availability Statement

Data available on request due to restrictions, e.g., privacy or ethical.

Conflicts of Interest

The authors declare no conflict of interest. The funders had no role in the design of the study; in the collection, analyses, or interpretation of data; in the writing of the manuscript; or in the decision to publish the results.

References

  1. Garcial, J.; Robertson, M. The future of plastics recycling chemical advances are increasing the proportion of polymer waste that can be recycled. Sci. Adv. 2017, 358, 870–872. [Google Scholar] [CrossRef]
  2. Geyer, R.; Jambeck, J.R.; Law, K.L. Production, use, and fate of all plastics ever made. Sci. Adv. 2017, 3, e1700782. [Google Scholar] [CrossRef]
  3. Uekert, T.; Kasap, H.; Reisner, E. Photoreforming of Nonrecyclable Plastic Waste over a Carbon Nitride/Nickel Phosphide Catalyst. J. Am. Chem. Soc. 2019, 141, 15201–15210. [Google Scholar] [CrossRef]
  4. Tian, W.; Song, P.; Zhang, H.; Duan, X.; Wei, Y.; Wang, H.; Wang, S. Microplastic materials in the environment: Problem and strategical solutions. Prog. Mater. Sci 2023, 132, 105303. [Google Scholar] [CrossRef]
  5. Rochman, C.M.; Hoh, E.; Hentschel, B.T.; Kaye, S. Long-term field measurement of sorption of organic contaminants to five types of plastic pellets: Implications for plastic marine debris. Environ. Sci. Technol. 2013, 47, 1646–1654. [Google Scholar] [CrossRef] [PubMed]
  6. Frias, J.; Nash, R. Microplastics: Finding a consensus on the definition. Mar. Pollut. Bull. 2019, 138, 145–147. [Google Scholar] [CrossRef] [PubMed]
  7. Zettler, E.R.; Mincer, T.J.; Amaral-Zettler, L.A. Life in the “plastisphere”: Microbial communities on plastic marine debris. Environ. Sci. Technol. 2013, 47, 7137–7146. [Google Scholar] [CrossRef] [PubMed]
  8. Brennecke, D.; Duarte, B.; Paiva, F.; Caçador, I.; Canning-Clode, J. Microplastics as vector for heavy metal contamination from the marine environment. Estuar. Coast. Shelf Sci. 2016, 178, 189–195. [Google Scholar] [CrossRef]
  9. Zhang, F.; Man, Y.B.; Mo, W.Y.; Man, K.Y.; Wong, M.H. Direct and indirect effects of microplastics on bivalves, with a focus on edible species: A mini-review. Title Crit. Rev. Environ. Sci. Technol. 2019, 50, 2109–2143. [Google Scholar] [CrossRef]
  10. Amelia, T.S.M.; Khalik, W.M.A.W.M.; Ong, M.C.; Shao, Y.T.; Pan, H.-J.; Bhubalan, K. Marine microplastics as vectors of major ocean pollutants and its hazards to the marine ecosystem and humans. Prog. Earth. Planet. Sci. 2021, 8, 1–26. [Google Scholar] [CrossRef]
  11. Priya, K.L.; Renjith, K.R.; Joseph, C.J.; Indu, M.S.; Srinivas, R.; Haddout, S. Fate, transport and degradation pathway of microplastics in aquatic environment—A critical review. Reg. Stud. Mar. Sci. 2022, 56, 102647. [Google Scholar] [CrossRef]
  12. Wei, X.F.; Capezza, A.J.; Cui, Y.; Li, L.; Hakonen, A.; Liu, B.; Hedenqvist, M.S. Millions of microplastics released from a biodegradable polymer during biodegradation/enzymatic hydrolysis. Water Res. 2022, 211, 118068. [Google Scholar] [CrossRef] [PubMed]
  13. Zhu, K.; Sun, Y.; Jiang, W.; Zhang, C.; Dai, Y.; Liu, Z.; Wang, T.; Guo, X.; Jia, H. Inorganic anions influenced the photoaging kinetics and mechanism of polystyrene microplastic under the simulated sunlight: Role of reactive radical species. Water Res. 2022, 216, 118294. [Google Scholar] [CrossRef] [PubMed]
  14. Wani, A.K.; Akhtar, N.; Naqash, N.; Rahayu, F.; Djajadi, D.; Chopra, C.; Singh, R.; Mulla, S.I.; Sher, F.; Americo-Pinheiro, J.H.P. Discovering untapped microbial communities through metagenomics for microplastic remediation: Recent advances, challenges, and way forward. Environ. Sci. Pollut. Res. Int. 2023, 1–24. [Google Scholar] [CrossRef] [PubMed]
  15. Potthoff, A.; Oelschlagel, K.; Schmitt-Jansen, M.; Rummel, C.D.; Kuhnel, D. From the sea to the laboratory: Characterization of microplastic as prerequisite for the assessment of ecotoxicological impact. Integr. Environ. Assess. Manag. 2017, 13, 500–504. [Google Scholar] [CrossRef]
  16. Sait, S.T.L.; Sorensen, L.; Kubowicz, S.; Vike-Jonas, K.; Gonzalez, S.V.; Asimakopoulos, A.G.; Booth, A.M. Microplastic fibres from synthetic textiles: Environmental degradation and additive chemical content. Environ. Pollut. 2021, 268, 115745. [Google Scholar] [CrossRef] [PubMed]
  17. Mortula, M.M.; Atabay, S.; Fattah, K.P.; Madbuly, A. Leachability of microplastic from different plastic materials. J. Environ. Manag. 2021, 294, 112995. [Google Scholar] [CrossRef]
  18. Lee, Y.K.; Murphy, K.R.; Hur, J. Fluorescence Signatures of Dissolved Organic Matter Leached from Microplastics: Polymers and Additives. Environ. Sci. Technol. 2020, 54, 11905–11914. [Google Scholar] [CrossRef]
  19. M’Rabet, C.; Kefi-Daly Yahia, O.; Couet, D.; Gueroun, S.K.M.; Pringault, O. Consequences of a contaminant mixture of bisphenol A (BPA) and di-(2-ethylhexyl) phthalate (DEHP), two plastic-derived chemicals, on the diversity of coastal phytoplankton. Mar. Pollut. Bull. 2019, 138, 385–396. [Google Scholar] [CrossRef]
  20. Holmes, L.A.; Turner, A.; Thompson, R.C. Adsorption of trace metals to plastic resin pellets in the marine environment. Environ. Pollut. 2012, 160, 42–48. [Google Scholar] [CrossRef]
  21. Sun, F.; Li, Y.; Wang, X.; Chi, Z.; Yu, G. Using new hetero-spectral two-dimensional correlation analyses and synchrotron-radiation-based spectromicroscopy to characterize binding of Cu to soil dissolved organic matter. Environ. Pollut. 2017, 223, 457–465. [Google Scholar] [CrossRef]
  22. Stedmon, C.A.; Markager, S.; Bro, R. Tracing dissolved organic matter in aquatic environments using a new approach to fluorescence spectroscopy. Mar. Chem. 2003, 82, 239–254. [Google Scholar] [CrossRef]
  23. Chen, W.; Westerhoff, P.; Leenheer, J.A.; Booksh, K. Fluorescence excitation− emission matrix regional integration to quantify spectra for dissolved organic matter. Environ. Sci. Technol. 2003, 37, 5701–5710. [Google Scholar] [CrossRef] [PubMed]
  24. Chen, W.; Yu, H.Q. Advances in the characterization and monitoring of natural organic matter using spectroscopic approaches. Water. Res. 2021, 190, 116759. [Google Scholar] [CrossRef] [PubMed]
  25. Amorello, D.; Barreca, S.; Gambacurta, S.; Gulotta, M.G.; Orecchio, S.; Pace, A. An analytical method for monitoring micro-traces of landfill leachate in groundwater using fluorescence excitation–emission matrix spectroscopy. Anal. Methods 2016, 8, 3475–3480. [Google Scholar] [CrossRef]
  26. Majedi, S.M.; Kelly, B.C.; Lee, H.K. Combined effects of water temperature and chemistry on the environmental fate and behavior of nanosized zinc oxide. Sci. Total. Environ. 2014, 496, 585–593. [Google Scholar] [CrossRef]
  27. Suhrhoff, T.J.; Scholz-Bottcher, B.M. Qualitative impact of salinity, UV radiation and turbulence on leaching of organic plastic additives from four common plastics—A lab experiment. Mar. Pollut. Bull. 2016, 102, 84–94. [Google Scholar] [CrossRef]
  28. Lee, Y.K.; Hur, J. Adsorption of microplastic-derived organic matter onto minerals. Water. Res. 2020, 187, 116426. [Google Scholar] [CrossRef]
  29. Hays, M.D.; Ryan, D.K.; Pennell, S. A modified multisite Stern− Volmer equation for the determination of conditional stability constants and ligand concentrations of soil fulvic acid with metal ions. Anal. Chem. 2004, 76, 848–854. [Google Scholar] [CrossRef]
  30. Da Silva, J.C.E.; Machado, A.A.; Oliveira, C.J.; Pinto, M.S. Fluorescence quenching of anthropogenic fulvic acids by Cu (II), Fe (III) and UO22+. Talanta 1998, 45, 1155–1165. [Google Scholar] [CrossRef]
  31. Murphy, K.R.; Stedmon, C.A.; Graeber, D.; Bro, R. Fluorescence spectroscopy and multi-way techniques. PARAFAC. Anal. Methods 2013, 5, 6557–6566. [Google Scholar] [CrossRef]
  32. Lee, Y.K.; Romera-Castillo, C.; Hong, S.; Hur, J. Characteristics of microplastic polymer-derived dissolved organic matter and its potential as a disinfection byproduct precursor. Water. Res. 2020, 175, 115678. [Google Scholar] [CrossRef] [PubMed]
  33. Chen, M.; Xu, J.; Tang, R.; Yuan, S.; Min, Y.; Xu, Q.; Shi, P. Roles of microplastic-derived dissolved organic matter on the photodegradation of organic micropollutants. J. Hazard. Mater. 2022, 440, 129784. [Google Scholar] [CrossRef]
  34. Achar, J.C.; Na, J.; Im, H.; Jung, J. Role of extracellular polymeric substances in leaching and bioconcentration of benzophenone-3 from microplastic fragments. J. Hazard. Mater. 2021, 416, 125832. [Google Scholar] [CrossRef]
  35. Zhu, L.; Zhao, S.; Bittar, T.B.; Stubbins, A.; Li, D. Photochemical dissolution of buoyant microplastics to dissolved organic carbon: Rates and microbial impacts. J. Hazard. Mater. 2020, 383, 121065. [Google Scholar] [CrossRef] [PubMed]
  36. Singh, B.; Sharma, N. Mechanistic implications of plastic degradation. Polym. Degrad. Stab. 2008, 93, 561–584. [Google Scholar] [CrossRef]
  37. Song, Y.K.; Hong, S.H.; Eo, S.; Shim, W.J. The fragmentation of nano- and microplastic particles from thermoplastics accelerated by simulated-sunlight-mediated photooxidation. Environ. Pollut. 2022, 311, 119847. [Google Scholar] [CrossRef]
  38. Carstea, E.M.; Popa, C.L.; Baker, A.; Bridgeman, J. In situ fluorescence measurements of dissolved organic matter: A review. Sci. Total. Environ. 2020, 699, 134361. [Google Scholar] [CrossRef] [PubMed]
  39. Carstea, E.M.; Bridgeman, J.; Baker, A.; Reynolds, D.M. Fluorescence spectroscopy for wastewater monitoring: A review. Water. Res. 2016, 95, 205–219. [Google Scholar] [CrossRef] [PubMed]
  40. Zhang, X.; Su, H.; Gao, P.; Li, B.; Feng, L.; Liu, Y.; Du, Z.; Zhang, L. Effects and mechanisms of aged polystyrene microplastics on the photodegradation of sulfamethoxazole in water under simulated sunlight. J. Hazard. Mater. 2022, 433, 128813. [Google Scholar] [CrossRef]
  41. Lee, Y.K.; Hong, S.; Hur, J. Copper-binding properties of microplastic-derived dissolved organic matter revealed by fluorescence spectroscopy and two-dimensional correlation spectroscopy. Water. Res. 2021, 190, 116775. [Google Scholar] [CrossRef] [PubMed]
  42. Croué, J.-P.; Benedetti, M.; Violleau, D.; Leenheer, J. Characterization and copper binding of humic and nonhumic organic matter isolated from the South Platte River: Evidence for the presence of nitrogenous binding site. Environ. Sci. Technol. 2003, 37, 328–336. [Google Scholar] [CrossRef] [PubMed]
Figure 1. Variations with time in the concentrations of leached DOC for (a) 5 types of microplastics (PP, PS, PET, PVC, PE) in 24 h; (b) 5 types of microplastics in 7 days; (c) PVC microplastics under different light and pH leaching conditions in 7 days. The dose of added microplastics was 5.0 g L−1.
Separations 10 00101 g001
Figure 2. Fluorescence EEM plots of (a) artificial freshwater solutions used as a background, and the DOM leached from (b) PE; (c) PS; (d) PET; (e) PP; and (f) PVC after 7 days of leaching (5 g L−1). Note that different scales were used for different plastics due to their varying signal ranges.
Separations 10 00101 g002
Figure 3. Fluorescence EEM plots of leached PVC-DOM under different light conditions: (a) UV irradiation; (b) natural light; (c) dark condition; and under different pH conditions: (d) pH = 5; (e) pH = 7; (f) pH = 9 after 7 days of leaching (5 g L−1).
Separations 10 00101 g003
Figure 4. PARAFAC model output showing 2 different fluorescent components of 3 types of MP-DOM: (a) C1 for PE-DOM; (b) C1 for PS-DOM; (c) C1 for PVC-DOM; and (d) C2 for PE-DOM; (e) C2 for PS-DOM; (f) C2 for PVC-DOM.
Separations 10 00101 g004
Figure 5. Changes in the fluorescent scores of the individual components of PE-DOM (a,d), PS-DOM (b,e), and PVC-DOM (c,f) with increasing metal concentrations (from 5 to 200 μM).
Separations 10 00101 g005
Figure 6. Modified Stern–Volmer plots of the fluorescence quenching of two individual fluorescent components of PE-DOM (a,d), PS-DOM (b,e), and PVC-DOM (c,f).
Separations 10 00101 g006
Table 1. Abatement ratio of two individual components of MP-DOM after fluorescence quenching with 4 kinds of metal (200 μM).
TypeComponentsCdCrCuFe
PEC115.62%46.81%43.85%15.88%
C250.23%92.14%73.62%68.22%
PSC121.55%90.94%68.65%17.95%
C240.96%62.27%44.60%59.23%
PVCC180.79%72.67%66.05%45.52%
C293.24%84.67%63.36%65.10%
Table 2. Metal-binding parameters of two different fluorescent components calculated by the modified Stern–Volmer equation using the MP-DOM samples.
Type C1 C2
f (a)log K (b)β(c)r (d)flog Kβr
PECd15.424.13104.530.9839.133.7659.380.92
Cr51.14.2727.260.9694.174.5511.20.96
Cu64.33.0673.060.9666.964.2820.680.93
Fe17.543.41187.640.9987.213.1151.080.96
PSCd19.273.9798.040.9746.873.9441.630.99
Cr90.615.514.470.9761.935.496.650.98
Cu68.334.8311.670.9747.894.8316.740.97
Fe19.064.5555.20.9967.683.8631.220.98
PVCCd83.934.119.740.9994.384.4112.880.98
Cr87.84.5512.090.9793.563.9919.751
Cu71.534.0723.860.9871.413.9427.120.99
Fe44.595.0314.530.9774.493.4642.050.99
(a): Fraction of the initial fluorescence corresponding to the binding sites (f). (b): Conditional stability constants (log K). (c): coefficient of regression (β). (d): Correlation coefficients (r) between predicted and observed fluorescence intensity.
Disclaimer/Publisher’s Note: The statements, opinions and data contained in all publications are solely those of the individual author(s) and contributor(s) and not of MDPI and/or the editor(s). MDPI and/or the editor(s) disclaim responsibility for any injury to people or property resulting from any ideas, methods, instructions or products referred to in the content.

