Article

Multi-Dimensional Liquid Chromatography of Pulse Triacylglycerols with Triple Parallel Mass Spectrometry

by
William C. Byrdwell
1,* and
Hari Kiran Kotapati
2
1
Methods and Application of Food Composition Laboratory, Agricultural Research Service, U.S. Department of Agriculture, Beltsville, MD 20705, USA
2
Department of Nutrition and Food Science, College of Agriculture and Natural Resources, University of Maryland, College Park, MD 20742, USA
*
Author to whom correspondence should be addressed.
Separations 2023, 10(12), 594; https://doi.org/10.3390/separations10120594
Submission received: 5 September 2023 / Revised: 8 November 2023 / Accepted: 22 November 2023 / Published: 5 December 2023

Abstract

:
We analyzed ten pulses (the dried seeds of legumes), i.e., baby lima beans, black beans, black-eyed peas, butter beans, cranberry beans, garbanzo beans, green split peas, lentils, navy beans, and pinto beans, using three-dimensional liquid chromatography (3D-LC) with parallel second dimensions, LC × (LC + LC). We combined non-aqueous reversed-phase (NARP) chromatography as the first dimension separation, 1D, with argentation UHPLC for separation based on degree and location of unsaturation in the first second dimension, 2D(1), and multi-cycle NARP-UHPLC in the second second dimension, 2D(2). Pulses contained 1.9% to 2.7% lipids, except garbanzo beans, which contained 6.2% lipids. High-resolution, accurate-mass (HRAM) orbitrap mass spectrometry (MS) was used to perform lipidomic analysis of the 2D(2) and percent relative quantification, showing that the most abundant average triacylglycerol (TAG) molecular species across all pulses were PLL at 10.67% and PLLn at 10.45%. Common beans (Phaseolus vulgaris) were clustered together using principal component analysis (PCA), showing the highest levels of linolenic acid, C18:3, in molecular species such as PLnLn, LLnLn, and OLLn, with palmitic (P), C16:0, linoleic (L), 18:2, linolenic (Ln), 18:3, and oleic (O), 18:1, FAs. Calibration curves derived from interweaved sets of regioisomer standards allowed the absolute quantification of 1,2- and 1,3-regioisomers for a subset of TAGs.

Graphical Abstract

1. Introduction

The use of two-dimensional liquid chromatography (2D-LC) has become increasingly common, with easy-to-use, affordable, commercial systems available from a variety of manufacturers [1]. Literature reviews frequently update the current state-of-the-art in 2D-LC [2,3,4,5,6,7] and multi-dimensional LC (MD-LC) [1,8]. Fewer of the published reports employ three-dimensional separation methods [9,10], but the number of these reports is increasing. There are multiple modes that MD-LC can operate in [11], including online, in which the flow system goes to all dimensions continuously, and offline, in which fractions are collected from one dimension of separation and then submitted to an additional dimension (or dimensions) of separation. Other modes include comprehensive mode, in which all effluent (or a fixed, constant ratio of effluent in split configurations) from the first dimension, 1D, is transferred to the second dimension, 2D, (designated LC × LC), versus “heart-cut” mode where only a selected peak (or central part or “heart” of the peak) or peaks is/are transferred to the 2D, designated as LC-LC [12]. Multi-dimensional separations were first widely used for protein analysis, exemplified by Washburn et al. [13], who developed multi-dimensional protein identification technology (MudPIT), which used 2D-LC with detection by mass spectrometry (MS).
According to Abdulhussain et al. [10], the first online comprehensive three-dimensional liquid chromatography (3D-LC) was reported by Moore and Jorgenson [14]. Similar to comprehensive 2D-LC, serial online comprehensive 3D-LC is taken to mean that effluent containing every peak from the first dimension, 1D, is transferred to and has a peak in the second dimension, 2D, and is further transferred to and has a peak in the third dimension, 3D. The recent review of 3D-LC is limited to serial online 3D-LC [10]. The review by Doung et al. [9] discussed both online and offline forms of 3D-LC for bottomup proteomics.
Between classic comprehensive 2D-LC and comprehensive serial 3D-LC are a group of multi-dimensional experimental designs that employ three or more separations in a parallel arrangement, instead of a serial arrangement. Such applications have been recently reviewed by Foster et al. [7]. An earlier review by Fairchild et al. [15] focused on theoretical benefits of 2D-LC with parallel columns in the 2D, and those considerations assumed that the columns are as identical as possible (to minimize retention time differences between them), and fractions of the 1D are alternatingly sent to the parallel 2D columns. Examples of such configurations applied to protein separations have long been known [16,17]. When multiple identical columns are used in parallel, in an alternating fashion, with these sets of 2D columns attached to a single flow system, and a switching valve to alternate between columns, the 2D columns can rightly be called an array of columns. Foster et al. described experiments with up to 18 capillary columns in parallel off one flow system [7]. In such experiments, two LC flow systems are employed, one for each dimension of separation, with a switching valve used to alternate between 2D columns, and where 2D columns undergo elution gradients from a single 2D pump. Other pumps may be included to provide make-up solvent or other functions, but only two dimensions of separation are operating simultaneously on whichever columns are selected.
There are also experiments in which different, rather than identical, columns were used in parallel in the 2D [18]. Even though three columns were used, only two LCs were used, so again, flow from the single flow system alternated between the 2D two columns joined by a switching system used to sequentially select each of the alternating columns. One particularly elegant screening method used column selectors in both the first and second dimensions, allowing the choice of four achiral columns in the 1D and four chiral columns in the 2D for maximum flexibility in choosing the best combination of columns for separation of pharmaceuticals [19]. Numerous other examples of the use of multiple similar or complementary columns in the 1D and/or 2D are summarized in the review [7].
While we are happy to have our work [20] included in such a review, our approach does have differences that set it apart from the other cited work. In our experiments, three completely separate and independent LC systems are employed, with flow from the 1D split to allow the two completely separate 2D separations to be conducted using any useful combination of mobile phases, columns, and detectors. In this way, we have three separate dimensions of separation operating at all times during an analysis. Because of this, we do not refer to our parallel 2Ds simply as an array of columns. We have two complete and independent second dimensions operating simultaneously, instead of one second dimension with multiple columns available. Since we use three dimensions of separation using three LC flow systems, these can fairly be called three dimensions of separation with the second and third separations arranged in a parallel configuration, for parallel three-dimensional LC, instead of a serial arrangement. We reserve the term array for a set of columns in parallel connected to a common LC system, typically through a column selector valve, as discussed above [7]. Thus, there continues to be room for improved nomenclature to differentiate between the constantly evolving and newly emerging multi-dimensional serial and parallel techniques being reported, with online serial comprehensive 3D-LC having a specific and limited meaning.
Note that the superscript prefix designating the dimension number used throughout this report follows the recommended nomenclature from Wu et al. [12], which is highly recommended reading. We added parenthetical numbers to differentiate between the first and second 2Ds, 2D(1) and 2D(2).
One requirement for conventional comprehensive 2D-LC, and even more so for serial comprehensive 3D-LC, is the need for a very fast separation in the 2D (even faster in a serial 3D) mated to a very fast detector, so multiple modulations, or peak sections, can be separated and detected in the 2D across the breadth of a 1D peak [21]. If too few modulations are performed across a peak, the peak cannot be adequately reproduced from the second dimension, referred to as undersampling, which is dealt with in detail in the excellent tutorial by Stoll et al. [22]. Unfortunately, many labs do not have the resources to afford the latest, fastest mass spectrometers. To allow researchers like us to participate in the 2D-LC revolution, we have implemented approaches that employ older, slower instrumentation and do not strictly conform to the ideal conditions for optimal 2D-LC described in tutorials. The accommodations we have made to perform MD-LC with older instruments have been discussed previously [23]. Two key differences in our approach allow us to use older instruments without being hobbled by undersampling. First, and most importantly, we use direct detection in the first dimension, so peaks do not need to be reassembled from modulation sections across each peak. This is a benefit of the multiple parallel mass spectrometry, LCxMSy, approaches that we have implemented for years. We use direct detection not only by mass spectrometry (MS) in each dimension of separation, but also using multiple other detectors, including an ultraviolet (UV) detector, fluorescence detector (FLD), corona charged aerosol detector (CAD), and evaporative light-scattering detector (ELSD). The second accommodation we employ is the use of much longer than normal modulation periods, such that entire peaks are transferred from the 1D to the 2D, again working around the problem of undersampling. We then use the second dimension(s) to separate the intact 1D peaks further, as in the case of using silver-ion UHPLC in the 2D to separate regioisomers of eleostearic acid-containing triacylglycerols (TAGs) that were unresolvable in the 1D [24].
Another important deviation from convention was the use of multi-cycle MD-LC. It is generally accepted, and reviews mention [25], that wraparound, or the failure of an analyte to elute in one modulation period, is to be avoided. Elution of an analyte in the 2D with a retention time longer than one modulation period is discouraged. But we implemented an approach called multi-cycle elution that used “constructive wraparound” [20]. The concept was to allow analytes more time on column, similar to the concept of twin-column recycling chromatography [26], which recycles analytes down a pair of alternating columns in parallel to provide longer exposure to the stationary phase without increasing column length, thereby reducing the column backpressure that would be associated with a longer column. In our case, analytes are exposed to the stationary phase for a longer time simply by keeping them on column through multiple modulation periods using a parallel gradient [27]. Furthermore, we first used multi-cycle elution with complementary, not orthogonal, C18 and C30 reversed-phase (RP) stationary phases. Since this was a controversial approach, we demonstrated multi-cycle elution in the 2D(2) coupled in parallel with conventional single-modulation-period elution in the 2D(1) to show that a single modulation period did not provide the improved use of the separation space (using a short C30 column) that multi-cycle elution on a longer C30 column provided [20]. Now that the use of multi-cycle elution has been demonstrated for lipid analysis, the single-modulation elution can be eliminated and replaced with a much more useful and orthogonal 2D separation in parallel with the multi-cycle elution. The more useful third dimension of separation is provided by the silver-ion UHPLC that we reported in 2017 [24]. That report showed that normal single-modulation elution on a Ag+ column can be very effective, especially for the separation of cis/trans isomers, regioisomers, and other isomers of lipids that can be separated based on the nature and positions of sites of unsaturation within the molecules. The separation on the silver-ion column is highly orthogonal to the reversed-phase separations in the 1D and parallel 2D, due to a very different retention mechanism, such that polyunsaturated fatty acid (PUFA)-containing TAGs elute first by RP-HPLC/UHPLC, whereas they are retained longest and elute last on the Ag+ column. Thus, we have incrementally built up the precedent that is combined in the current report through published reports describing the sub-components assembled here.
The use of separate, independently controlled second dimensions using independent UHPLC systems with different solvent systems and highly orthogonal parallel 2D dimensions highlights the differences between parallel three-dimensional liquid chromatography versus two-dimensional LC with an array of parallel 2D columns attached to a common UHPLC. These are three different dimensions of separation with three flow systems and gradients coordinated into a single MD-LC experiment with parallel second dimensions. And since we have been using dual [28], triple [29], and quadruple [30] parallel mass spectrometers for years, it was a natural evolution to couple four mass spectrometers together with the three dimensions of LC separation for LC3MS4 [20].
As part of an incremental, step-by-step implementation of the LCxMSy approach, we report here the use of LC3MS3 to analyze pulse samples that we previously examined using fast (10 min) chromatography [31]. This provides the opportunity to compare and contrast the short, fast separation reported previously with a longer, more detailed LC3MS3 separation using a common set of samples, such that the emphasis is on the combination of instruments and separation techniques used for MD-LC instead of the samples, although previously unreported components of some pulses are also presented.
Pulses are the dried seeds of legumes, but excludes legume seeds harvested and eaten green, such as green peas and green beans, and also excludes legume seeds rich in oil, known as oilseeds, such a soybeans, canola, etc. [32]. Pulses are well known for their high protein content and high content of slowly digested beneficial dietary fiber [33]. Pulses are low in fat compared to oilseeds, with ~2–2.5% fat in most pulses and ~6% in garbanzo beans, also known as chickpeas.
We recently reported a fast chromatography (10 min) separation and TAG analysis of ten pulse samples [31], specifically baby lima beans (Phaseolus lunatus), black-eyed peas (Vigna unguiculata), butter beans (Phaseolus lunatus), cranberry beans (Phaseolus vulgaris), garbanzo beans (Cicer arietinum), green split peas (Pisum sativum), lentils (Lens culinaris), navy beans (Phaseolus vulgaris), and pinto beans (Phaseolus vulgaris). We chose these samples because they had previously been analyzed for their oligosaccharide (OS) content [34]. We showed that some of the common bean varieties, Phaseolus vulgaris, specifically black beans, navy beans, and pinto beans clustered together based on TAGs similar to how they clustered based on OSs, as well as black-eyed peas, Vigna unguiculata, and baby lima beans, Phaseolus lunatus [31].
That approach was the first part of a complementary two-pronged approach that used fast chromatography intended as a high-throughput method and parallel MD-LC for more detailed and thorough analyses. The fast chromatography [31] provided molecular species information for TAGs, but required apportionment of many diacylglycerol-like fragments, [DAG]+, that were shared between not-fully resolved TAG isomers. That method demonstrated a compromise between analysis speed and structural detail provided. The method presented here is a longer, more detailed separation that fully resolved most isomers, including some regioisomers, but it is not a high-throughput method.

2. Materials and Methods

2.1. Chemicals

Solvents used for LC were Optima™ grade from Fisher Scientific (Waltham, MA, USA) or spectrophotometric grade from Sigma Aldrich. Fat-soluble vitamin (FSV) standards were procured from Sigma Aldrich (Saint Louis, MO, USA). Pulse samples had previously been analyzed for oligosaccharide (OS) compositions [34], and were received from Dr. Devanand Luthria. Different aliquots of the same samples that were previously analyzed [31] were extracted and prepared as previously described [31], using the extraction of Folch et al. [35] with minor modifications [20].
Pure TAG regioisomer calibration standards were obtained from Larodan (Monroe, MI, USA). Two sets of calibration standards were made, having the FSV and TAG concentrations given in Supplementary Table S1. Set one was made with 1,3-TAG regioisomers and set two with 1,2-TAG regioisomers, with both sets having the same FSVs. Then, one set of mixed calibration standards was made by using alternating 1,3- and 1,2- regioisomers, with calibration standards 1, 3, and 5 having 1,3-isomers and standards 2 and 4 having 1,2-regioisomers. Prior to extraction, samples had one set of odd-chain mono-acid TAGs added as extraction internal standards (EISs), specifically 9:0/9:0/9:0, 13:0/13:0/13:0, 17:0/17:0/17:0, and 21:0/21:0/21:0 at a level of 20.6 nMol/mL, as well as vitamin D2 (ergocalciferol) at 2.0 μg/mL. Similarly, prior to analysis of reconstituted extracts, all standards and samples had 20.6 nMol/mL of a second set of odd-chain mono-acid TAGs added as analytical internal standards (AISs), specifically, 7:0/7:0/7:0, 11:0/11:0/11:0, 15:0/15:0/15:0, and 19:0/19:0/19:0, at a level of 20.6 nMol/mL, plus vitamin K2 (menaquinone) at 2.0 μg/mL. Based on peak shapes, and consistent retention times and peak areas, 7:0/7:0/7:0 was selected as the best AIS. We analyzed five calibration levels in these experiments to reduce the sequence run time, since these analyses were 75 min long, compared to the seven calibration levels analyzed for the fast chromatography reported earlier [31].

2.2. Liquid Chromatography

Figure 1 depicts the arrangement of instruments employed in these LC3MS3 experiments. The 1D was an Agilent Technologies (Santa Clara, CA, USA) 1200 HPLC with quaternary pump, degasser, autosampler, thermostatted column compartment (TCC) at 10 °C, diode array detector (DAD) SL, and two channel 24-bit analog-to-digital converter (A-to-D) to which was attached a corona charged aerosol detector (CAD). Model numbers for all LC components are provided in [20]. The columns were two Inertsil ODS-2 columns in series, 25 cm × 4.6 mm, 5 μm particles, and 20 μL was injected. The non-aqueous reversed-phase (NARP) solvent composition was methanol (MeOH) and dichloromethane (DCM) using the gradient given in Figure 2A and in Supplementary Table S2.
The 2D(1) UHPLC system was part of the Agilent commercially available 2D-LC system, and consisted of an Agilent 1290 with binary pump, degasser, TCC at 10 °C, and DAD, connected to the Agilent 1200 via a G1170A 8-port, 2-position valve. The silver-ion column was made from an Epic-SCX strong cation exchange column, 10.0 cm × 2.1 mm, 3 μm particles, using a simplified version of the procedure described previously [24]. The solvents were 0.5% acetonitrile (ACN) in MeOH and 12% ACN in MeOH, with the gradient given in Figure 2B and in Supplementary Table S3.
The 2D(2) UHPLC system was an Agilent 1290 Infinity Flex II quaternary pump, TCC at 10 °C, DAD, fluorescence detector (FLD), and 1290 evaporative light scattering detector (ELSD) attached to a universal interface box (UIB) II. The column was a ThermoScientific Accucore C30 column, 100 mm × 3.0 mm, 2.6 μm particles. The NARP solvent gradient employed MeOH, ACN, and DCM, according to the program in Figure 2C and in Supplementary Table S4.
The method for preparing the silver-ion (argentation) column was simplified from our previous approach [24], but produced a column that was not robust. The water pre-wash was eliminated, so the column was only washed with methanol prior to saturating the column with recycling 1.0 N AgNO3. Then, the column was rinsed with methanol. However, since the column was not as effective as that in our previous report [24], we will return to the previously reported method for argentation column preparation for our future research.

2.3. Mass Spectrometry

A tandem sector quadrupole (TSQ) Vantage EMR mass spectrometer (ThermoScientific, San Jose, CA, USA) operated in atmospheric pressure chemical ionization (APCI) mode was used for detection of the 1D, with the vaporizer heater at 400 °C, corona current at 4.0 μA, sheath gas at 50 arbitrary units (au), auxiliary (aux) gas at 5 au, and sweep gas at 1 au. The capillary temperature was 250 °C. Full scans were from m/z 150 to 1150 in 1 s.
A ThermoScientific TSQ Quantum Access Max operated in ESI mode was used for the 2D(1), with spray voltage at 4000 V, vaporizer temperature at 100 °C, sheath gas at 25 au, aux gas 5 au, and capillary temperature at 275 °C. Full scans were from m/z 150 to 1150 in 1 s. Electrolyte for the ESI source was provided as 20 mM ammonium formate in H2O/methanol via syringe pump at 40 μL/min, teed in (Valco tee, Vici Valco Instruments, Houston, TX, USA) at the ionization source inlet. This was prepared by diluting 100 mM ammonium formate aqueous solution with methanol in a proportion of 1:4. The electrolyte was plumbed through the mass spectrometer’s built-in switching valve as shown in the electronic supplementary material of a previous report [29].
The 2D(2) was detected using a ThermoScientific Qexactive orbitrap™ HRAM-MS instrument operated in ESI mode at resolution of 140,000 for full scans, and 70,000 for MS/MS, with sheath gas at 35 au, aux gas at 5 au, capillary heater at 250 °C, and ESI spray voltage at 4000 V, with the heater off. An SS420X A-to-D acquiring the corona CAD signal was also attached to the acquisition computer. Full scans were from m/z 200 to 1200 in 1 s. Data-dependent acquisition (DDA) was performed on the top 4 precursor ions using an isolation width of 1.5. Electrolyte for this ESI source was provided as 20 mM ammonium formate in H2O/acetonitrile via syringe pump at 20 μL/min, prepared as above except with acetonitrile. This was teed in at the ESI source inlet and plumbed through the instrument’s onboard switch, as mentioned above.

2.4. Calculations, Statistical Analysis

Peak areas for calibrated TAGs and FSVs obtained by both APCI-MS (1D) and ESI-HRAM-MS (2D(2)) were manually integrated using ThermoScientific Xcalibur™ QuanBrowser, taking advantage of the Byrdwell carbon isotope advantage [30,31] to increase signal with no loss of specificity. Peak areas were exported to Microsoft Excel, which was used for the calculation of calibration curves and trendlines, since QuanBrowser has been reported to produce erroneous calibration lines [36].
ESI-HRAM-MS data were also processed using LipidSearch (LS) 4.2 using the same single file alignment process described previously [31]. Peak areas were exported to Microsoft Excel for calculation of calibration curves and trendlines. LS parameters were: Search Type: Product, Experiment Type: LC, Precursor Tolerance: 5.0 ppm, Product Tolerance: 5.0 ppm, m-score threshold: 2.0, Toprank filter: On, Main node filter: All isomer peaks, m-Score Threshold: 5.0, c-Score Threshold: 2.0, FA Priority: On, and ID Quality filter: A.
Principal component analysis (PCA) and hierarchical cluster analysis (HCA) were performed using Unscrambler X version 10.3 (formerly Camo Analytics, now AspenTech, Bedford, MA, USA).

2.5. Abbreviations

Fatty acyl chains are identified by CN:U, or carbon number (CN) and the number of sites of unsaturation (U). In order of increasing CN:U, the FA abbreviations are as follows: 2:0, acetic acid, Ac; 4:0, butyric acid, Bu; 6:0, caproic, Co; 7:0, enanthic, En; 8:0, caprylic, Cy; 9:0, pelargonic, Pg; 10:0, capric, Ca; 11:0, undecanoic, Un; 12:0, lauric, La; 13:0, tridecanoic, Tr; 14:0, myristic, M; 15:0, pentadecanoic, Pn; 16:0, palmitic, P; 16:1, palmitoleic, Po; 17:0, margaric, Ma; 18:0, stearic, S; 18:1, oleic, O; 18:2, linoleic, L; 18:3, linolenic, Ln; 18:4, stearidonic, Sd; 19:0, nonadecanoic, No; 20:0, arachidic, A; 20:1, gadoleic, G; 21:0, heneicosanoic, He; 22:0, behenic, B; 22:1, erucic, E; 23:0, tricosanoic, Tc; 24:0, lignoceric, Lg; 24:1, nervonic, N; and 26:0, cerotic, Ce.

3. Results

This separation represents only the second example of the multi-cycle elution that Byrdwell et al. recently reported [20], and represents the first combination of multi-cycle NARP-UHPLC with silver-ion UHPLC [24] as orthogonal and complementary second dimensions that employ very different lipid separation mechanisms. However, we used a different, simplified, and less effective method for preparing the silver-ion UHPLC column, which gave a column that was not as robust as that used for the previously reported results [24]; thus, we did not obtain at least three replicates across all three dimensions. Furthermore, instrument, building, and infrastructure failures after these data were acquired meant that our laboratory had to be relocated and re-assembled elsewhere, with a different combination of instruments. This report presents the last data from this group of instruments in that laboratory location, but work is underway to reconstitute a similar capability in a new laboratory. Thus, we report triplicate or quadruplicate runs in the 1D, duplicate runs in the 2D(2), and only single runs on the newer silver-ion column in the 2D(1).

3.1. The First Dimension, 1D: NARP-HPLC

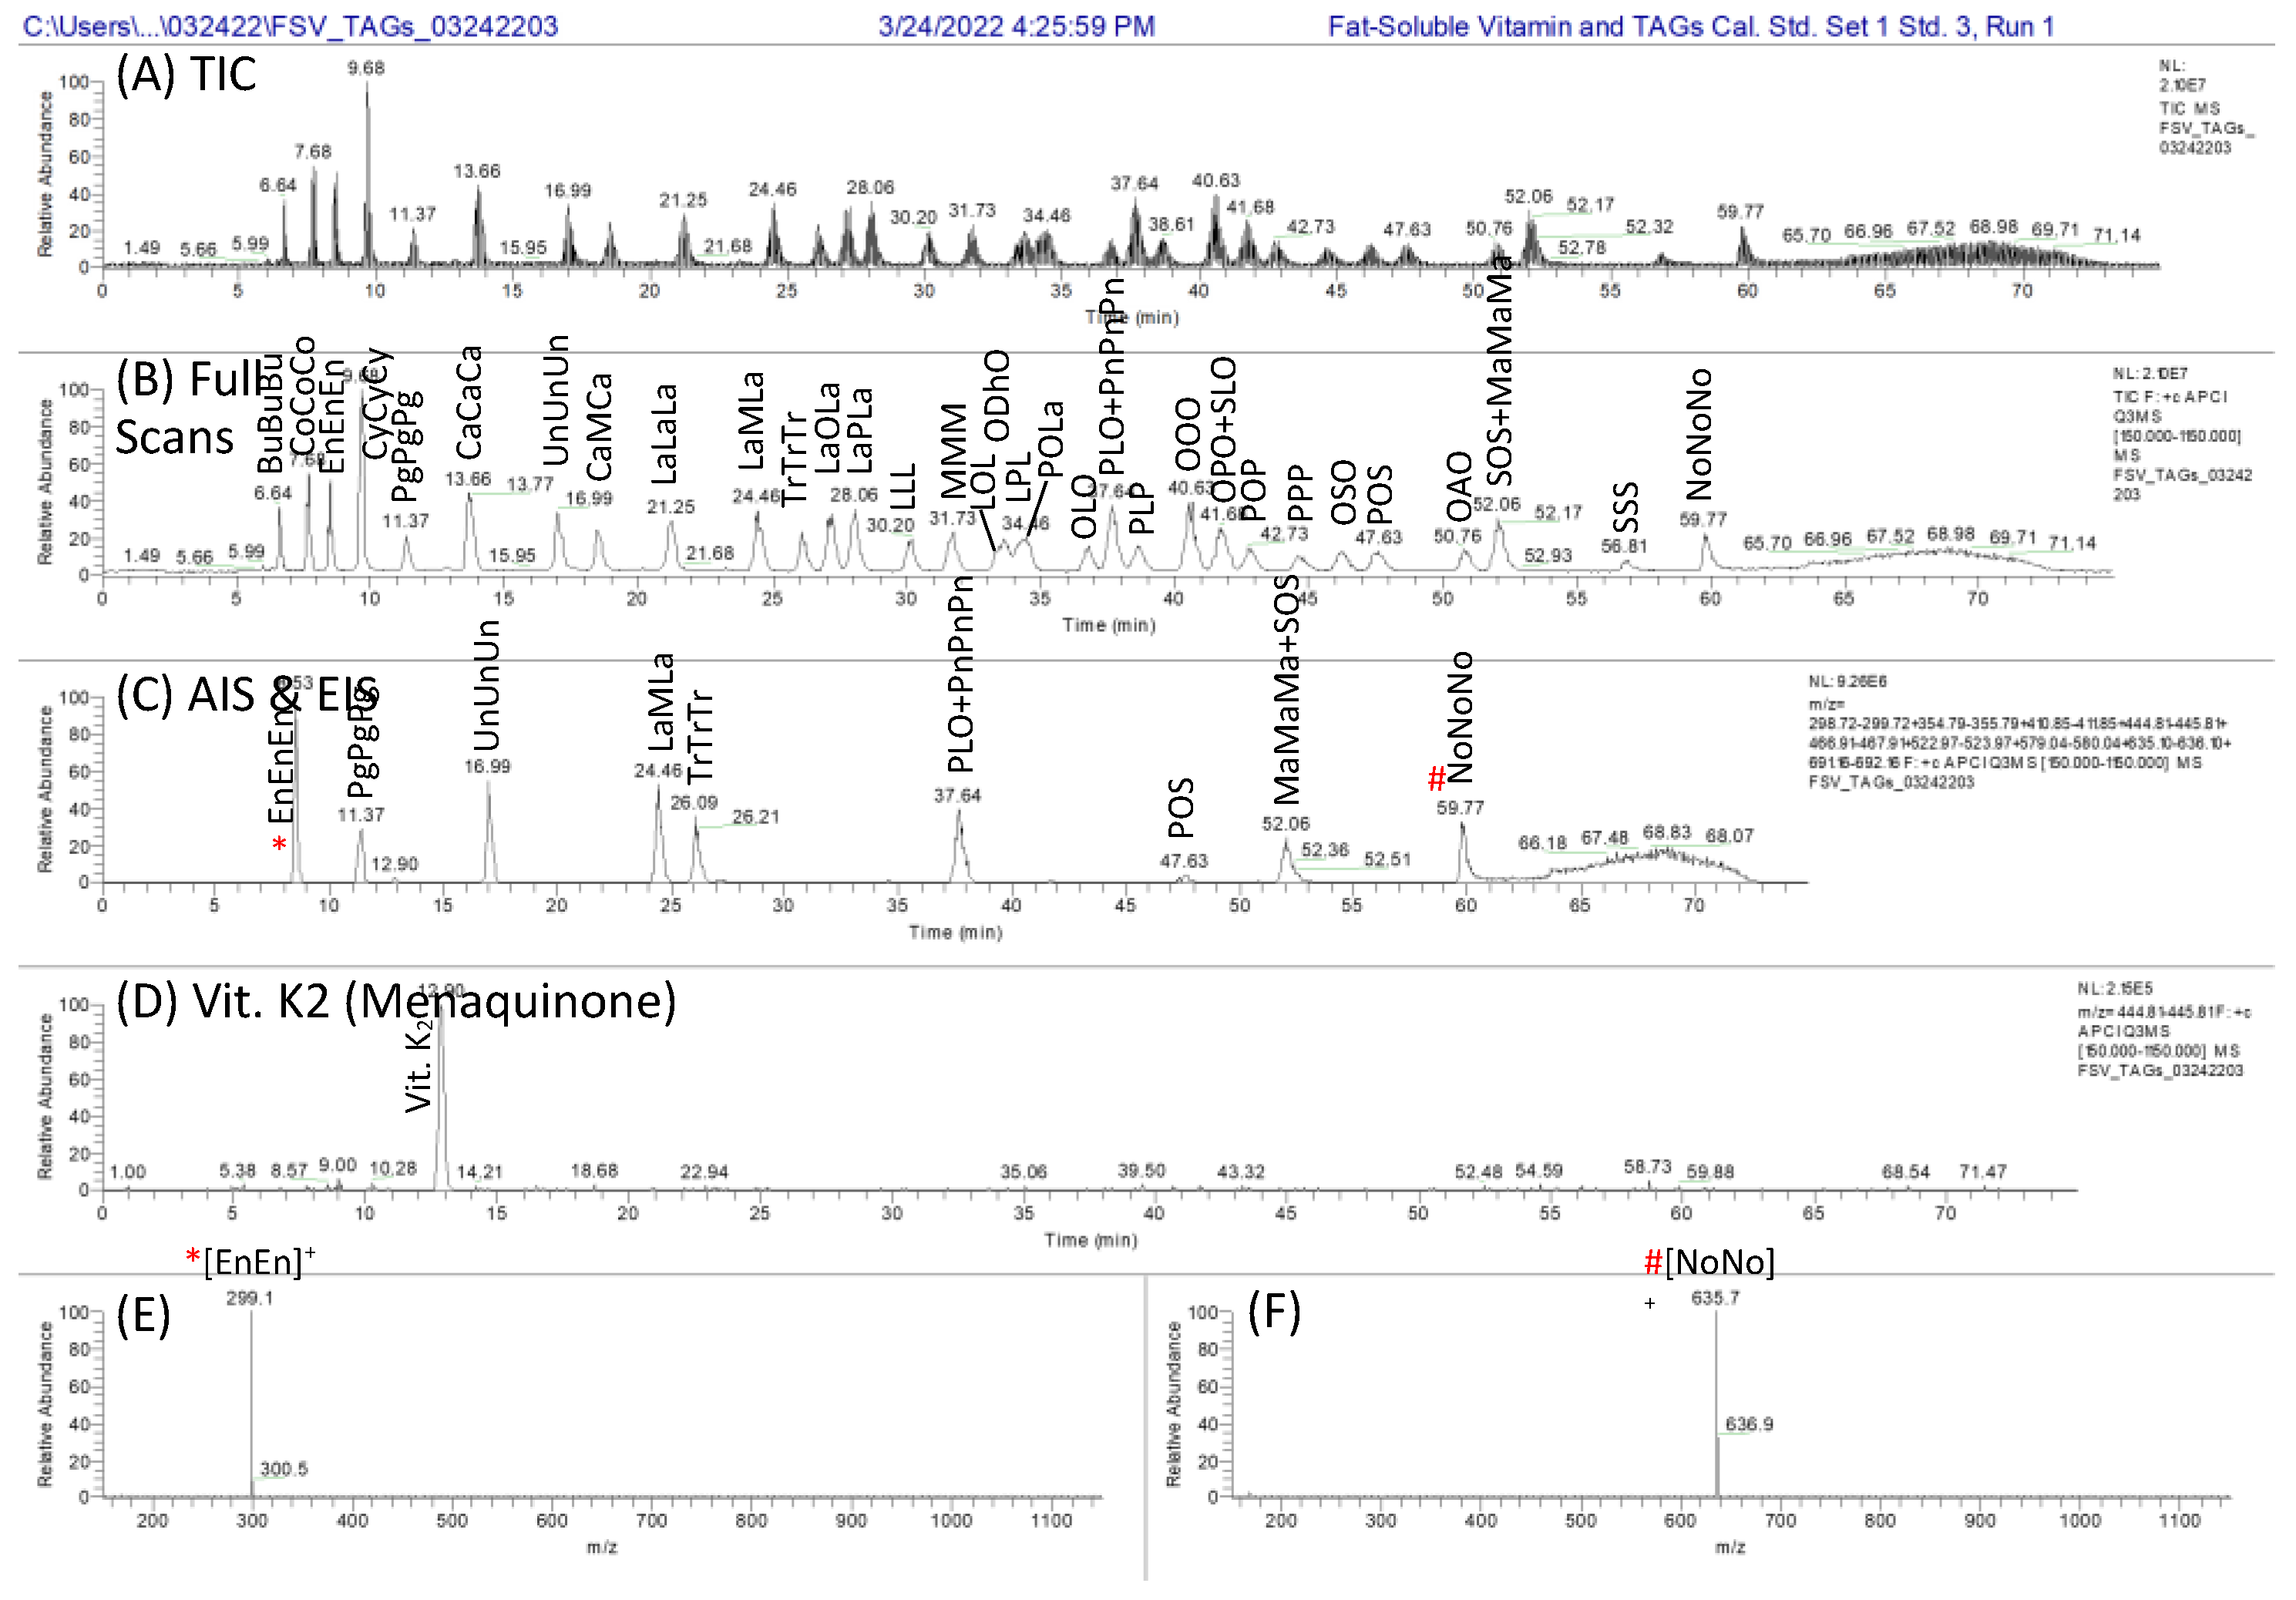
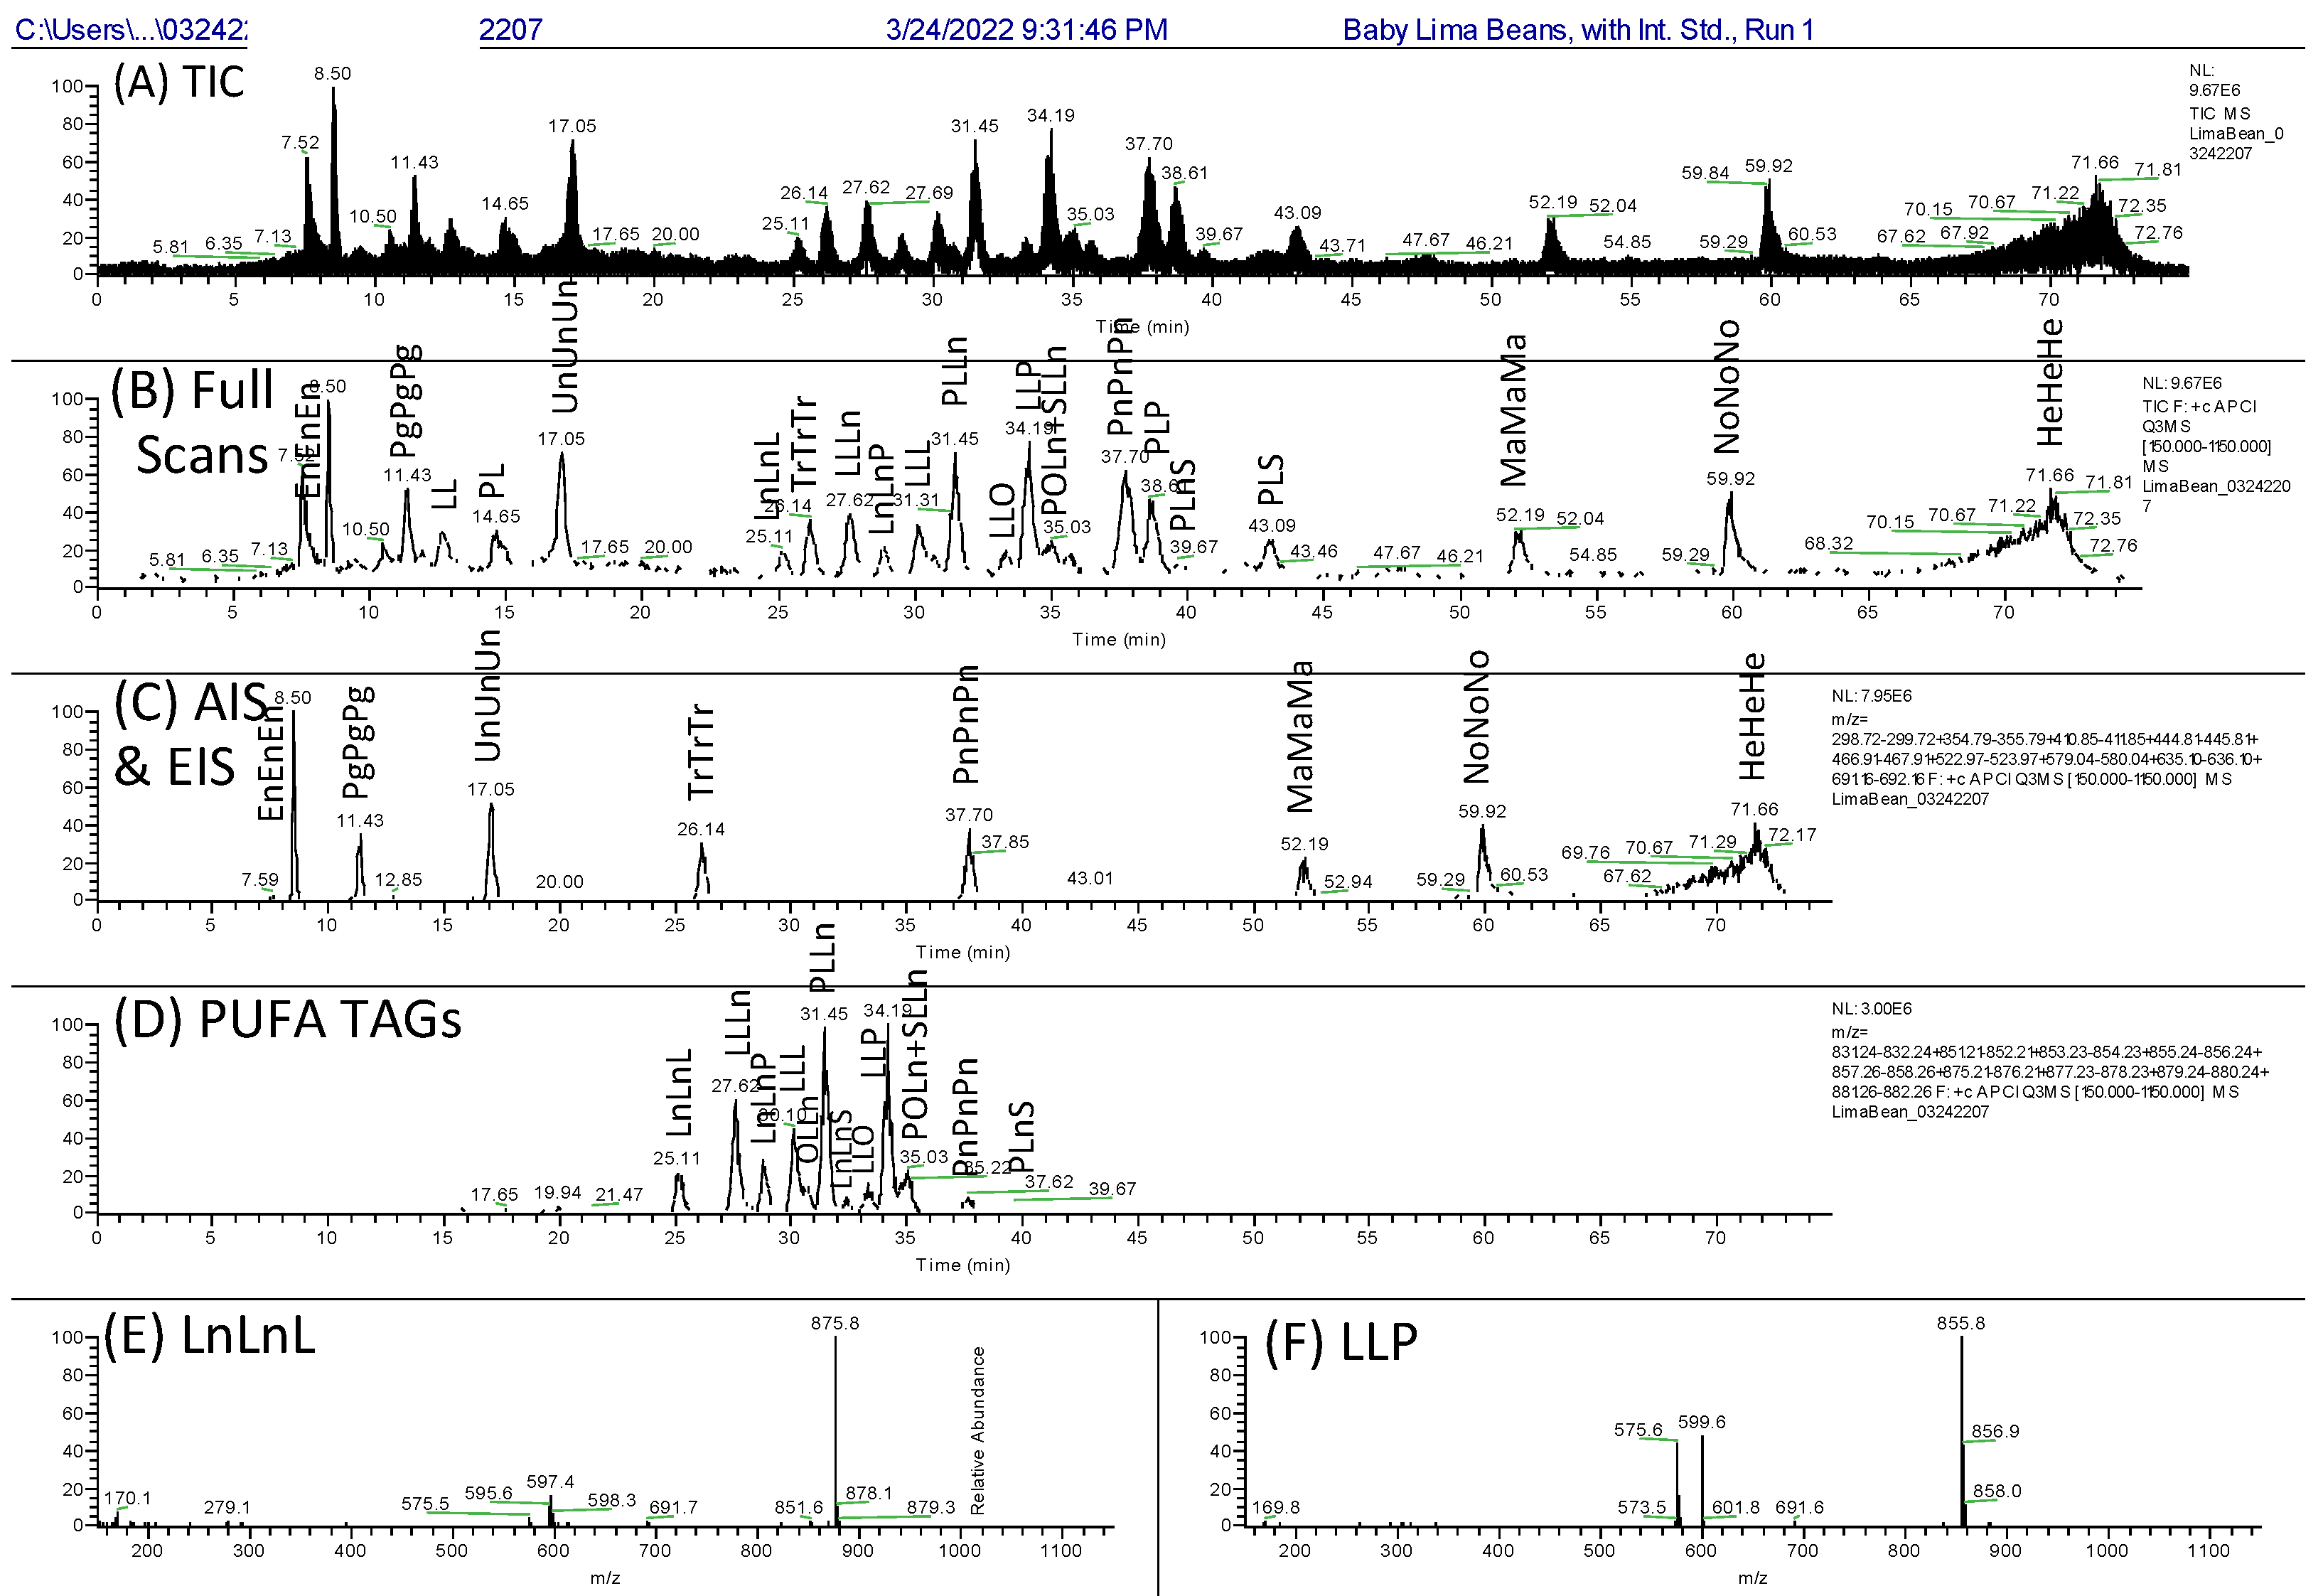
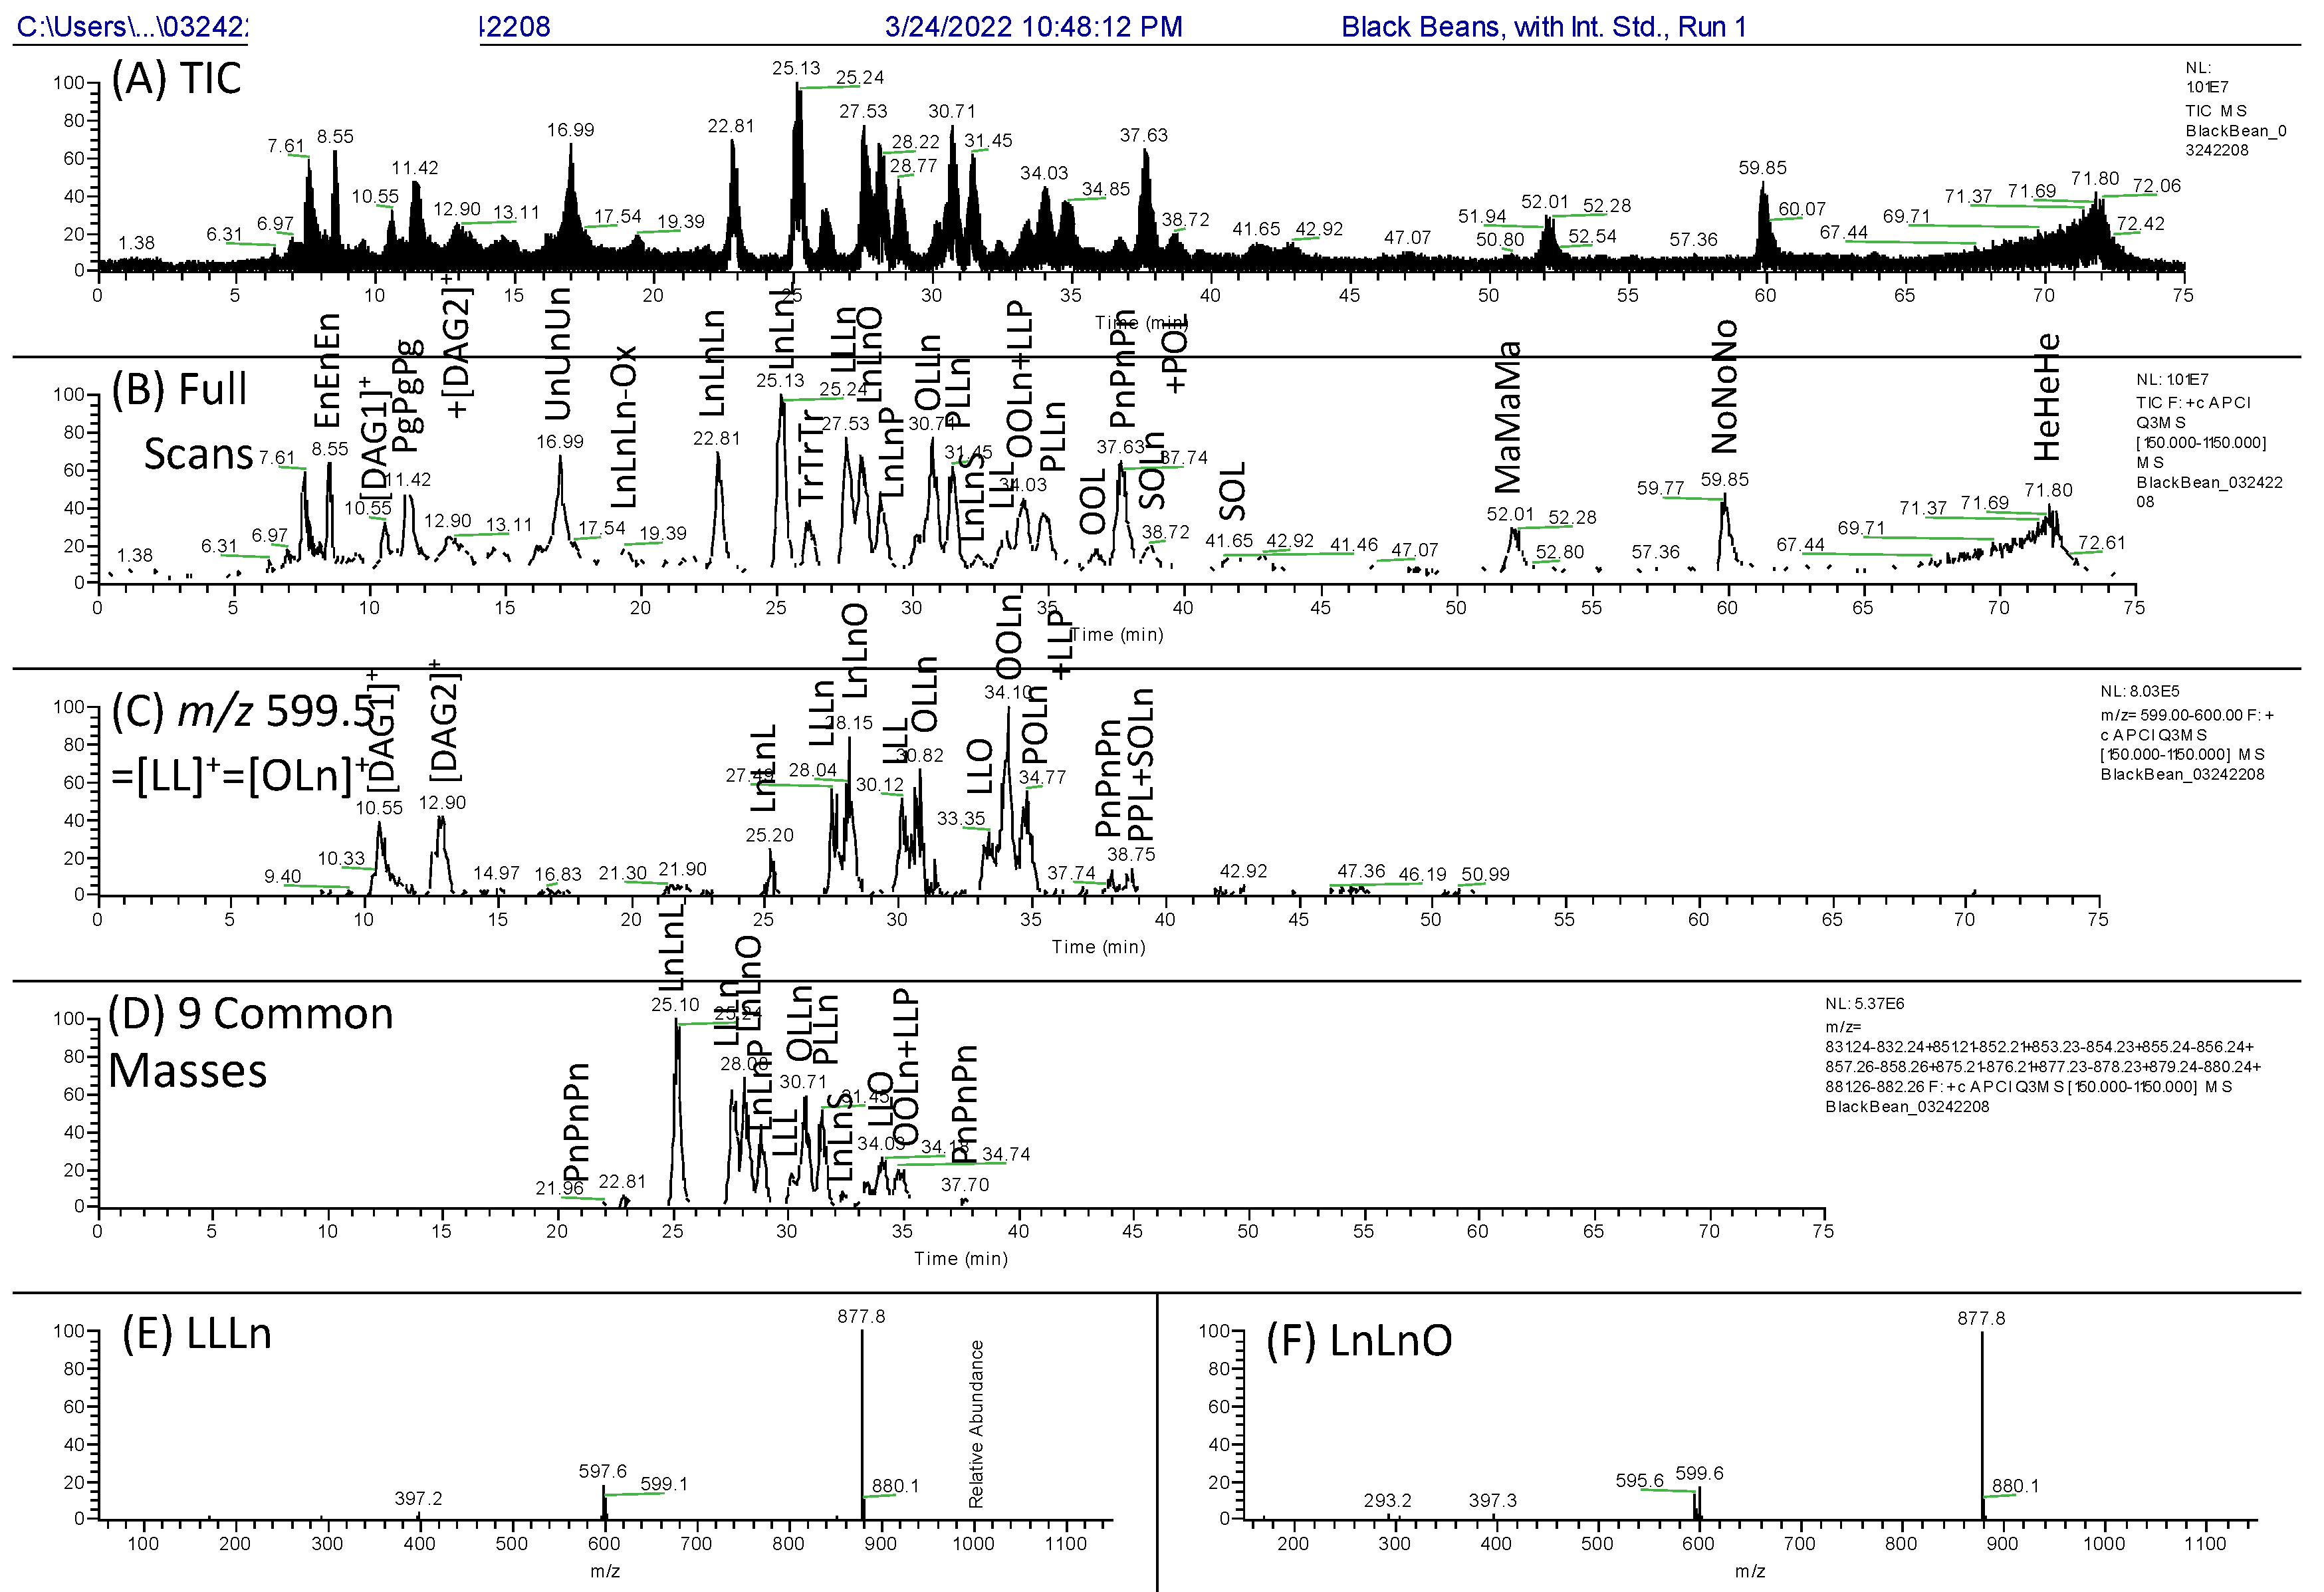
Figure 3, Figure 4 and Figure 5 represent the 1D separations of the TAG standards mix, baby lima beans, and black beans, respectively. Figure 4D and Figure 5D show that the 75 min analysis provided a better separation of isomers such as LLL and OLLn (both have m/z 896.77 for [M + NH4]+) than the fast chromatography separation [31]. The better separation in the 1D translated into better resolution in the 2D(2), and allowed more TAG regioisomers to be identified from their fragment ratios in un-apportioned peaks, providing more confidence in regioisomer assignments.
The TAG standards seen in Figure 3 were quantified using APCI-MS, as well as ESI-HRAM-MS, below. Figure 3E,F demonstrate the long-known observation [37,38] that saturated TAGs produce no protonated molecule by APCI-MS (or APPI-MS), and instead produce only diacylglycerol-like fragments, [DAG]+. The [MH]+/Σ[DAG]+ ratio, referred to as the first Critical Ratio, or CR1 [39], gives a value of 0 for saturated TAGs, while TAGs that contain polyunsaturated fatty acids (PUFAs) produce protonated molecules as base peaks, with small [DAG]+ fragments, hence, higher values of CR1. Typical mass spectra of PUFA-TAGs are seen in Figure 4E,F, showing the mass spectra of LnLnL and LLP, respectively, as well as Figure 5E,F, showing the spectra of LLLn and LnLnO, respectively. The relationship between the [MH]+/Σ[DAG]+ ratio and the number of sites of unsaturation has been shown to approximate a sigmoidal function [38,40].
For Type II TAGs (those having two different FAs, A and B), the [AA]+/[AB]+ ratio is known as the second Critical Ratio, CR2 [39], which Mottram and Evershed [41] and Laakso et al. [42] first showed varies depending on the locations of A and B on the glycerol backbone, either in the center (stereospecific numbering position 2, or sn-2) or in one of the outer positions on the glycerol backbone (sn-1 or sn-3), which cannot be differentiated using fragment ratios.
Critical Ratio 2 [38], CR2, the [AA]+/[AB]+ ratio, was calculated for each TAG standard, with values given in Supplementary Table S5 for the individual pure regioisomer standards. The values of CR2 for the regioisomer standards were then used to quantify the TAGs in the pulse samples using the equations reported in 2005 [39,43], with quantified TAG regioisomer percentages given in Supplementary Table S6, discussed further below.

3.2. The First Second Dimension 2D(1): Argentation UHPLC

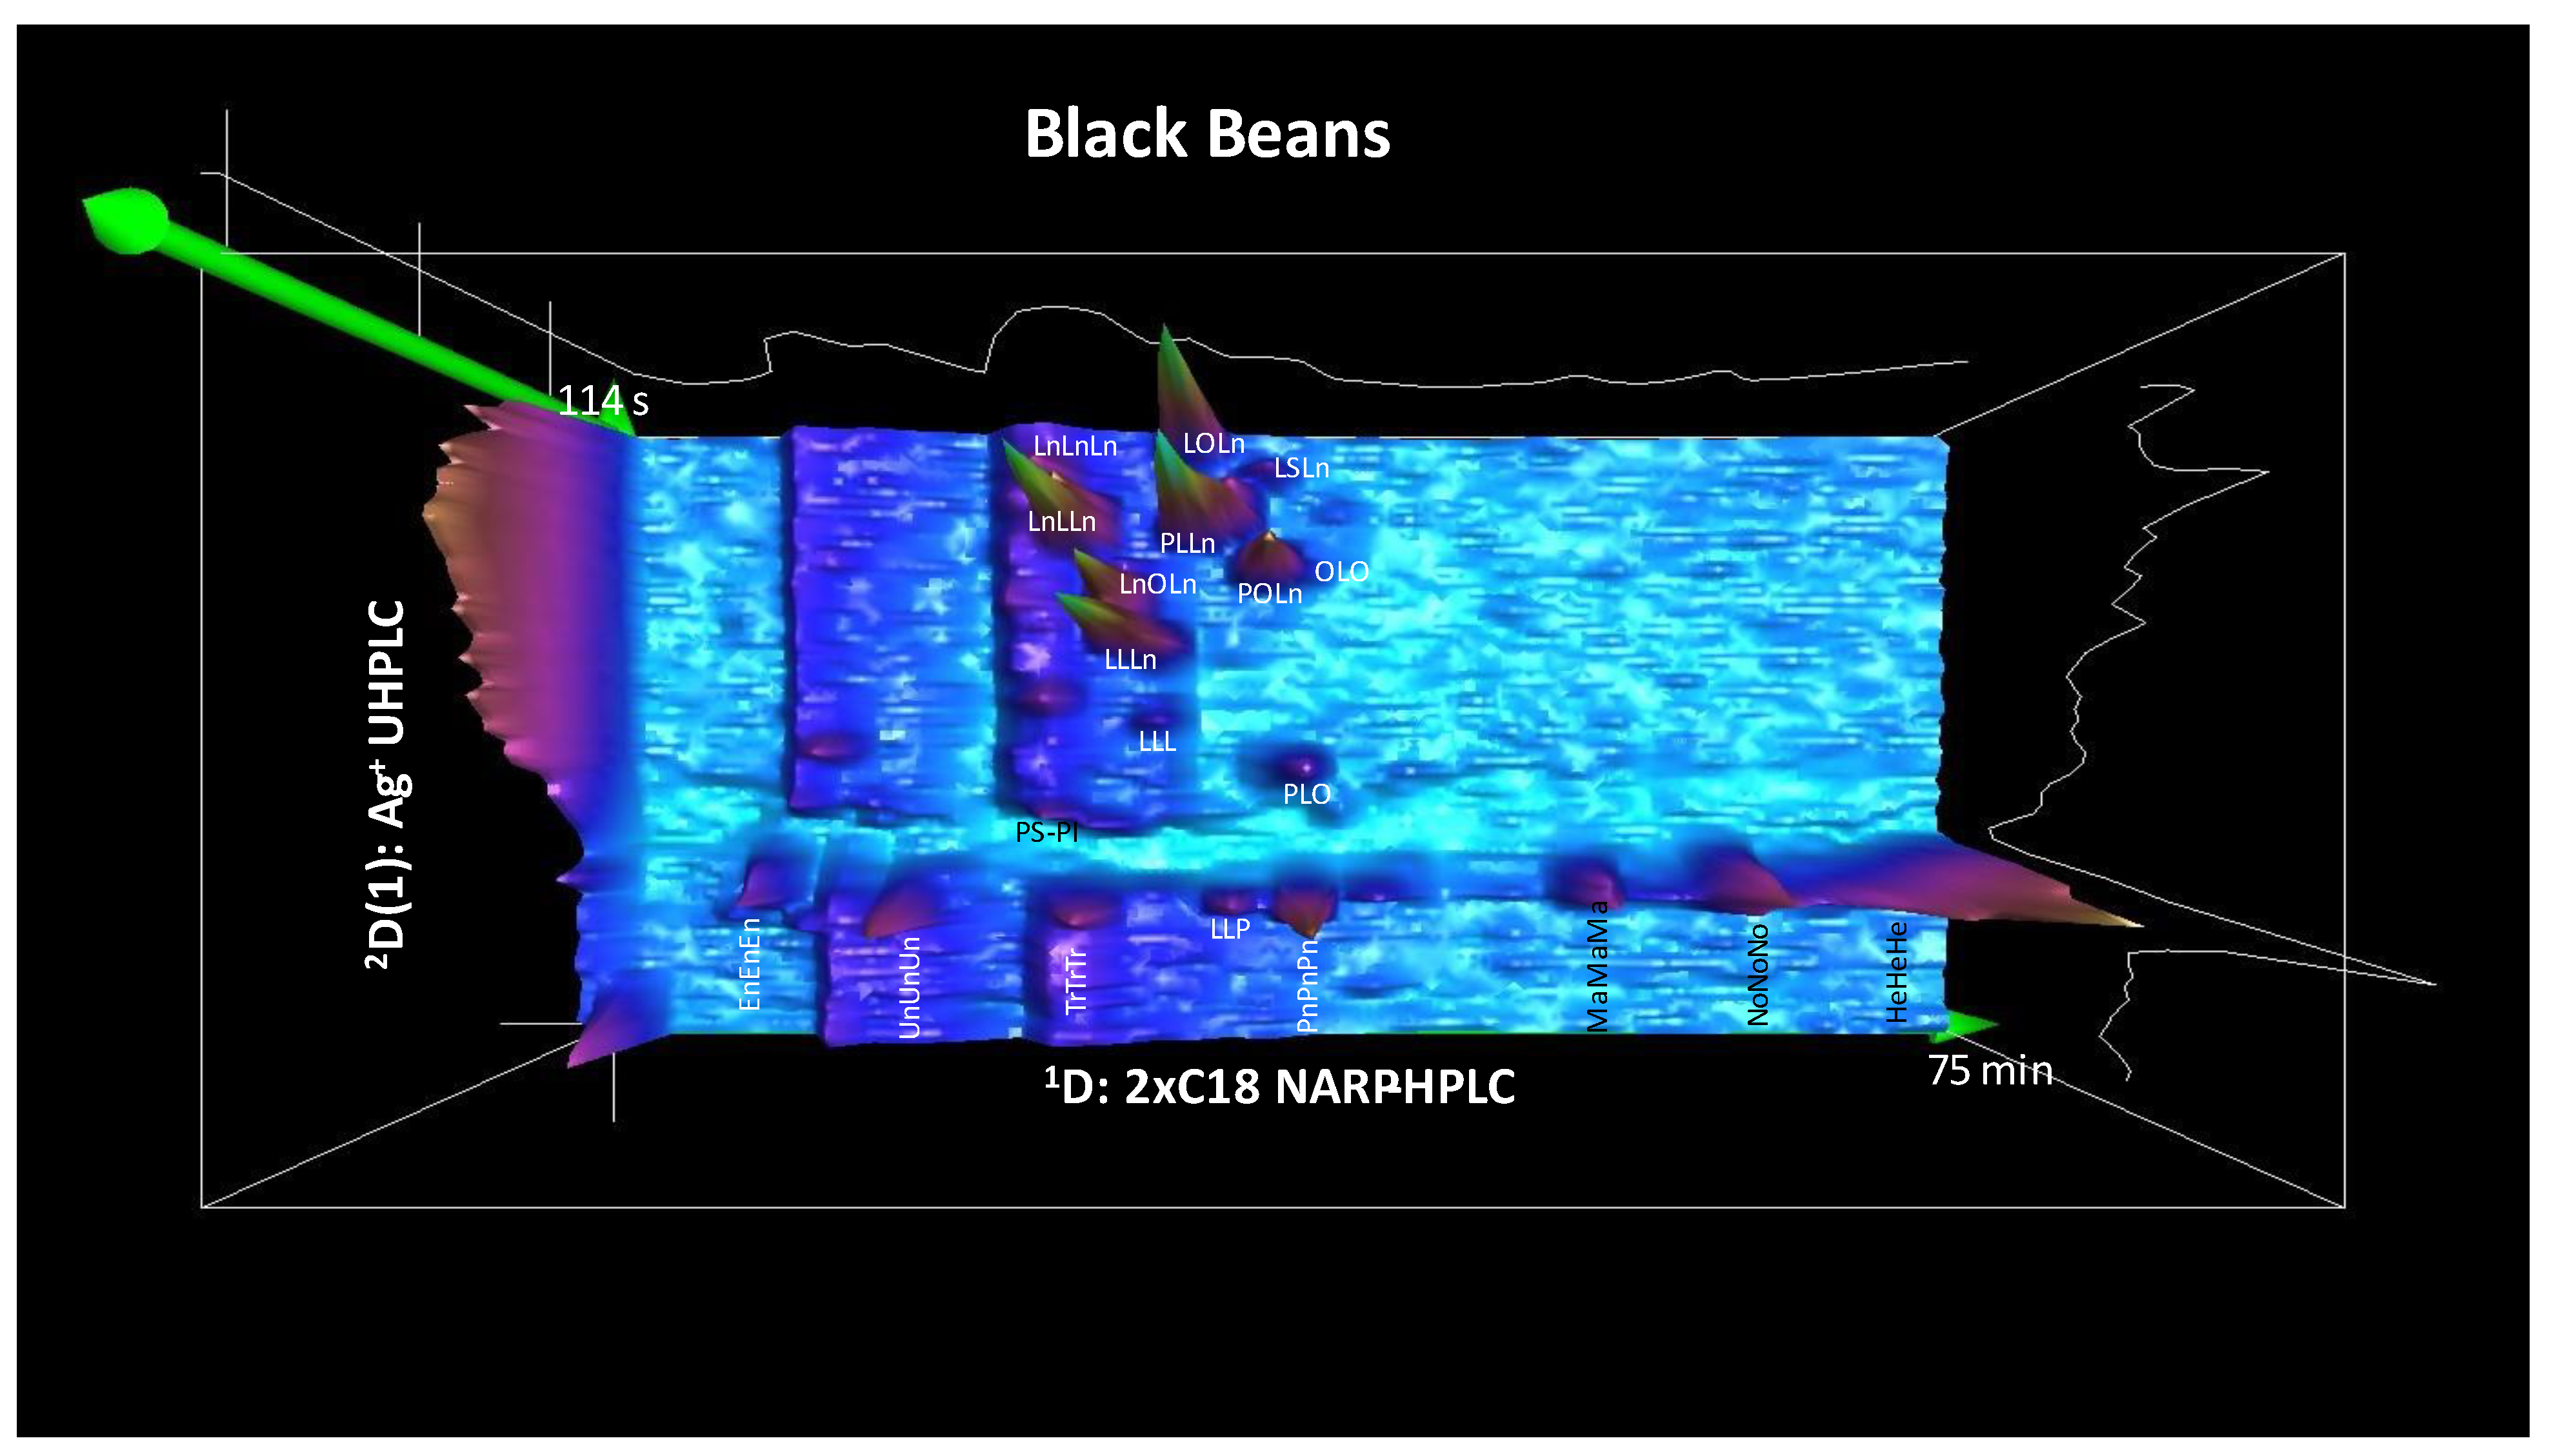
Saturated TAGs have no double bonds in the fatty acyl chains and are essentially unretained on the silver-ion column, exemplified by the odd-chain saturated AIS and EIS peaks that eluted with the solvent front at ~25–30 s in the 2D(1) in Figure 6 and Figure 7. The 2D(1) had a modulation period of 1.91 min, or 114.6 s, as originally reported [24], and shown at the end of the left axes of Figure 6 and Figure 7.
Figure 6 demonstrates that the polyunsaturated TAGs in black beans were mostly eluted at the end of the modulation periods, showing that they were retained on the column until the percentage of ACN reached the amount required to elute the unsaturates. The solvent gradient had two local maxima for ACN composition, as seen in Figure 2B, one for the intact PUFA-containing diacylglycerols, DAGs, at 13.06 min, and one for PUFA-containing TAGs at 26.43 min. These maxima can be seen as vertical ridges in Figure 6 and Figure 7 due to the increased background noise with ACN compared to MeOH. Figure 6 shows that the maximum ACN concentration was timed pretty well to elute the most polyunsaturated TAG expected, LnLnLn, 18:3/18:3/18:3. It appears the %ACN can be optimized further by allowing it to remain a little higher for longer to elute LOLn earlier (to move it further away from the upper edge in the plot) and to elute LLP in the prior modulation period. Fragment ratios in ESI-MS/MS mass spectra (not shown) from the 2D(1) showed that some TAGs, such as PLLn, were the same regioisomer as the average across all samples, shown in Table 1, while others, such as LOLn (versus OLLn in Table 1) had a different predominant form of TAG isomer. The ESI-MS/MS mass spectrum of LOLn exhibited the [LLn]+ fragment as the smallest fragment, which has been shown to be an indicator that it was the [DAG]+ formed from the energetically disfavored [41,42] sn-1,3 isomer in black beans, meaning the oleic fatty acyl chain was in the sn-2 position.
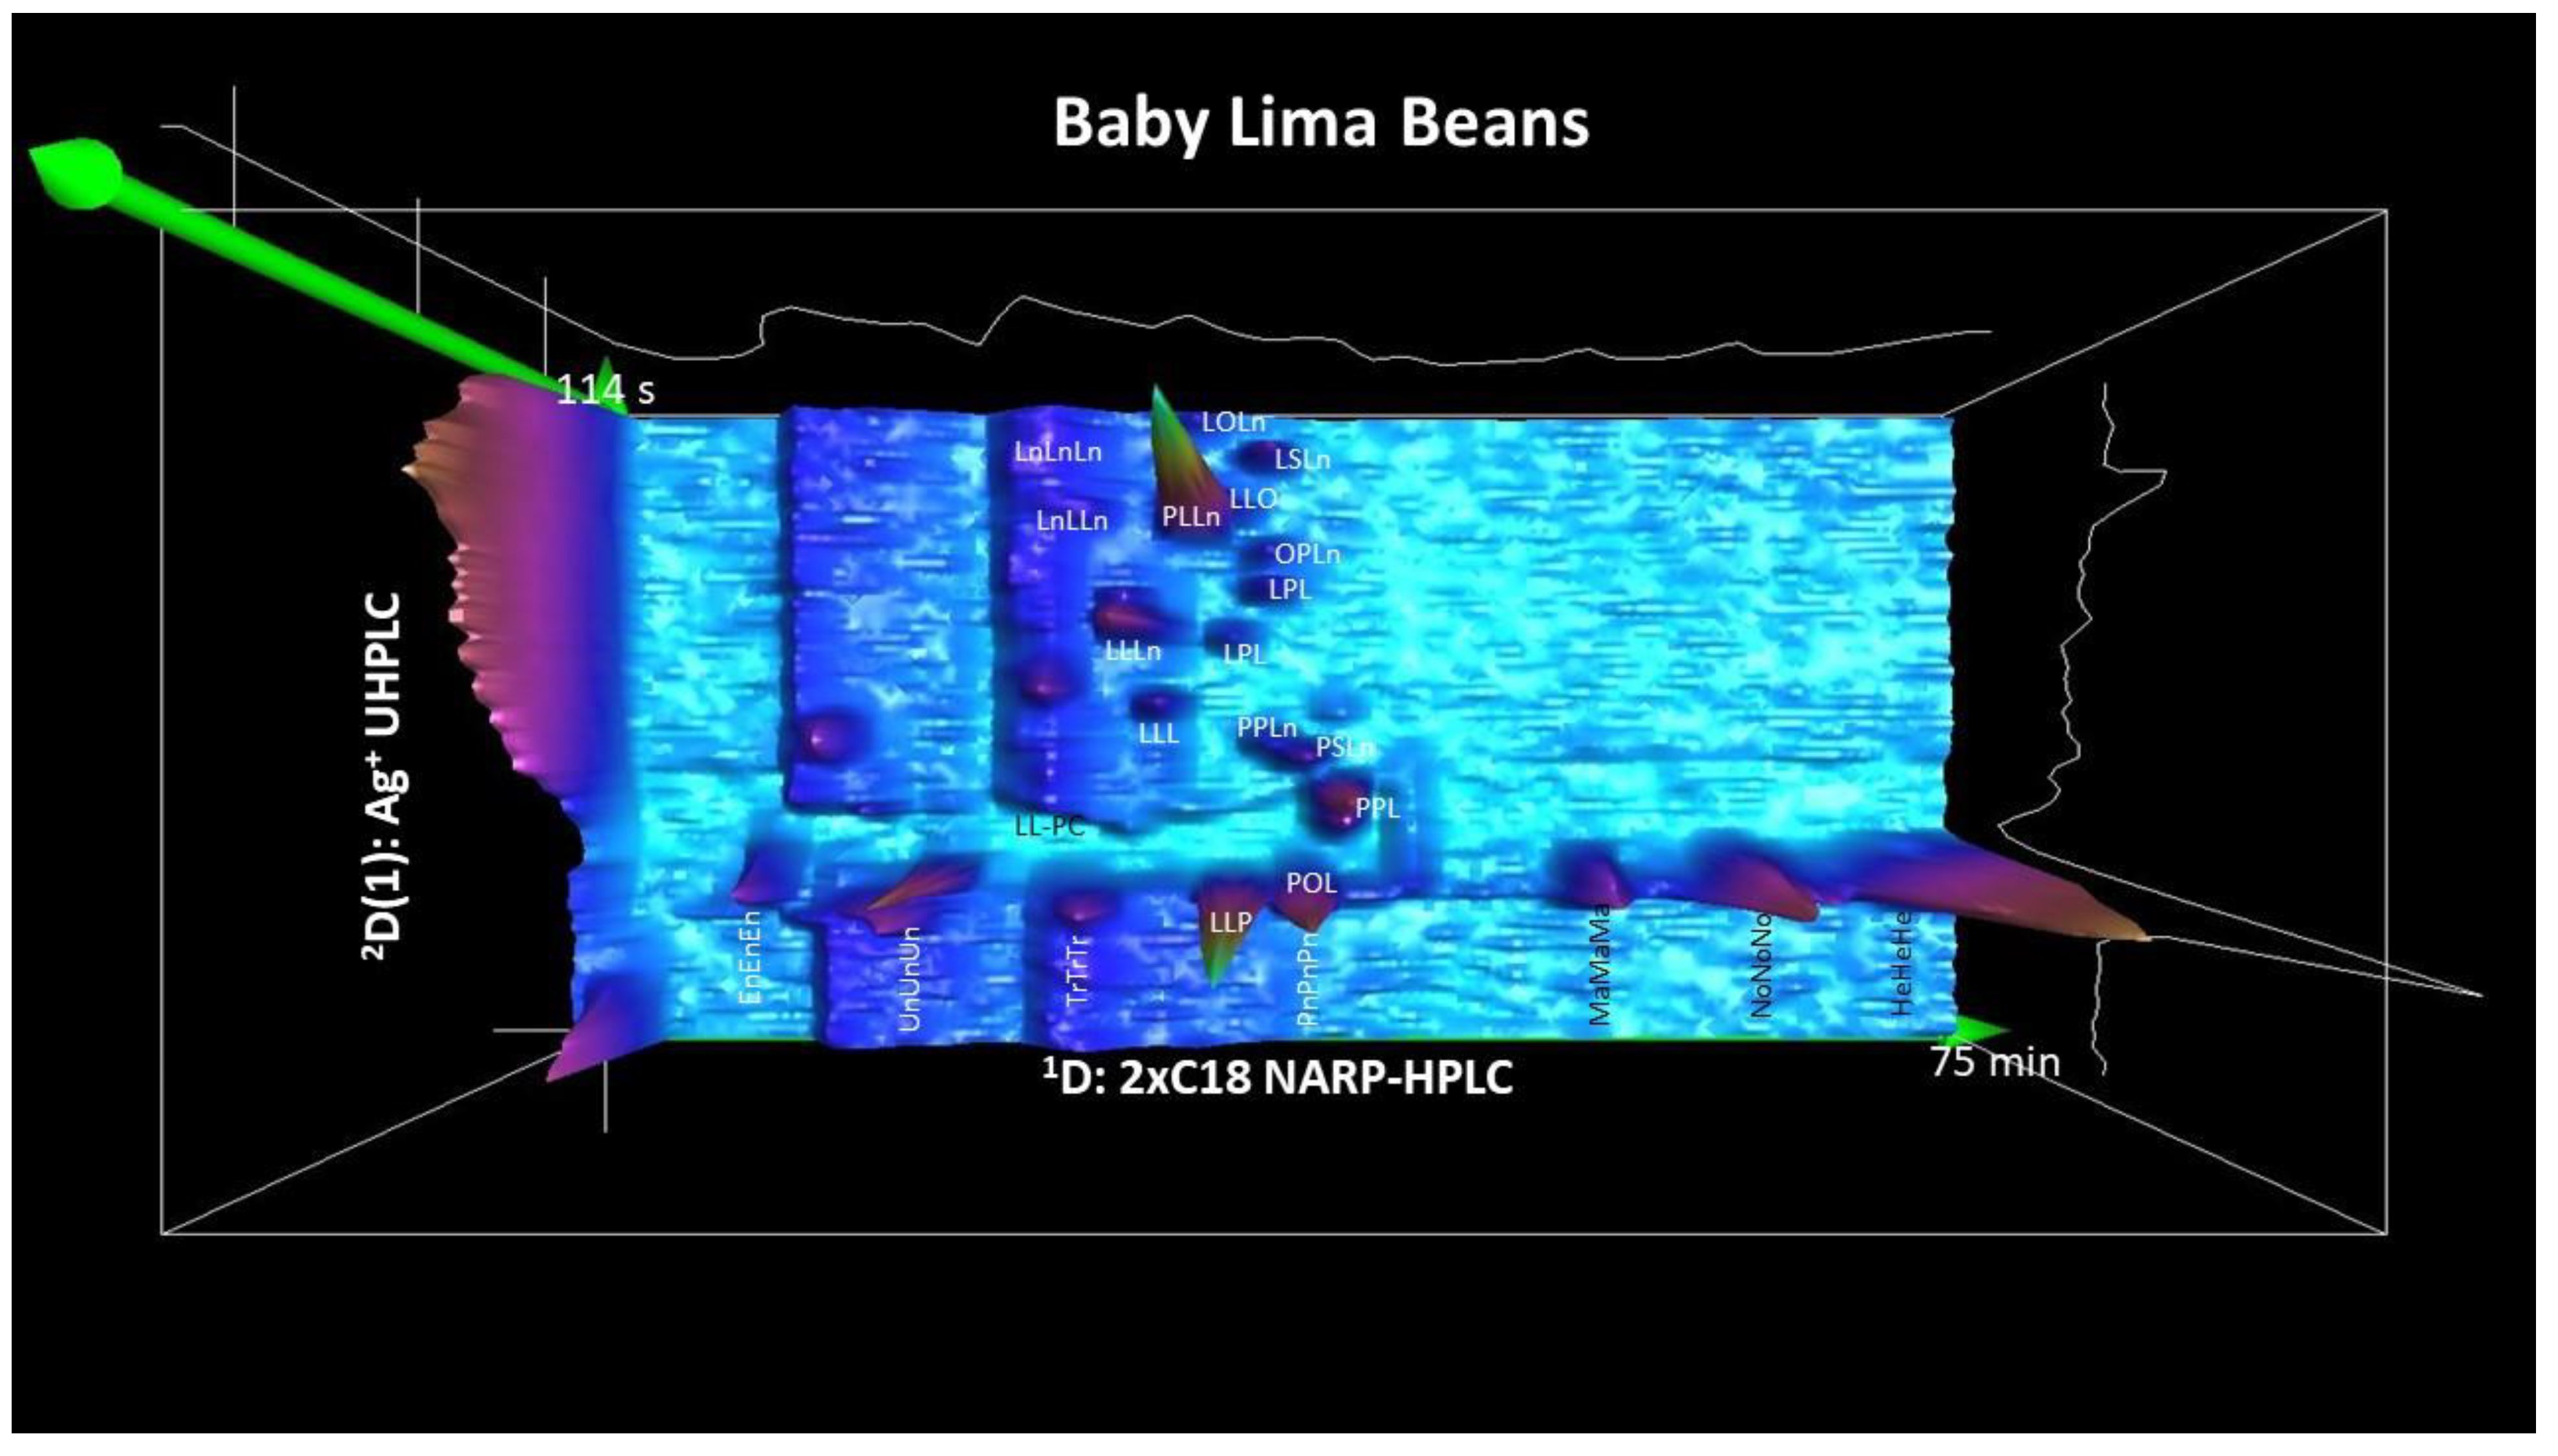
Figure 7 shows the silver-ion UHPLC separation of baby lima beans. As with the black beans in Figure 6, the saturated TAGs of the AIS and EIS were unretained on the silver-ion column. The PUFA-containing TAGs again showed good retention all the way to the end of the modulation period. Baby lima beans showed several spots for LLP/LPL that require additional MS/MS scans or the use of APCI-MS to better determine the structures of these isomers. This and other remaining issues regarding the argentation chromatography second dimension are discussed further below.

3.3. The Second Second Dimension 2D(2): C30 NARP-UHPLC

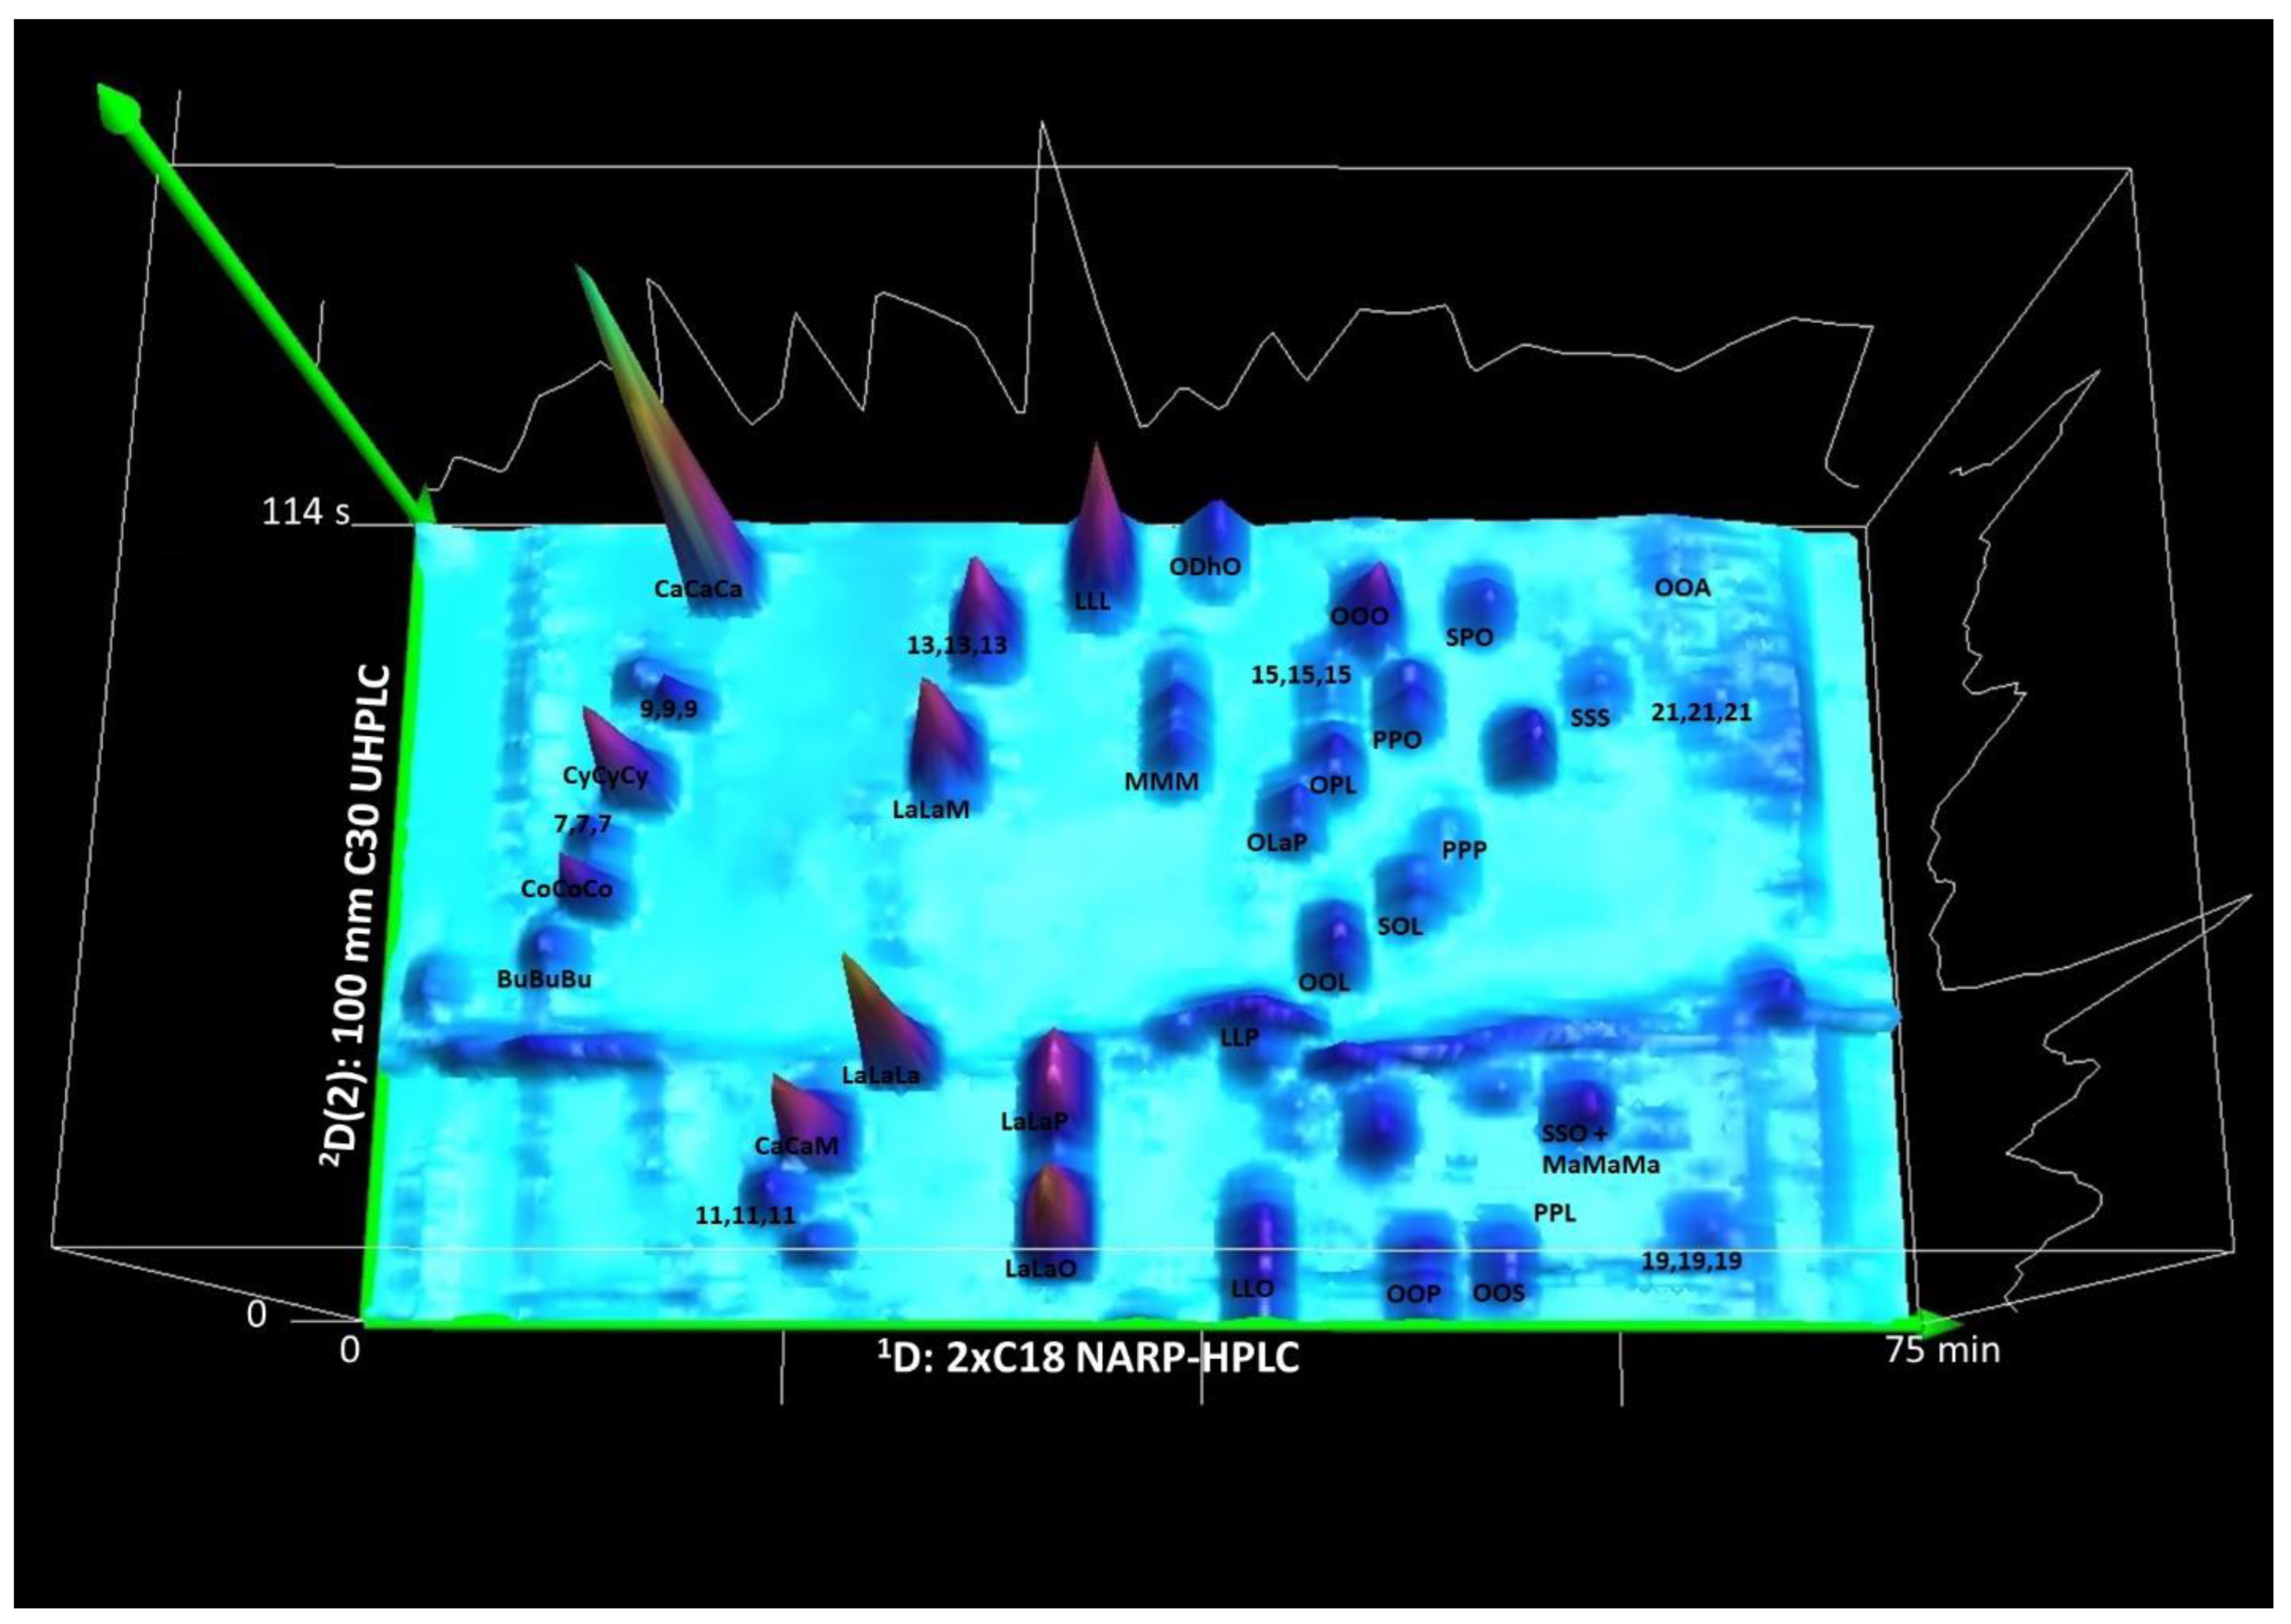
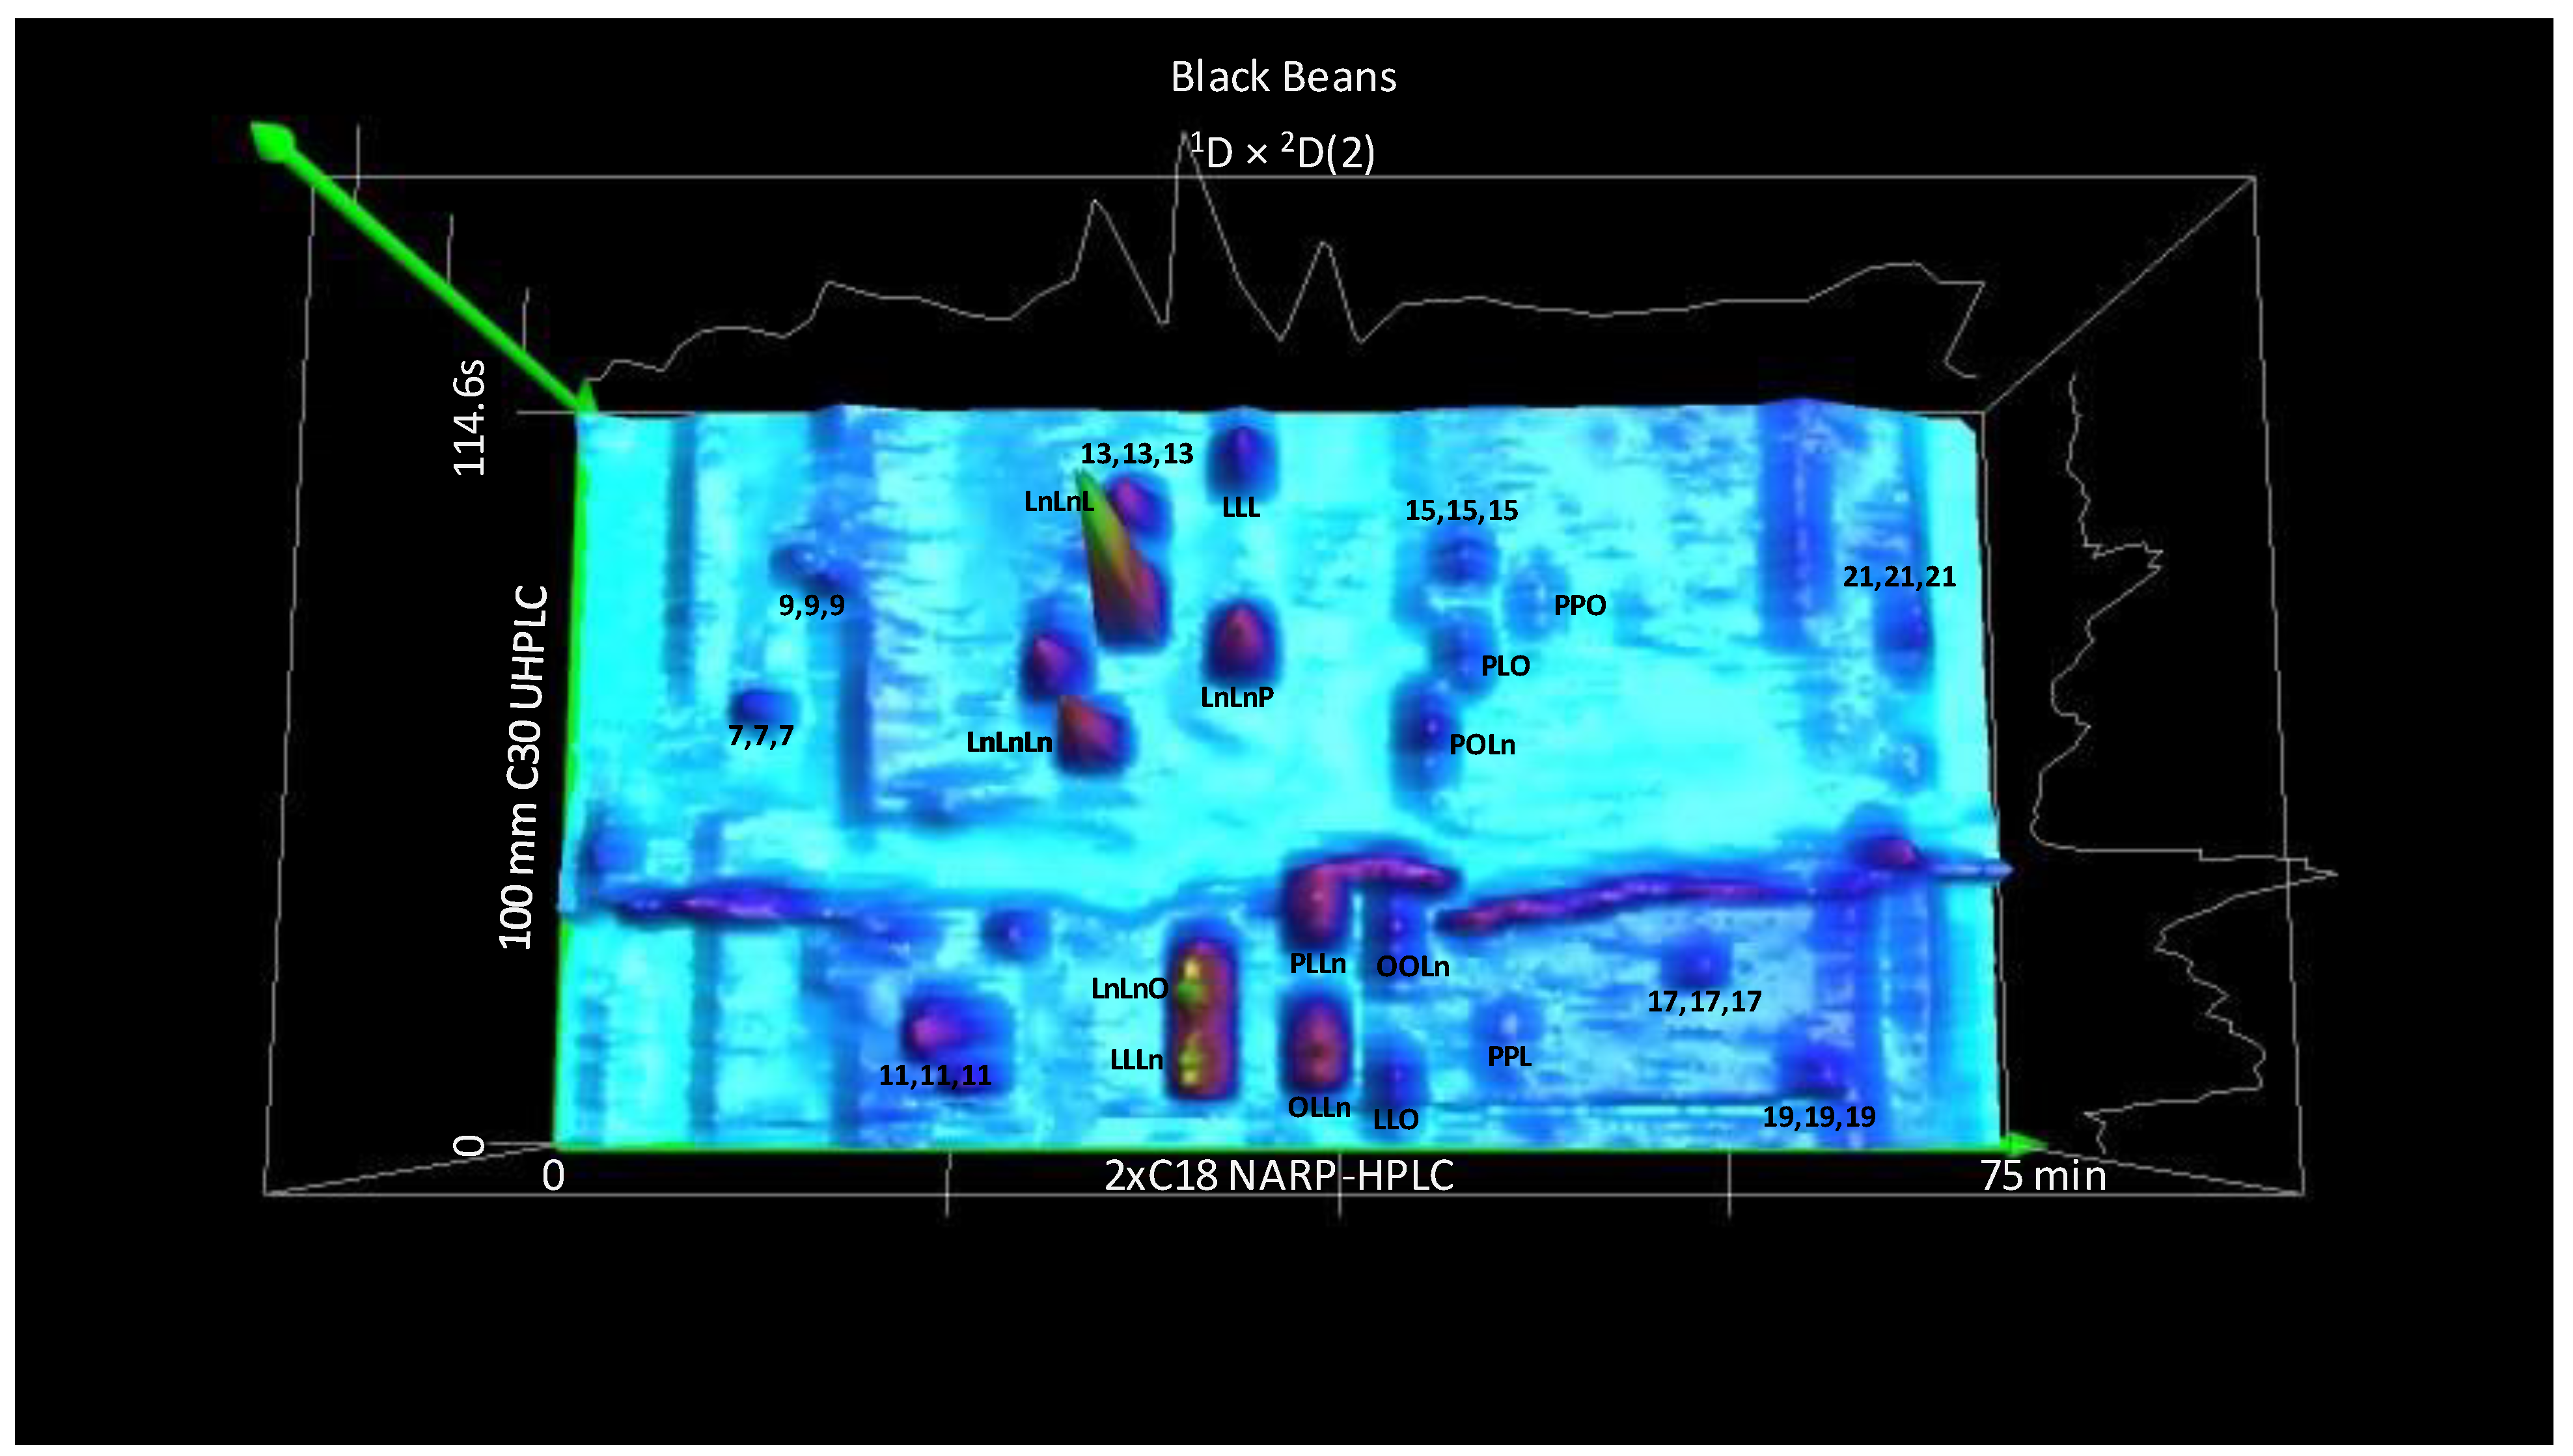
Figure 8 and Figure 9 show the second second dimension, 2D(2), for the TAG standards mix and black beans, respectively. Figure 8 shows good use of the available separation space, and Figure 9 illustrates the improved separation for some isomers such as LLL and OLLn compared to the 1D separation shown in Figure 5D. The results in Table 1 were obtained by using LipidSearch 4.2 lipidomics software on the 2D(2) ESI-HRAM-MS data such as pictured in Figure 9. The modulation period was chosen as 1.91 min (114.6 s) to match the first second dimension, 2D(1).
One important difference between the longer separation reported here and the shorter analysis reported earlier [31] is that the shorter analysis identified 116 TAGs versus 92 identified in Table 1. One reason was presumably because TAGs at low levels eluted in more compact small peaks in the shorter separation, versus being spread over a wider retention window and falling below the threshold for detection in the longer separation. Furthermore, in the previous report, TAGs were detected directly in a 1D separation, with post-column flow split to keep from overwhelming the ionization source. For the current report, flow was split so that only a fraction went to the 2D, and then was split again after the 2D to keep the ESI source from being overwhelmed. Since fewer TAGs were identified in this longer analysis, the relative percentages for the most abundant TAGs were mostly slightly higher than in the previous report although the relative percentages were generally in good agreement.
Table 1. Triacylglycerol (TAG) compositions of pulses, arranged in decreasing order by average TAG composition across all samples. Columns arranged by decreasing percentage of LnLLn. Averages of two replicates.
TAG aRT bPinto
Bean
Navy
Bean
Cran-
Berry
Bean
Black
Bean
Black-
Eyed
Peas
Butter
Bean
Lima
Bean
LentilsGreen
Split
Peas
Gar-
Banzo
Bean
PLLn c38.3815.4713.7315.1611.0616.0916.3515.255.983.190.83
PLL c42.125.927.796.085.1611.5718.8120.7712.4811.459.80
LLLn c32.4713.6312.5512.827.5310.576.648.745.744.902.08
LLO c41.641.432.752.524.151.553.014.3414.6314.9918.71
LOP c46.522.914.064.676.014.436.105.8710.9410.468.27
LLL35.830.792.340.831.360.934.417.258.5210.0413.41
LnLLn c29.7714.2011.2810.395.814.971.251.120.550.160.02
PLP c47.473.682.342.972.778.2310.829.132.962.301.61
OLLn c37.674.607.816.849.241.730.861.085.135.512.27
POLn c44.185.664.676.217.263.102.931.973.251.900.49
LnOLn d32.596.666.487.218.060.870.000.000.000.000.00
PLnP c44.684.832.763.732.656.935.163.450.870.000.04
LnPLn c34.085.885.466.184.734.351.901.620.000.000.00
OOL c45.940.470.900.751.220.000.000.295.605.4814.78
OOP c49.350.000.900.002.510.750.911.004.164.626.38
OOLn c41.971.692.733.135.350.000.000.394.053.111.06
PLS c50.430.000.910.000.923.255.023.471.161.890.45
LnLS c44.421.661.451.891.482.353.242.760.000.920.10
LnLnLn26.086.262.013.251.790.380.000.000.000.000.00
LLS c46.650.500.810.540.621.332.472.371.262.470.80
POP50.450.000.000.001.981.321.661.051.891.911.40
OOO48.810.000.000.000.610.000.000.001.962.447.36
OLS c49.370.000.000.000.710.370.970.971.943.291.67
LnLLg c53.510.990.600.880.340.820.530.660.000.000.00
LnLB c50.440.500.640.980.360.910.600.270.230.000.00
LnOS c47.600.000.700.900.780.450.650.430.000.620.00
PLnS c47.910.000.630.000.001.391.170.970.000.000.00
LnLnS c39.830.670.720.760.510.490.460.400.000.000.00
PLLg d59.030.000.500.000.481.190.850.840.000.000.07
LnLA c47.650.330.750.380.320.560.670.400.260.000.00
OOS d52.590.000.000.000.000.000.000.000.002.161.13
MOL d42.000.000.000.000.000.000.000.001.780.820.50
LLLg d56.210.000.370.000.230.730.550.000.420.270.13
PLA d53.980.000.000.000.000.910.850.470.000.300.19
LOB56.180.000.000.000.540.280.000.000.720.550.30
LLB d53.210.000.270.000.140.870.000.320.330.000.19
POS c53.910.000.000.000.000.000.000.470.001.210.47
PoLLn c32.430.720.000.650.680.000.000.000.000.000.04
LOA c53.190.000.000.000.000.000.000.000.640.680.60
PLnLg d57.520.000.400.000.320.650.240.240.000.000.00
LOLg c58.890.000.000.000.270.270.000.240.490.350.18
LLA c49.560.000.000.000.000.380.000.290.260.230.32
PLB d56.920.000.000.000.000.930.000.320.000.000.10
SSL d53.980.000.000.000.000.170.450.360.000.270.04
PLnB d54.900.000.000.000.370.880.000.000.000.000.00
OLG c48.960.000.000.000.000.000.000.000.390.370.62
LLG d45.840.000.000.000.000.000.000.000.530.440.22
LnLnA c44.800.250.000.270.170.200.000.000.000.000.00
LPG d49.340.000.000.000.000.510.260.000.310.000.00
LnOB d53.310.000.400.000.510.220.000.000.060.000.00
OOA c56.150.000.000.000.000.000.000.000.000.450.43
LnLG c41.960.000.000.000.000.390.000.000.500.000.00
LnLnB c48.080.300.000.000.170.250.000.000.000.000.00
OPoL c41.790.000.000.000.000.000.000.000.000.000.34
LnPTc c56.240.000.000.000.000.590.000.000.000.000.00
LSB d59.030.000.060.000.050.210.150.070.000.000.01
OOB c58.880.000.000.000.210.000.000.000.000.000.21
OOG c51.660.000.000.000.000.000.000.000.000.000.40
LnOA c50.380.000.000.000.320.000.000.000.000.000.01
LgOLn d56.220.000.170.000.180.000.000.000.000.000.00
LPoP d42.020.000.000.000.000.000.000.000.000.250.14
LSA d57.290.000.000.000.000.120.000.110.000.000.02
OPG d52.610.000.000.000.000.000.000.000.000.000.21
LnSB d57.520.000.060.000.050.110.060.020.000.000.00
LPoL c35.770.000.000.000.000.000.000.000.000.000.37
LnLnLg c51.030.000.000.000.000.190.000.000.000.000.00
POA d57.390.000.000.000.000.000.000.000.000.000.14
POB d59.000.000.000.000.000.000.000.000.000.000.13
PnLO d44.790.000.000.000.000.000.000.000.000.000.15
PLnG d46.960.000.000.000.000.160.000.000.000.000.00
LnPA d51.300.000.000.000.000.000.000.130.000.000.00
LOTc c57.460.000.000.000.000.000.000.000.000.000.13
LnSA d54.900.000.000.000.030.090.000.000.000.000.00
LLTc c54.840.000.000.000.000.000.000.000.000.000.08
L20:2O d45.590.000.000.000.000.000.000.000.000.000.09
LLPn d40.010.000.000.000.000.000.000.000.000.000.08
SLnS d51.300.000.000.000.000.000.000.080.000.000.00
LOMa d47.920.000.000.000.000.000.000.000.000.000.07
LL20:2 c41.520.000.000.000.000.000.000.000.000.000.06
LLMa c44.840.000.000.000.000.000.000.000.000.000.06
LO21:0 c54.810.000.000.000.000.000.000.000.000.000.06
POLg d60.900.000.000.000.000.000.000.000.000.000.04
OPnO d47.930.000.000.000.000.000.000.000.000.000.04
L17:1O c44.480.000.000.000.000.000.000.000.000.000.03
SOS d57.390.000.000.000.000.000.000.000.000.000.03
LO15:1 d40.010.000.000.000.000.000.000.000.000.000.01
OSA d59.000.000.000.000.000.000.000.000.000.000.01
L17:1P d44.790.000.000.000.000.000.000.000.000.000.01
L19:1P d47.920.000.000.000.000.000.000.000.000.000.01
L17:2P d40.010.000.000.000.000.000.000.000.000.000.01
O17:1P d47.930.000.000.000.000.000.000.000.000.000.00
OSB d60.900.000.000.000.000.000.000.000.000.000.00
Sum 100.00100.00100.00100.00100.00100.00100.00100.00100.00100.00
a TAG abbreviations in Materials and Methods. b Average 1D retention time across all pulse samples. c Stereochemistry determined from Critical Ratios of pure peaks. d Stereochemistry determined from Critical Ratio 2 of apportioned TAGs.
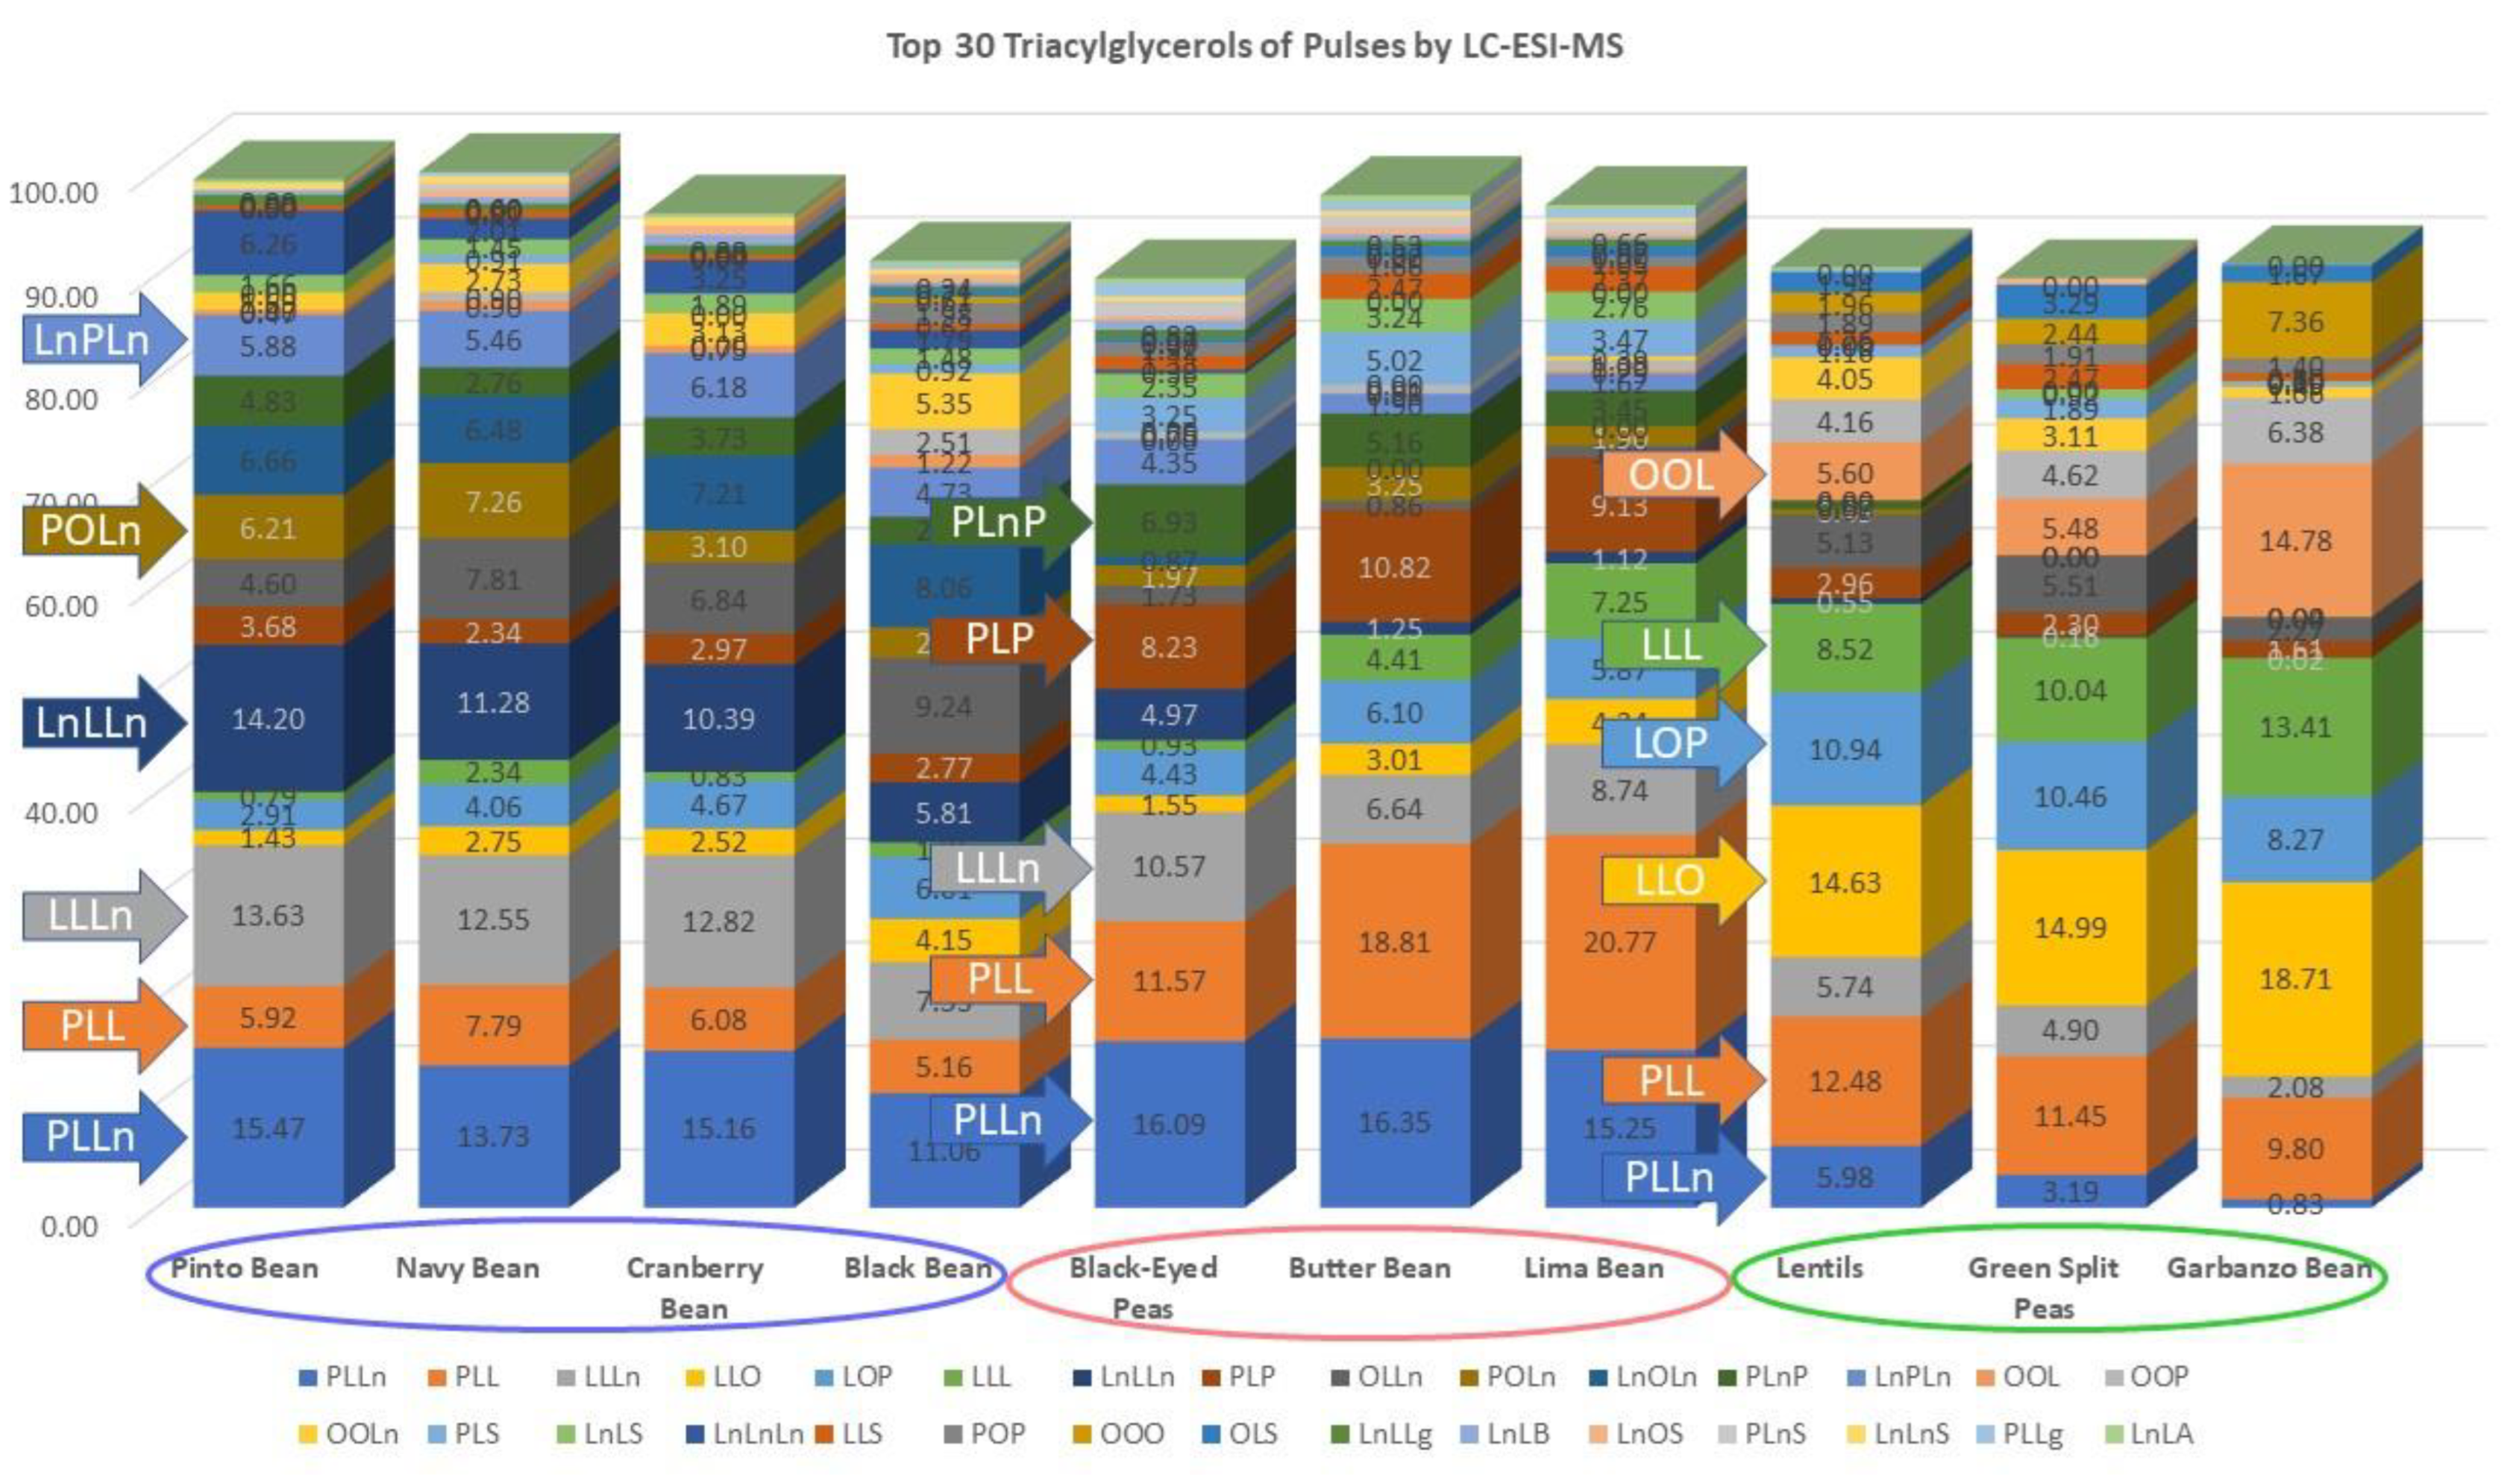
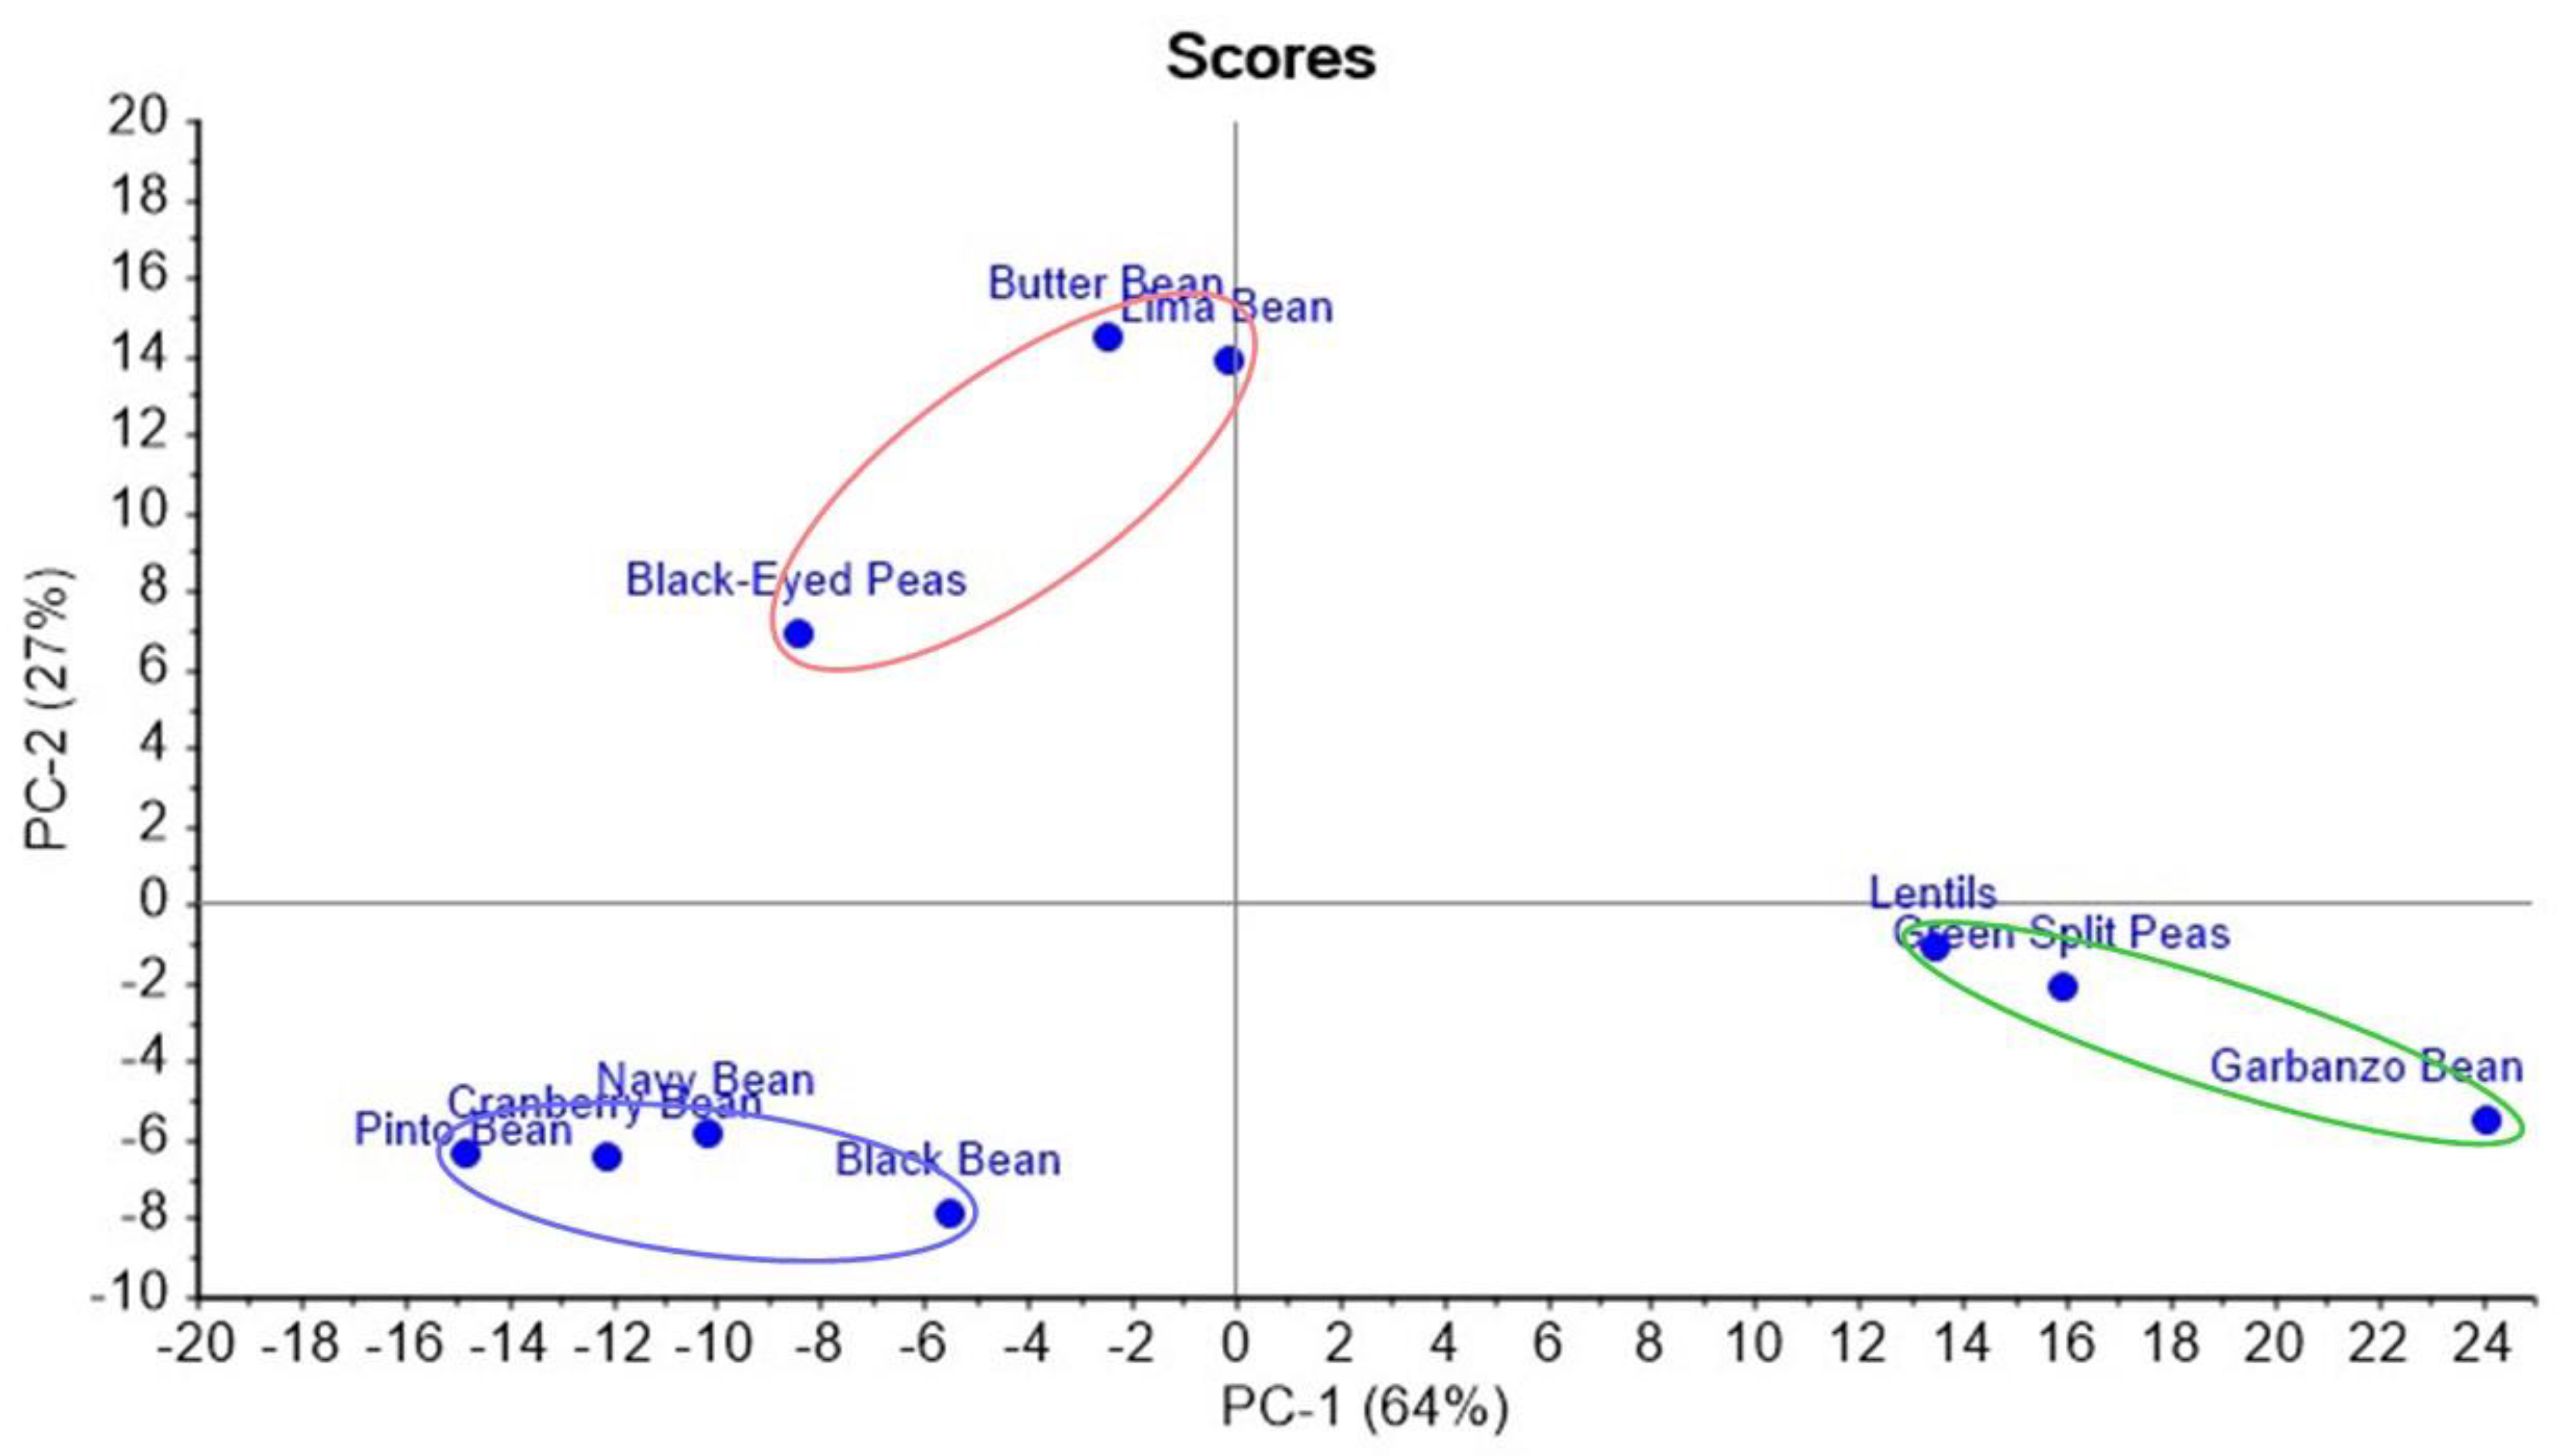
Table 1 shows the TAG composition sorted in decreasing order starting with the most abundant average across all pulse samples, with the top 30 TAGs depicted in the bar graph in Figure 10 and indicated by the dashed line in Table 1. As with our previous report [31], the table columns are arranged according to the amount of LnLLn, decreasing from left to right, since this arrangement was found to match well with the grouping of samples by principal component analysis (PCA), Figure 11. Butter beans and lima beans switched positions, compared to our previous report [31], due to very similar amounts of LnLLn.
Black-eyed peas clustered with butter beans and lima beans due to similar amounts of PLLn, PLP, and PLnP in Figure 10, but they also showed similar tendencie to the Phaseolus vulgaris group, by having more LLLn than butter beans and lima beans. Black-eyed peas showed similarities with the third cluster (in green) because of the lower level of LLP than butter beans and lima beans. Figure 11 shows that all pulses still clustered into the same three clusters that were found in the earlier report [31]. Thus, these results are in good agreement with the results reported using fast chromatography [31].
For this report, we identified several classes of phospholipids, in addition to TAGs, which are listed in Table 2. An initial lipidomic analysis was performed with the class limited to TAGs, for specificity, and then another analysis was performed focused on phospholipids. Even so, a phosphatidylinositol molecular species was manually identified using the silver-ion UHPLC in the 2D(1), Figure 6, that was not found using the lipidomic software, due to the lack of a MS/MS mass spectrum in the 2D(2).
The lipidomic software did identify one unrecognized compound present in a substantial quantity in navy beans, equivalent in mass to (or an isomer of) a formic dehydrated ceramide, Cer(m18:2/1:0), C20H37NO2, or N-formic-2-amino-octadec-2,4-en-1-ol or its isomer N-formic-2-amino-octadec-1,4-en-3-ol, having a calculated [M + H]+ of m/z 324.2897 and observed [M + H]+ at m/z 324.2886, for a difference of 3.4 ppm. The mass spectra also showed an abundant secondary ion at m/z 322.2734, apparently formed by cyclization with loss of two hydrogens. Structures of the proposed ions are given in Supplementary Figure S1. This mass and formula are also isomeric with linoleoyl ethanolamide, which can be formed by cleavage of the carbon 2,3 bond in either Cer(d18:0/18:2) or Cer(d18:1/18:2), which are the two most abundant ceramides in navy beans.

3.4. Regioisomer Quantification

Regioisomers were quantified with both ESI-HRAM-MS/MS in the 2D(2) and APCI-MS in the 1D using Critical Ratio 2 (CR2) [39], the [AA]+/[AB]+ ratio, with CR2 values obtained from ESI-HRAM-MS and APCI-MS given in Supplementary Table S5. In the current report, we report %AAB, calculated according to Equation (4) in The Bottom Up Solution (BUS) [39]. We earlier reported the %ABA, based on Equation (3) in the BUS [39], but since more TAGs were AAB regioisomers, and to demonstrate that both equations work equally well, we report here the %AAB. Of course, the %AAB + %ABA = 100%, so the %AAB = 100% − %ABA.
The CR2 values from this longer (75 min) MD-LC separation were compared to the CR2 values reported earlier [31], obtained using the fast (10 min) LC separation. The ESI-MS CR2 values in Figure 12A agree rather well with the previous results [31], and have very low standard deviations. Using either set of data, the primary regioisomer, ABA or AAB, in each pulse extract could be readily identified. Nevertheless, there is sufficient difference between values in different experiments that the best results are obtained when CR2 values are determined concurrently with samples. The results by APCI-MS coupled with MD-LC are compared in Figure 12B to the results by APPI-MS coupled with fast LC reported previously [31]. The results by APCI-MS showed less variability (smaller standard deviations) than those by APPI-MS, and narrower ranges of values between CR2 for ABA versus AAB isomers. The estimated regioisomer percentages are given in Supplementary Table S6, calculated using CR2 from APCI-MS QuanBrowser results in the 1D, ESI-MS LipidSearch results in the 2D(2), and ESI-MS QuanBrowser results also in the 2D(2). With few exceptions, the results agreed well across these three approaches, in terms of identifying the major regioisomer using BUS Equation (4) [39]. The exceptions all occurred in OLO/OOL, specifically the percentage of OOL in navy beans and garbanzo beans by APCI-MS was lower than that determined by ESI-MS; the %OOL in black beans determined by ESI-MS using LipidSearch was lower than others; %OOL in baby lima beans was lower by ESI-MS with Quan Browser than others. The differences are likely due to incompletely resolved LLS in the 1D, which is isomeric with OOL at m/z 900.80 and shared a common m/z 603.5 ion, [OO]+ = [SL]+. Nevertheless, the large majority of values in Supplementary Table S6 provided a good consensus of what was the major regioisomer.
Due to the lack of sufficient replicates of HRAM-MS data in the 2D(2), absolute quantification results are not presented for these experiments.

4. Discussion

4.1. NARP-HPLC: The First Dimension, 1D

The primary difference between the NARP-HPLC in the 1D and the NARP-UHPLC in the 2D(2) was the absence of acetonitrile in the 1D NARP method, but its presence in the 2D(2) gradient. ACN does provide a better separation in the 1D when it is incorporated [30], but ACN is a strong elution solvent for silver-ion LC, so ACN was eliminated in the 1D when argentation LC was used in the 2D [24], to avoid transferring ACN to the 2D(1). The slight loss of resolution in the 1D when ACN was excluded due to silver-ion LC in the 2D was compensated for by then using ACN in the 2D(2).
One result of eliminating ACN in the 1D was that APCI-MS could be used in the 1D. ACN causes a “blob” to form on the tip of the APCI corona needle, greatly reducing sensitivity after a few runs. We previously mentioned that APPI is a non-contact source, meaning that the sample does not contact the source of ionization, thereby not suffering from the loss of sensitivity. However, the long sequences described in the previous report [31] did cause the front glass of the APPI lamp to become coated in sample spray, leaving a brown contamination that caused the APPI signal to decrease over time. Thus, APPI did not turn out to be the solution that we had hoped, due to the signal decrease during long sequences of runs. Given the cost of APPI lamps, we switched back to APCI-MS for the current analysis, since the absence of ACN made it feasible.
APCI-MS has some characteristics that made it beneficial as the 1D ionization source. First, the mass spectra produced by APCI-MS exhibit both protonated molecule ions, [M + H]+ and [DAG]+ fragments for most molecules except saturated TAGs. This provides structural information, such as the molecular mass and identities of the [DAG]+ fragments, without the need for MS/MS. Also, APCI-MS is usually substantially less sensitive than ESI-MS; thus, this makes APCI-MS better for the 1D, which can overwhelm sensitive ESI-MS unless flow is split to limit the amount of effluent going to the ESI source. APCI-MS allows more latitude in detecting higher concentrations.
Unit resolution ESI-MS on a tandem sector quadrupole (TSQ) instrument was used for the Ag-ion UHPLC in the 2D(1). Since the best separation was expected in the 2D(2), the HRAM-MS instrument operated in ESI mode was used for detection of the multi-cycle elution in the 2D(2). But the less than stellar reproducibility of the areas used for absolute quantification in the 2D(2) (not shown) indicated that the best results may be obtained using the ESI-HRAM-MS in the 1D.
This method was not optimized specifically for pulse TAGs. The method was developed for the separation of the widest range of saturated and unsaturated TAGs in a variety of samples that we anticipate analyzing. One can see in Figure 3B that the method is applicable to TAGs from BuBuBu (4:0,4:0,4:0) to NoNoNo (19:0,19:0,19:0). We intend to apply the method to milk and infant formula, which contain many short-chain fatty acids (SCFAs). These elute prior to LnLnLn which is the most unsaturated “normal” FA in most plant oils, so the early part of the method was designed to separate SCFAs. Then, the latter part of the gradient was designed to wash longer-chain saturated TAGs, such as NoNoNo and HeHeHe off the column, but even at very high concentrations of DCM these were difficult to elute cleanly. Therefore, the first part of the gradient was for SCFAs, the middle of the gradient was for normal unsaturated and saturated TAGs, and the last part of the gradient was for long-chain saturates. The separation of pulse TAGs could be improved if the first and third parts of the methods were eliminated and it was optimized exclusively for plant oils, but part of the goal of our approach is to have one method for every kind of TAG that we expect to encounter in a wide range of samples.

4.2. Silver-Ion Chromatography: The First Second Dimension 2D(1)

Silver-ion chromatography, also called argentation chromatography, separates lipids based on the location of double bonds (e.g., Δ6, Δ9, and also sn-1,3 versus sn-2) and their geometry (cis/trans) in the fatty acyl chains, due to π-π coordination of double-bond carbon p orbitals with silver ions [44,45,46]. Trans double bonds coordinate with silver ions much less strongly than cis double bonds, so trans double bonds are retained much less strongly on the Ag+ column and elute earlier than cis double bonds. Saturated TAGs have no double bonds in the fatty acyl chains, hence, are essentially unretained on the silver-ion column, as evidenced by the early-eluted peaks for the AIS and EIS saturated odd-chain TAGs.
The retention mechanism on the silver-ion column is highly orthogonal to the NARP-HPLC and NARP-UHPLC used in the 1D and the 2D(2), respectively. Thus, we are using two highly orthogonal 2Ds, which are distinct from the kinds of column arrays mentioned in the Introduction [7] that used a common LC system for all columns in an array. Since argentation chromatography is quite selective for double bonds, single modulation period elution (versus multi-cycle elution) was used in the 2D(1).
While the argentation chromatography did provide an overall good separation based on the degree of unsaturation, we did not accomplish the fine separation of regioisomers. We hope to report improvements of the silver-ion LC for regioisomer analysis after preparing a new silver-ion column using our original approach.

4.3. Multi-Cycle Chromatography: The Second Second Dimension 2D(2)

We performed lipidomic analysis differently from other groups. We first used LipidSearch for the integration of TAG areas, including internal standards, and we exported those raw areas to spreadsheets for internal-standard and response-factor based quantification of TAGs. We used lipidomics-derived peak areas in a similar manner as our original quantification method [47,48], where the FA composition obtained by GC-FID was used to make response factors for TAGs, such as TAG RF = RFFA1 × RFFA2 × RFFA3.
Another way that our data analysis did not follow a conventional workflow was that we also “captured” mass spectra as text lists from the LipidSearch integration window and pasted them into spreadsheets for the calculation of Critical Ratios [38,39,40] from the [DAG]+ fragments, and from those, regioisomer compositions (Supplementary Table S6). Figure 12 confirms that trends that we recently reported using fast chromatography [31] were also replicated using MD-LC. The current ESI-MS data (Figure 12A) show, as did the prior data, that all else being equal, CR2 increased with increasing chain length of the component at stereospecific numbering (sn) position 2, sn-2, such that CR2OPO < CR2OSO < CR2OAO and CR2LaMLa < CR2LaPLa. These data also confirm that there is an effect of unsaturation, such as CR2POP < CR2PLP. There is a combined effect of unsaturation with chain length, such that CR2LaPLa < CR2LaOLa and CR2LPL < CR2LOL. Figure 12A shows that the results of ESI-MS were fairly consistent between the 1D fast LC reported earlier and the current results by 2D(2), although for the best regioisomer quantification results, the TAG regioisomer standards should be run concurrently with and under the same conditions as the analytes. The difference between CR2 values for ABA versus AAB TAG regioisomers, ΔCR2, also showed some similar patterns, as seen in Supplementary Figure S2. For instance, ΔCR2LPL < ΔCR2LOL and ΔCR2OPO < ΔCR2OSO, but ≈ΔCR2OAO. Similarly, ΔCR2LaMLa < ΔCR2LaPLa < ΔCR2LaOLa. Thus, both the magnitude of CR2 values and the range of CR2 values showed patterns dependent on the carbon chain length and degree of unsaturation.
We earlier discussed that ESI-MS/MS results did not agree with APCI-MS results as well as they did with APPI-MS results [49]. But this was observed when we compared tabulated values derived from the abundances reported by Holčapek et al. [50] and converted them to Critical Ratios, because we did not have concurrently analyzed regioisomer standards. The low standard deviations in Figure 12A compared to Figure 12B indicate that ESI-MS/MS should be more accurate for regioisomer quantification than APCI-MS or APPI-MS, as long as regioisomer standards are run under the same conditions.
Figure 12B shows that APCI-MS from the 1D in MD-LC provide higher standard deviations (SDs) than ESI-MS (Figure 12A), but less than APPI-MS. APPI-MS (from our previous report using fast chromatography [31]) showed more variability in values and in SDs. Thus, there appears to be an advantage of APCI-MS over APPI-MS for regioisomer analysis. But other factors, such as the use of ACN in the mobile phase, may make APPI-MS more beneficial than APCI-MS in some circumstances.
The effect of unsaturation is most clearly seen in the fragmentation behavior of ODhO/OODh. The [OO]+/[ODh]+ ratio obtained by APCI-MS (and APPI-MS and the earlier report of ESI-MS [31]) is far above the statistically expected ratio of 1/2, or 0.5. Most ABA TAGs have a CR2 < 0.5, due to the energetically disfavored loss of the FA in the sn-2 position [20], leading to less formation of [AA]+ from ABA TAGs. Conversely, normal AAB TAGs have a CR2 > 0.5 and usually <1.0, although APPI-MS often produces higher values. ODhO/OODh, on the other hand, has [OO]+/[ODh]+ ratios far outside the normal range. This is likely because docosahexaenoic acid (Dh), 22:6, has such a high degree of unsaturation that it readily stabilizes the ionic charge, and makes an excellent leaving group; thus, the amount of [OO]+ formed from the loss of Dh is much higher than normal, even for the ABA form, ODhO. However, using ESI-MS in the 2D(2), ODhO/OODh produced anomalous results that we do not yet understand. The ODhO produced a higher than statistically expected CR2 value, as would be expected based on the above discussion, but not as large as other results. The OODh, on the other hand, produced anomalously low values, indicating the stabilization of the [ODh]+ fragment instead of loss of the Dh, giving a higher [ODh]+, lower [OO]+, and anomalously low CR2 for an AAB TAG. Additional data are required to shed light on this behavior.
Our comprehensive MD-LC (cMD-LC) research differs from most cMD-LC separations due to the fact that we perform slow MD-LC with long modulation times (1.91 min). TAGs usually eluted in the 2D(2) as one peak, not split across modulation periods (Figure 8 and Figure 9), despite being on the column through multiple modulation cycles, hence “multi-cycle”. Appearing as single peaks greatly facilitated and simplified lipidomic software analysis of the ESI-HRAM-MS data using LipidSearch. Nevertheless, the demonstrated method will be improved by allowing analytes to remain on column through more modulation periods to provide a better separation in the 2D(2), analogous to twin-column recycling chromatography [26,51].
The results indicate that it will be more beneficial for reproducibility to reconnect the ESI-HRAM-MS instrument back to the 1D than to have it detect the 2D(2), especially given the better 1D separation offered by the 75 min run, despite the lack of ACN. Then, a unit resolution TSQ instrument can be used in the 2D(2) simply for the apportionment of any overlapped 1D peaks.

5. Conclusions

We have demonstrated the proof of concept of a potentially ideal combination of complementary first-dimension, multi-cycle, and orthogonal stationary phases providing different retention mechanisms coupled with detection using multiple types and techniques of mass spectrometry. We have combined HRAM-MS for quantification using lipidomics software with classical tandem sector quadrupole MS for the quantification of select TAG regioisomers. Thus, all experimental components are now in place, and the logistics have been worked out, to accomplish an improved parallel MD-LC separation. We will now be able to focus on remaking a silver column to obtain the better 2D(1) separation we previously accomplished, and change the 2D(2) gradient to increase the number of modulation periods on column to improve the 2D(2) separation.

Supplementary Materials

The following supporting information can be downloaded at: ’https://www.mdpi.com/article/10.3390/separations10120594/s1, Supplementary Materials-LC3MS3 of Pulse Lipids.pdf. Supplementary Table S1: Concentrations of fat-soluble vitamins (FSVs) and triacylglycerols (TAGs) in final calibration standard mixtures; Supplementary Table S2: Solvent gradient for the first dimension, 1D, of three dimensions of separation; Supplementary Table S3: Gradient program for first second dimension, 2D(1); Supplementary Table S4: Solvent program gradient for the second second dimension, 2D(2), UHPLC separation on a Ag+ ion column; Supplementary Table S5: Critical Ratio 2, or [AA]+/[AB]+, from triacylglycerol (TAG) regioisomer standards by electrospray ionization (ESI) high-resolution, accurate-mass (HRAM) mass spectrometry (MS); Supplementary Table S6: Quantification of regioisomers as %AAB based on Critical Ratio 2, [AA]+/[AB]+, for triacylglycerols (TAGs); Supplementary Figure S1: Structures of molecules having calculated m/z values of 324.2897 and 324.3261; Supplementary Figure S2: Critical Ratio 2 (CR2), [AA]+/[AB]+, of pulse triacylglycerols by electrospray ionization (ESI) high-resolution, accurate-mass (HRAM) mass spectrometry (MS).

Author Contributions

Conceptualization, W.C.B.; methodology, W.C.B.; software, W.C.B. and H.K.K.; validation, W.C.B. and H.K.K.; formal analysis, W.C.B. and H.K.K.; investigation, W.C.B. and H.K.K.; resources, W.C.B.; data curation, W.C.B.; writing—original draft preparation, W.C.B.; writing—review and editing, W.C.B. and H.K.K.; visualization, W.C.B.; supervision, W.C.B.; project administration, W.C.B.; funding acquisition, W.C.B. All authors have read and agreed to the published version of the manuscript.

Funding

This work was supported by the USDA Agricultural Research Service and received no external funding. Mention or use of specific products or brands do not represent or imply endorsement by the USDA.

Data Availability Statement

Data for this article will be available at Ag Data Commons, https://data.nal.usda.gov/ (accessed on 27 November 2023).

Acknowledgments

Market class pulses were obtained as ground samples from John Finley of Louisiana State University, through Dave Luthria and Raghavendhar Kotha.

Conflicts of Interest

The authors declare no conflict of interest.

References

  1. De Vos, J.; Stoll, D.; Buckenmaier, S.; Eeltink, S.; Grinias, J.P. Advances in ultra-high-pressure and multi-dimensional liquid chromatography instrumentation and workflows. Anal. Sci. Adv. 2021, 2, 171–192. [Google Scholar] [CrossRef]
  2. Cardoso, C.L.; de Moraes, M.C.; Cass, Q.B. The Versatility of Two-Dimensional Liquid Chromatography. J. Braz. Chem. Soc. 2023, 34, 1565–1580. [Google Scholar] [CrossRef]
  3. Caño-Carrillo, I.; Gilbert-López, B.; Montero, L.; Martínez-Piernas, A.B.; García-Reyes, J.F.; Molina-Díaz, A. Comprehensive and heart-cutting multidimensional liquid chromatography-mass spectrometry and its applications in food analysis. Mass Spectrom. Rev. 2023. [Google Scholar] [CrossRef]
  4. Montero, L.; Herrero, M. Two-dimensional liquid chromatography approaches for food authenticity. Curr. Opin. Food Sci. 2023, 51, 101041. [Google Scholar] [CrossRef]
  5. Papatheocharidou, C.; Samanidou, V. Two-Dimensional High-Performance Liquid Chromatography as a Powerful Tool for Bioanalysis: The Paradigm of Antibiotics. Molecules 2023, 28, 5056. [Google Scholar] [CrossRef] [PubMed]
  6. van den Hurk, R.S.; Pursch, M.; Stoll, D.R.; Pirok, B.W.J. Recent trends in two-dimensional liquid chromatography. TrAC—Trends Anal. Chem. 2023, 166, 117166. [Google Scholar] [CrossRef]
  7. Foster, S.W.; Parker, D.; Kurre, S.; Boughton, J.; Stoll, D.R.; Grinias, J.P. A review of two-dimensional liquid chromatography approaches using parallel column arrays in the second dimension. Anal. Chim. Acta 2022, 1228, 340300. [Google Scholar] [CrossRef] [PubMed]
  8. Lv, W.; Shi, X.; Wang, S.; Xu, G. Multidimensional liquid chromatography-mass spectrometry for metabolomic and lipidomic analyses. TrAC—Trends Anal. Chem. 2019, 120, 115302. [Google Scholar] [CrossRef]
  9. Duong, V.-A.; Park, J.-M.; Lee, H. Review of three-dimensional liquid chromatography platforms for bottom-up proteomics. Int. J. Mol. Sci. 2020, 21, 1524. [Google Scholar] [CrossRef] [PubMed]
  10. Abdulhussain, N.; Nawada, S.; Schoenmakers, P. Latest Trends on the Future of Three-Dimensional Separations in Chromatography. Chem. Rev. 2021, 121, 12016–12034. [Google Scholar] [CrossRef]
  11. Cacciola, F.; Dugo, P.; Mondello, L. Multidimensional liquid chromatography in food analysis. TrAC—Trends Anal. Chem. 2017, 96, 116–123. [Google Scholar] [CrossRef]
  12. Wu, Z.; Schoenmakers, P.; Marriott, P.J. Nomenclature and Conventions in Comprehensive Multidimensional Chromatography—An Update. LCGC Eur. 2012, 25, 272–275. [Google Scholar]
  13. Washburn, M.P.; Wolters, D.; Yates, J.R. Large-scale analysis of the yeast proteome by multidimensional protein identification technology. Nat. Biotechnol. 2001, 19, 242–247. [Google Scholar] [CrossRef] [PubMed]
  14. Moore, A.W.; Jorgenson, J.W. Comprehensive Three-Dimensional Separation of Peptides Using Size Exclusion Chromatography/Reversed Phase Liquid Chromatography/Optically Gated Capillary Zone Electrophoresis. Anal. Chem. 1995, 67, 3456–3463. [Google Scholar] [CrossRef] [PubMed]
  15. Fairchild, J.N.; Horváth, K.; Guiochon, G. Theoretical advantages and drawbacks of on-line, multidimensional liquid chromatography using multiple columns operated in parallel. J. Chromatogr. A 2009, 1216, 6210–6217. [Google Scholar] [CrossRef]
  16. Opiteck, G.J.; Ramirez, S.M.; Jorgenson, J.W.; Moseley, M.A., III. Comprehensive two-dimensional high-performance liquid chromatography for the isolation of overexpressed proteins and proteome mapping. Anal. Biochem. 1998, 258, 349–361. [Google Scholar] [CrossRef]
  17. Wagner, K.; Racaityte, K.; Unger, K.K.; Miliotis, T.; Edholm, L.E.; Bischoff, R.; Marko-Varga, G. Protein mapping by two-dimensional high performance liquid chromatography. J. Chromatogr. A 2000, 893, 293–305. [Google Scholar] [CrossRef]
  18. Venkatramani, C.J.; Zelechonok, Y. An automated orthogonal two-dimensional liquid chromatograph. Anal. Chem. 2003, 75, 3484–3494. [Google Scholar] [CrossRef]
  19. Wang, H.; Lhotka, H.R.; Bennett, R.; Potapenko, M.; Pickens, C.J.; Mann, B.F.; Haidar Ahmad, I.A.; Regalado, E.L. Introducing online multicolumn two-dimensional liquid chromatography screening for facile selection of stationary and mobile phase conditions in both dimensions. J. Chromatogr. A 2020, 1622, 460895. [Google Scholar] [CrossRef]
  20. Byrdwell, W.C.; Kotapati, H.K.; Goldschmidt, R.; Jakubec, P.; Nováková, L. Three-dimensional liquid chromatography with parallel second dimensions and quadruple parallel mass spectrometry for adult/infant formula analysis. J. Chromatogr. A 2022, 1661, 462682. [Google Scholar] [CrossRef]
  21. Themelis, T.; Amini, A.; De Vos, J.; Eeltink, S. Towards spatial comprehensive three-dimensional liquid chromatography: A tutorial review. Anal. Chim. Acta 2021, 1148, 238157. [Google Scholar] [CrossRef] [PubMed]
  22. Stoll, D.R.; Carr, P.W. Two-Dimensional Liquid Chromatography: A State of the Art Tutorial. Anal. Chem. 2017, 89, 519–531. [Google Scholar] [CrossRef]
  23. Byrdwell, W.C. Breaking the rules: Two- and three-dimensional liquid chromatography with four dimensions of mass spectrometry. Curr. Trends Mass Spectrom. 2021, 19, 6–11. [Google Scholar]
  24. Byrdwell, W.C. Comprehensive Dual Liquid Chromatography with Quadruple Mass Spectrometry (LC1MS2 × LC1MS2 = LC2MS4) for Analysis of Parinari Curatellifolia and Other Seed Oil Triacylglycerols. Anal. Chem. 2017, 89, 10537–10546. [Google Scholar] [CrossRef]
  25. Pól, J.; Kivilompolo, M.; Hyötyläinen, T. Comprehensive two-dimensional liquid chromatography (LC × LC): A review. LCGC Eur. 2011, 24, 232–243. [Google Scholar]
  26. Gritti, F.; Besner, S.; Cormier, S.; Gilar, M. Applications of high-resolution recycling liquid chromatography: From small to large molecules. J. Chromatogr. A 2017, 1524, 108–120. [Google Scholar] [CrossRef] [PubMed]
  27. Aly, A.A.; Muller, M.; de Villiers, A.; Pirok, B.W.J.; Górecki, T. Parallel gradients in comprehensive multidimensional liquid chromatography enhance utilization of the separation space and the degree of orthogonality when the separation mechanisms are correlated. J. Chromatogr. A 2020, 1628, 461452. [Google Scholar] [CrossRef]
  28. Byrdwell, W.C. Dual parallel mass spectrometers for analysis of sphingolipid, glycerophospholipid and plasmalogen molecular species. Rapid Commun. Mass Spectrom. 1998, 12, 256–272. [Google Scholar] [CrossRef]
  29. Byrdwell, W.C. “Dilute-and-shoot” triple parallel mass spectrometry method for analysis of vitamin D and triacylglycerols in dietary supplements. Anal. Bioanal. Chem. 2011, 401, 3317–3334. [Google Scholar] [CrossRef]
  30. Byrdwell, W.C. Quadruple parallel mass spectrometry for analysis of vitamin D and triacylglycerols in a dietary supplement. J. Chromatogr. A 2013, 1320, 48–65. [Google Scholar] [CrossRef]
  31. Byrdwell, W.C.; Kotapati, H.K.; Goldschmidt, R. Fast chromatography of pulse triacylglycerols. J. Am. Oil Chem. Soc. 2022, 100, 25–43. [Google Scholar] [CrossRef]
  32. United Nations Food and Agriculture Organization; World Health Organization. Standard for certain pulses. Codex Aliment. 1989, CXS 171-1989. [Google Scholar]
  33. Hall, C.; Hillen, C.; Robinson, J.G. Composition, nutritional value, and health benefits of pulses. Cereal Chem. 2017, 94, 11–31. [Google Scholar] [CrossRef]
  34. Kotha, R.R.; Finley, J.W.; Luthria, D.L. Determination of Soluble Mono, Di, and Oligosaccharide Content in 23 Dry Beans (Phaseolus vulgaris L.). J. Agric. Food Chem. 2020, 68, 6412–6419. [Google Scholar] [CrossRef]
  35. Folch, J.; Lees, M.; Sloane-Stanley, G.H. A simple method for the isolation and purification of total lipides from animal tissue. J. Biol. Chem. 1957, 226, 497–509. [Google Scholar] [CrossRef] [PubMed]
  36. Byrdwell, W.C. A note on the use of workstation software programs for quantification. J. Liq. Chromatogr. Relat. Technol. 2019, 42, 570–574. [Google Scholar] [CrossRef]
  37. Byrdwell, W.C.; Emken, E.A. Analysis of triglycerides using atmospheric pressure chemical ionization mass spectrometry. Lipids 1995, 30, 173–175. [Google Scholar] [CrossRef]
  38. Byrdwell, W.C. Critical Ratios for structural analysis of triacylglycerols using mass spectrometry. Lipid Technol. 2015, 27, 258–261. [Google Scholar] [CrossRef]
  39. Byrdwell, W.C. The bottom-up solution to the triacylglycerol lipidome using atmospheric pressure chemical ionization mass spectrometry. Lipids 2005, 40, 383–417. [Google Scholar] [CrossRef]
  40. Byrdwell, W.C. The Updated Bottom Up Solution applied to mass spectrometry of soybean oil in a dietary supplement gelcap. Anal. Bioanal. Chem. 2015, 407, 5143–5160. [Google Scholar] [CrossRef]
  41. Mottram, H.R.; Evershed, R.P. Structure analysis of triacylglycerol positional isomers using atmospheric pressure chemical ionisation mass spectrometry. Tetrahedron Lett. 1996, 37, 8593–8596. [Google Scholar] [CrossRef]
  42. Laakso, P.; Voutilainen, P. Analysis of triacylglycerols by silver-ion high-performance liquid chromatography-atmospheric pressure chemical ionization mass spectrometry. Lipids 1996, 31, 1311–1322. [Google Scholar] [CrossRef]
  43. Byrdwell, W.C. Qualitative and Quantitative Analysis of Triacylglycerols by Atmospheric Pressure Ionization (APCI and ESI) Mass Spectrometry Techniques. In Modern Methods for Lipid Analysis by Liquid Chromatography/Mass Spectrometry and Related Techniques; Byrdwell, W.C., Ed.; AOCS Press: Champaign, IL, USA, 2005; pp. 298–412. ISBN 1-893997-75-8. [Google Scholar]
  44. Morris, L.J. Separations of lipids by silver ion chromatography. J. Lipid Res. 1966, 7, 717–732. [Google Scholar] [CrossRef]
  45. Dobson, G.; Christie, W.W.; Nikolova-Damyanova, B. Silver ion chromatography of lipids and fatty acids. J. Chromatogr. B Biomed. Sci. Appl. 1995, 671, 197–222. [Google Scholar] [CrossRef]
  46. Holčapek, M.; Lísa, M. Silver-Ion Liquid Chromatography—Mass Spectrometry. In Handbook of Advanced Chromatography/Mass Spectrometry Techniques; Holčapek, M., Byrdwell, W.C., Eds.; Elsevier/AOCS Press: Champaign, IL, USA, 2017; pp. 115–140. ISBN 978-0-12-811732-3. [Google Scholar]
  47. Byrdwell, W.C.; Emken, E.A.; Neff, W.E.; Adlof, R.O. Quantitative analysis of triglycerides using atmospheric pressure chemical ionization-mass spectrometry. Lipids 1996, 31, 919–935. [Google Scholar] [CrossRef] [PubMed]
  48. Byrdwell, W.C.; Neff, W.E.; List, G.R. Triacylglycerol analysis of potenial margarine base stocks by high-performance liquid chromatography with atmospheric pressure chemical ionization mass spectrometry and, flame ionization detection. J. Agric. Food Chem. 2001, 49, 446–457. [Google Scholar] [CrossRef] [PubMed]
  49. Byrdwell, W.C. The Updated Bottom Up Solution Applied to Atmospheric Pressure Photoionization and Electrospray Ionization Mass Spectrometry. JAOCS J. Am. Oil Chem. Soc. 2015, 92, 1533–1547. [Google Scholar] [CrossRef]
  50. Holčapek, M.; Dvorakova, H.; Lísa, M.; Giron, A.J.; Sandra, P.; Cvacka, J. Regioisomeric analysis of triacylglycerols using silver-ion liquid chromatography-atmospheric pressure chemical ionization mass spectrometry: Comparison of five different mass analyzers. J. Chromatogr. A 2010, 1217, 8186–8194. [Google Scholar] [CrossRef]
  51. Liu, Q.; Xiao, J.; Yu, J.; Xie, Y.; Chen, X.; Yang, H. Improved enantioseparation via the twin-column based recycling high performance liquid chromatography. J. Chromatogr. A 2014, 1363, 236–241. [Google Scholar] [CrossRef]
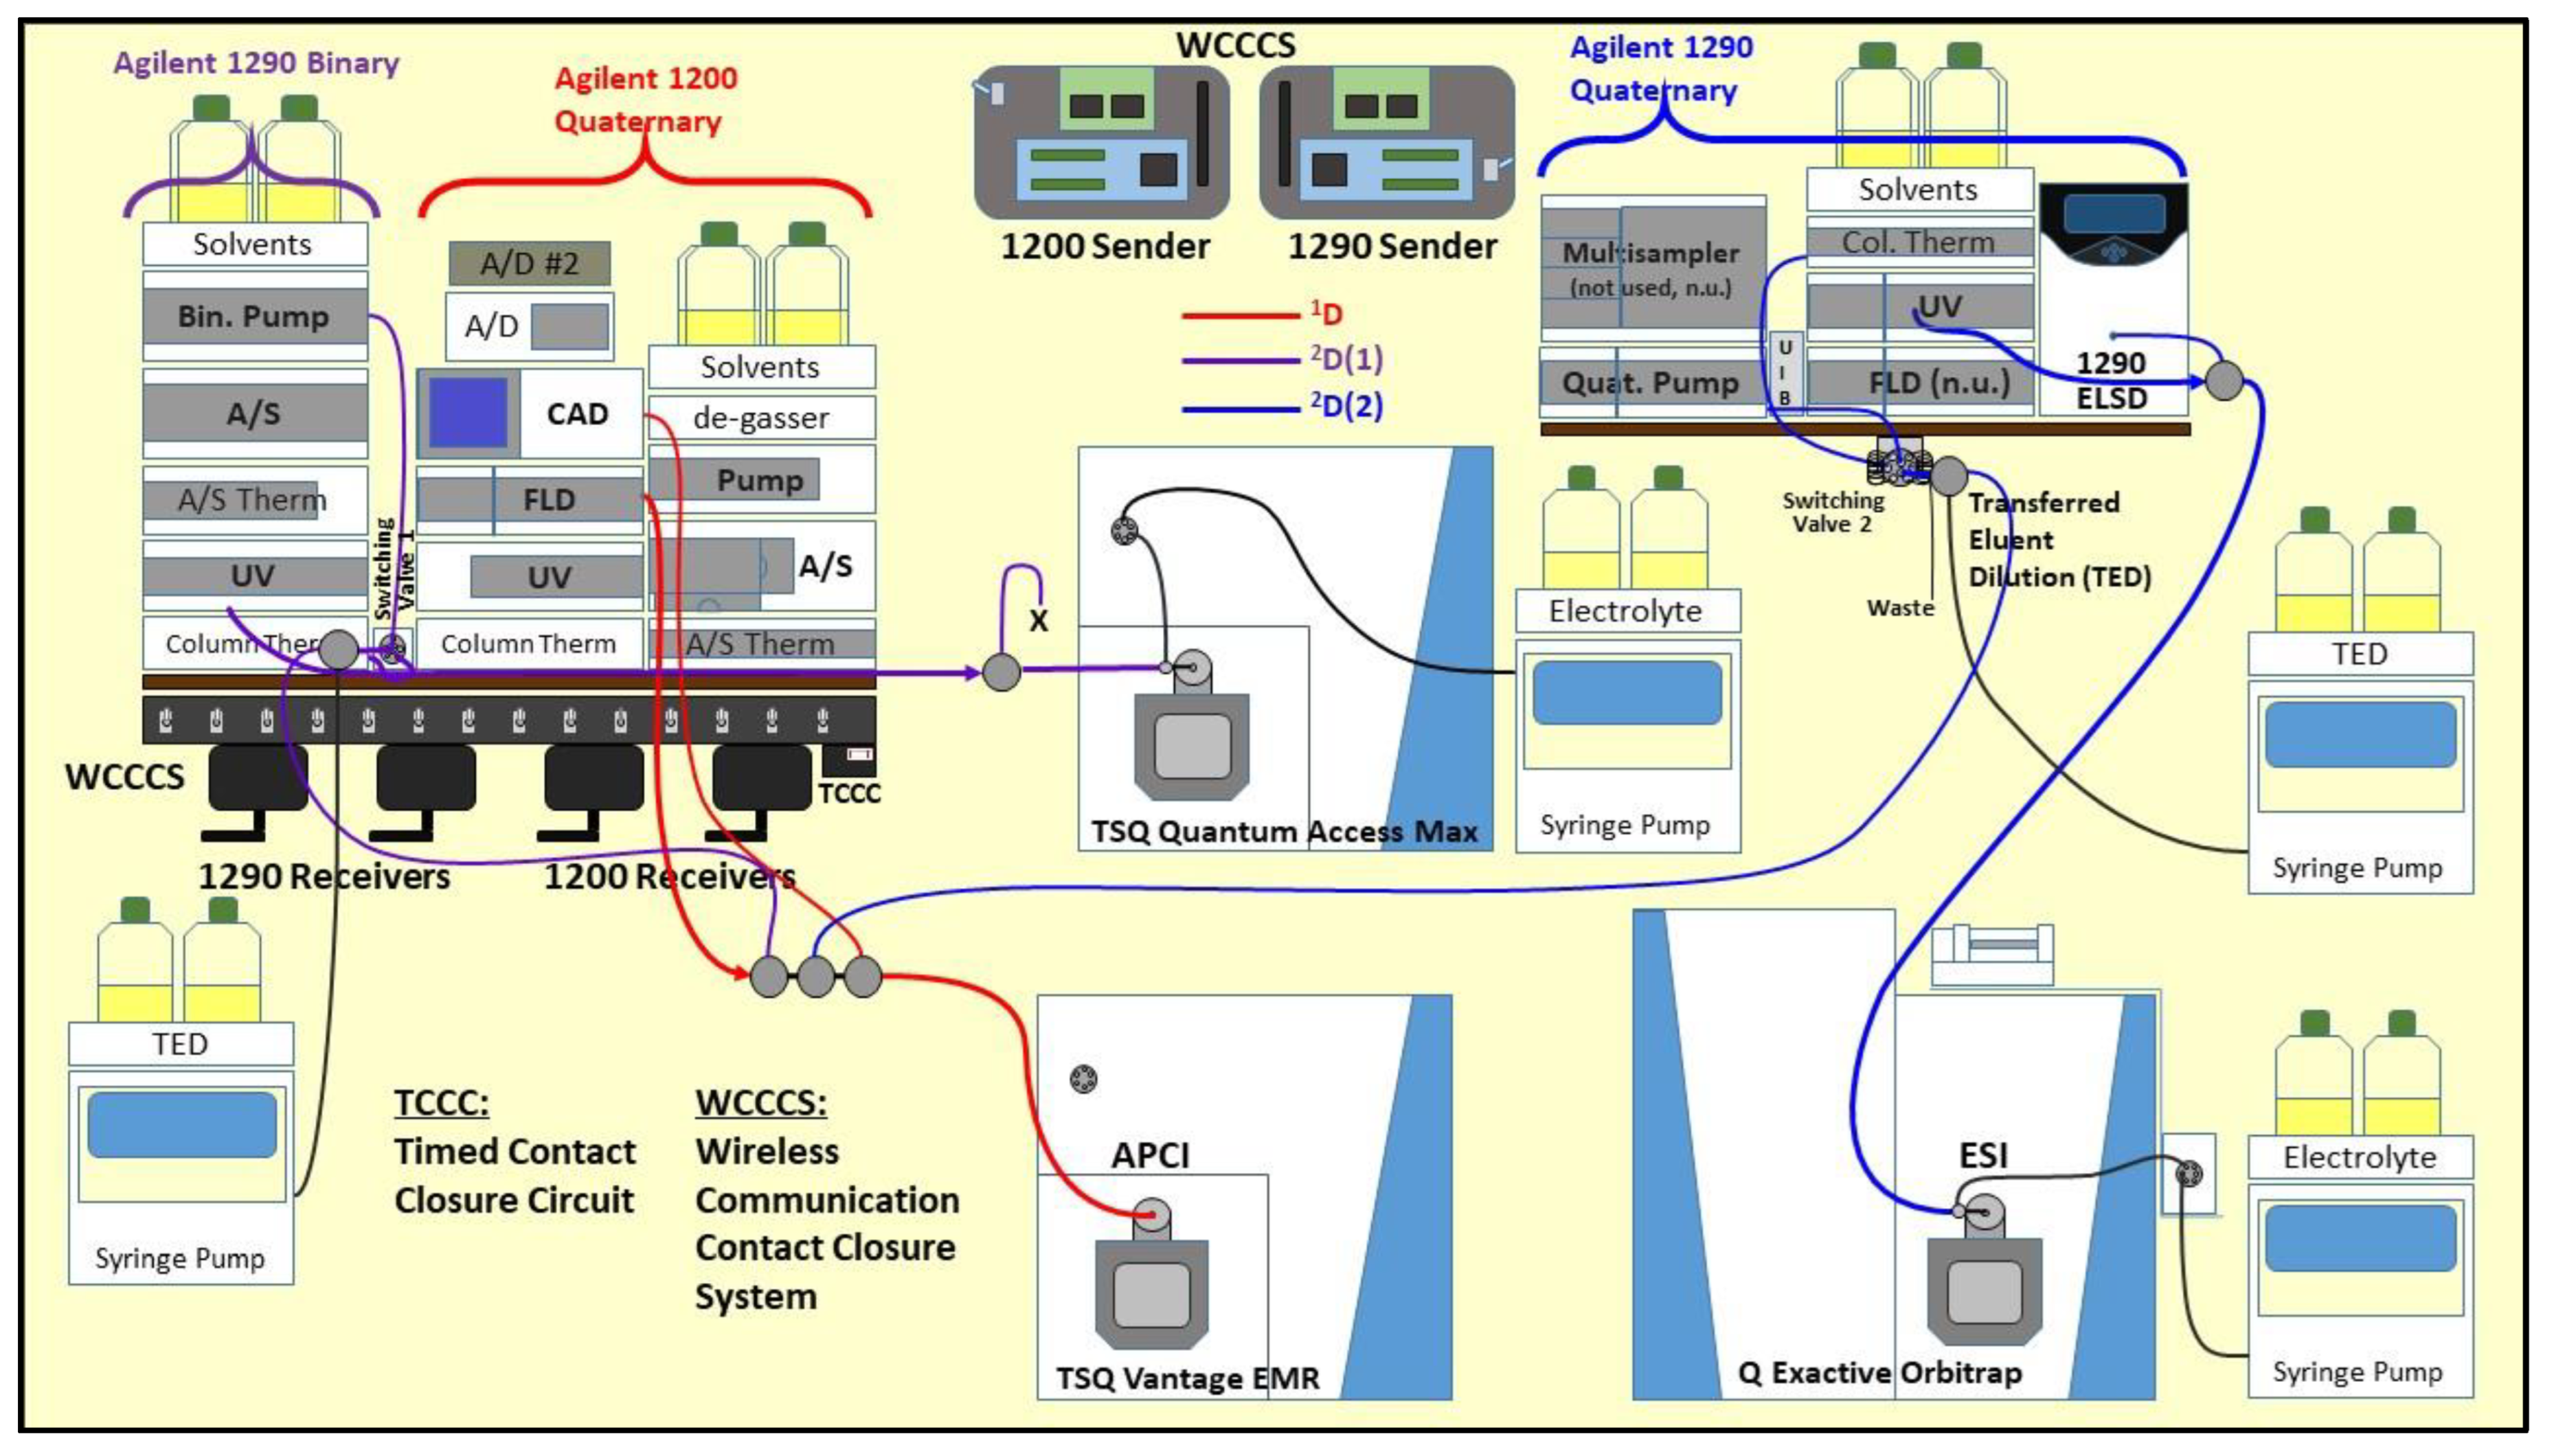
Figure 1. Arrangement of instruments for three-dimensional liquid chromatography with parallel second dimensions and triple parallel mass spectrometry (LC3MS3). The first dimension, 1D, employed non-aqueous reversed-phase (NARP) HPLC on two C18 columns in series. The first second dimension, 2D(1), was separated on a silver-ion (Ag+) chromatography column. The second second dimension, 2D(2), used NARP-UHPLC on a C30 column with multi-cycle elution.
Separations 10 00594 g001
Figure 2. Solvent gradient programs for three dimensions of liquid chromatography (LC). (A) The first dimension, 1D, was non-aqueous reversed-phase (NARP) 2 × C18 HPLC with methanol (MeOH) and dichloromethane (DCM). (B) The first second dimension, 2D(1), was Ag-ion UHPLC using %ACN in MeOH. (C) The second second dimension, 2D(2), was parallel NARP-UHPLC with flow rate programming on a C30 column.
Separations 10 00594 g002
Figure 3. 1D chromatograms and APCI-MS mass spectra of triacylglycerol (TAG) and fat-soluble vitamin standards. (A) Total ion current chromatogram (TIC); (B) full-scan filtered TIC; (C) extracted ion chromatogram (EIC) of TAG standards; (D) EIC of vitamin K2 (menaquinone) analytical internal standard (AIS); (E) average mass spectrum across first peak, trienanthin (EnEnEn, where En = C7:0), at 8.53 min; and (F) average mass spectrum across last peak, trinonadecanoin (NoNoNo, where No = C19:0). Saturated TAGs produced no [M + H]+, but exclusively diacyl-like fragments, [DAG]+.
Separations 10 00594 g003
Figure 4. 1D chromatograms and APCI-MS mass spectra of triacylglycerols (TAG) in baby lima beans. (A) Total ion current chromatogram (TIC); (B) full-scan filtered TIC; (C) extracted ion chromatogram (EIC) of TAG standards; (D) EIC of the top 10 TAGs (9 masses) listed in Table 1; (E) average mass spectrum across LnLnL peak, 18:2/18:3/18:3, at 25.11 min; and (F) average mass spectrum across LLP peak, 18:2/18:2/16:0, at 34.19 min. Raw data shown with no baseline subtraction, smoothing, or other operations applied.
Separations 10 00594 g004
Figure 5. 1D chromatograms and APCI-MS mass spectra of triacylglycerols (TAG) in black beans. (A) Total ion current chromatogram (TIC); (B) full-scan filtered TIC; (C) extracted ion chromatogram (EIC) of the diacylglycerol-like fragment at m/z 599.5, [LL]+ = [OLn]+; (D) EIC of the top 10 TAGs (9 masses) listed in Table 1; (E) average mass spectrum across LLLn peak, 18:2/18:2/18:3, at 27.58 min; and (F) average mass spectrum across LnLnO peak, 18:3/18:3/18:1, at 28.13 min. Raw data shown with no baseline subtraction, smoothing, or other operations applied.
Separations 10 00594 g005
Figure 6. First second dimension, 2D(1), separation of a black bean lipid extract on a 100 mm × 2.1 mm Ag+-ion column with methanol/acetonitrile mobile phase. 2D(1) modulation time of 1.91 min, or 114.6 s. Gradient program is provided in Supplementary Table S2.
Separations 10 00594 g006
Figure 7. First second dimension, 2D(1), separation of a baby lima bean lipid extract on a 100 mm × 2.1 mm Ag+-ion column with methanol/acetonitrile mobile phase, for which the gradient program is given in Supplementary Table S2.
Separations 10 00594 g007
Figure 8. Second second dimension, 2D(2), separation of triacylglycerol (TAG) standards using multi-cycle elution on a C30 UHPLC column.
Separations 10 00594 g008
Figure 9. Second second dimension, 2D(2), separation of black beans on C30 UHPLC column.
Separations 10 00594 g009
Figure 10. Percent relative composition of the top 30 most abundant pulse triacylglycerols (TAGs) determined using ESI-HRAM-MS in the 2D(2), sorted by the amount of LnLLn, from left to right.
Separations 10 00594 g010
Figure 11. Principle component analysis (PCA) score plot for pulse triacylglycerols determined using ESI-HRAM-MS in the 2D(2). Ovals added to highlight clusters with colors matching Figure 10.
Separations 10 00594 g011
Figure 12. Critical Ratio 2 (CR2), [AA]+/[AB]+, of pulse triacylglycerols by (A) electrospray ionization (ESI) high-resolution, accurate-mass (HRAM) mass spectrometry (MS) in the 2D(2) and (B) atmospheric pressure chemical ionization (APCI) MS in the 1D compared to previous atmospheric pressure photoionization (APPI) MS [31]. CR2 for ODhO/OODh is not shown for fast LC APPI-MS data. Fatty acid abbreviations are provided in Materials and Methods.
Separations 10 00594 g012
Table 2. Percent relative composition of polar lipids.
Lipid Ion aRT
Min b
Black
Bean
Black-Eyed
Pea
Butter
Bean
Cran-
Berry
Bean
Gar-
Banzo
Bean
Green
Split
LentilsLima
Bean
Navy
Bean
Pinto
Bean
C20H37NO2 + H8.610.000.050.000.380.060.000.050.3915.280.04
Cer(d18:1/16:0) + Na15.100.000.000.000.020.000.000.000.005.060.00
Cer(d18:0/18:2) + Na15.030.000.000.000.060.000.000.000.056.660.00
Cer(d18:1/18:2) + Na12.970.000.000.000.130.000.000.000.0710.930.00
Cer(d18:1/18:3) + Na12.820.000.000.000.060.000.000.000.004.960.00
Cer(d18:1/18:3) + H15.100.000.000.000.000.000.000.000.005.060.00
DGDG(18:2/18:2) + NH411.060.380.060.060.310.170.810.140.060.760.14
DGDG(18:2/18:3) + NH410.880.280.140.080.290.050.620.160.020.720.21
DGDG(18:3/18:3) + NH410.750.830.310.260.750.000.290.100.133.160.77
LPC(16:0) + H10.381.841.980.185.930.770.530.583.048.502.75
LPC(18:1) + H10.382.700.340.033.502.871.551.650.503.861.11
LPC(18:2) + H10.322.603.490.408.383.852.412.566.677.383.42
LPC(18:3) + H9.331.891.310.106.330.080.150.411.374.053.90
LPE(16:0) + H13.120.500.330.061.000.080.130.070.742.410.56
MGDG(18:1/18:3) + NH412.990.220.040.260.250.020.140.020.000.730.07
MGDG(18:2/18:3) + NH412.810.090.050.220.150.000.020.000.000.440.06
MGDG(18:3/18:3) + NH410.840.240.140.980.320.000.020.000.031.600.23
PC(16:0/18:1) + H18.8217.733.822.4210.6216.3512.3710.802.713.166.36
PC(16:0/18:2) + H17.9120.2734.4937.5015.8127.7127.6818.9941.556.8025.44
PC(16:1/18:2) + H16.329.518.045.009.350.530.591.824.811.6114.16
PC(18:0/18:1) + H19.880.260.080.060.070.381.660.190.000.000.09
PC(18:0/18:2) + H18.8310.043.043.434.0017.8918.6311.263.621.462.37
PC (36:4)16.0316.0725.2926.3914.1224.0524.5038.5619.932.6416.65
PC (36:5)15.149.7012.6210.5314.601.871.739.749.432.1915.45
PC (36:6)14.271.611.060.522.500.000.080.220.800.215.11
PE(16:0/18:2) + H20.342.562.989.290.651.402.741.253.440.380.73
PE(18:1/18:2) + H19.520.230.030.120.060.911.030.370.000.000.08
PE(18:2/18:2) + H18.920.450.302.140.360.992.331.050.610.000.29
Sum 100.00100.00100.00100.00100.00100.00100.00100.00100.00100.00
a Polar lipid class abbreviations are as follows. AEA: alkylethylamine (linoleoyl ethanolamide); Cer: ceramide; DGDG: digalactosyl diacylglycerol; LPC: lyso-phosphatidylcholine; LPE: lyso-phosphatidylethanolamine; MGDG: monogalactosyl diacylglycerol; PC: phosphatidylcholine; and PE: phosphatidylethanolamine. b Average retention time across all pulse samples.
Disclaimer/Publisher’s Note: The statements, opinions and data contained in all publications are solely those of the individual author(s) and contributor(s) and not of MDPI and/or the editor(s). MDPI and/or the editor(s) disclaim responsibility for any injury to people or property resulting from any ideas, methods, instructions or products referred to in the content.