Article

Qualitative/Quantitative Analysis of Alcohol and Licit/Illicit Drugs on Post-Mortem Biological Samples from Road Traffic Deaths

Forensic Toxicology Unit, Department of Experimental Medicine, University of Campania “Luigi Vanvitelli”, via Luciano Armanni, 80138 Naples, Italy
*
Author to whom correspondence should be addressed.
Separations 2023, 10(12), 589; https://doi.org/10.3390/separations10120589
Submission received: 12 October 2023 / Revised: 23 November 2023 / Accepted: 28 November 2023 / Published: 1 December 2023
(This article belongs to the Section Forensics/Toxins)

Abstract

:
Alcohol and drug abuse is a major contributory factor of all road deaths in Europe. The aim of this study is to investigate the prevalence of alcohol and licit/illicit drug intake among victims of road accidents in Campania region (Italy). A retrospective analysis of road traffic deaths from 2013 to 2022 in Campania was performed. The toxicological results from fluid samples collected at autopsy were reviewed. In total, 228 road deaths occurred, mostly during nights and weekends. A total of 106 victims tested positive for alcohol and/or drugs, among which 39 (36.8%) tested positive for alcohol only, 27 (25.5%) for alcohol and drugs in association; and 40 (37.7%) for licit/illicit drugs only, either individually or in combination. Polydrug intake has been found in 21 victims, and nine in combination with alcohol. The most detected drugs were cocaine and Δ9THC, followed by benzodiazepines. Blood alcohol concentration (BAC) > 1.5 g/L was found in most alcohol positives, both alone and in association with drugs. Despite the penalties for driving under the influence of alcohol (DUI) and drugs (DUID), no decrease in the number of alcohol and/or drugs related fatal road accidents has been observed. DUI and/or DUID cases were approximately one third of the entire sample study.

1. Introduction

Road safety is a priority goal for most countries to improve public health and reduce high social costs related to deaths, injuries, and/or disabilities resulting from road traffic crashes [1]. Driving under the influence of alcohol (DUI) and licit/illicit drugs (DUID) is a well-known risk factor for road accidents [2,3,4,5]. The neuro-psychic, cognitive and behavioral alterations resulting from the intake of alcohol and/or illicit/licit substances are widely described in the literature [6,7,8,9,10,11,12,13,14,15,16,17,18]. Although legislations of several countries, including Italy, prescribe severe penalties for DUI and DUID, no real benefit seems to be obtained and no significant reduction in alcohol/drug-related road accidents has been reported [19].
According to the report of the World Health Organization (WHO) on road safety, about 1.35 million people die in road crashes each year, among which between 5% and 35% is related to alcohol consumption [20,21,22]. It is also estimated that the risk of fatal crash increase by 5 times if drug consumption is involved [20]. According to National Highway Traffic Safety Administration (NHGT), in USA, in 2021, 42,939 road crashes occurred in total, among which 13,384 (31%) were alcohol related. In the USA, over the 10-year period from 2012–2021, about 10,850 people died every year in drunk-driving crashes [23]. Similar trend has been reported by European Transport Safety Council (ETSC): in Europe, 19,823 people died because of road collisions in 2021, and around 25% of all road traffic deaths are estimated to be alcohol related [24]. This means that at least 10,000 people a year are killed in alcohol-related road accidents [25].
Based on the 2021 report of the National Institute for Statistics (ISTAT), 151.875 road accidents with 2.875 victims (+ 20% than 2020) occurred in Italy, 9.014 of which (+ 27.2% than 2020) reported in Campania [26]. Campania is the third most-populous Italian region, located on the Southern west coast of the country with a population of about 5.800.000 people. In Italy, articles 186 and 187 of the Italian road traffic law provide severe penalties for DUI and DUID resulting in death or serious injuries [27]. The aim of this study is to investigate the prevalence of alcohol and licit/illicit drugs consumption among victims who died after road traffic accidents occurred in Campania, and to provide detailed descriptions of the analytical procedures adopted for the standard toxicological analysis.

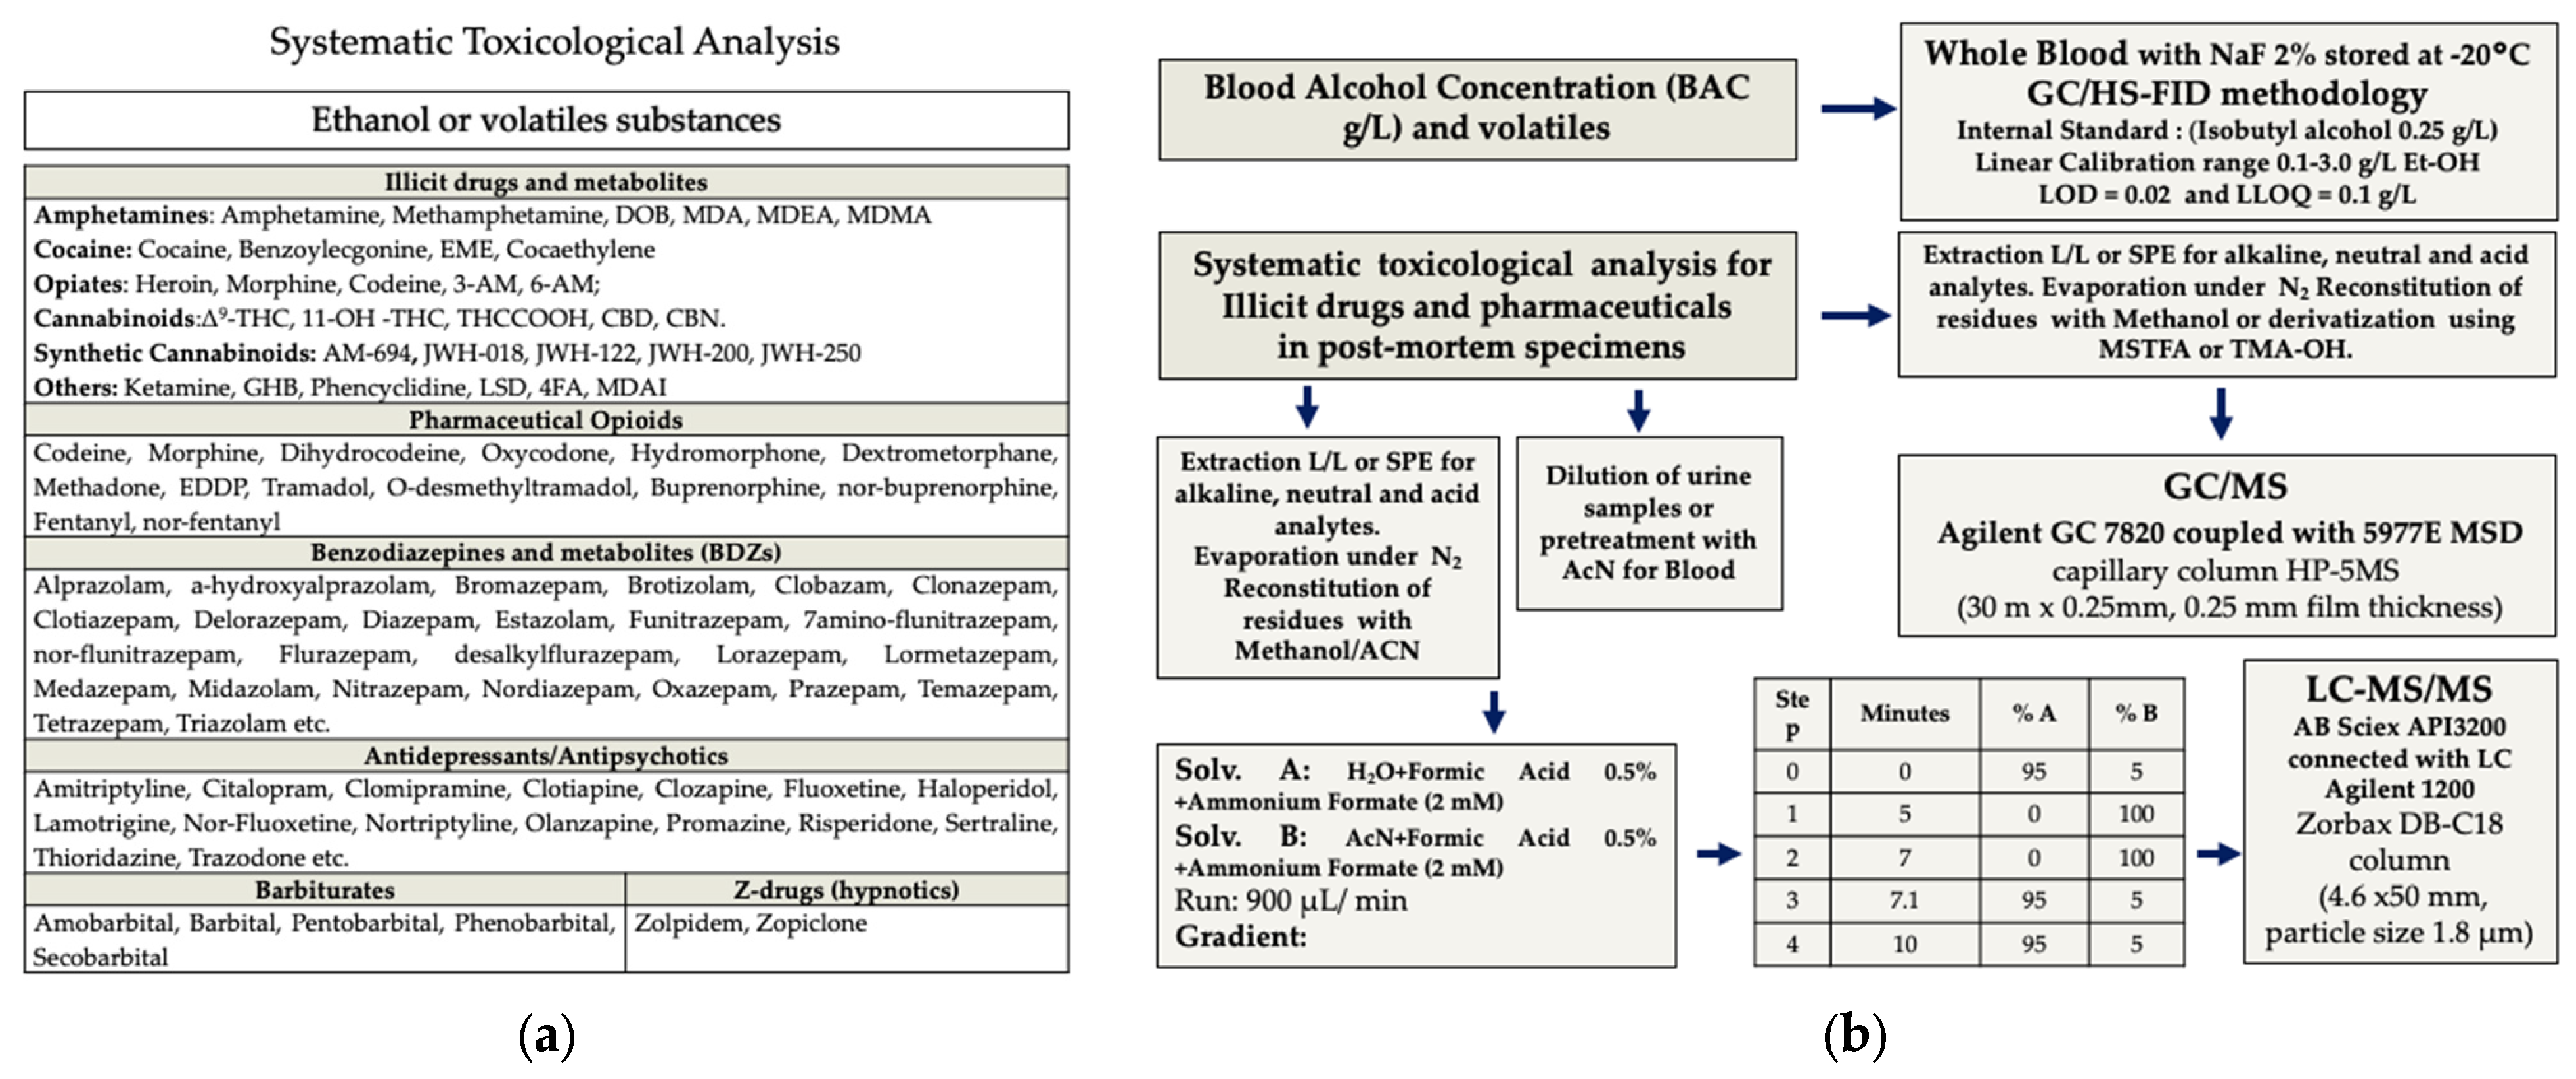
2. Materials and Methods

A retrospective analysis of deaths related to road traffic accidents over the past ten years, from 2013 to 2022, in the districts of Naples and Caserta (Campania Region, Italy) was performed. The toxicological results from fluid samples (blood and urine) collected at autopsy were reviewed. The toxicological analyses were carried out by the Forensic Toxicology Laboratory of University of Campania “Luigi Vanvitelli” in all road accidents causing deaths of drivers, vehicle occupants, and pedestrians.

2.1. Subjects

The victims were categorized by age, gender, toxicological results (alcohol and/or drugs positivity), period of road accident occurrence, cause, and time of death. Other factors that might have contributed to traffic accidents, like diseases or disabilities of victims and/or drivers, the use of smartphones while driving, or vehicle failures were not available in our dataset, and therefore not included in the study.
According to the time and days of the week, the road accidents were grouped in five interval periods as follows: weekdays (Mondays to Friday), weekends (Saturday and Sunday), mornings (08:00 a.m.–02:00 p.m.), afternoons (02:00 p.m.–08:00 p.m.), and night-time (08:00 p.m.–08:00 a.m.).

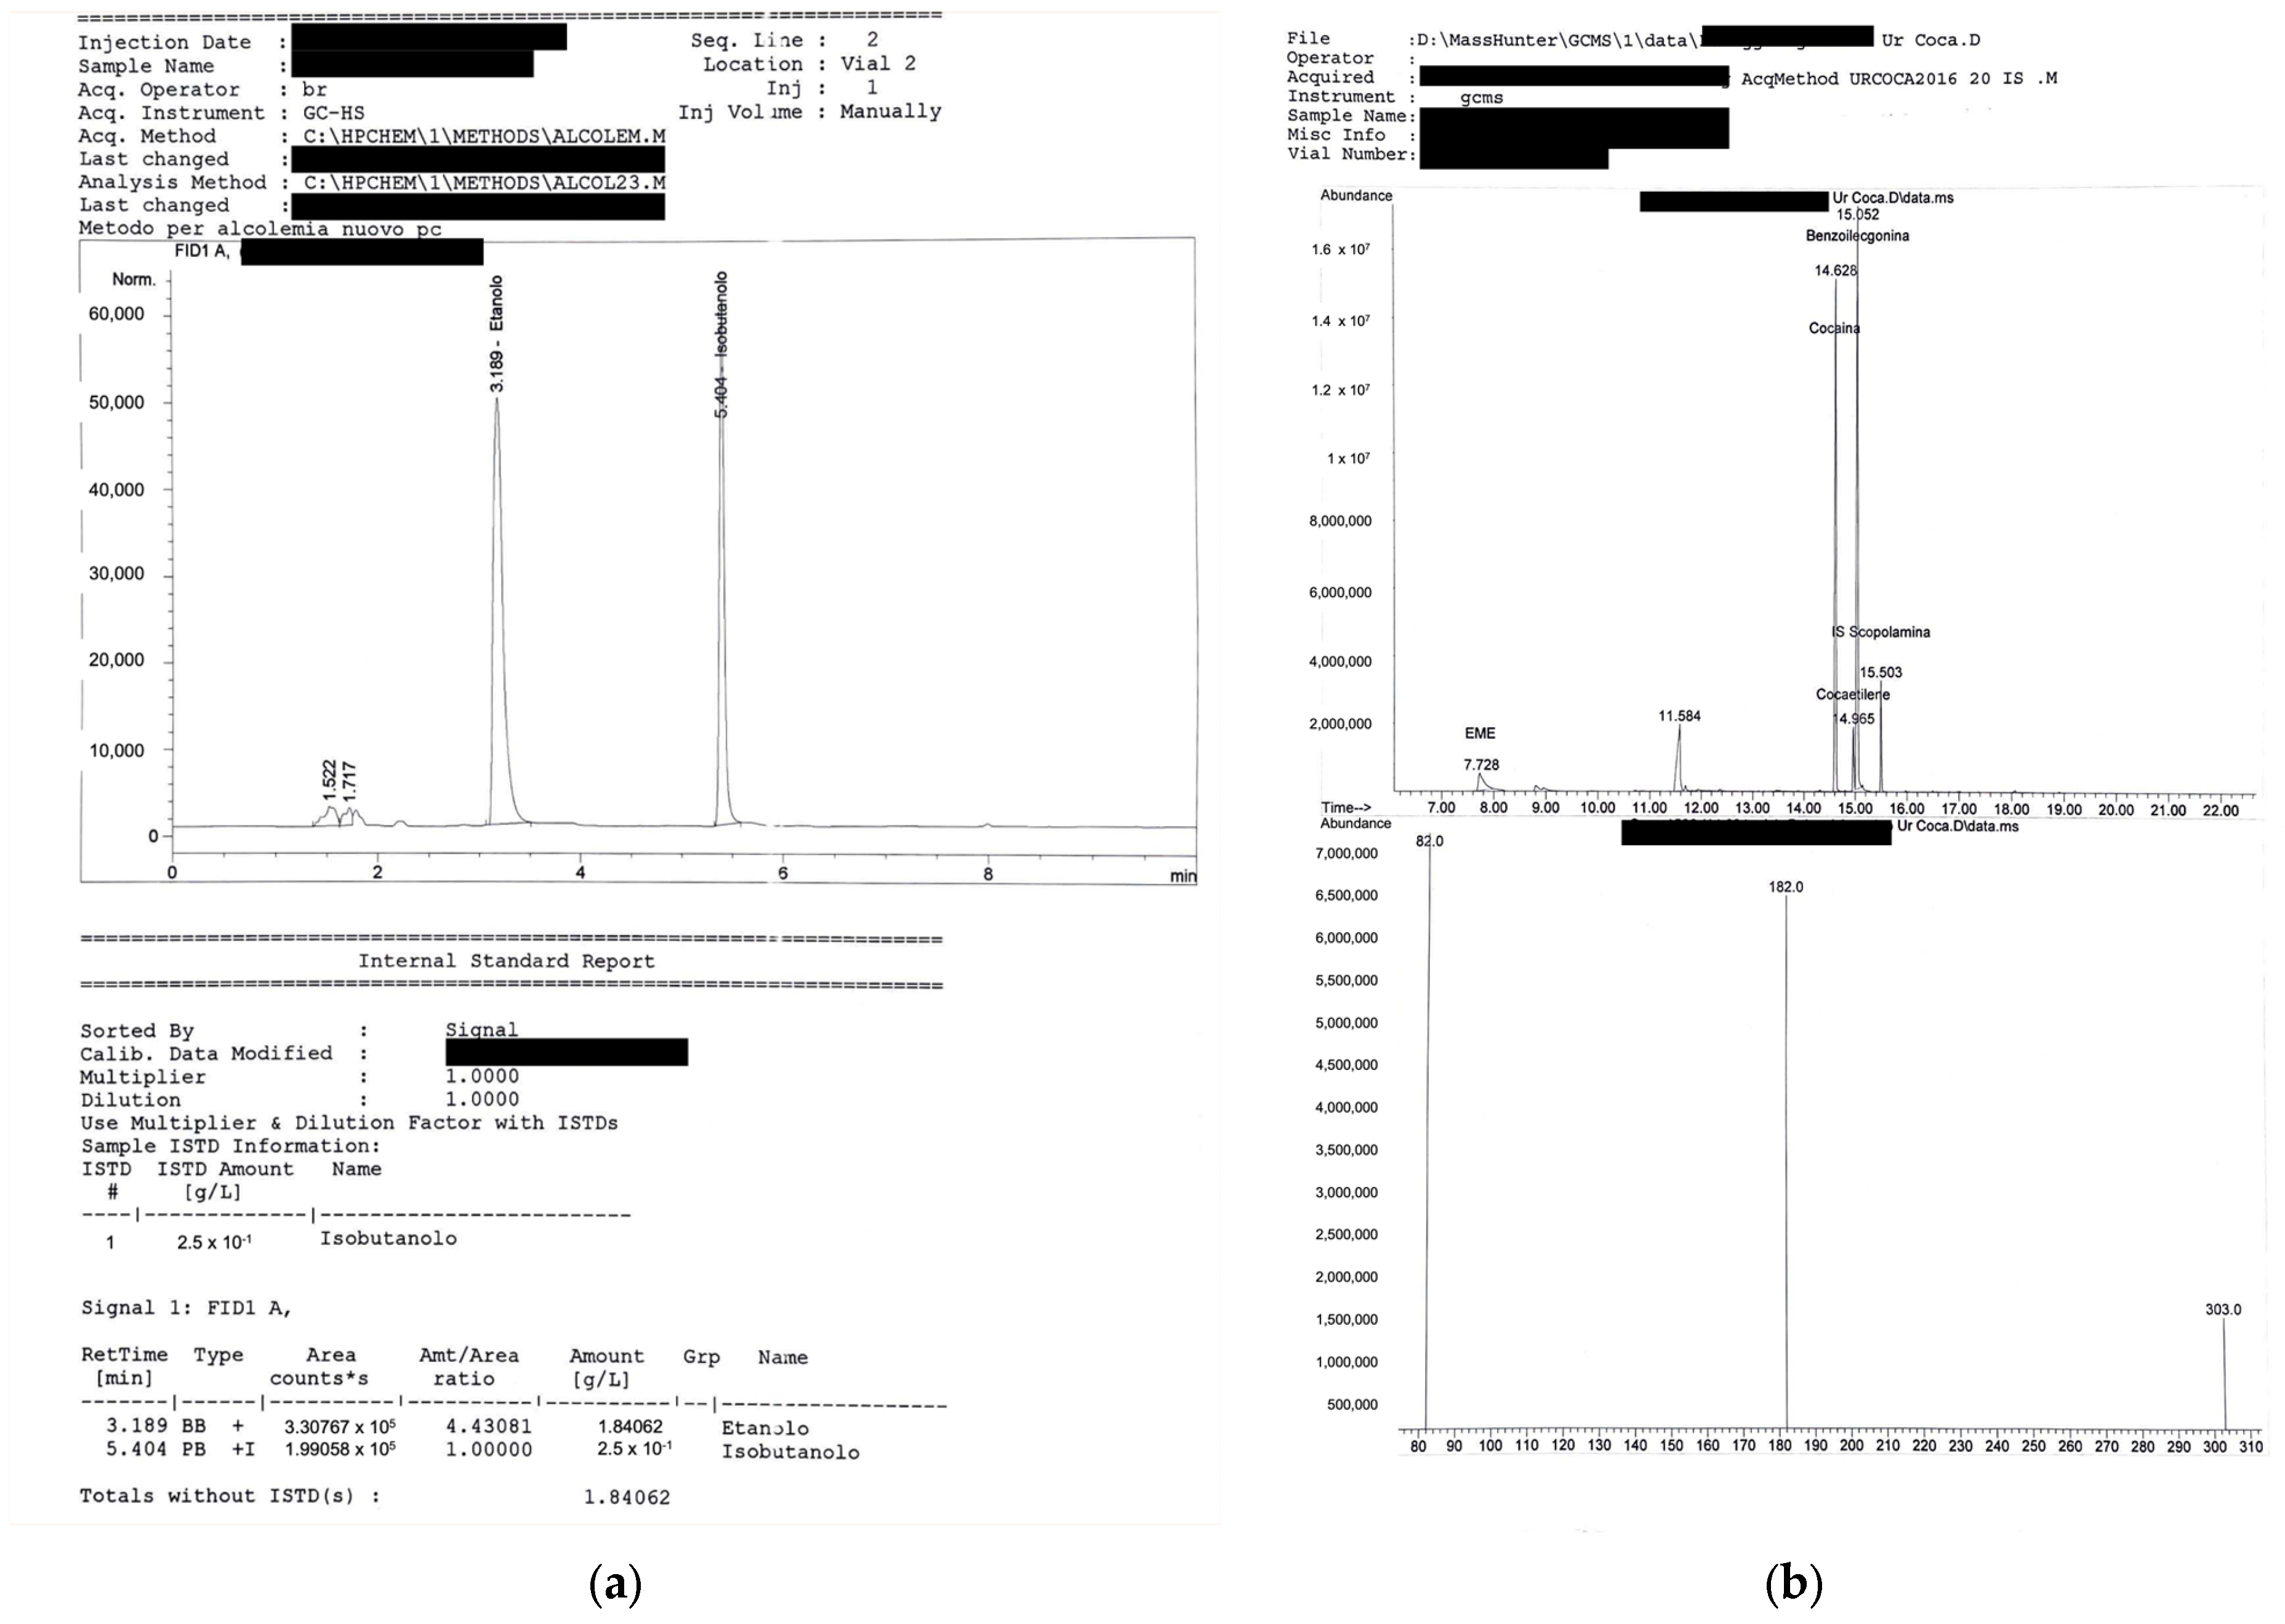
2.2. Sample Collection and Analytical Procedures

Sample collection was performed at autopsies using test tubes containing 2% Sodium Fluoride (NaF 2%) labelled with an identification code and then stored at −20° until processed in the Forensic toxicology laboratory, usually never later than 5 weeks.
Blood samples were taken from the femoral vein or the Inferior Vena Cava and, if possible, from the heart.
Head-space gas chromatography coupled with a flame ionization detector (HS/GC-FID) was applied to analyze blood alcohol concentration (BAC). Linear calibration was obtained for ethanol in the range 0.1–3.0 g/L. To detect BAC higher than 3.0 g/L, an appropriate dilution of samples was adopted during the pre-treatment.
To perform a systematic toxicological analysis, biological samples were treated with enzymatic hydrolysis and L/L or SPE extraction for different classes of licit and illicit drugs, under specific conditions for neutral, alkaline, and acid analytes, as shown in Figure 1a.
Prior evaporation under N2, residues of each extract were reconstituted in methanol or derivatized using MSTFA or TMA-OH in order to perform GC/MS. Gas Chromatography (GC/MS) was performed in SCAN/SIM mode using an Agilent GC7820 coupled with 5977EMSD (Agilent, Santa Clara, CA, USA) equipped with capillary column hp-5ms (K&W Scientific—30 × 0.25 mm, 0.25 mm film thickness).
LC-MS/MS analyses were performed by a triple quadrupole mass spectrometer (ABSciex 3200, Carlsbad, CA, USA) associated with a Liquid Chromatography Agilent 1200 equipped with Zorbax DB-C18 column (4.6 × 50 mm, particle size 1.8 mm).
A gradient of two different mobile phases (0.5% formic acid/2 mM ammonium formate buffer in water, and 0.5% formic acid/2 mM ammonium formate buffer in acetonitrile) was used to perform Chromatographic separation. The gradient program began with 5% B at 0–0.2 min, reaching 100% at 5 min, maintained until 7 min. The B content finally reverted to 5%. The total run time was 10 min with a 0.9 mL/min flow rate. The analytical procedures applied to analyze biological samples are summarized in Figure 1b.
Quantitative analyses were performed on positive urine and blood samples adopting certified standards and the corresponding deuterated compounds, as internal standard (I.S.) (Cerilliant-UK), applying the cut-off established by the Guidelines of the Italian Group of the Forensic Toxicologists (GTFI) [28,29]. All qualitative and quantitative GC–MS (SCAN/SIM) and LC/MS–MS (MRM Mode) methods were certified according to Peters et al. [30], and following the Recommendations of Guidance for the Bioanalytical Method Validation (FDA–USA) [31].
The monitoring of the analytical performances was entrusted to the external quality control program of the Society of Toxicological and Forensic Chemistry, Germany (GTFCh).
In Italy, the severity of penalties is related to BAC ranges detected. The legal limit of BAC is 0.5 g/L, while for job drivers and new drivers with a license for less than three years, a zero-tolerance policy is adopted, with the legal limit of BAC at 0 g/L. Therefore, according to Italian legislation for DUI, the BAC ranges detected were grouped as follows: <0.5 g/L, 0.51–0.8 g/L, 0.81–1.5 g/L, and >1.51 g/L.
Blood, urine, and bile samples were collected during the autopsies. Positive alcohol and/or drug tests were interpreted in accordance with the circumstantial information.

2.3. Statistical Analysis

In order to assess whether there was a significant or directional trend in our data over time, the Cochran–Armitage test was used. To determine any significant difference (p < 0.005) among groups, the Fisher exact test was applied.

3. Results

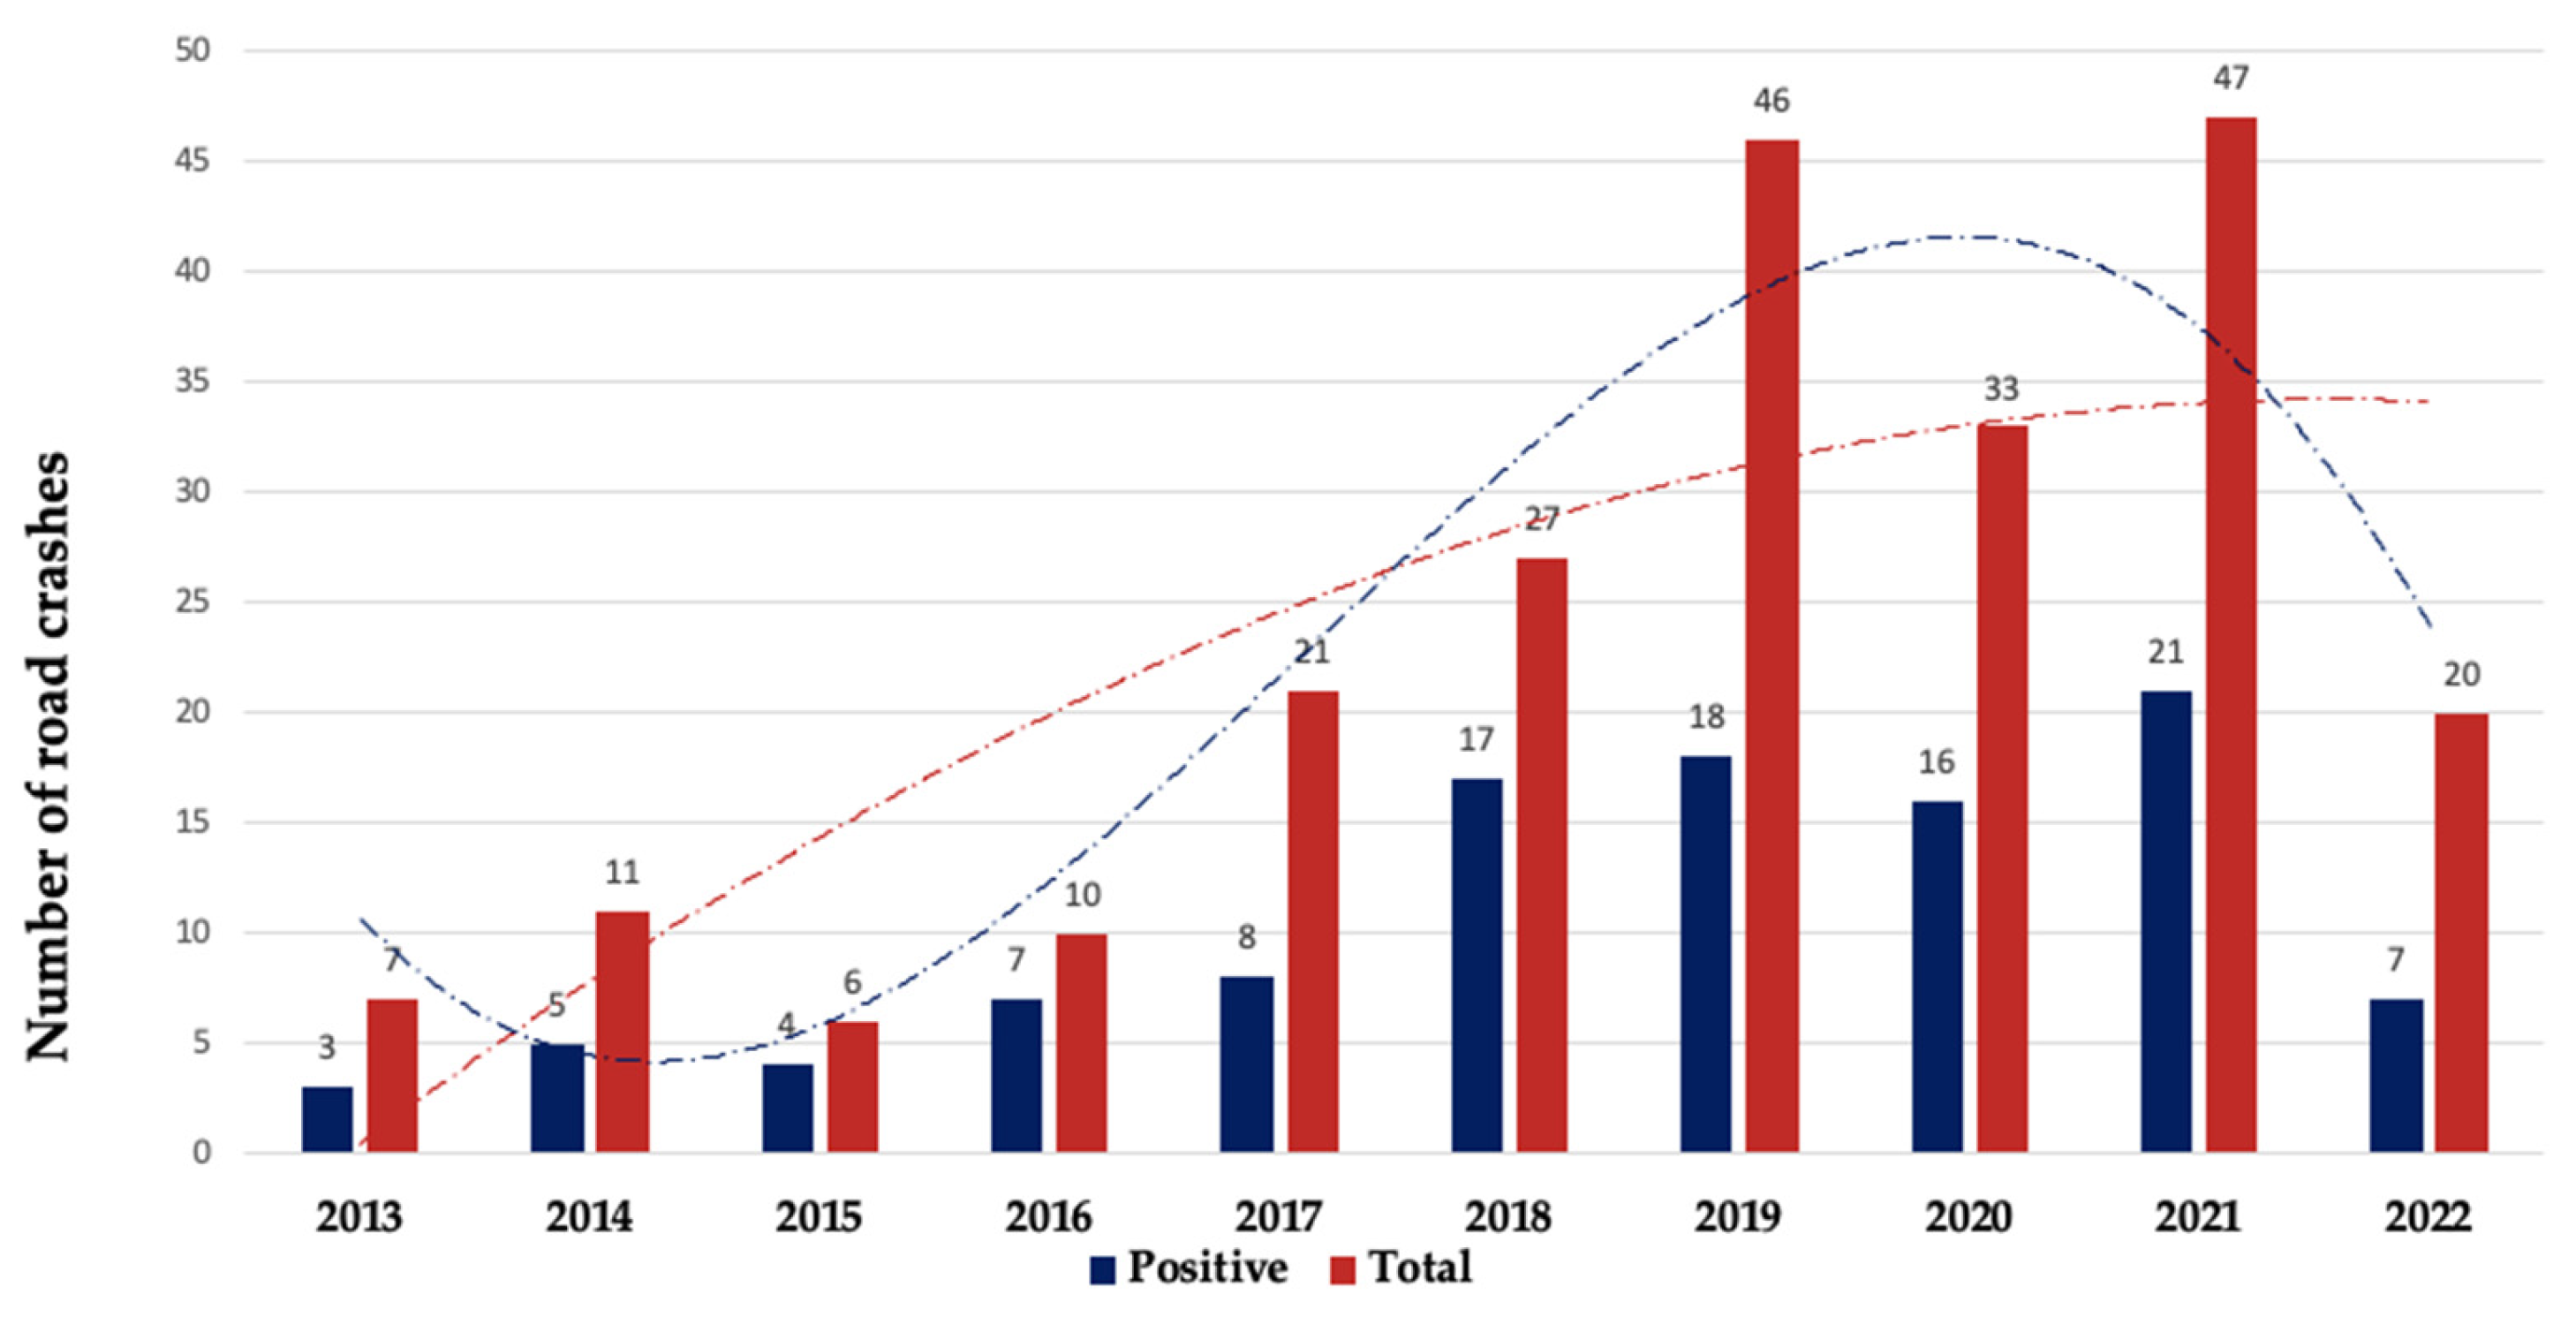
3.1. Characteristics of Fatal Road Accidents

From 2013 to 2022, toxicological investigations were performed in 228 judicial autopsies from fatal road accidents where DUI or DUID was suspected. The highest number of fatal road accidents occurred in 2021 (47 out of 228 cases in total; 20.6%), whilst the lowest number was reported in 2015 (six cases only, 2.6%). The highest number of victims tested positive for alcohol and/or drugs occurred in 2021 (21 out of 106), whilst the lowest number was reported in 2013 (3 out of 106). The average number of positive victims per year is 10.6. Figure 2 shows the distribution of road traffic related deaths per year from 2013 to 2022.
Most of the toxicological investigations were performed in summer months from July to September (97 out of 228; 42.5%) and on weekend nights (43 out of 228; 18.9%). Most of the victims were young, belonging to the 19–29 years age-group (55 out of 228; 24.1%), whilst minors of 18 years were the age group least represented (10 out of 228 victims; 4.4%). Age was not available only in three unidentified victims. Almost all the victims were males (214 out of 228; 93.9%), while only 14 females (6.1%) were counted. Toxicological analyses were positive in 106 out of 228 cases (46.5%). Age and gender distribution of the victims and positive toxicological results are shown in Table 1.
Positive toxicological cases occurred mostly in victims aged between 40 and 49 years old (30 out of 106; 28.3%); females and males were involved in almost all cases (103 victims in total; 97.1%). Toxicological analyses were positive only in three female victims (2.9%). See Table 1 for details.
Most of the 228 traffic accidents involved cars (N = 117; 51.3%), followed soon after by 83 motorcycles (36.4%), and only a few bicycles, trucks, and trains. Most of the victims were drivers (154 out of 228; 67.5%), mostly driving motorcycles (79 out of 154; 51.3%), followed by cars (54 out of 154; 35.0%), bicycles (18 out of 154; 11.9%), with two trucks and one bus only. The pedestrians were 55 in total, and 15 passengers were counted in total. The distribution of vehicles involved in road traffic deaths, the position of the victims, and positive toxicological results are summarized in Table 2.
Cars and motorcycles (89.6%) were also involved in most of the 106 positive victims. Bicycles, trucks, and trains were counted in only 8 out of the 106 positive cases. A total of 74 out of 106 positive victims (69.8%) were drivers, mostly driving motorcycles (39 in total), followed by cars (28 out of 106; 26.4%), and bicycles (five victims). Only eight victims were passengers and were 21 pedestrians, mostly struck by cars. Circumstantial data were unavailable in three cases.
Most of the 228 victims died by multiple injuries to the whole body (177 out of 228; 77.6%), followed by 38 cases of thoraco-abdominal injuries (16.7%), hemorrhagic shock and head/neck injuries (four cases; 1.7%). One single human body was burnt to death. Most victims died quickly after the crashes (175 out of 228; 76.7%), whilst 39 victims were hospitalized for few hours (17.1%), and few days before death in only 10 cases (4.4%). Time and cause of death were not assessed in four cases. Among the 106 positive victims, multiple injuries to the whole body were the leading cause of death (82 out of 106 cases; 77.3%), followed by thoraco-abdominal injuries (18 out of 106 cases; 17%), hemorrhagic shock, and head/neck injuries. Most positive victims died quickly after the crash impact (81 out of 106; 76.4%), while 17 victims died in the hospital after few hours (16%).

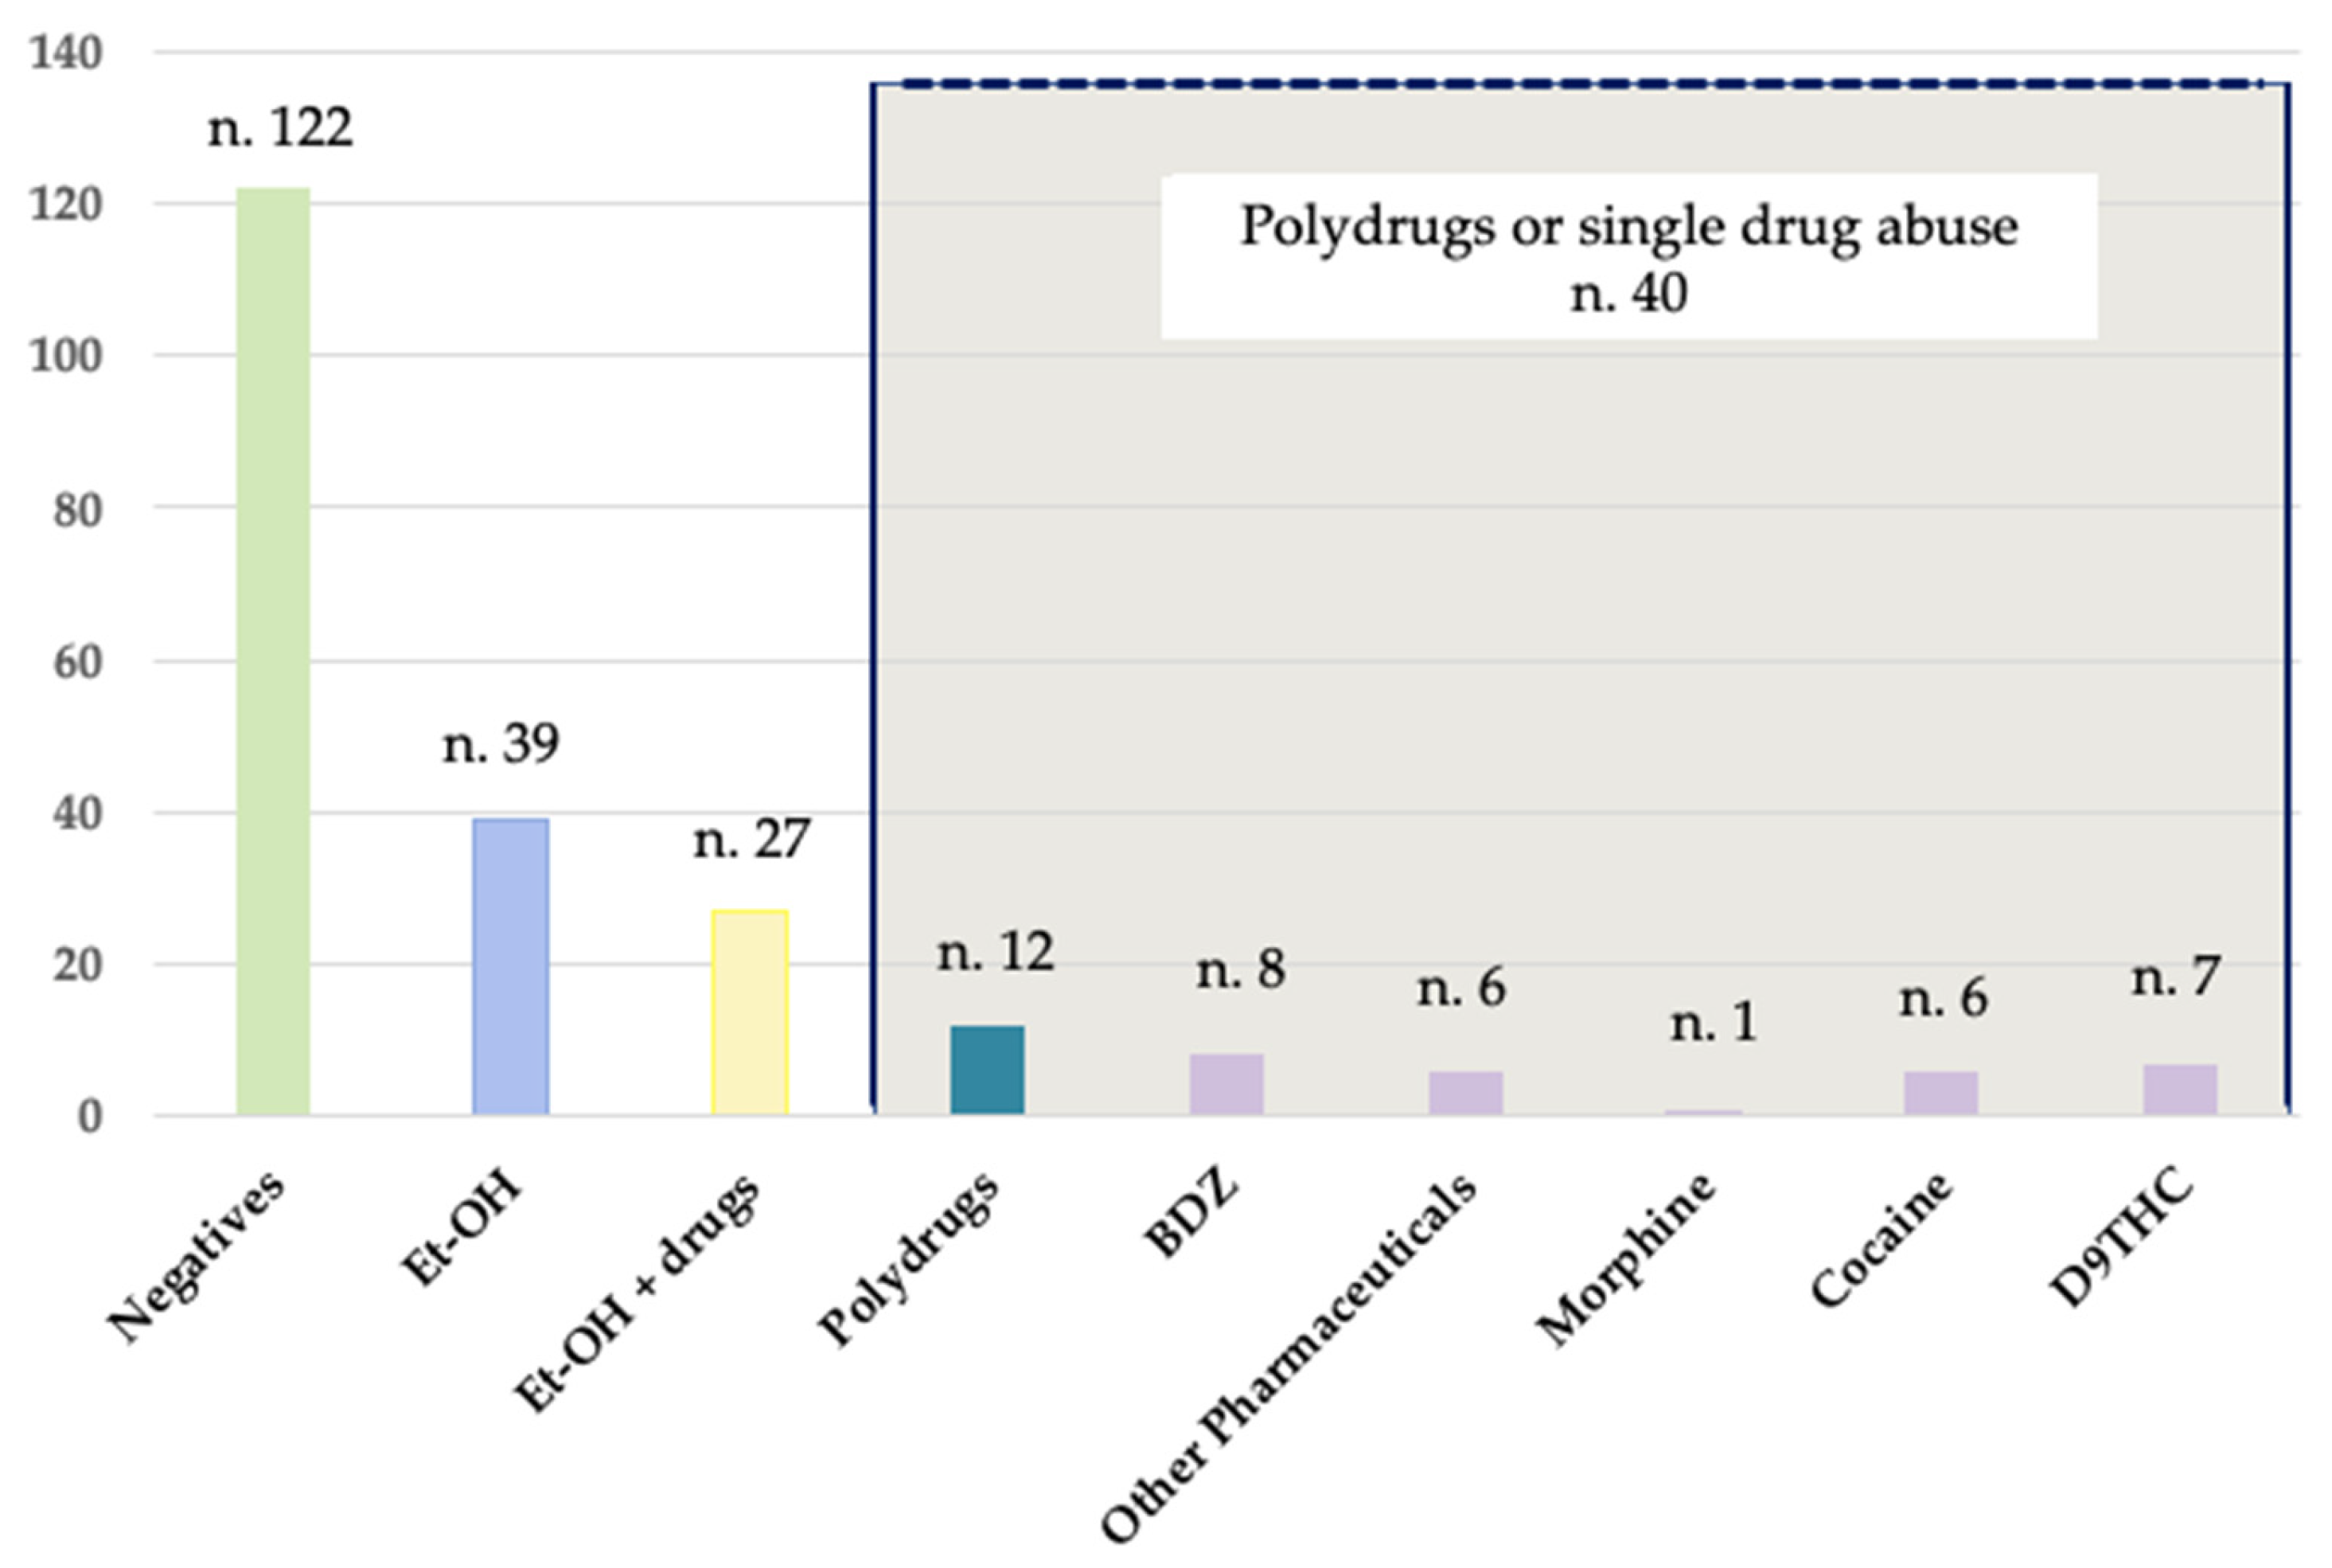
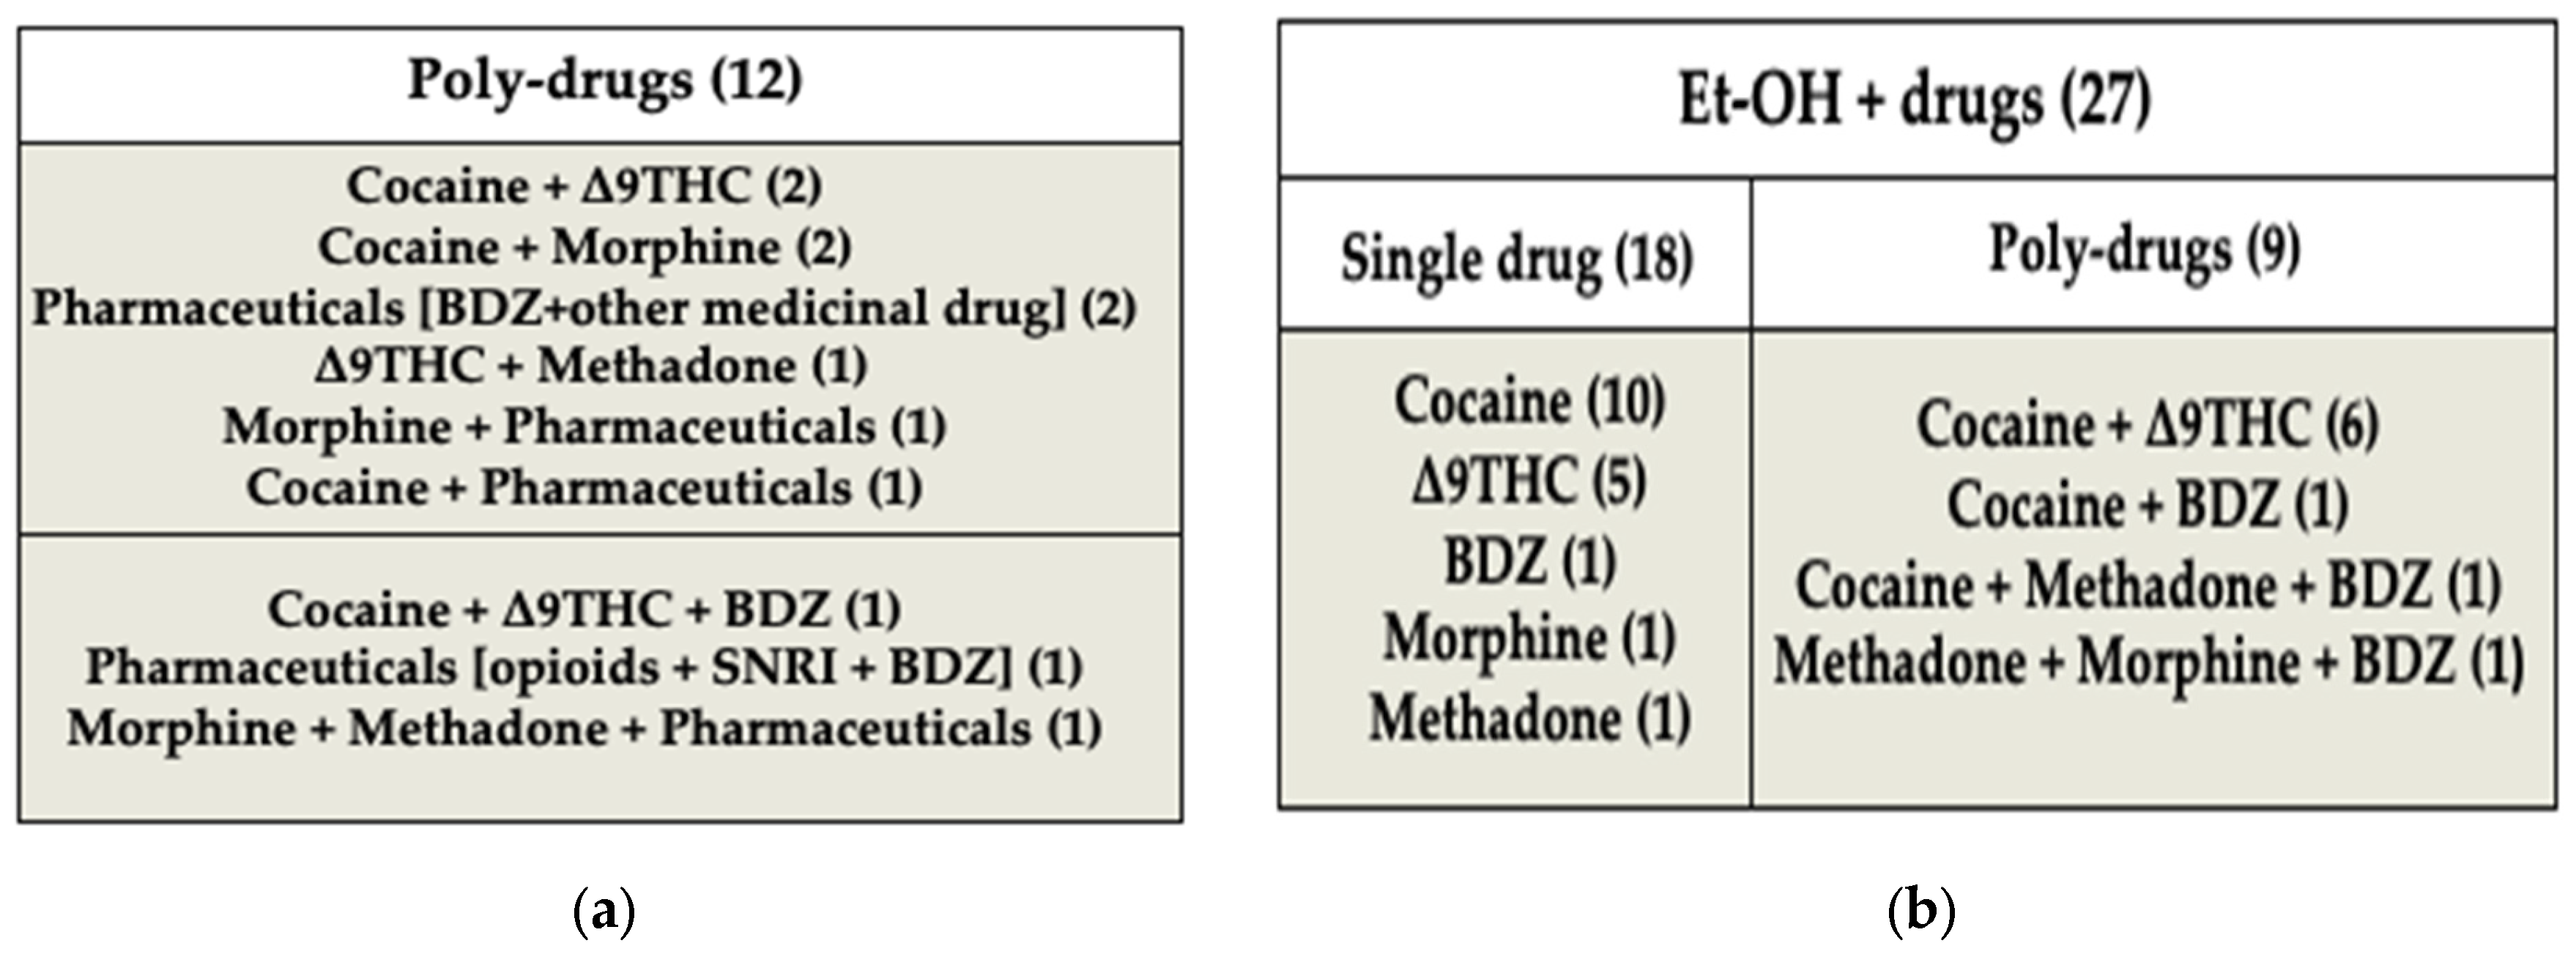
3.2. Toxicological Results: Summary and Further Details

Toxicological analyses were positive just under half of the entire study sample: 106 out of 228 cases (46.5%). These positive cases were mostly detected in July (18 out of 106; 17.0%), followed by August (15 out of 106; 14.1%), September (10 out of 106; 9.4%), and on weekend nights (21 out of 106, 19.8%). In total, 18 out of 106 accidents occurred in December and January (16.9%). As regards the 74 DUI/DUID cases, July (14 out of 74; 19%) and August (13 out of 74; 18%) were the most represented months. Figure 3 shows the distribution of the 74 DUI/DUIDs throughout the months.
Positive toxicological results occurred mostly in victims aged between 40 and 49 years old (30 out of 106; 28.3%), and males were involved in almost all cases (103 victims; 97.1%). Positive toxicological analyses were reported in three female victims only (2.9%), as shown in Table 1. Cars and motorcycles were involved in most of the 106 positive victims (95 cases in total; 89.6%). A total of 74 out of 106 positive victims (69.8%) were drivers, mostly driving motorcycles (39 in total), followed by cars (28 out of 106; 26.4%) and bicycles (5 victims). Therefore, DUI and/or DUID cases were approximately one third of the entire sample study (74 out of 228 fatal traffic deaths). Among the 106 positives, eight victims were passengers and 21 pedestrians, mostly struck by cars, as summarized in Table 2.
The distribution of alcohol and drugs among the 106 victims is shown in Figure 4. Most victims tested positive for alcohol (66 out 106, 62.3%), alone or in association with drugs. Alcohol was the only substance detected in 39 victims (36.8%), and it was associated with licit/illicit drugs in 27 victims (25.5%). Licit/illicit drugs alone were positive in 40 out of 106 cases (37.7%), among which 28 victims tested positive for one single drug and 12 individuals tested positive for more than one drug.
Most of the 66 victims positive for alcohol, both alone and in association with licit/illicit drugs, showed a BAC > 1.5 g/L. Table 3 shows the BAC levels detected among the 66 victims positive for ethanol (Et-OH). In one case, the BAC < 0.5 g/L was considered over the legal limit because the victim was a 26-year-old new driver with license for less than three years. Among these 66 victims, alcohol was detected significantly more frequently in samples from subjects younger than 50 years of age than older (p = 0.001).
Toxicological analysis to detect licit/illicit drugs reported positive results in 67 victims out of 106 (63.2%), among which were 27 cases in association with alcohol; 28 victims tested positive for one single drug, and 12 cases tested positive for multiple drugs alone. Cocaine was involved in 30 out of 67 positive cases for drugs (44.7%), followed by trans-Δ9-tetrahydrocannabinol (Δ9THC) in 22 victims, benzodiazepines (BDZ) in 16 cases, and other pharmaceuticals. Among the victims who tested positive for one single drug, BDZs were the drugs mostly involved in eight cases, followed by Δ9THC in seven victims, other pharmaceuticals, and cocaine (six cases each). Only one subject tested positive for morphine alone. Significant differences of age were also observed among these 67 victims: licit/illicit drugs were more frequently found in samples from subjects below 50 years of age, compared to those over 50 (p = 0.001).
Alcohol and drugs in association were detected in 27 out of 106 positive cases (25.5%). In this group of 27 victims, cocaine was the most common drug (18 out of 27; 66.7%), followed by Δ9THC (11 out of 27; 40.7%) and BDZ (4 out of 27). Polydrug intake was observed in 21 cases (19.8%), among which nine were in association with alcohol and 12 cases without alcohol. Cocaine with Δ9THC (8 out of 21 cases) was the most encountered combination of polydrug intake. Figure 5 shows the distribution of drugs among the 12 victims with poly-drugs intake and the 27 victims positive to alcohol and drugs together.
The 74 positive drivers were almost equally distributed among victims tested positive for alcohol (DUI) and/or for drugs (DUID). In total, 26 drivers out of 74 (35.1%) took only licit/illicit drugs and 25 (33.8%) tested positive only for alcohol alone (DUI). The association of alcohol and licit/illicit drugs was just a little bit less common (23 out of 74; 31.1%). Among the 74 DUI/DUID cases, 48 victims were positive for Et-OH with and without drugs (64.8%). Most of these victims (28 out of 48; 58.3%) showed very high BAC levels, from >1.5 g/L up to 3.7 g/L. Among the 74 DUI/DUID cases, 49 drivers (66.2%) were positive for both licit/illicit drugs, with and without alcohol. Polydrugs were detected in 15 cases (30.6%), and cocaine with Δ9THC was the most common combination (4 out of 15; 26.7%). A total of 34 out of 49 DUID cases (69.4%) tested positive for a single drug, among which cocaine (16 out of 34; 47.0%) and Δ9THC (9 out of 34; 26.5%) were also the most involved. In total, 7 out of 34 drivers (20.6%) tested positive to BDZ and other pharmaceuticals alone. Among the three positive female victims, no drivers were found, and no illicit drug intake was observed.
HS/GC- FID and GC/MS Chromatograms for BAC and cocaine detection in urine samples, respectively, are provided in Figure 6.

4. Discussion

There is a growing concern about the correlation between DUI and DUID cases and road traffic accidents [32,33,34]. Driving is a complex task that requires a coordinated array of sensory, cognitive, and motor control components [35]. Alcohol and/or drug impairment occurs in a reduction of all those drivers’ abilities. [36,37]. The driving impairment begins already at BAC as low as 0.5 g/L, but more severe effects can occur at greater BACs [38]. Recent studies have found similarities in the drive impairment induced by illicit drugs intake and high levels of BAC [39,40].
Our results show an increase in the number of deaths due to road traffic accidents involving alcohol and/or drug consumption over the years, despite the severe penalties for DUI and DUID introduced by Italian Law 41/2016. Although in 2022, only seven victims positive to alcohol and drugs were counted, a relevant increase in both road traffic fatalities and deaths positive to alcohol and drugs was counted since 2017. A decrease in road accidents and road-related deaths was observed in 2020, compared to 2019 and 2021, only due to the impact of lockdown measures adopted during the COVID-19 pandemic and the restrictions in mobility [24,41]. It is worth mentioning that half of the 2020 positive cases (8 out of 16) were drivers under the influence of both alcohol and illicit drugs in combination, ignoring COVID restrictions. The general trend reported in our study sample is not in agreement with the European trend of drink-driving deaths. Based on the 2022 ETSC report [24], road deaths attributed to alcohol decreased by 37% between 2011 and 2021. Unfortunately, no official data are available in Italy dealing with the number of alcohol-related road deaths, and they were not reported in the 2022 ETSC report. Despite the lack of official data on road fatalities related to alcohol and/or licit/illicit drug consumption, based on the last ISTAT report [26], in Italy, a total amount of 52.459 road crashes with injuries occurred in 2021, among which those related to alcohol and licit/illicit drug were 9.7% and 3.2%, showing an increase compared to previous years. The rising Italian trend can be related to the approval of the Law 41/2016 for drunk driving prevention. After 2016, severe penalties for DUI and DUID were introduced and, in opposition to previous years, standard toxicological analysis started to be routinely performed on every injured and dead victim of road-traffic accidents, as recommended by law.
In our survey, 106 positive victims out of 228 road-related fatalities in total were counted. This means that toxicological analyses were positive just under half (46.5%) of the entire sample size. In this study sample, a remarkably gender gap was observed as represented by 103 males (97.1%) and only three females (2.9%).
The very low number of women involved in accidents can be referred to the fact that, according to other studies [42], women are more compliant to traffic rules and engage less in risk behaviors. They report fewer traffic violations, and are less likely involved in car accidents. Also, according to previous studies [43,44,45], males are the predominant gender in road fatalities and in most of the DUI and DUID cases, and the drivers killed in road traffic accidents were younger than 30 years old.
In a study conducted in Mexico, most of the victims were in between 30 and 49 years of age [46]. In our survey, 55 out of 228 victims (24.1%) were aged between 19 and 29 years old, in line with the last National Road Safety Report [47]. However, among the 106 victims under the influence of alcohol or drugs, most of the individuals were older than 40 years, in the age group of 40–49 years (28.3%). Data analysis also showed statistically significant differences between victims below 50 years of age and positive tests for alcohol and drugs only, compared to those over 50 (p = 0.001).
The 2022 ETSC report shows that most of the road fatalities occur during weekends [24]. This is consistent with our survey. Most of the road accidents, as well as most of the road-related deaths, were counted during the weekends in summer months, from July to September. This is a period where most Italian people take holidays driving by car or motorcycles around the local territories. No increase in the number of fatal crashes was observed during the Christmas holidays, compared to other months of the year.
In our study sample, 74 out of 106 positive victims (69.8%) were drivers, mostly driving motorcycles (39 in total), followed by cars (28 out of 106; 26.4%) and bicycles (5 victims). Therefore, DUI and/or DUID cases were approximately one third of the entire sample study (74 out of 228 road-related deaths). This is a very high percentage compared to the total amount of road accidents suspected of DUI or DUID. In Europe and in the USA, DUI and DUID cases represent approximately 34% and 31% of all road deaths, respectively [23,24,45,48,49,50]. Among the other positive victims, 21 pedestrians were also counted, mostly struck by cars. According to the 2018 WHO report, all these victims can be considered the most “vulnerable road users” in which, besides the lack of specific infrastructure features ensuring road safety, the effects of alcohol and drugs certainly increased the risk of their vulnerability [20]. According to our data, 10 out 21 pedestrians tested positive for alcohol, with a minimum BAC of 0.8 up to 3.6; 9 out of 11 drug-positive pedestrians had been taking THC and/or other licit drugs with Central Nervous System (SNC) depressant action. Therefore, an awareness impairment of all the positive pedestrians could be assumed.
In our survey, alcohol was found in concentrations above the current legal limits (>0.5 g/L) in 60.4% of road victims (64 out of 106 positives for Et-OH), among which most of them (62.1%) had a BAC > 1.5 g/dL. Costa et al. (2012) also reported very high BAC levels in 54.1% of road fatalities [51]. In another report, BAC levels above the legal limit, and mostly >1.5 g/L, which were detected in 71.2% of the sample [19]. Wundersitz et al. (2017) reported that 34% of drivers had an illegal BAC [52]. In our study, most of the drivers positive for Et-OH, with and without drugs, (28 out of 48; 58.3%) showed very high BAC levels from >1.5 g/L up to 3.7 g/L.
Toxicological analysis to detect licit/illicit drugs were positive in 67 victims out of 106 (63.2%), among which 27 cases in association with alcohol; 28 tested positive for one single drug, and 12 cases tested positive to multiple drugs alone. Cocaine was involved in 30 out of 67 positive cases for drugs (44.7%), followed by Δ9THC in 22 victims, BDZ in 16 cases, and other pharmaceuticals. According to previous studies, cocaine and Δ9THC were the drugs most involved in road-related fatalities [44,45].
Cocaine was the most prevalent illicit drug found among victims of fatal road crashes, followed by Δ9THC. Our results are in agreement with the results provided by other national [19] and international studies [49,50]. In this regard, it is well known that these drugs can increase the risk of road crashes from one- to threefold [53,54,55]. Cocaine induces driving impairment by causing tremors, fatigue, and poor concentration [56]. Impaired motor coordination and reaction time interfering with driving ability have also been reported as adverse health effects of cannabis. However, the relationship between THC concentrations and driving impairment seems more complex to establish, since blood concentrations and their effects do not appear to follow a linear relationship [57,58]. Thus, the presence of THC in blood or oral samples does not necessarily translate into impairment [2,45]. After all, an elevated risk for traffic safety is usually associated with DUI or DUID when CNS depressant drugs like alcohol and THC are involved [48,52,59,60,61,62,63,64,65,66]. Changes in pupillary function have been studied to evaluate the effects of cannabis on the ability to drive [2,67,68,69,70,71,72,73,74,75,76].
In our report, no amphetamines or their main metabolites were detected in any of the 67 victims positive for drugs. This does not seem in agreement with the alarming escalation in the amphetamine abuse reported by other studies [45,77,78]. In this regard, a warning sign comes from the high number of polydrug users detected (21 out of 106 positive fatalities; 19.8%). The driving impairment caused by the association of more drugs has been widely reported in the literature [2,3,4,5,6,40]. These data lead to important considerations on how to measure the driver impairment caused by the synergic effects of poly-assumption, since the current cut off-legislation is based on the impairing effect of a single (licit) drug. Perhaps a lower cut-off should be adopted when poly-assumption is involved, especially if drugs are detected in combination with alcohol [59].
The correlation between BAC levels and driving impairment has led many countries, like Italy, to adopt BAC threshold limits for penal sanctions. Although the abuse of illegal drugs and certain prescription medications is linked to the loss of driving ability and to an increase in road traffic crashes and deaths [79], establishing cutoff values for some illicit drugs is still a challenge [80]. For example, THC concentrations of 7–10 ng/mL in serum are thought to evoke comparable impairment to a BAC of 0.5 g/kg, which is the legal limit in most European countries [68]. In most countries, having a positive test for illicit drugs implies a crime and a penalty. In this regard, Italy, France, Germany, and Poland adopt a zero-tolerance approach [81]. In other countries, like Sweden, drivers are prosecuted when drug levels are above the maximum threshold of the therapeutic range, and when the driver is impaired and/or cannot show a regular prescription. [59,81,82,83].
However, a comparison between countries on road deaths attributed to alcohol or drugs is a complex task, given the noticeable differences in terms of legislation.

5. Conclusions

Despite severe penalties having been adopted by many countries as an important strategy to improve road safety, road crashes remain the eighth leading cause of death for all age groups, and the leading cause of death for children and young adults aged 5–29 years [20]. According to these data, legal sanctions in DUI and DUID cases seem to have a poor impact, at least in our territory. Although the main limitation of the study is represented by the sample size, our results show that alcohol and/or drugs can be considered significant contributing factors that increase the lethal risk of road accidents. A multidisciplinary approach, involving educational and preventive strategies, should be promoted and improved. The use of questionnaires about drinking habits and driving impairment has been proposed, as the involvement of alcohol industry in commercial spots about driving impairment [21].

Author Contributions

Writing—review and editing, investigation and conceptualization, A.C.; methodology and formal analysis, R.P.; writing—original draft preparation, data analysis: G.A., I.F., P.P., M.Z. and S.F.; writing/review and editing: A.F.; writing—review and supervision, C.P.C. All authors have read and agreed to the published version of the manuscript.

Funding

This research received no external funding.

Institutional Review Board Statement

Research was carried out following the rules of the Declaration of Helsinki of 1975 and subsequent updates. Approval from local institutional review board was not necessary since all analyses were performed in accordance with Prosecutor Office requests.

Informed Consent Statement

Not applicable.

Data Availability Statement

Data are contained within the article.

Conflicts of Interest

The authors declare no conflict of interest.

References

  1. Chan, W.S.; Wong, G.F.; Hung, C.W.; Wong, Y.N.; Fung, K.M.; Lee, W.K.; Dao, K.L.; Leung, C.W.; Lo, K.M.; Lee, W.M.; et al. Interpol review of toxicology 2016–2019. Forensic Sci. Int. Synerg. 2020, 2, 563–607. [Google Scholar] [CrossRef] [PubMed]
  2. Ortiz-Peregrina, S.; Casares-López, M.; Ortiz, C.; Castro-Torres, J.J.; Martino, F.; Jiménez, J.R. Comparison of the effects of alcohol and cannabis on visual function and driving performance. Does the visual impairment affect driving? Drug Alcohol Depend. 2022, 237, 109538. [Google Scholar] [CrossRef] [PubMed]
  3. Fares, A.; Wickens, C.M.; Mann, R.E.; Di Ciano, P.; Wright, M.; Matheson, J.; Hasan, O.S.M.; Rehm, J.; George, T.P.; Samokhvalov, A.V.; et al. Combined effect of alcohol and cannabis on simulated driving. Psychopharmacology 2022, 239, 1263–1277. [Google Scholar] [CrossRef] [PubMed]
  4. Schnakenberg Martin, A.M.; Flynn, L.T.; Sefik, E.; Luddy, C.; Cortes-Briones, J.; Skosnik, P.D.; Pittman, B.; Ranganathan, M.; D’Souza, D.C. Preliminary study of the interactive effects of THC and ethanol on self-reported ability and simulated driving, subjective effects, and cardiovascular responses. Psychopharmacology 2023, 240, 1235–1246. [Google Scholar] [CrossRef] [PubMed]
  5. Goullé, J.P.; Verstraete, A.; Boulu, R.; Costentin, J.; Foucher, J.P.; Raes, E.; Tillement, J.P. Drogues, médicaments et accidentologie [Illicit drugs, medications and traffic accidents]. In Annales Pharmaceutiques Françaises; Elsevier Masson: Gainesville, FL, USA, 2008; Volume 66, pp. 196–205. [Google Scholar]
  6. Van der Sluiszen, N.N.; Vermeeren, A.; Verster, J.C.; van de Loo, A.J.A.E.; van Dijken, J.H.; Veldstra, J.L.; Brookhuis, K.A.; de Waard, D.; Ramaekers, J.G. Driving performance and neurocognitive skills of long-term users of benzodiazepine anxiolytics and hypnotics. Hum. Psychopharmacol. 2019, 34, e2715. [Google Scholar] [CrossRef] [PubMed]
  7. Irwin, C.; Iudakhina, E.; Desbrow, B.; McCartney, D. Effects of acute alcohol consumption on measures of simulated driving: A systematic review and meta-analysis. Accid. Anal. Prev. 2017, 102, 248–266. [Google Scholar] [CrossRef] [PubMed]
  8. Fares, A.; Wright, M.; Matheson, J.; Mann, R.E.; Stoduto, G.; Le Foll, B.; Wickens, C.M.; Brands, B.; Di Ciano, P. Effects of combining alcohol and cannabis on driving, breath alcohol level, blood THC, cognition, and subjective effects: A narrative review. Exp. Clin. Psychopharmacol. 2022, 30, 1036–1049. [Google Scholar] [CrossRef]
  9. Wickens, C.M.; Wright, M.; Mann, R.E.; Brands, B.; Di Ciano, P.; Stoduto, G.; Fares, A.; Matheson, J.; George, T.P.; Rehm, J.; et al. Separate and combined effects of alcohol and cannabis on mood, subjective experience, cognition and psychomotor performance: A randomized trial. Prog. Neuropsychopharmacol. Biol. Psychiatry 2022, 118, 110570. [Google Scholar] [CrossRef]
  10. Van Der Sluiszen, N.N.; Vermeeren, A.; van Dijken, J.H.; J A E van de Loo, A.; Veldstra, J.L.; de Waard, D.; C Verster, J.; A Brookhuis, K.; Ramaekers, J.G. Driving performance and neurocognitive skills of long-term users of sedating antidepressants. Hum. Psychopharmacol. 2021, 36, 1–12. [Google Scholar] [CrossRef]
  11. Brunnauer, A.; Herpich, F.; Zwanzger, P.; Laux, G. Driving Performance Under Treatment of Most Frequently Prescribed Drugs for Mental Disorders: A Systematic Review of Patient Studies. Int. J. Neuropsychopharmacol. 2021, 24, 679–693. [Google Scholar] [CrossRef]
  12. Ramaekers, J.G. Antidepressants and driver impairment: Empirical evidence from a standard on-the-road test. J. Clin. Psychiatry 2003, 64, 20–29. [Google Scholar] [CrossRef] [PubMed]
  13. Judd, L.L. The effect of antipsychotic drugs on driving and driving related psychomotor functions. Accid. Anal. Prev. 1985, 17, 319–322. [Google Scholar] [CrossRef] [PubMed]
  14. Chang, C.M.; Wu, E.C.; Chen, C.Y.; Wu, K.Y.; Liang, H.Y.; Chau, Y.L.; Wu, C.S.; Lin, K.M.; Tsai, H.J. Psychotropic drugs and risk of motor vehicle accidents: A population-based case-control study. Br. J. Clin. Pharmacol. 2013, 75, 1125–1133. [Google Scholar] [CrossRef] [PubMed]
  15. Thomas, R.E. Benzodiazepine use and motor vehicle accidents. Systematic review of reported association. Can. Fam. Physician 1998, 44, 799–808. [Google Scholar] [PubMed]
  16. Dassanayake, T.; Michie, P.; Carter, G.; Jones, A. Effects of benzodiazepines, antidepressants and opioids on driving: A systematic review and meta-analysis of epidemiological and experimental evidence. Drug Saf. 2011, 34, 125–156. [Google Scholar] [CrossRef] [PubMed]
  17. Johnell, K.; Laflamme, L.; Möller, J.; Monárrez-Espino, J. The role of marital status in the association between benzodiazepines, psychotropics and injurious road traffic crashes: A register-based nationwide study of senior drivers in Sweden. PLoS ONE 2014, 9, e86742. [Google Scholar] [CrossRef] [PubMed]
  18. Skyving, M.; Forsman, Å.; Dukic Willstrand, T.; Laflamme, L.; Möller, J. Medical impairment and road traffic crashes among older drivers in Sweden—A national, population-based, case-control study. Accid. Anal. Prev. 2021, 163, 106434. [Google Scholar] [CrossRef]
  19. Anzillotti, L.; Dagoli, S.; Calò, L.; Maglietta, G.; Cecchi, R. Road traffic deaths: A retrospective analysis (2009–2019) in the north of the Italian region Emilia Romagna. Traffic Inj. Prev. 2022, 23, 29–33. [Google Scholar] [CrossRef]
  20. Global Status Report on Road Safety 2018; World Health Organization: Geneva, Switzerland. 2018. Available online: https://www.who.int/publications/i/item/9789241565684 (accessed on 1 October 2023).
  21. Drinking Driving: A Road Safety Manual for Decision-Makers and Practitioners; Road Safety Partnership, International Federation of Red Cross and Red Crescent Societies: Geneva, Switzerland. 2022. Available online: https://cdn.who.int/media/docs/default-source/documents/health-topics/road-traffic-injuries/ifrc-drink-driving-2022-final.pdf?sfvrsn=f3e09010_6&download=true (accessed on 1 October 2023).
  22. Rosen, H.E.; Bari, I.; Paichadze, N.; Peden, M.; Khayesi, M.; Monclús, J.; Hyder, A.A. Global road safety 2010–18: An analysis of Global Status Reports. Injury 2022, in press. [Google Scholar] [CrossRef]
  23. Drunk Driving; National Highway Traffic Safety Administration: Washington, DC, USA. 2021. Available online: https://www.nhtsa.gov/risky-driving/drunk-driving (accessed on 1 October 2023).
  24. Progress in Reducing Drink-Driving and Other Alcohol-Related Road Deaths in Europe; European Transport Safety Council: Brussels, Belgium. 2022. Available online: https://etsc.eu/progress-in-reducing-drink-driving-and-other-alcohol-related-road-deaths-in-europe/ (accessed on 1 October 2023).
  25. Cittadini, F.; De Giovanni, N.; Caradonna, L.; Vetrugno, G.; Oliva, A.; Fucci, N.; Zuppi, C.; Pascali, V.L.; Covino, M. Prevalence of alcohol and other drugs in injured drivers and their association with clinical outcomes. Eur. Rev. Med. Pharmacol. Sci. 2017, 21, 2008–2014. [Google Scholar]
  26. Incidenti Stradali. Anno 2021. ISTAT (Istituto Nazionale di Statistica). Available online: https://www.istat.it/it/archivio/273324#:~:text=Nel%202021%20sono%202.875%20i,11%2C8%25%20incidenti (accessed on 1 October 2023).
  27. Carfora, A.; Campobasso, C.P.; Cassandro, P.; Petrella, R.; Borriello, R. Alcohol and drugs use among drivers injured in road accidents in Campania (Italy): A 8-years retrospective analysis. Forensic Sci. Int. 2018, 288, 291–296. [Google Scholar] [CrossRef] [PubMed]
  28. Linee Guida per Strutture dotate di Laboratori per gli Accertamenti di Sostanze d’Abuso con Finalità Tossicologo-Forensi e Medico-Legali Rev. n. 4, Ital. J. Addict. 2012, 2, 34–47. Available online: https://iris.unipa.it/retrieve/handle/10447/75815/76143/IJA_vol_2_num_5-6.pdf (accessed on 15 November 2023).
  29. Linee Guida per Strutture dotate di Laboratori per gli Accertamenti di Sostanze d’Abuso con Finalità Tossicologo-Forensi e Medico-Legali Rev. n. 5 of 29 May 2017. Available online: http://www.gtfi.it/wp-content/uploads/2017/06/LG_biologico_revi-sione_2017_29_05.pdf (accessed on 15 November 2023).
  30. Peters, F.T.; Drummer, O.H.; Musshoff, F. Validation of new methods. Forensic Sci. Int. 2007, 165, 216–224. [Google Scholar] [CrossRef] [PubMed]
  31. U.S. Department of Health and Human Services Food and Drug Administration Center for Drug Evaluation and Research (CDER) Center for Veterinary Medicine (CVM) Guidance for Industry for Bioanalytical Method Validation. 2018. Available online: https://www.fda.gov/regulatory-information/search-fda-guidance-documents/bioanalytical-method-validation-guidance-industry (accessed on 15 November 2023).
  32. Domingo-Salvany, A.; Herrero, M.J.; Fernandez, B.; Perez, J.; Del Real, P.; González-Luque, J.C.; de la Torre, R. Prevalence of psychoactive substances, alcohol and illicit drugs, in Spanish drivers: A roadside study in 2015. Forensic Sci. Int. 2017, 278, 253–259. [Google Scholar] [CrossRef] [PubMed]
  33. Jewett, A.; Peterson, A.B.; Sauber-Schatz, E.K. Exploring substance use and impaired driving among adults aged 21 years and older in the United States, 2015. Traffic Inj. Prev. 2018, 19, 693–700. [Google Scholar] [CrossRef]
  34. Wiese Simonsen, K.; Steentoft, A.; Bernhoft, I.M.; Hels, T.; Rasmussen, B.S.; Linnet, K. Psychoactive substances in seriously injured drivers in Denmark. Forensic Sci. Int. 2013, 224, 44–50. [Google Scholar] [CrossRef] [PubMed]
  35. Sewell, R.A.; Poling, J.; Sofuoglu, M. The effect of cannabis compared with alcohol on driving. Am. J. Addict. 2009, 18, 185–193. [Google Scholar] [CrossRef] [PubMed]
  36. Drummer, O.H. The role of drugs in road safety. Aust. Prescr. 2008, 31, 33–35. [Google Scholar] [CrossRef]
  37. Drummer, O.H.; Yap, S. The involvement of prescribed drugs in road trauma. Forensic Sci. Int. 2016, 265, 17–21. [Google Scholar] [CrossRef]
  38. Naglaa, F.M.; Maha, K.A.M.; Mostafa, M.A. The Prevalence of Illicit Drugs and Alcohol in Road Traffic Accident Fatalities in the Eastern Region of Saudi Arabia. Indian J. Med. Forensic Med. Toxicol. 2021, 4, 3219–3225. [Google Scholar]
  39. Alcohol. European Road Safety Observatory. 2007. Available online: https://road-safety.transport.ec.europa.eu/system/files/2021-07/02-alcohol_en.pdf (accessed on 1 October 2023).
  40. Hels, T.; Lyckegaard, A.; Simonsen, K.W.; Steentoft, A.; Bernhoft, I.M. Risk of severe driver injury by driving with psychoactive substances. Accid. Anal. Prev. 2013, 59, 346–356. [Google Scholar] [CrossRef]
  41. Carfora, A.; Petrella, R.; Ambrosio, G.; Fracassi, I.; Festinese, S.; Feola, A.; Campobasso, C.P. Toxicological Analysis of Illicit Drugs Seized in Naples (Italy) and First Detection of Synthetic Cannabinoids during COVID-19 Pandemic. Healthcare 2022, 10, 1488. [Google Scholar] [CrossRef]
  42. Moè, A.; Cadinu, M.; Maas, A. Women drive better if not stereotyped. Accid. Anal. Prev. 2015, 85, 199–206. [Google Scholar] [CrossRef] [PubMed]
  43. Roudsari, B.; Ramisetty-Mikler, S.; Rodriguez, L.A. Ethnicity, age, and trends in alcohol-related driver fatalities in the United States. Traffic Inj. Prev. 2009, 10, 410–414. [Google Scholar] [CrossRef]
  44. Papalimperi, A.H.; Athanaselis, S.A.; Mina, A.D.; Papoutsis, I.I.; Spiliopoulou, C.A.; Papadodima, S.A. Incidence of fatalities of road traffic accidents associated with alcohol consumption and the use of psychoactive drugs: A 7-year survey (2011–2017). Exp. Ther. Med. 2019, 18, 2299–2306. [Google Scholar] [CrossRef] [PubMed]
  45. Gjerde, H.; Christophersen, A.S.; Normann, P.T.; Mørland, J. Toxicological investigations of drivers killed in road traffic accidents in Norway during 2006–2008. Forensic Sci. Int. 2011, 212, 102–109. [Google Scholar] [CrossRef] [PubMed]
  46. Santoyo-Castillo, D.; Pérez-Núñez, R.; Borges, G.; Híjar, M. Estimating the drink driving attributable fraction of road traffic deaths in Mexico. Addiction 2018, 113, 828–835. [Google Scholar] [CrossRef]
  47. Road Safety Report 2021. Italy. The Impact of COVID-19. Available online: https://www.itf-oecd.org/sites/default/files/italy-road-safety.pdf (accessed on 1 October 2023).
  48. Lacey, J.H.; Kelley-Baker, T.; Berning, A.; Romano, E.; Ramirez, A.; Yao, J.; Compton, R. Drug and Alcohol Crash Risk: A Case-Control Study; National Highway Traffic Safety Administration: Washington, DC, USA, 2016. Available online: https://www.nhtsa.gov/sites/nhtsa.gov/files/documents/812355_drugalcoholcrashrisk.pdf (accessed on 1 October 2023).
  49. Bernhoft, I.M.; Hels, T.; Lyckegaard, A.; Houwing, S.; Verstraete, A.G. Prevalence and risk of injury in Europe by driving with alcohol, illicit drugs and medicines. Procedia Soc. Behav. Sci. 2012, 48, 2907–2916. [Google Scholar] [CrossRef]
  50. Brady, J.E.; Li, G. Trends in alcohol and other drugs detected in fatally injured drivers in the United States, 1999–2010. Am. J. Epidemiol. 2014, 179, 692–699. [Google Scholar] [CrossRef]
  51. Costa, N.; Silva, R.; Mendonça, M.C.; Real, F.C.; Vieira, D.N.; Teixeira, H.M. Prevalence of ethanol and illicit drugs in road traffic accidents in the centre of Portugal: An eighteen-year update. Forensic Sci. Int. 2012, 216, 37–43. [Google Scholar] [CrossRef]
  52. Wundersitz, L.; Raftery, S. Understanding the context of alcohol impaired driving for fatal crash-involved drivers: A descriptive case analysis. Traffic Inj. Prev. 2017, 18, 781–787. [Google Scholar] [CrossRef]
  53. Arkell, T.R.; Vinckenbosch, F.; Kevin, R.C.; Theunissen, E.L.; McGregor, I.S.; Ramaekers, J.G. Effect of Cannabidiol and Δ9-Tetrahydrocannabinol on Driving Performance: A Randomized Clinical Trial. JAMA 2020, 324, 2177–2186. [Google Scholar] [CrossRef]
  54. Baldock, M.R.; Lindsay, V.L. Examination of the role of the combination of alcohol and cannabis in South Australian road crashes. Traffic Inj. Prev. 2015, 16, 443–449. [Google Scholar] [CrossRef] [PubMed]
  55. Arkell, T.R.; Abelev, S.V.; Mills, L.; Suraev, A.; Arnold, J.C.; Lintzeris, N.; McGregor, I.S. Driving-related behaviors, attitudes, and perceptions among Australian medical cannabis users: Results from the CAMS 20 survey. J. Cannabis Res. 2023, 5, 35. [Google Scholar] [CrossRef] [PubMed]
  56. Ferrari, D.; Manca, M.; Premaschi, S.; Banfi, G.; Locatelli, M. Toxicological investigation in blood samples from suspected impaired driving cases in the Milan area: Possible loss of evidence due to late blood sampling. Forensic Sci. Int. 2018, 288, 211–217. [Google Scholar] [CrossRef] [PubMed]
  57. Di Ciano, P.; Brands, B.; Fares, A.; Wright, M.; Stoduto, G.; Byrne, P.; McGrath, M.; Hasan, O.S.M.; Le Foll, B.; Wickens, C.M. The utility of THC cutoff levels in blood and saliva for detection of impaired driving. Cannabis Cannabinoid Res. 2023, 8, 408–413. [Google Scholar] [CrossRef] [PubMed]
  58. Hartman, R.L.; Huestis, M.A. Cannabis effects on driving skills. Clin. Chem. 2013, 59, 478–492. [Google Scholar] [CrossRef] [PubMed]
  59. Pelletti, G.; Verstraete, A.G.; Reyns, T.; Barone, R.; Rossi, F.; Garagnani, M.; Pelotti, S. Prevalence of therapeutic drugs in blood of drivers involved in traffic crashes in the area of Bologna, Italy. Forensic Sci. Int. 2019, 302, 109914. [Google Scholar] [CrossRef] [PubMed]
  60. Brubacher, J.R.; Chan, H.; Erdelyi, S.; Macdonald, S.; Asbridge, M.; Mann, R.E.; Eppler, J.; Lund, A.; MacPherson, A.; Martz, W.; et al. Cannabis use as a risk factor for causing motor vehicle crashes: A prospective study. Addiction 2019, 114, 1616–1626. [Google Scholar] [CrossRef]
  61. Hartman, R.L.; Brown, T.L.; Milavetz, G.; Spurgin, A.; Pierce, R.S.; Gorelick, D.A.; Gaffney, G.; Huestis, M.A. Cannabis effects on driving lateral control with and without alcohol. Drug Alcohol Depend. 2015, 154, 25–37. [Google Scholar] [CrossRef]
  62. Arkell, T.R.; Lintzeris, N.; Kevin, R.C.; Ramaekers, J.G.; Vandrey, R.; Irwin, C.; Haber, P.S.; McGregor, I.S. Cannabidiol (CBD) content in vaporized cannabis does not prevent tetrahydrocannabinol (THC)-induced impairment of driving and cognition. Psychopharmacology 2019, 236, 2713–2724. [Google Scholar] [CrossRef]
  63. Downey, L.A.; King, R.; Papafotiou, K.; Swann, P.; Ogden, E.; Boorman, M.; Stough, C. The effects of cannabis and alcohol on simulated driving: Influences of dose and experience. Accid. Anal. Prev. 2013, 50, 879–886. [Google Scholar] [CrossRef]
  64. Brunnauer, A.; Laux, G.; Geiger, E.; Soyka, M.; Möller, H.J. Antidepressants and driving ability: Results from a clinical study. J. Clin. Psychiatry. 2006, 67, 1776–1781. [Google Scholar] [CrossRef] [PubMed]
  65. Wingen, M.; Ramaekers, J.G.; Schmitt, J.A. Driving impairment in depressed patients receiving long-term antidepressant treatment. Psychopharmacology 2006, 188, 84–91. [Google Scholar] [CrossRef] [PubMed]
  66. Martin, T.L.; Solbeck, P.A.; Mayers, D.J.; Langille, R.M.; Buczek, Y.; Pelletier, M.R. A review of alcohol-impaired driving: The role of blood alcohol concentration and complexity of the driving task. J. Forensic Sci. 2013, 58, 1238–1250. [Google Scholar] [CrossRef]
  67. Campobasso, C.P.; De Micco, F.; Corbi, G.; Keller, T.; Hartung, B.; Daldrup, T.; Monticelli, F. Pupillary effects in habitual cannabis consumers quantified with pupillography. Forensic Sci. Int. 2020, 317, 110559. [Google Scholar] [CrossRef]
  68. Monticelli, F.C.; Tutsch-Bauer, E.; Hitzl, W.; Keller, T. Pupil function as a parameter for assessing impairment of the central nervous system from a traffic-medicine perspective. Leg. Med. 2009, 11 (Suppl. S1), S331–S332. [Google Scholar] [CrossRef]
  69. Manning, B.; Hayley, A.C.; Catchlove, S.; Shiferaw, B.; Stough, C.; Downey, L.A. Effect of CannEpil® on simulated driving performance and co-monitoring of ocular activity: A randomised controlled trial. J. Psychopharmacol. 2023, 37, 472–483. [Google Scholar] [CrossRef] [PubMed]
  70. Casares-López, M.; Ortiz-Peregrina, S.; Castro-Torres, J.J.; Ortiz, C.; Martino, F.; Jiménez, J.R. Assessing the influence of cannabis and alcohol use on different visual functions: A comparative study. Exp. Eye Res. 2022, 224, 109231. [Google Scholar] [CrossRef]
  71. McCartney, D.; Suraev, A.S.; Doohan, P.T.; Irwin, C.; Kevin, R.C.; Grunstein, R.R.; Hoyos, C.M.; McGregor, I.S. Effects of cannabidiol on simulated driving and cognitive performance: A dose-ranging randomised controlled trial. J. Psychopharmacol. 2022, 36, 1338–1349. [Google Scholar] [CrossRef]
  72. Grabe, H.J.; Wolf, T.; Grätz, S.; Laux, G. The influence of polypharmacological antidepressive treatment on central nervous information processing of depressed patients: Implications for fitness to drive. Neuropsychobiology 1998, 37, 200–204. [Google Scholar] [CrossRef]
  73. Casares-López, M.; Ortiz-Peregrina, S.; Ortiz, C.; Castro-Torres, J.J.; Anera, R.G. Comparison of the influence of alcohol and cannabis on the dynamics of the accommodative response. Graefe’s Arch. Clin. Exp. Ophthalmol. 2023, 261, 2281–2289. [Google Scholar] [CrossRef]
  74. Casares-López, M.; Castro-Torres, J.J.; Martino, F.; Ortiz-Peregrina, S.; Ortiz, C.; Anera, R.G. Contrast sensitivity and retinal straylight after alcohol consumption: Effects on driving performance. Sci. Rep. 2020, 10, 13599. [Google Scholar] [CrossRef] [PubMed]
  75. Martino, F.; Castro-Torres, J.J.; Casares-López, M.; Ortiz-Peregrina, S.; Ortiz, C.; Anera, R.G. Deterioration of binocular vision after alcohol intake influences driving performance. Sci. Rep. 2021, 11, 8904. [Google Scholar] [CrossRef] [PubMed]
  76. Ortiz-Peregrina, S.; Ortiz, C.; Casares-López, M.; Jiménez, J.R.; Anera, R.G. Effects of cannabis on visual function and self-perceived visual quality. Sci. Rep. 2021, 11, 1655. [Google Scholar] [CrossRef] [PubMed]
  77. Schumann, J.; Perkins, M.; Dietze, P.; Nambiar, D.; Mitra, B.; Gerostamoulos, D.; Drummer, O.H.; Cameron, P.; Smith, K.; Beck, B. The prevalence of alcohol and other drugs in fatal road crashes in Victoria, Australia. Accid. Anal. Prev. 2021, 153, 105905. [Google Scholar] [CrossRef]
  78. Jones, A.W.; Holmgren, A.; Kugelberg, F.C. Driving under the influence of central stimulant amines: Age and gender differences in concentrations of amphetamine, methamphetamine, and ecstasy in blood. J. Stud. Alcohol Drugs 2008, 69, 202–208. [Google Scholar] [CrossRef] [PubMed]
  79. Borriello, R.; Carfora, A.; Cassandro, P.; Petrella, R. A five years study on drug-related deaths in Campania (Italy). Ann. Ist. Super. Sanita 2014, 50, 328–333. [Google Scholar]
  80. Maatz, K.R. Driving inability after drug use. Blutalkohol 2006, 43, 451–465. [Google Scholar]
  81. Legal Approaches to Drugs and Driving Topic Overview. European Monitoring Center for Drug and Drug Addiction. Available online: https://www.emcdda.europa.eu/publications/topic-overviews/legal-approaches-to-drugs-and-driving/html_en (accessed on 1 October 2023).
  82. Favretto, D.; Visentin, S.; Stocchero, G.; Vogliardi, S.; Snenghi, R.; Montisci, M. Driving under the influence of drugs: Prevalence in road traffic accidents in Italy and considerations on per se limits legislation. Traffic Inj. Prev. 2018, 19, 786–793. [Google Scholar] [CrossRef]
  83. Wolff, K.; Brimblecombe, R.; Forfar, J.; Forrest, A.; Gilvarry, E.; Johnston, A.; Morgan, J.; Osselton, M.; Read, L.; Taylor, D. Driving under the Influence of Drugs: Report from the Expert Panel on Drug Driving; Department for Transport: London, UK, 2013.
Figure 1. (a) List of target substances; (b) description of analytical procedures applied to analyze biological samples.
Separations 10 00589 g001
Figure 2. Distribution of road traffic related deaths from 2013 to 2022.
Separations 10 00589 g002
Figure 3. Distribution of the 74 DUI/DUID cases throughout the months.
Separations 10 00589 g003
Figure 4. Distribution of ethanol (Et-OH), licit/illicit drugs among 228 traffic-related deaths occurred in Campania (Italy) over the ten-year study period, from 2013 to 2022.
Separations 10 00589 g004
Figure 5. The distribution of drugs among (a) the 12 victims with poly-drugs intake, and (b) the 27 victims positive to alcohol and drugs together.
Separations 10 00589 g005
Figure 6. (a) Gas head-space chromatogram coupled with a flame ionization detector (HS/GC- FID) with isobutyl alcohol as the internal standard for blood alcohol concentration (BAC); (b) gas chromatograms coupled with mass spectrometry (GC/MS) performed in SIM mode for cocaine and metabolites detection in urine samples.
Separations 10 00589 g006
Table 1. Age and gender distribution of the 228 victims and of the 106 cases occurred in Campania from 2013 to 2022.
Age GroupTotal VictimsTotal Positive Victims
YearsNo. (%)No. (%)
TotalFemaleMaleTotalFemaleMale
<1810 (4.4)0 (0) 10 (4.4)2 (1.9)0 (0)2 (1.9)
19–2955 (24.1)3 (1.3)52 (22.8)25 (23.6)1 (0.9)24 (22.6)
30–3946 (20.2)2 (0.9)44 (19.3)26 (24.5)1 (0.9)25 (23.6)
40–4949 (21.5)2 (0.9)47 (20.6)30 (28.3)1 (0.9)29 (27.4)
50–5928 (12.3)2 (0.9)26 (11.4)14 (13.2) 0 (0)14 (13.2)
>6037 (16.2)3 (1.3)34 (14.9)8 (7.5)0 (0)8 (7.5)
Undetermined3 (1.3)2 (0.9) 1 (0.4)1 (0.9)0 (0)1 (0.9)
Total228142141063103
Table 2. Distribution of vehicles involved in the 228 road traffic deaths occurred in Campania (Italy) from 2013 to 2022, the position of the victims, and positive toxicological results.
Occupants.No. of VictimsVehicle (No)No. of Positive VictimsVehicle
Drivers154Car (54)
Motorcycle (79)
Bus (1)
Bicycle (18)
Truck (2)
74Car (28)
Motorcycle (39)
Bus (1)
Bicycle (5)
Truck (1)
Passengers15Car (11)
Motorcycle (4)
8Car (6)
Motorcycle (2)
Pedestrians55Hit by car (52)
Hit by train (3)
21Hit by car (20)
Hit by train (1)
Unknown4 3
Total228 106
Table 3. Distribution of the BAC levels among cases positive for ethanol (Et-OH).
BAC RangePositive Only for Et-OHPositive for Et-OH and Drugs
g/LNo (%)No (%)
<0.5 1 (2.6)1 (3.7)
0.51–0.8 1 (2.6)1 (3.7)
0.81–1.5 9 (23.0)12 (44.4)
>1.5 28 (71.8)13 (48.2)
Total 663927
Disclaimer/Publisher’s Note: The statements, opinions and data contained in all publications are solely those of the individual author(s) and contributor(s) and not of MDPI and/or the editor(s). MDPI and/or the editor(s) disclaim responsibility for any injury to people or property resulting from any ideas, methods, instructions or products referred to in the content.

