1. Introduction
Currently, volatile organic compounds (VOCs) emissions are prominently associated with industries such as petrochemicals, packaging and printing, printing and dyeing textiles, painting, and fine chemicals. Within these sectors, the emissions typically consist of high air volumes with low concentrations of VOCs, and some industries exhibit intermittent emission characteristics, resulting in high processing costs for existing technologies [
1,
2,
3]. Common destructive elimination methods for VOCs include absorption, combustion, adsorption, condensation, biological separation, and membrane separation [
4,
5,
6,
7,
8,
9,
10].
Among these methods, adsorption emerges as a highly effective purification route. The performance of the adsorbent is pivotal in enhancing the adsorption separation effect [
11]. The primary elements influencing the adsorption property of activated carbon are its specific surface area and pore volume [
12,
13]. The most widely used adsorbent is activated carbon. The related research reports on activated carbon are also the most important [
14,
15,
16,
17]. However, the activated carbon desorption process has problems in actual use, such as combustible safety hazards, secondary pollution of condensate, and low energy utilization efficiency [
18,
19]. The condensation method uses the different boiling points of pollutants and carrier gases to cool or pressurize the exhaust gas, condense the substances, and remove them from the gas. The technology of VOC recovery by the condensation method is simple, having a stable recovery effect. It can also be directly condensed under atmospheric pressure with high safety [
20,
21,
22].
This study centers on investigating the buffering effect of activated carbon adsorption on non-steady-state VOCs, particularly in the context of pretreating biological treatment. The presence of non-steady-state flow significantly affects the performance of biological treatment equipment. The buffering effect of activated carbon regulates the concentration of air intake for biological treatment equipment and weakens the fluctuation of air intake for biological treatment [
23,
24,
25].
William et al. extensively investigated the buffering performance and influencing factors of activated carbon adsorption equipment as pretreatment under conditions of stable air intake. These influencing factors encompass inlet air concentration, gas flow rate, relative humidity, pollutant types, etc. [
26,
27]. Marilou et al. studied the instantaneous concentration of activated carbon buffering with toluene under conditions of stable air intake. The impact of no-load gas velocity on it was investigated using the mass balance model and the pore surface diffusion model [
28]. Kye et al. employed the Langmuir model to fit the experimental data on methylene chloride vapor adsorption on an activated carbon fixed bed under conditions of stable air intake. Non-equilibrium and non-adiabatic mathematical models were employed to predict changes in bed temperature and gas concentration during adsorption and desorption. Operating parameters, including inlet air concentration, initial bed temperature, and desorption temperature, were determined [
29].
At present, the research on VOC removal by activated carbon adsorption predominantly concentrates on the optimal working condition with maximum concentration load and stable intake, paying less attention to non-steady-state emissions [
30,
31]. In practical operations, industrial production processes often exhibit non-steady-state emissions. The emission of VOCs is closely related to the operation of the production plant and exhibits characteristics such as substantial concentration changes, intermittent emission, and instantaneous occurrence. Many studies have shown that pristine activated carbon exhibits a positive buffer effect on the dynamic changes of volatile organic compounds. Nevertheless, the adsorption and buffering effects of activated carbon with specific intake concentrations and adsorption equilibrium on dynamic volatile organic compounds are rarely studied.
In this research, a simulation of the diffusion and separation of VOCs in the activated carbon with certain intake concentrations and adsorption equilibrium under non-steady-state emission conditions was created. A pulse load was introduced into activated carbon in equilibrium at a certain air inlet concentration to simulate non-steady-state emissions. The adsorption and desorption experiments were conducted at room temperature. Ethanol and xylene, which have large differences in adsorption capacity and diffusion rate, were selected as the representative target pollutants of VOCs. This study focused on activated carbon in equilibrium with a certain air inlet concentration and investigated its buffering capacity against pulse loads. The research aimed to simulate non-steady-state emissions that occur in actual production processes, analyzing the buffering effects and factors influencing buffering. The mechanism of activated carbon with certain intake concentrations and adsorption equilibrium adsorption buffers under the condition of non-steady-state emission was preliminary explored. This work enhances our understanding of the factors influencing the adsorption of VOCs by activated carbon with specific intake concentrations and adsorption equilibrium. Additionally, it introduces an evaluation index for the buffering performance of activated carbon under pulse load conditions. This study fills the gap in the research on the mechanism of non-steady-state VOC emissions and provides a foundational understanding for technological foundations.
3. Results and Discussion
3.1. Diffusion Adsorption Isotherms and Kinetic Simulation Analysis
The adsorption isotherms for ethanol and xylene on activated carbon are depicted in
Figure 2. It was observed that the adsorption rate of ethanol on activated carbon was higher than that of xylene. The initial linear slope of the adsorption curves for ethanol and xylene on activated carbon was 0.0173 and 0.0028 g/(g·h
−1), respectively, with the former being 6.18 times greater than the latter. The faster diffusion rate of ethanol in air corresponds to a higher diffusion rate in activated carbon, leading to faster mass transfer of ethanol in activated carbon, consistent with the conclusions drawn from the graph.
To explore the dynamic mechanisms of diffusion adsorption of ethanol and xylene on activated carbon, Equations (1)–(3) were introduced in the study. Equation (1) represents the quasi-first-order kinetic equation, Equation (2) represents the quasi-second-order kinetic equation, and Equation (3) represents the Bangham kinetic equation.
where
qt represents the adsorption amount (g/g) at time
t;
qe represents the adsorption amount at equilibrium (g/g);
k1 represents the quasi-first-order adsorption rate constant (min
−1);
k2 represents the quasi-second-order adsorption rate constant (min
−1);
k3 represents the Bangham adsorption rate constant (min
−n); and
n represents the Bangham constant.
The results of fitting three kinetic models for the adsorption of ethanol on activated carbon are presented in
Figure 3, while the results for xylene adsorption are shown in
Figure 4. The parameters obtained from the fitting of each model are summarized in
Table 3.
Compared to quasi-first-order and quasi-second-order kinetic equations, the Bangham kinetic equation exhibited an R2 greater than 0.99, indicating excellent fitting. Additionally, the calculated qe from the Bangham kinetic equation closely matched the experimental qe, suggesting that the adsorption process of ethanol on activated carbon could be well-described by the Bangham model. For xylene adsorption on activated carbon, the R2 values for quasi-first-order, quasi-second-order, and the Bangham kinetic equation were all above 0.99, indicating that all models could describe the adsorption process of xylene on activated carbon. This was attributed to the slow diffusion and mass transfer rates of xylene within activated carbon, resulting in significant mass transfer and adsorption resistance during the experimental period. Consequently, adsorption was primarily in the initial linear stage, characterized by rapid adsorption. The models exhibited similar fitting results at this stage, indicating that they could be effectively simplified to a straight line. In comparison, the Bangham kinetic equation yielded an R2 closer to 1. The calculated qe closely matched the experimental qe. This indicates that, similarly, the adsorption process of xylene on activated carbon was best represented by the Bangham kinetic equation.
The above results demonstrate that the Bangham kinetic equation provides a more accurate description of the adsorption kinetics of ethanol and xylene on activated carbon. This underscores that the pore diffusion model effectively captured the actual adsorption scenario. Pore diffusion emerges as the rate-determining step in the adsorption process.
3.2. The Basis of Pulse Load Buffering by Activated Carbon with Certain Intake Concentrations and Adsorption Equilibrium
The activated carbon was divided into three groups: A
1, A
2, and A
3. The adsorbate was ethanol. When the cross-sectional wind speed was 0.3 m/s, the inlet air concentrations were 0, 200, and 400 mg/m
3, respectively. The control group had an inlet air concentration of 0 mg/m
3. After the adsorption of three groups of activated carbon was balanced, a pulse load was introduced. The pulse time was 2 min. The pulse concentration was 4000 mg/m
3. The mass of the three activated carbons increased after the introduction of pulse gas. Three kinds of activated carbon exhibited adsorption capacity for pulse loading.
Table 4 lists the adsorption capacity of three groups of activated carbon.
Adsorption capacity potential refers to the difference between the concentration equilibrium capacity of the gaseous pollutants to be treated and the capacity of the pollutants adsorbed on the activated carbon. The activated carbon with specific intake concentration and adsorption equilibrium retains a certain amount of adsorption capacity margin for balancing pulse load concentration. Adsorption capacity margin is the basis of activated carbon buffering. Under specific temperature conditions, the saturated adsorption capacity of activated carbon varies with different concentrations of ethanol. The difference between the adsorption capacity of activated carbon with varying adsorption capacities and the concentration of pulse load represents the buffer capacity potential for pulse load, as shown in
Figure 5.
It can be seen from
Figure 5 that there is a difference Δ in the saturated adsorption capacity of activated carbon for various ethanol inlet concentrations at the same temperature. Δ indicates that the activated carbon saturated with low inlet air concentrations retains adsorption capacity for high inlet air concentrations. This ability forms the foundation for the buffering performance of activated carbon and serves as the driving force for the adsorption of activated carbon to pulse concentration. Δ represents the capacity difference of activated carbon after adsorption saturation at two stable inlet concentrations. Adsorption capacity potential is the buffer capacity of saturated activated carbon for handling high-concentration pulse loads at a stable inlet concentration. Δ is the reason for the existence of adsorption capacity potential. The value of Δ represents the adsorption capacity potential.
Currently, three pulse attenuation parameters are defined and studied, respectively. R1 represents the ratio of the maximum concentration released after the pulse to the pulse concentration. R2 signifies the ratio of the time corresponding to the maximum concentration released after the pulse to the pulse time. R3 is the ratio of total adsorbate output after a pulse to total adsorbate input after a pulse.
R1 is the most commonly employed evaluation parameter for pulse buffering. Both William et al. and Marilou et al. utilized R1 as the evaluation parameter.
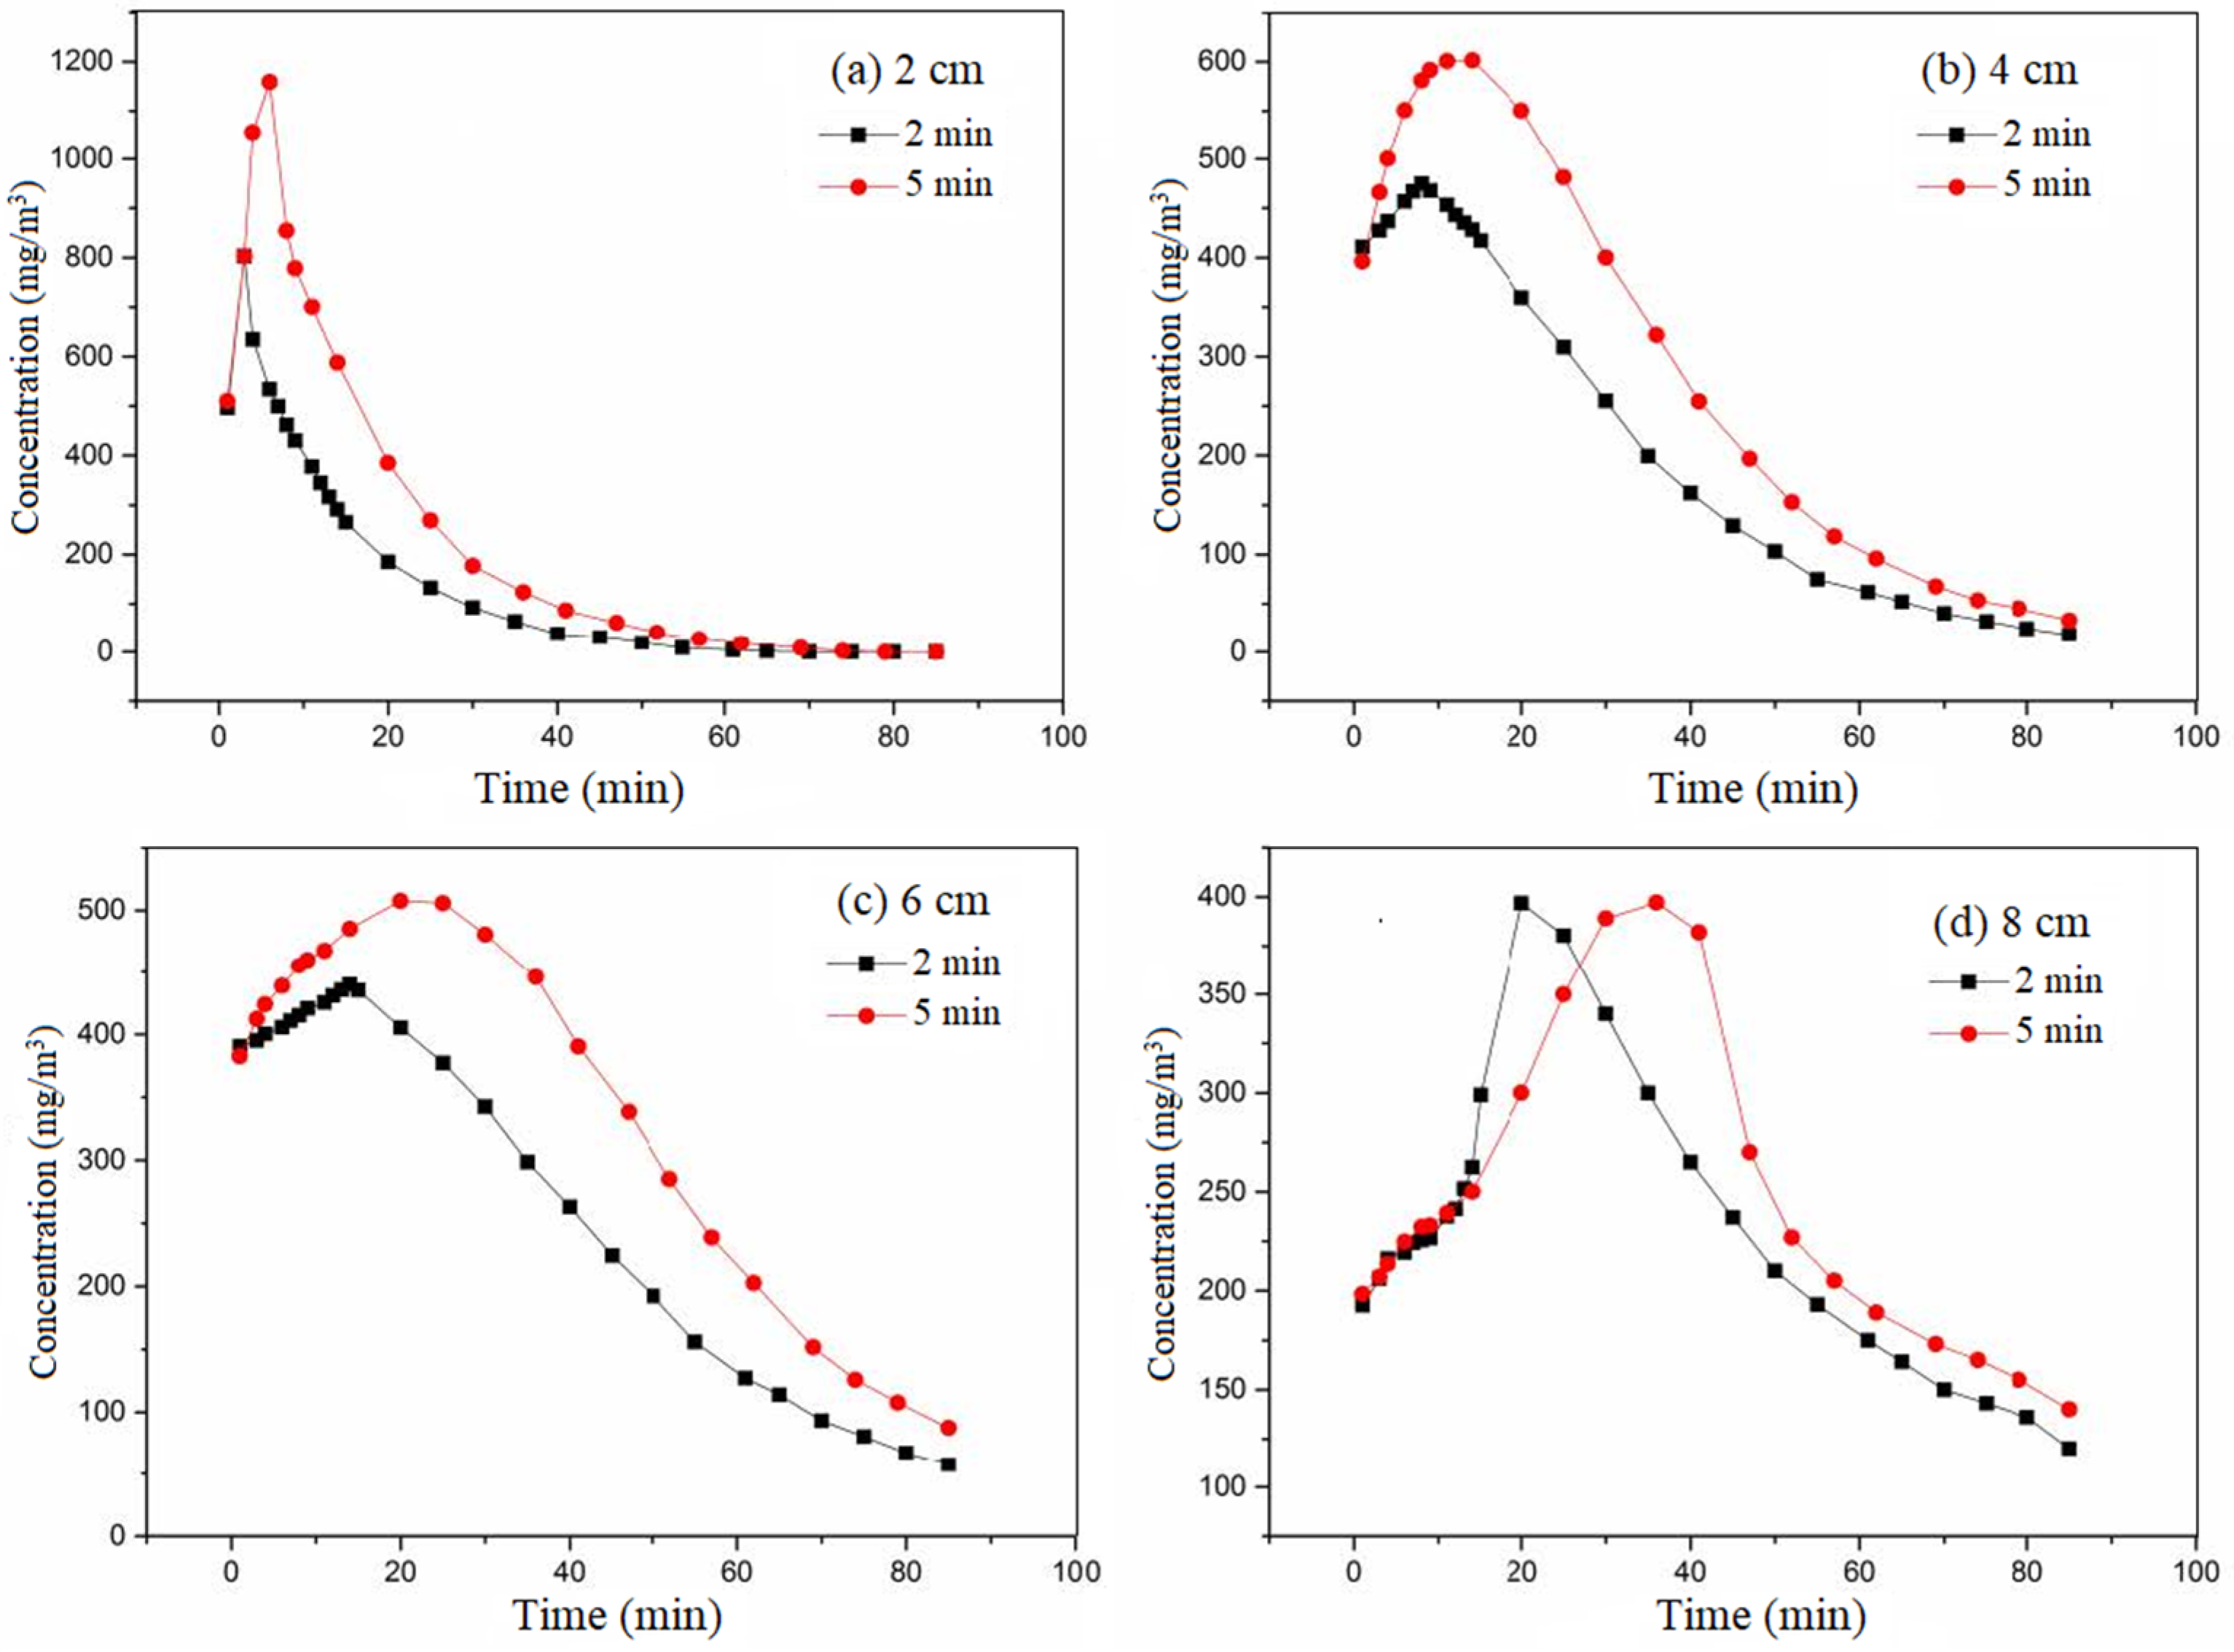
3.3. Influence of Equilibrium Adsorption Concentration on Pulse Load Buffering
Activated carbon with equilibrium adsorption concentrations of 200 and 400 mg/m
3 was selected. The cross-sectional wind speed was set at 0.3 m/s. The pulse concentration of ethanol was 20 times the original equilibrium concentration. The pulse time was 2 min. The variation curve of outlet concentration after pulse under different equilibrium adsorption concentrations at different activated carbon bed heights is shown in
Figure 6.
It can be seen from
Figure 6 that when ethanol gas with a pulse concentration was introduced at the starting point, the outlet concentration at the end of the carbon bed did not immediately rise directly. The outlet concentration did not decrease quickly with the cessation of ethanol gas entry but showed a lag effect. Obviously, the detection concentration follows a parabolic rise after the end of the pulse and then decreases slowly.
The input loads were 0.11 and 0.22 g, respectively, while the adsorption potential of activated carbon based on inlet concentration was 48.72 g and 14.56 g, respectively. The input load was less than the adsorption potential of activated carbon. Therefore, activated carbon had a certain buffering capacity for pulse loads. At this time, the adsorption rate exceeded the desorption rate. When the pulse gas was introduced, the detection concentration did not immediately increase. High-concentration ethanol gas was adsorbed by activated carbon. When ethanol intake was stopped, the detection concentration maintained a slow upward trend. This occurred because, when clean gas was introduced, the intake concentration was lower than the ethanol concentration adsorbed on activated carbon. The desorption rate began to exceed the adsorption rate, leading to desorption. The residual ethanol gas in the activated carbon and the ethanol gas adsorbed on the activated carbon were slowly carried out with the clean gas. While the concentration reached a certain value, a large number of pollutant molecules were desorbed, so the detection concentration decreased. The peak concentration was significantly lower than the pulse concentration, which indicated the pulse was buffered.
When the equilibrium adsorption concentration was 400 mg/m3, the concentration released after a pulse at different carbon bed heights was higher than 200 mg/m3. This suggests that the equilibrium adsorption concentration had an effect on the post-pulse release concentration. Pulse gas was introduced and buffered by activated carbon. The buffer is based on the adsorption potential of the adsorbed equilibrium activated carbon. Under identical conditions, the larger the equilibrium concentration, the smaller the adsorption potential, and the larger the amount of overflow. When the equilibrium adsorption concentration was 400 mg/m3, the concentration released after the pulse was higher than 200 mg/m3.
The effect of equilibrium adsorption concentration on R
1 is shown in
Table 5.
R1, 200/R1, 400 was less than 1. R1 represents the ability of activated carbon with a specific intake concentration and adsorption equilibrium to decrease pulse concentration. The smaller R1, the better the buffer attenuation ability. The larger the equilibrium concentration, the weaker the buffer attenuation ability, the smaller the adsorption potential, the smaller the pulse load that can be accommodated, and the overflow amount increases. The higher the carbon bed height, the greater the amount of activated carbon, the greater the adsorption capacity, and the smaller the overflow amount. Consequently, as the height increases, the buffer attenuation ability of activated carbon strengthens.
The effect of equilibrium adsorption concentration on R
2 is shown in
Table 6.
R2, 400 did not exceed R2, 200, except that the height of carbon bed is 2 cm. R2 represents the average residence time of pulse load in activated carbon. The larger the R2 value, the smaller the equilibrium concentration, and the better the buffer attenuation ability. The smaller the equilibrium concentration, the greater the adsorption potential, the longer the overflow time and the longer the residence time in activated carbon. Therefore, the buffer attenuation ability was better when the equilibrium concentration was 200 mg/m3.
The effect of equilibrium adsorption concentration on R
3 is shown in
Table 7.
When the time periods were 10 min and 20 min, respectively, R3, 200/R3, 400 fluctuated significantly at different heights of the carbon bed. Both R3, 200 and R3, 400 were related to the length of the activated carbon bed. When the time period was 70 min, both R3, 200 and R3, 400 were less than 1. At different heights, R3, 200/R3, 400 fluctuated within the range of 0.7 to 0.85, indicating a tendency towards equilibrium during this time period.
Under constant ventilation at room temperature, some adsorbate that has been adsorbed will be blown out. The longer the ventilation time, the greater the blow-off amount. Some adsorbates within activated carbon desorb. The desorption amount includes not only part of the pulse input amount but also the amount of activated carbon in partial equilibrium adsorption. Therefore, with the increase in time, R3 exceeded 1. The greater the height, the greater the adsorption margin, resulting in a lesser amount of desorption. Therefore, R3 gradually decreased with the increase in carbon bed height.
R3 represents the adsorption capacity of activated carbon with a specific intake concentration and the adsorption equilibrium for adsorbate with a pulse concentration, that is, the adsorption potential of activated carbon. Theoretically, the smaller the R3 value, the larger the adsorption capacity and the greater the adsorption potential. Therefore, when the equilibrium adsorption concentration was 200 mg/m3, the buffer capacity was better. The conclusions of R1, R2, and R3 are consistent.
3.4. Influence of Pulse Time on Pulse Load Buffering
The pulse time was 2 min and 5 min, respectively. The adsorbate used was ethanol. The cross-sectional wind speed was set at 0.3 m/s. The equilibrium adsorption concentration was 400 mg/m
3. The multiple of the pulse concentration was 10. The variation curve of outlet concentration after pulse under different pulse times at different activated carbon bed heights is shown in
Figure 7.
The effect of pulse time is the relationship between the input pulse load and the adsorption potential of the carbon layer. It can be seen from
Figure 7 that the lag effect also occurs after the pulse. The input loads of the pulse for 2 min and 5 min were 0.05 and 0.14 g, respectively. These values were less than the adsorption potential of activated carbon calculated by inlet concentration, which was 14.56 g. Activated carbon exhibited buffering capacity. The difference in detection concentration between a pulse time of 5 min and a pulse time of 2 min decreased with increasing height. Additionally, the peak concentration decreased significantly. When the height was 8 cm, the concentration in 5 min was approximately equal to that in 2 min. This indicates that the release concentration after the pulse was influenced by the synergistic effect of carbon bed height and pulse time. When the height was small, the longer the pulse time, the higher the release concentration after the pulse. When the height was large, the release concentration after the pulse had little correlation with the length of the pulse time. Under the same other conditions, the longer the pulse time, the greater the pulse load. When the height was small, the adsorption potential was small. The amount of pulse entering exceeded the adsorption capacity. As the carbon bed height increased, the adsorption potential increased, and the difference between the amount of pulse and the adsorption potential of activated carbon decreased. When the carbon bed height reached the critical value, the adsorption potential also reached the critical value. Consequently, the difference between the 5 min concentration and the 2 min concentration decreased with the increase in carbon bed height, and the peak concentration decreased significantly.
The longer the pulse time, the slower the concentration changes, and the longer the time required to reach the peak. Firstly, with a long pulse time, the total amount of ethanol entering the activated carbon was large at the same pulse concentration. Simultaneously, at the same inlet air velocity, the mass transfer time and residence time were longer. As a result, the detection concentration changed slowly and took longer to reach its peak. Conversely, under the condition of a short pulse time, when the pulse was stopped and clean air was introduced, the control group with a long pulse time was still injected with pulsed ethanol gas. Therefore, the change in detection concentration lags behind for a period of time.
The effect of pulse time on R
1 is shown in
Table 8.
With the increase in height of the carbon bed, R1, 2 min and R1, 5 min were getting closer and gradually increasing. R1 represents the ability of activated carbon with a specific intake concentration and adsorption equilibrium to reduce pulse concentration. The smaller R1, the better the buffer attenuation ability. In general, R1, 2 min ≤ R1, 5 min. When the pulse time was 2 min, the buffer attenuation ability of activated carbon with certain intake concentrations and adsorption equilibrium was better. The adsorption potential of activated carbon has limitations. Excessive impulse loads would result in overflow. Therefore, for the same carbon bed height, the amount of a 5 min pulse was greater than that of a 2 min pulse. The overflow volume was large, indicating the weak buffer attenuation ability of activated carbon. The higher the carbon bed height, the greater the amount of activated carbon, the greater the adsorption capacity, and the smaller the overflow amount. Therefore, with the increase in height, the buffer attenuation ability of activated carbon became stronger.
The effect of pulse time on R
2 is shown in
Table 9.
R2, 5 min did not exceed R2, 2 min. R2 represents the residence time of ethanol in activated carbon. The longer the corresponding time of the maximum concentration released after the pulse, the longer the delay of the pulse peak, the greater the R2 value, and the better the buffer attenuation ability. This leads to the conclusion that the buffer attenuation ability is better with shorter pulse times. The amount of a 5 min pulse was greater than that of a 2 min pulse. The capacity of activated carbon was insufficient, resulting in a short residence time for activated carbon. When the height was small, the migration and diffusion paths of ethanol molecules in activated carbon were very short. The difference in residence time caused by the two pulse times was not obvious. Therefore, R2, 5 min and R2, 2 min were almost equal at the carbon layer height of 2 cm.
The effect of pulse time on R
3 is shown in
Table 10.
R3 represents the adsorption capacity of activated carbon with a certain intake concentration and adsorption equilibrium for pulse concentration adsorbent. In theory, the smaller the R3 value, the smaller the amount of release after the pulse with the introduction of clean gas, and the larger the adsorption potential. Therefore, when the pulse time was 5 min, the buffer attenuation ability was optimal. This is contrary to the conclusions of R1 and R2. The reason is that the longer the ventilation time of ethanol, the stronger the attraction of activated carbon to ethanol molecules, making desorption more challenging. From the appearance, the amount of ethanol released decreased, and the adsorption potential increased. For the same height of the carbon bed, the amount of a 5 min pulse was greater than that of a 2 min pulse, resulting in more overflow. However, it can be seen from R3 that the 5 min pulse overflow was less than the pulse load. Activated carbon has greater adsorption capacity and a strong buffer attenuation ability.
R1 represents the ability of activated carbon with a specific intake concentration and adsorption equilibrium to reduce the pulse concentration, reflecting the ability of activated carbon to reduce the pulse peak concentration. R1 cannot accurately reflect the adsorption buffer capacity of activated carbon for the whole pulse load. Therefore, the conclusion drawn by R1 is not accurate enough. R2 represents the residence time of the pulse load in activated carbon. R2 is related to the short-term adsorption and desorption ability of activated carbon for pulse adsorbate molecules and the diffusion rate of adsorbate molecules. R2 is a parameter to evaluate the buffer time. Therefore, R2 concludes that it is inconsistent with R3. R3 is the adsorption capacity of activated carbon with a specific intake concentration and adsorption equilibrium based on buffer. R3 comprehensively considers the buffering capacity of activated carbon with specific intake concentration and adsorption equilibrium, which is a relatively comprehensive evaluation parameter.
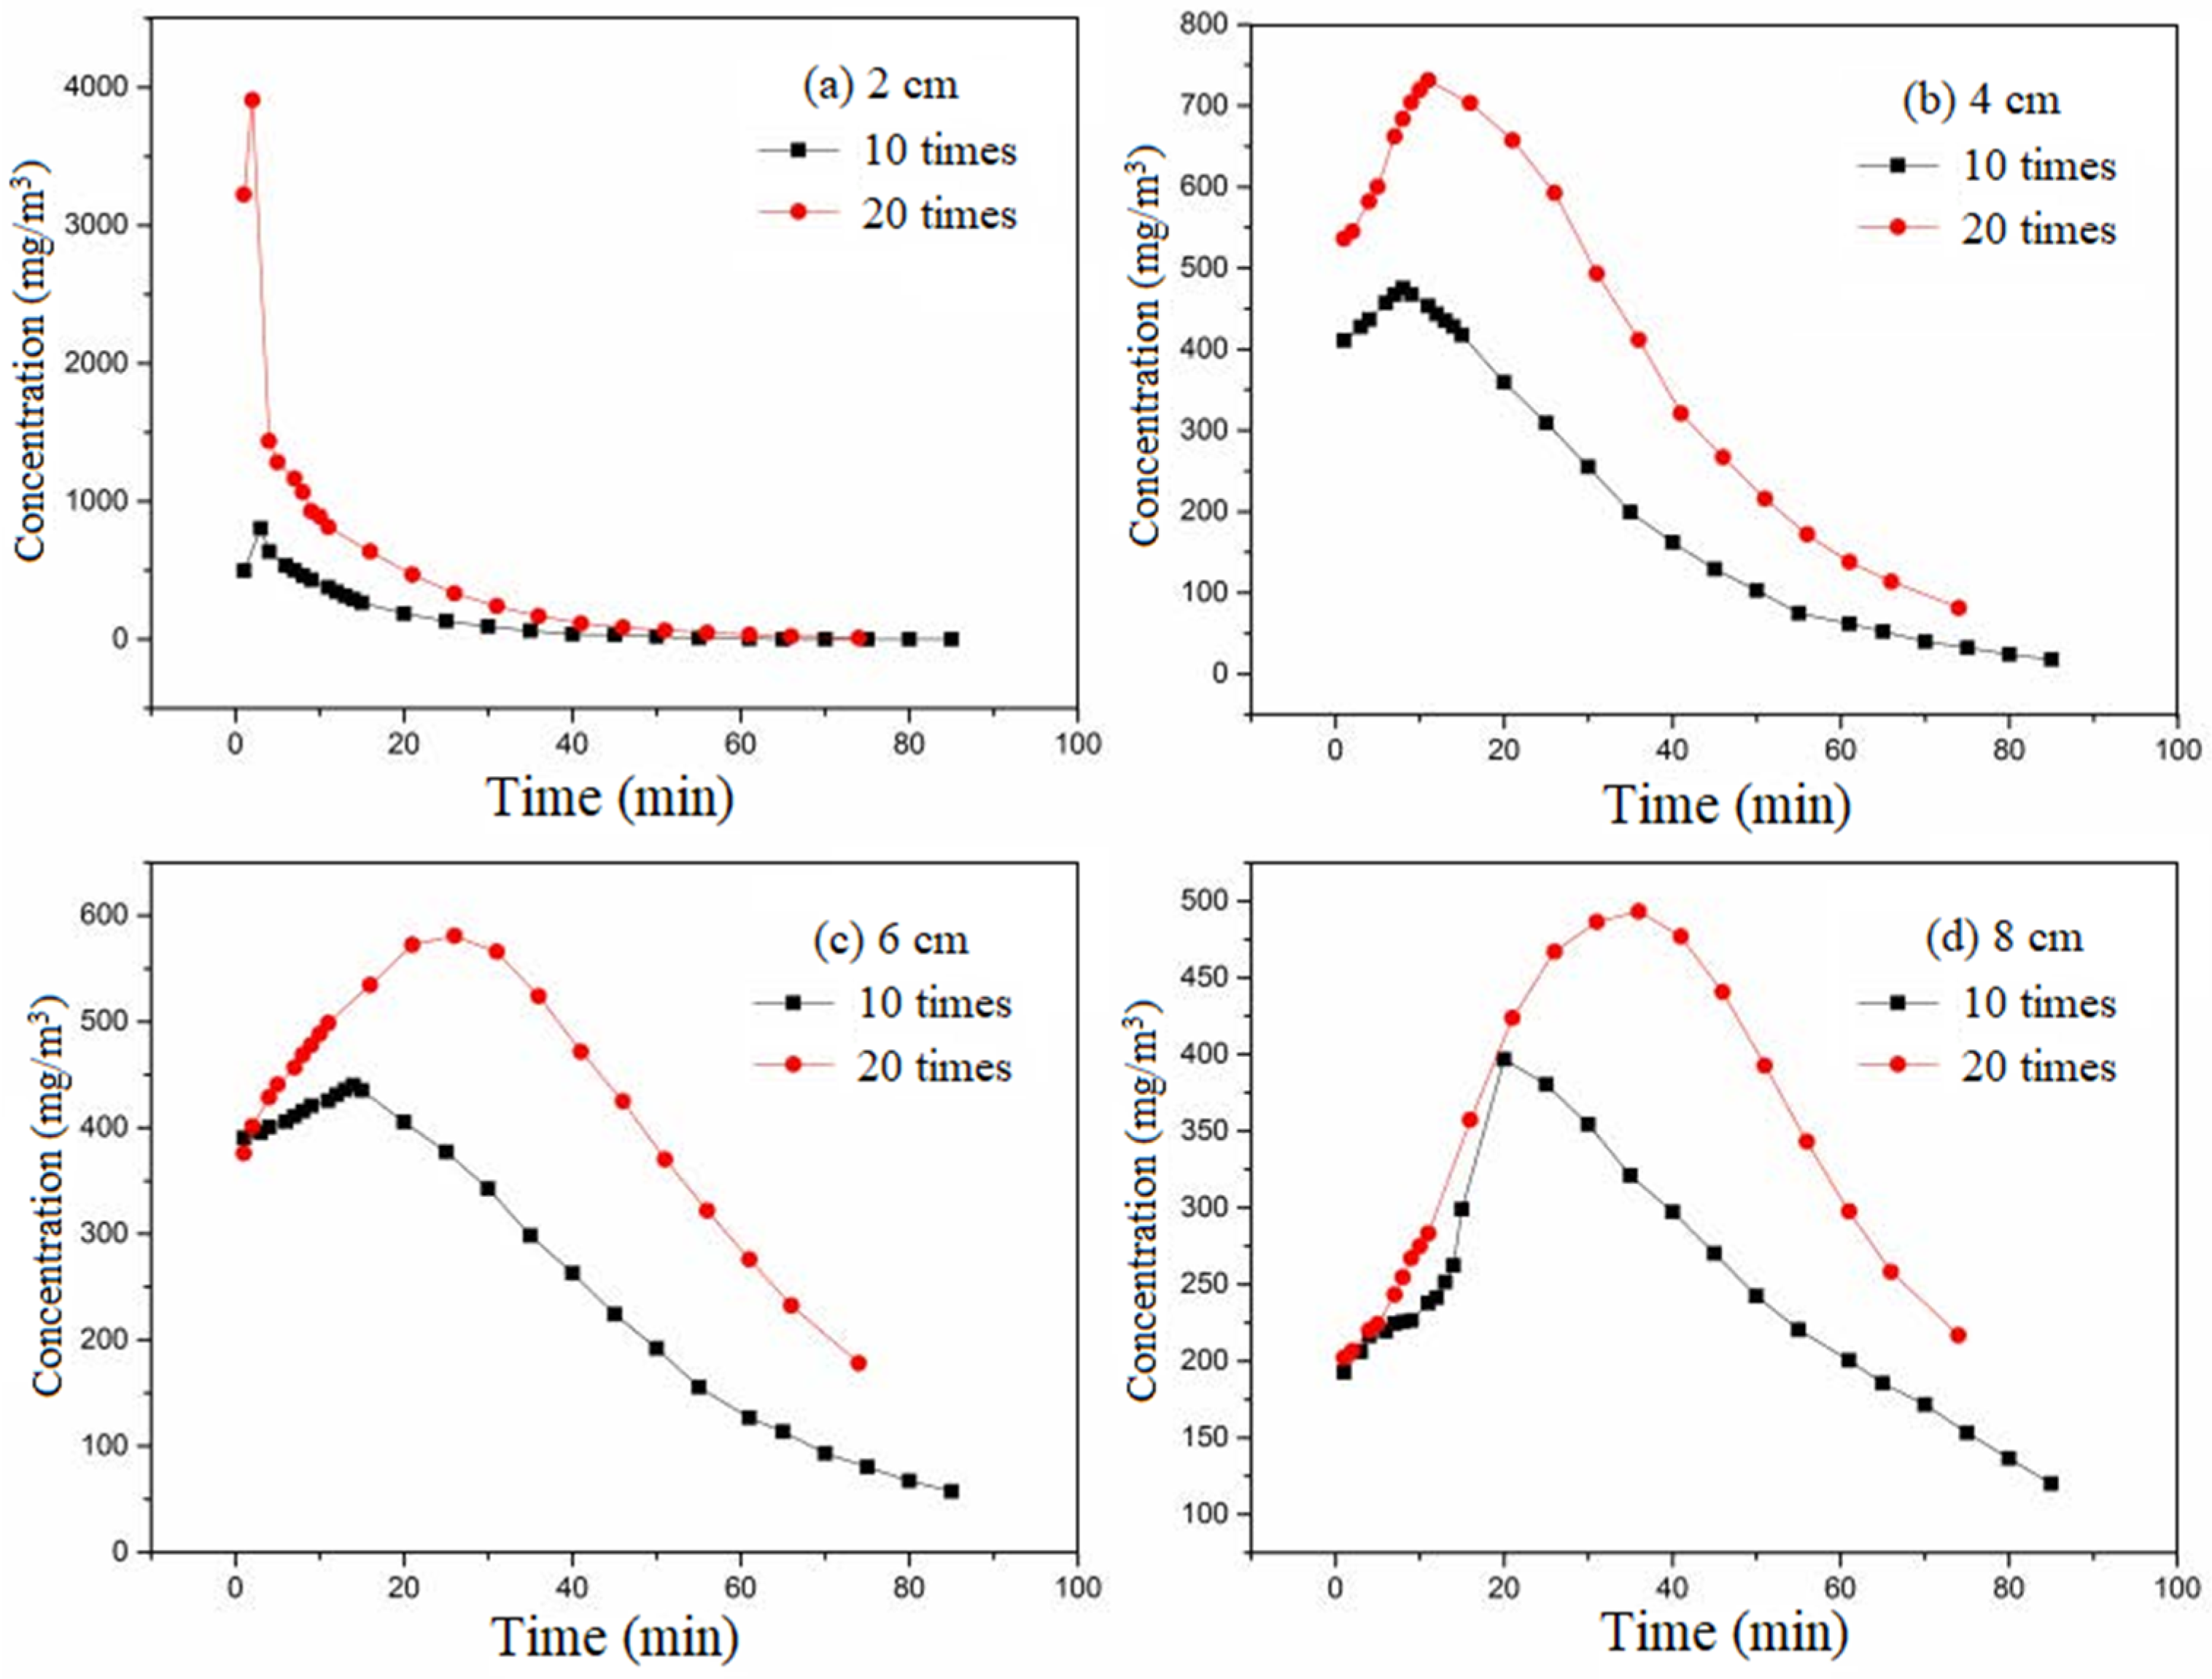
3.5. Influence of Pulse Multiples on Pulse Load Buffering
The ratio of pulse concentration to equilibrium adsorption concentration was 10:1 and 20:1, respectively; that is, the pulse multiple was 10 times and 20 times, respectively. The adsorbate used was ethanol. The cross-sectional wind speed was set at 0.3 m/s. The equilibrium adsorption concentration was 400 mg/m
3. The pulse time was set at 2 min. The variation curve of outlet concentration after pulse under different pulse multiples at different activated carbon bed heights is shown in
Figure 8.
The pulse times were 10 and 20, respectively, and the input loads were 0.11 and 0.22 g, respectively. The adsorption potential of activated carbon based on inlet concentration was 14.56 g. Activated carbon had buffering ability for this pulse. The influence of pulse multiples belongs to the influence of pulse load. The higher the equilibrium adsorption concentration, the smaller the adsorption potential. The larger the pulse multiple, the higher the pulse load into activated carbon, the higher the corresponding concentration, and the longer the time to reach the peak value under the same saturated concentration, pulse time, and cross-sectional wind speed. This is consistent with the effect of pulse time. In contrast to the effect of pulse time on the buffer performance of activated carbon, the driving force was different under this condition. Under the influence of pulse time, the driving force of activated carbon on pulse load adsorption was the same under the two pulse times. However, under the influence of concentration ratio, the adsorption driving force of activated carbon differed between the two ratios. The greater the pulse multiple, the greater the concentration difference, and the greater the driving force. The concentration of 20 times the pulse multiple was greater than 10 times the concentration. The adsorption potential for pulse load increased as the carbon bed height increased. The difference between the amount of pulse entering and the adsorption potential decreased, and the amount of overflow decreased. The difference between the concentration of 20 times of pulse times and that of 10 times of pulse times decreased. The peak concentration decreased significantly.
The effect of pulse multiples on R
1 is shown in
Table 11.
R1, 10/R1, 20 was greater than 1, except the height of the carbon bed was 2 cm. The smaller R1, the better the buffering attenuation ability. When the height was 2 cm, the buffering attenuation ability of 10 times the pulse multiple was stronger than that of 20 times. When the height was greater than 2 cm, the buffering attenuation ability of 20 times the pulse multiple was stronger than that of 10 times. The results show that the smaller the height, the better the buffering capacity of the carbon bed for low multiple pulse loads. The higher the height, the better the buffering capacity for a high multiple-pulse load. It can be seen that for the adsorption device with a certain carbon bed height, there is an optimal value of pulse multiple. For a certain pulse multiple, there is an optimal carbon bed height. This part needs further study.
When the carbon bed height was small, the adsorption potential was small, and the ability to reduce the peak value of the pulse was weak. The number of pulses with a high pulse multiple was higher, the pulse concentration was higher, and the driving force was larger, but the advantage was not obvious. With the increase in carbon bed height, the amount of activated carbon increased, and the adsorption potential of activated carbon increased. At this time, the high pulse multiple pulse concentration was high, and the amount of overflow was also large. However, the driving force was larger, the adsorption capacity for pulse load was enhanced, and the concentration of overflow was smaller than that of pulse input. The peak value was reduced significantly, and R1 was smaller.
The effect of pulse multiples on R
2 is shown in
Table 12.
R2, 10/R2, 20 was less than or equal to 1. R2 represents the residence time of ethanol in activated carbon. The larger the R2 value, the better the buffer attenuation ability. Therefore, when the pulse multiple was 20 times, the buffer attenuation ability of activated carbon was better. Under the condition of high pulse multiple, the pulse load into activated carbon was high, and the adsorption force was large. For the same carbon bed height, the adsorption potential of activated carbon with certain intake concentrations and adsorption equilibrium was limited. Compared with 10 times the pulse load, 20 times the pulse load had a larger adsorption force and a longer residence time in activated carbon. When the carbon bed height was small, the migration and diffusion paths of ethanol molecules in activated carbon were very short. The difference in residence time caused by the two pulse times was not obvious. Therefore, at the height of 2 cm of the carbon layer, R2, 10 and R2, 20 were almost equal.
The effect of pulse multiples on R
3 is shown in
Table 13.
Except for the height of the carbon bed of 2 cm, R3, 10/R3, 20 was about 1.3. The smaller the R3, the better the buffer attenuation ability. The adsorption and buffering properties of activated carbon were investigated by parameter R3. For the adsorption device with a certain carbon bed height, there is an optimal value of pulse multiple. For a certain pulse multiple, there is an optimal carbon bed height.
When the carbon bed height was small, the adsorption potential was small, and the pulse reduction ability was very weak. At this time, the number of pulses with a high pulse multiple was higher, the pulse concentration was higher, and the amount of overflow was also larger. Although the driving force was large, the advantage was not obvious. With the increase in carbon bed height, the amount of activated carbon increased, and the adsorption potential of activated carbon increased. At this time, the number of pulses with a high pulse multiple was higher, the pulse concentration was higher, and the amount of overflow was also larger. However, the driving force was larger, the adsorption capacity for pulse load was enhanced, the amount of overflow was smaller than that of pulse input, and R3 was smaller.
The effect of pulse multiple on the buffer attenuation of activated carbon with specific intake concentration and adsorption equilibrium was related to the height of the carbon bed. When the carbon bed height was low, the buffer attenuation ability was better when the pulse multiple was low. When the carbon bed height was high, the buffer attenuation ability was better when the pulse multiple was high. When the carbon bed height was low, the adsorption potential was small, the buffer attenuation ability was weak, the pulse overflow was large, and the pulse concentration was high. At the same time, the path of ethanol molecules in the pores of activated carbon was short, and the residence time was short. Although the driving force was large, the advantage was not obvious. When the height of the carbon bed was high, the amount of activated carbon increased, and the adsorption potential increased. At this time, the driving force plays a leading role. The adsorption capacity for pulse loading was enhanced. Under the condition of high pulse multiple, the driving force was large, the adsorption of activated carbon was enhanced, the amount of overflow was smaller than that of pulse entry, and the adsorption capacity was enhanced. The diffusion and migration paths of ethanol molecules in the pores of activated carbon were longer, and the residence time became longer.
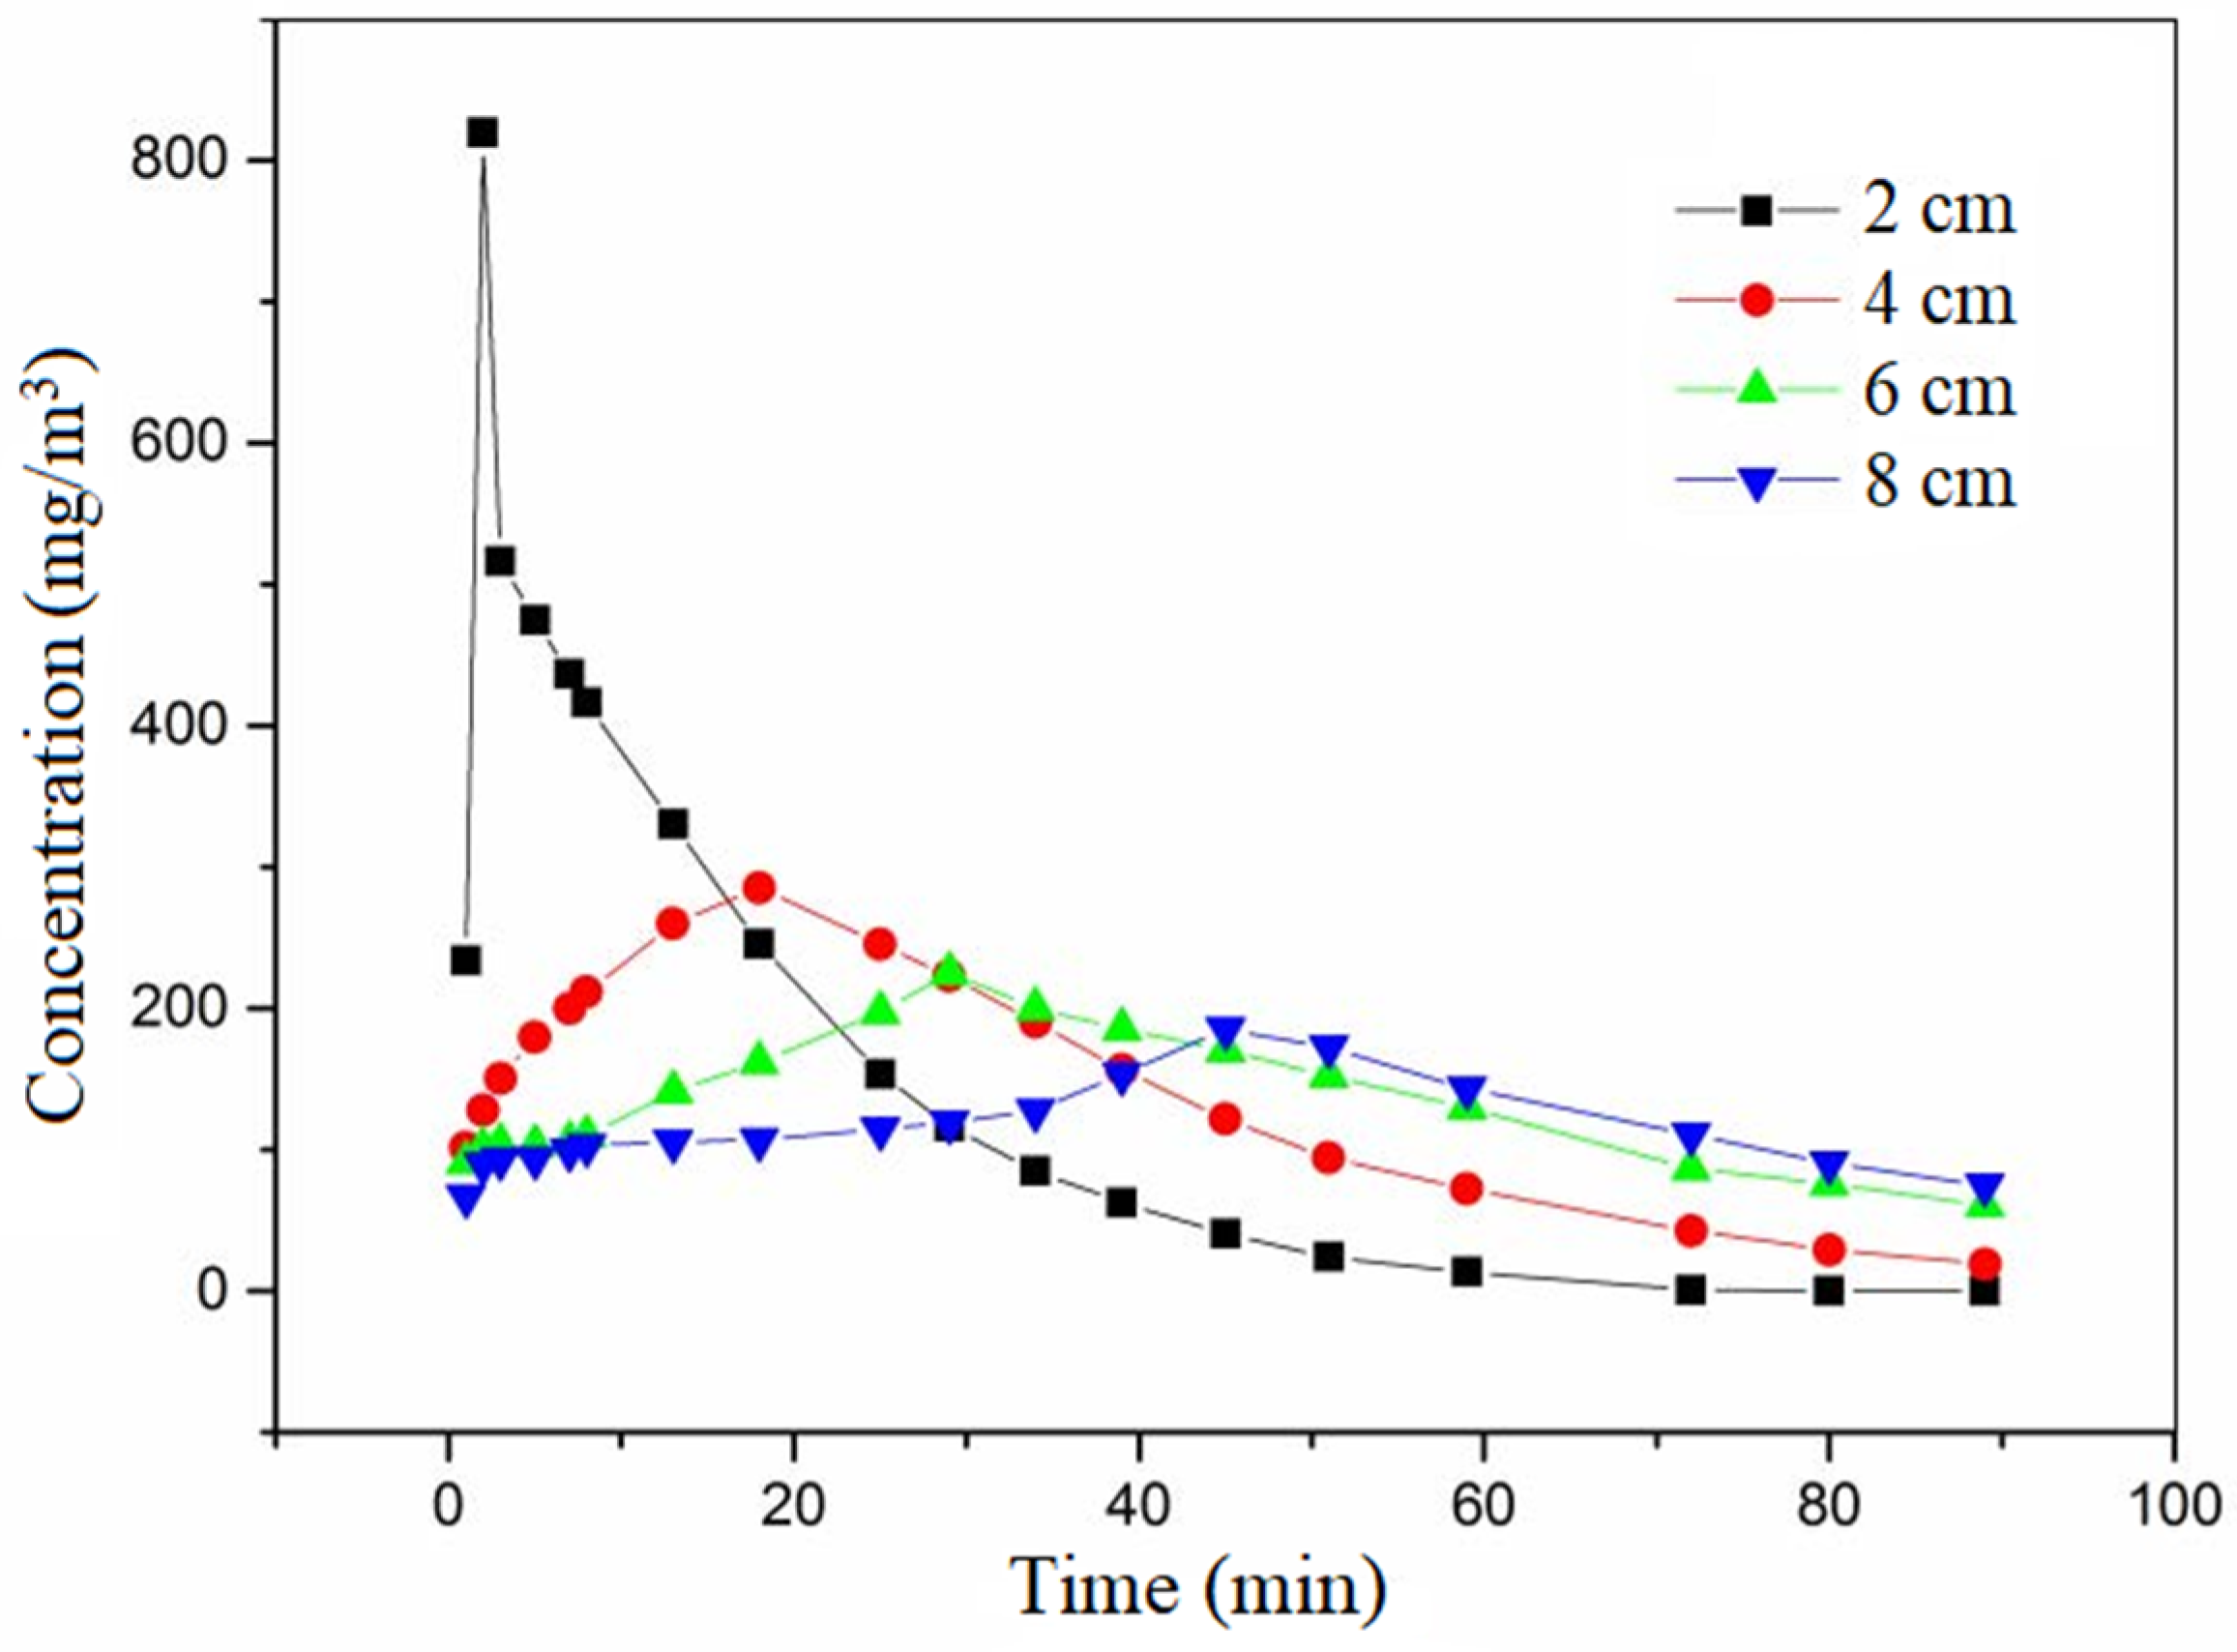
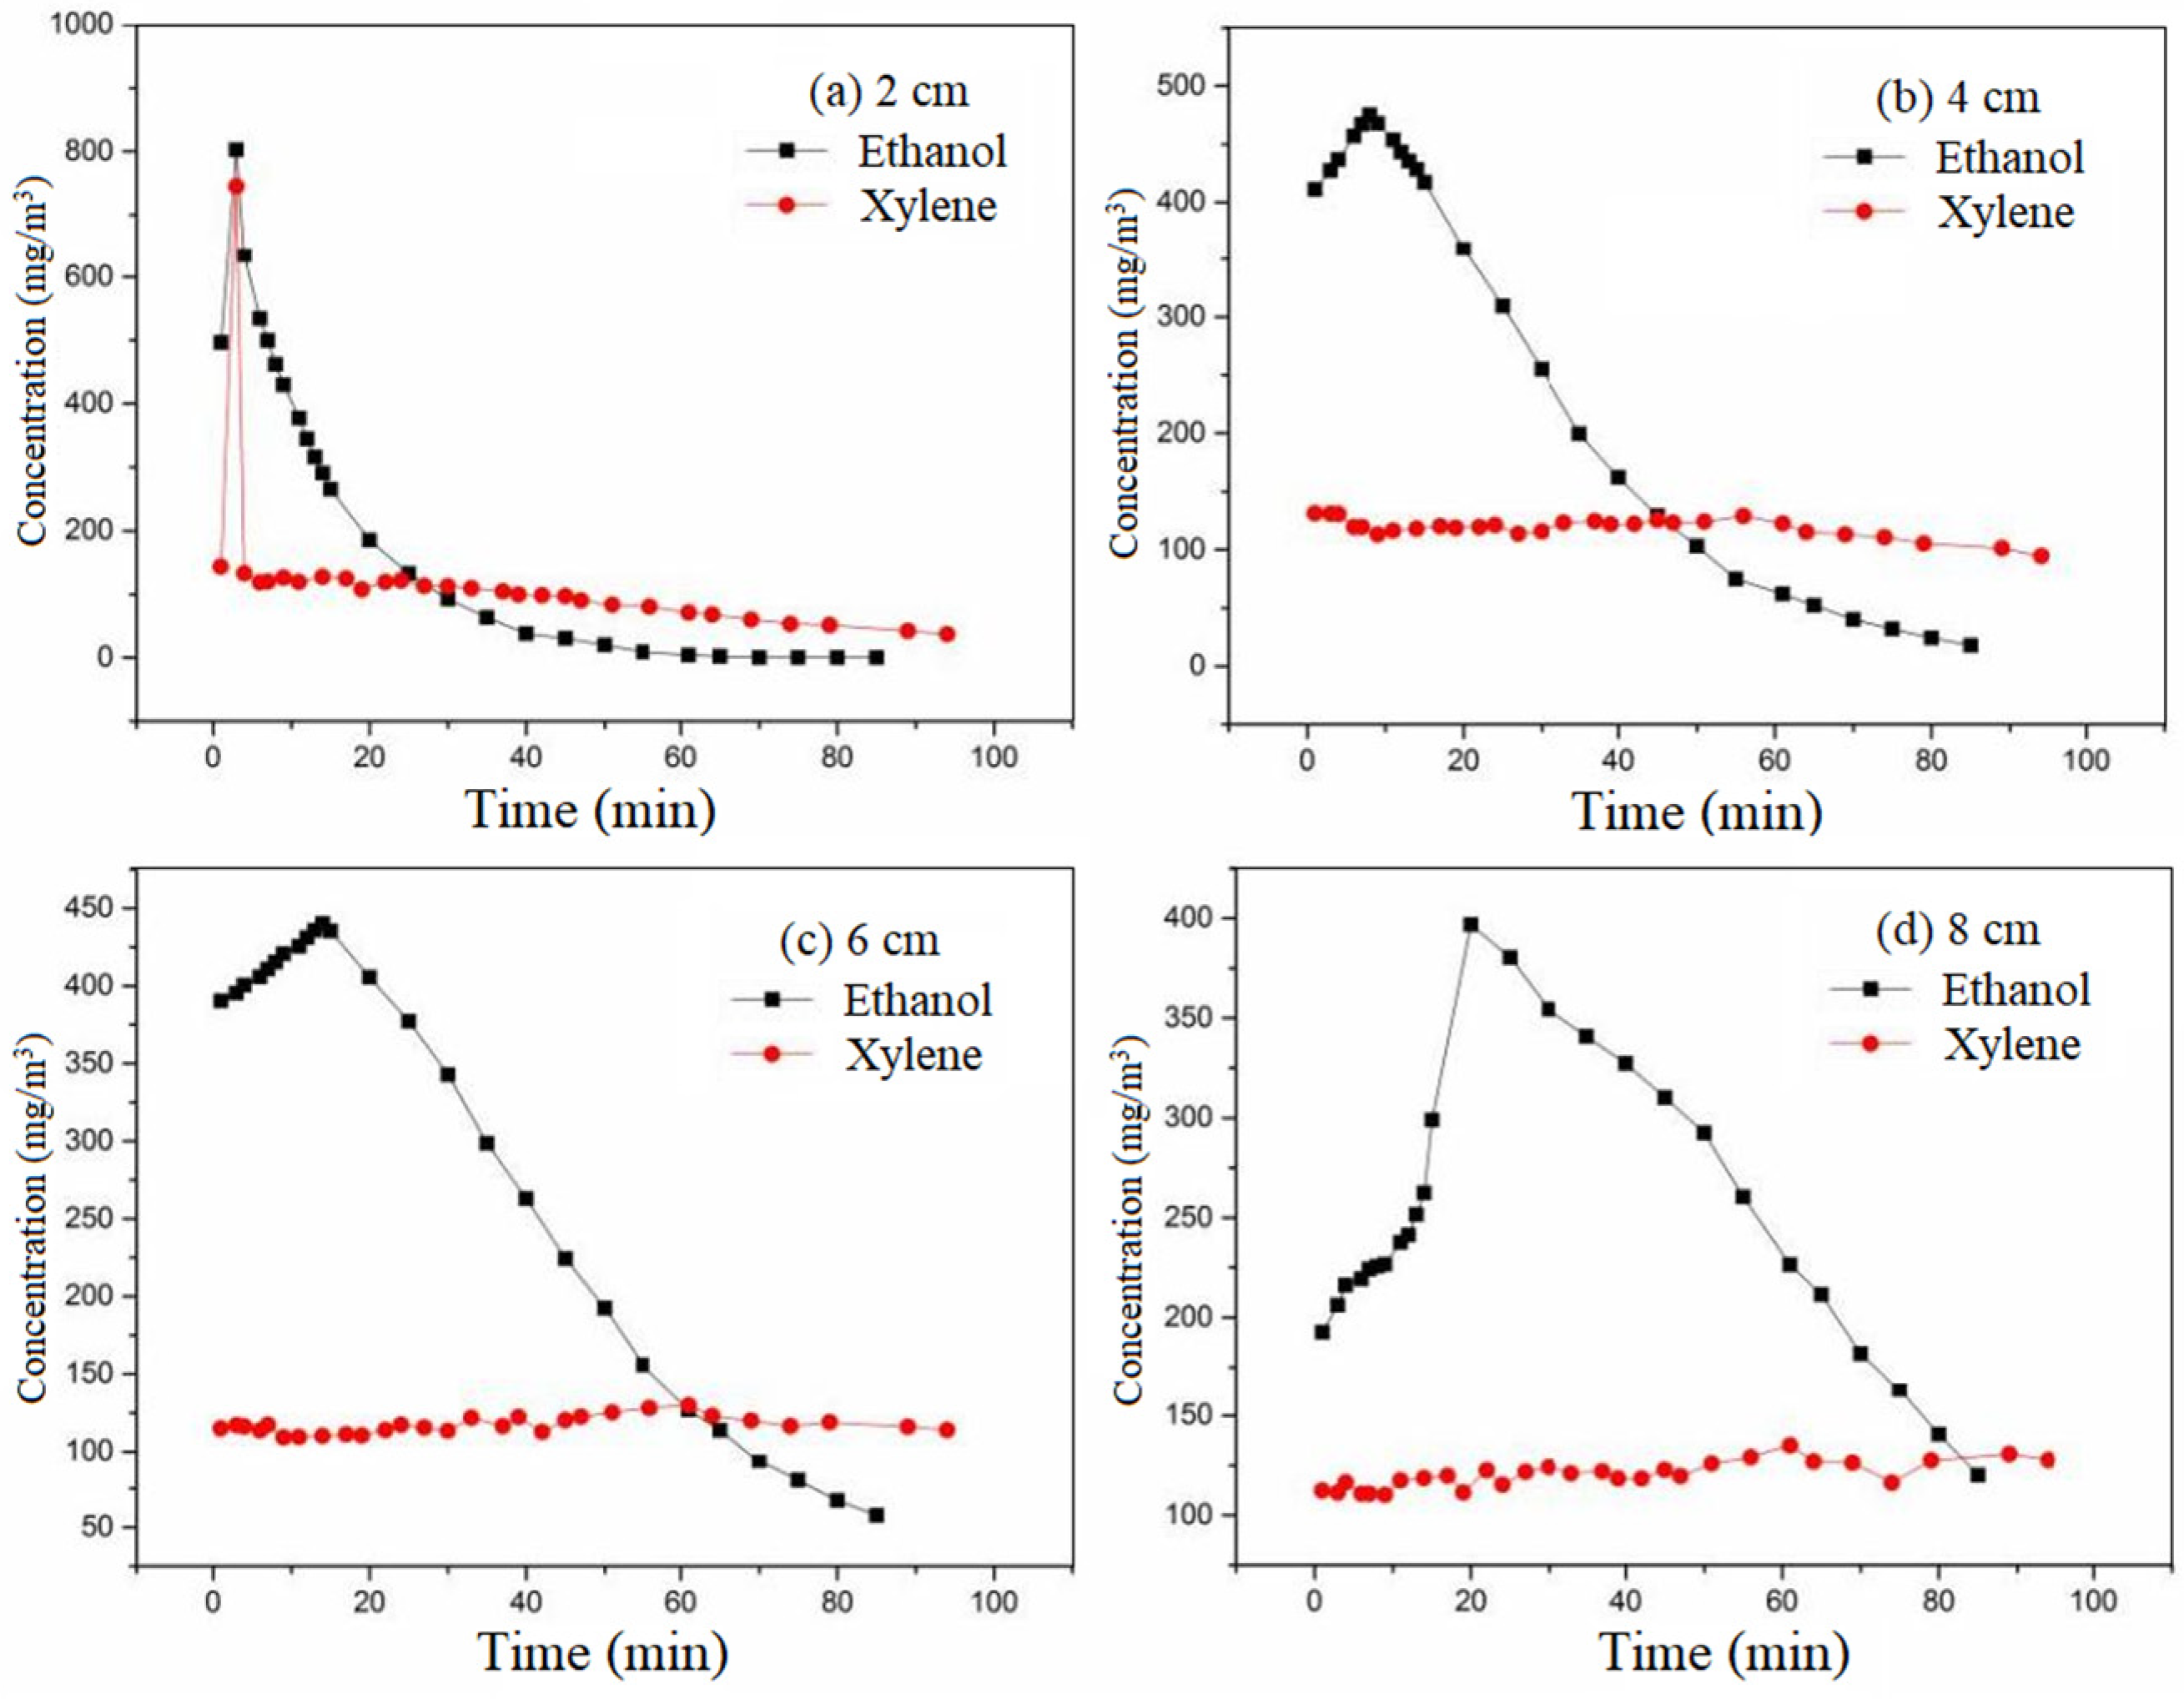
3.6. Influence of Empty Bed Contact Times on Pulse Load Buffering
Ethanol served as the adsorbate. The cross-sectional wind speed was set at 0.3 m/s. The saturated adsorption concentration was 200 mg/m
3. The pulse time was 2 min. The pulse multiple was 20 times. The ventilation mode was positive ventilation. The variation curve of outlet concentration with time at different heights is shown in
Figure 9.
The empty bed contact times (EBCT) of the adsorption bed were different; that is, the height of the activated carbon bed was different. In the same experimental vessel, the amount of activated carbon was different. The greater the amount of activated carbon, the greater the adsorption potential, and the better the buffer attenuation ability of the pulse load after balancing with a certain inlet concentration. However, the greater the amount of activated carbon, the greater the cost and energy consumption of the actual project. Therefore, it is necessary to find the optimal value of the amount of activated carbon, or put forward the way to find the optimal value of activated carbon, so as to ensure the economy and effectiveness of the project.
The larger the EBCT was, the higher the carbon bed height was, the more obvious the peak reduction after pulse was, and the longer the peak time lag time was. The greater the amount of activated carbon, the smaller the change in ethanol gas concentration released after the pulse, the stronger the buffer attenuation ability, the greater the adsorption potential, and the better the buffer attenuation ability to pulse load.
Table 14 lists R
1, R
2, and R
3 at different EBCTs.
As the EBCT increased, R1 gradually decreased. The higher the EBCT, the better the buffering attenuation ability. Under this condition, the carbon bed height started at 4 cm, and R1 was within 10%. Considering the economic factors, 4 cm was the optimal height of the carbon bed in this experiment. Starting from 4 cm, R1 decreased proportionally with the height of the carbon bed, decreasing by 1% every 2 cm.
As the EBCT increased, R2 gradually increased. The higher the EBCT, the better the buffering attenuation ability. Under this condition, R2 increased linearly with the height of the carbon bed, increasing by 8 for every 2 cm decreased; that is, every 2 cm increased for 16 min.
As the EBCT increased, R3 gradually decreased. The higher the EBCT, the better the buffering attenuation ability. Under this condition, the height started at 4 cm, and R3 changed very little. Considering economic factors, 4 cm was the optimal value of carbon bed height, and R3 was 1.48.
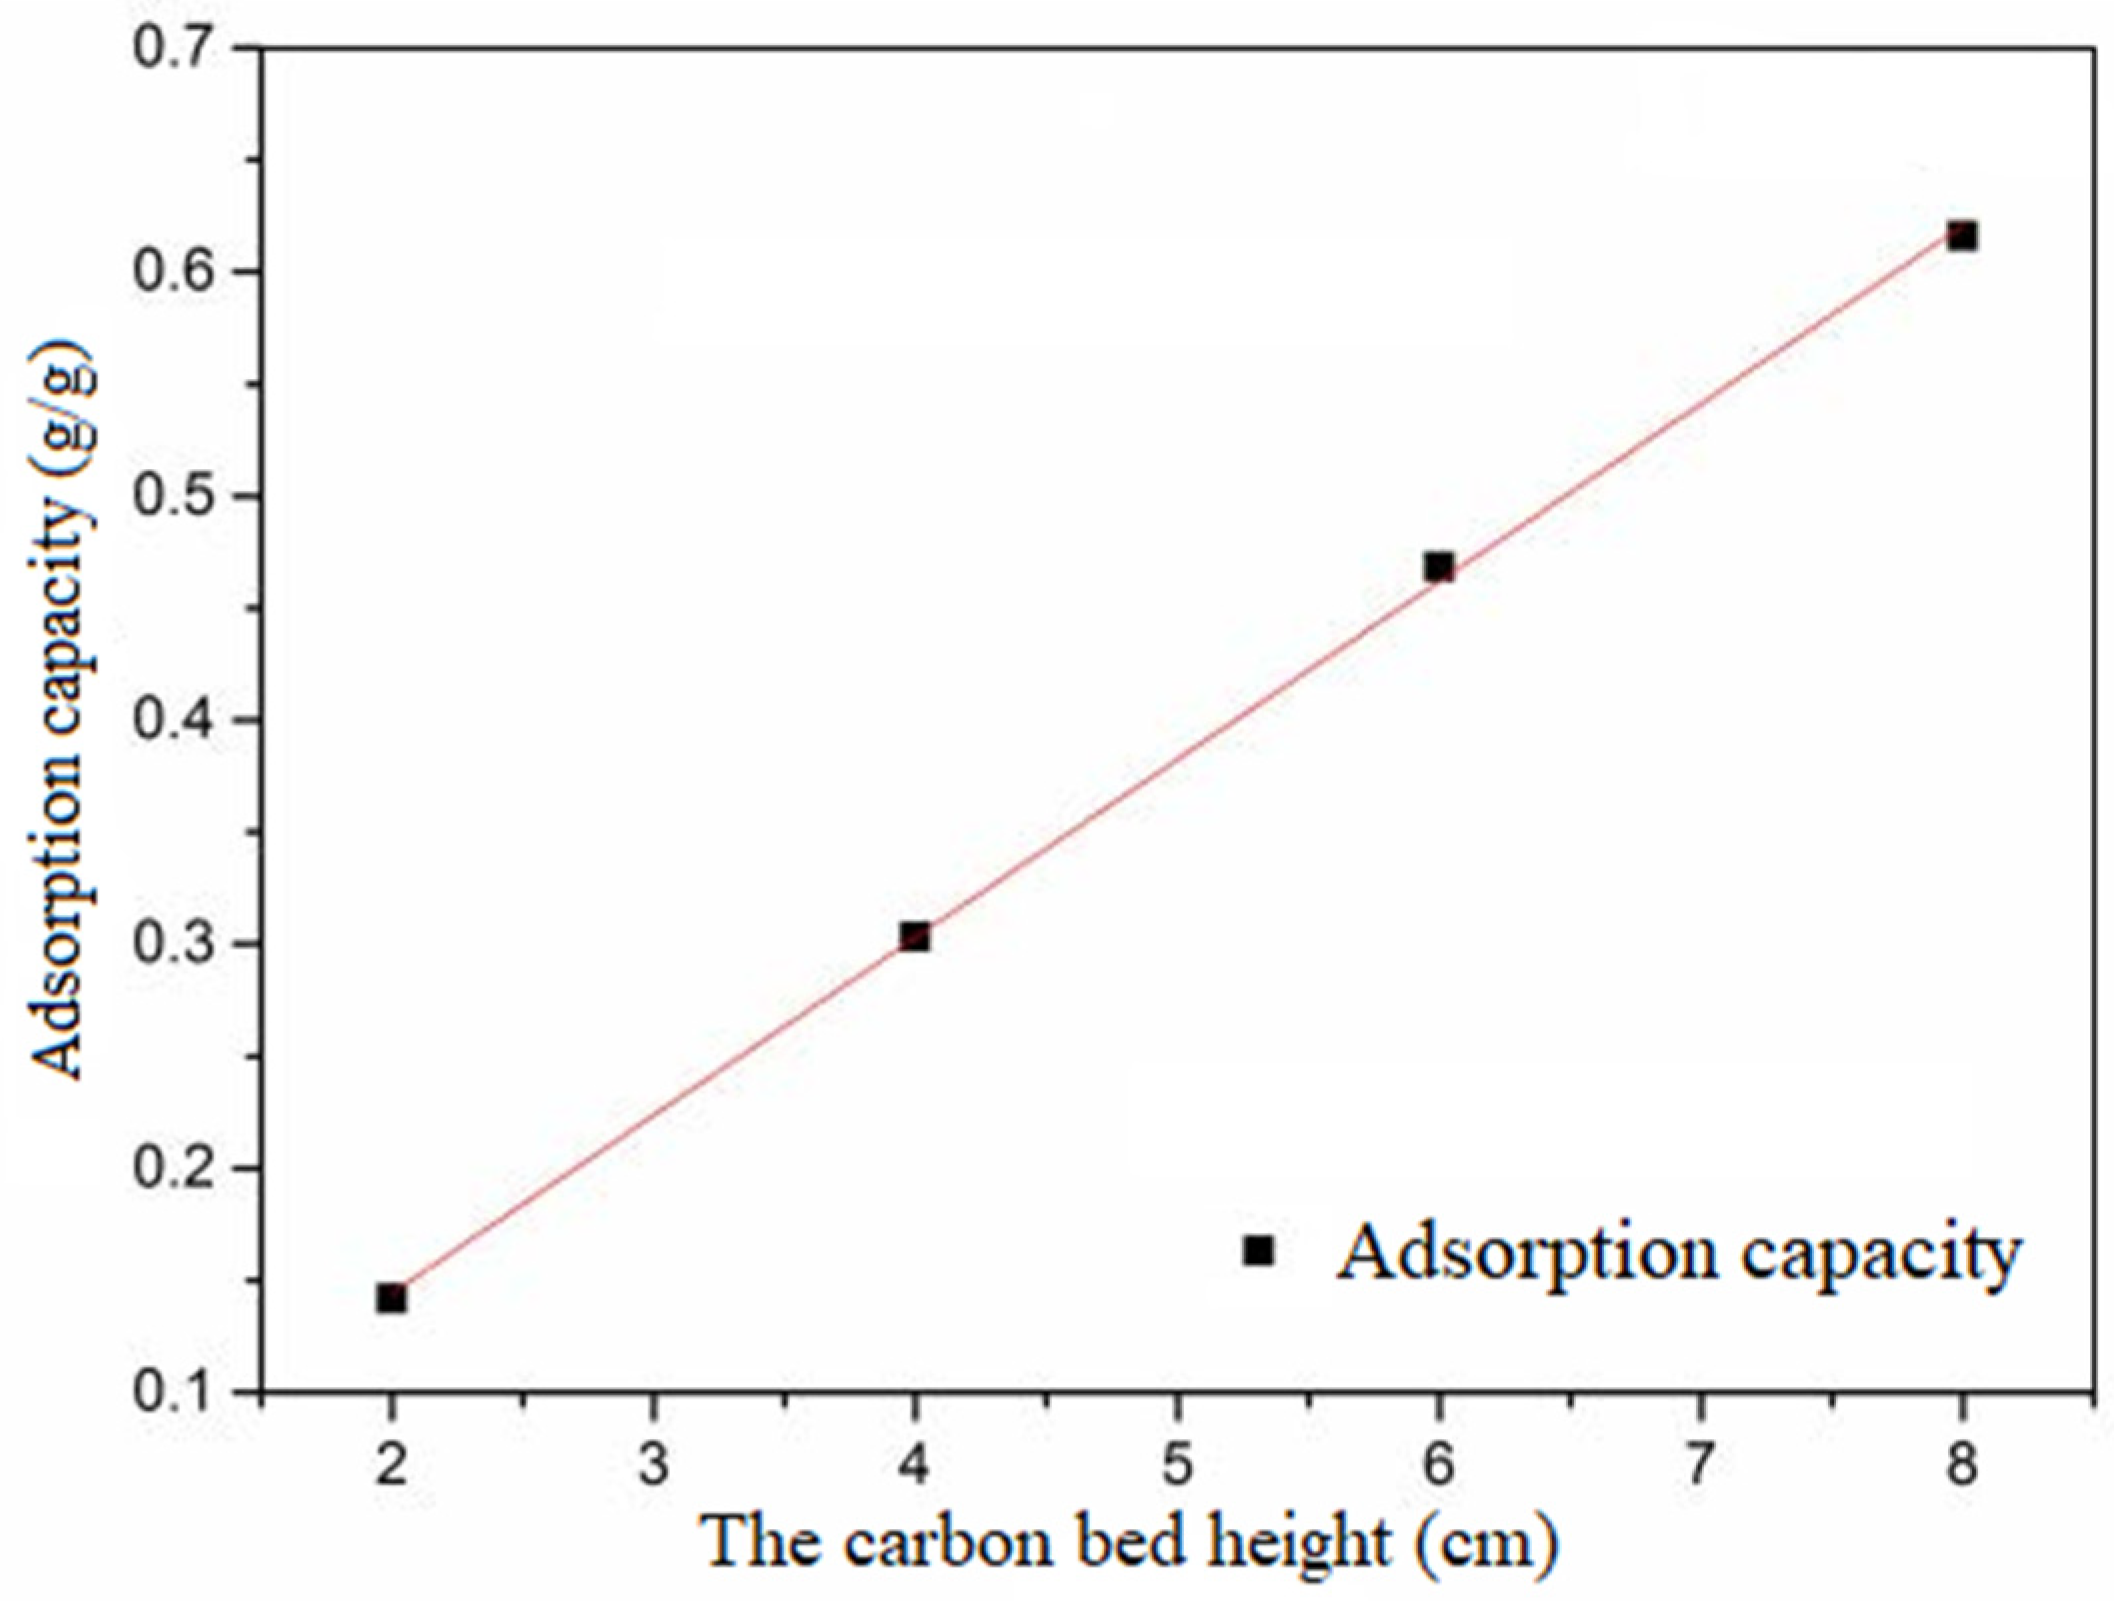
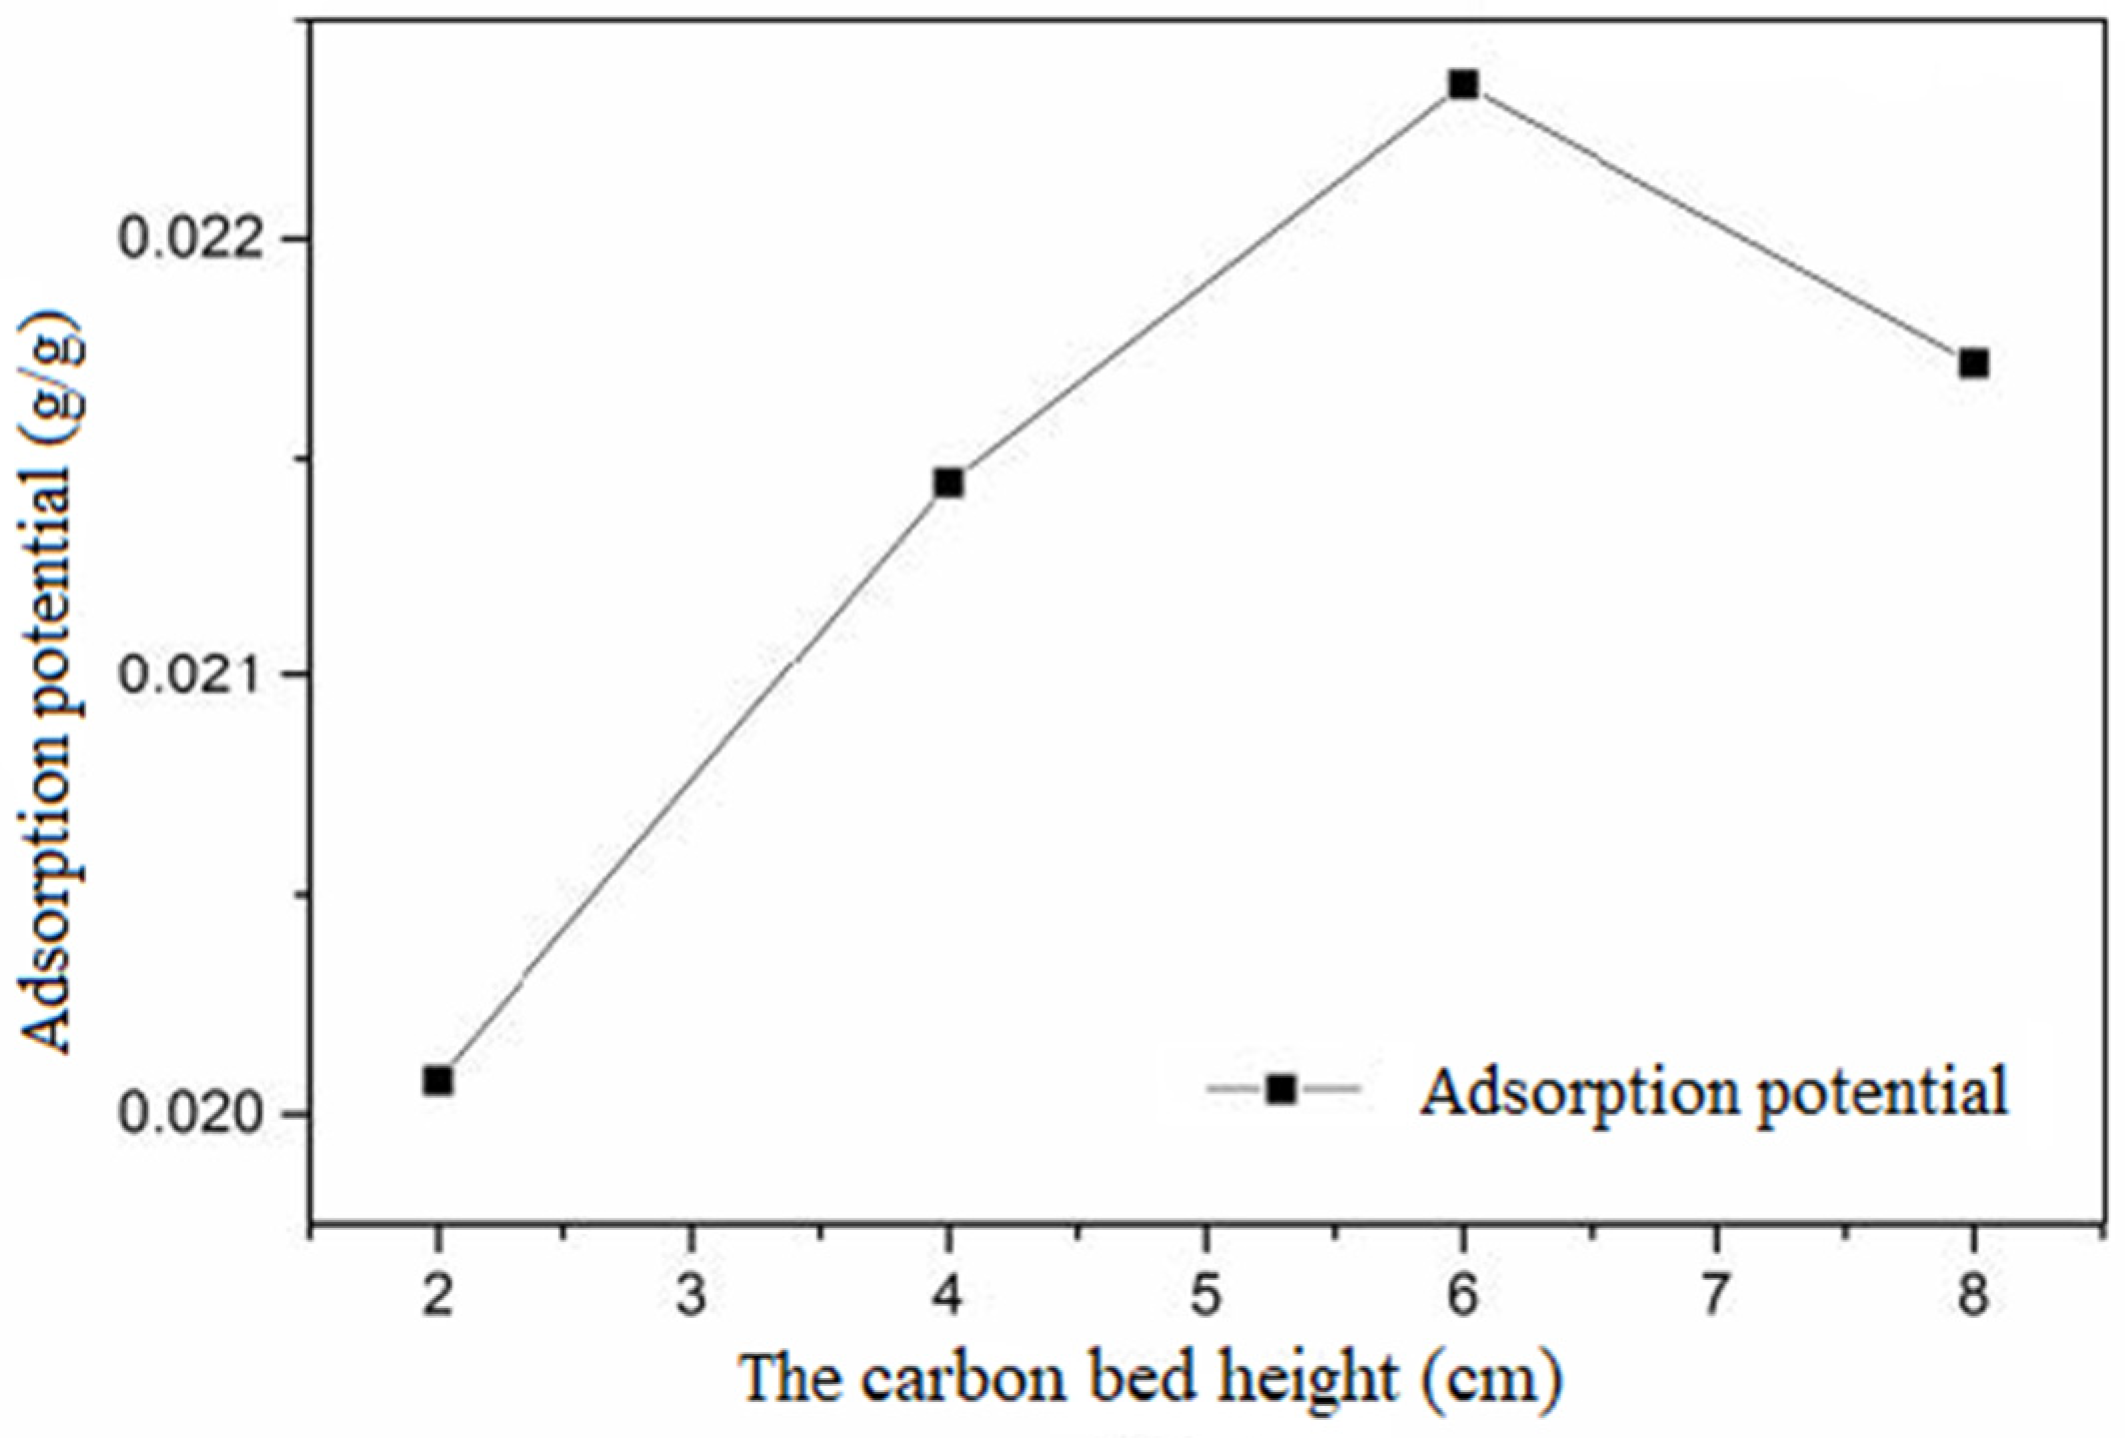
In
Figure 9, the integration of concentration and time can represent the adsorption potential of this dynamic experiment. The experimental flow was 0.82 m
3/h. The relationship between the height of the carbon bed and the adsorption capacity of activated carbon is shown in
Figure 10. The relationship between the carbon bed height and the adsorption potential of activated carbon is shown in
Figure 11.
The higher the carbon bed height, the greater the adsorption capacity of activated carbon with certain intake concentrations and adsorption equilibrium. The adsorption capacity increased linearly with the height of the activated carbon. The above fitting line is Equation (4).
where
q represents the adsorption capacity of activated carbon with certain intake concentrations and adsorption equilibrium (g/g), and
h represents the height of activated carbon (cm).
With the increase in height, the adsorption potential increased first and then decreased. In a certain range, the greater the amount of activated carbon, the greater the adsorption potential of unit activated carbon with certain intake concentrations and adsorption equilibrium. However, beyond a certain range, with the increase in the amount of activated carbon, the adsorption potential per unit of activated carbon decreased, and the utilization efficiency of activated carbon decreased. This shows that the amount of activated carbon had an optimal value.
To sum up, EBCT is an important factor affecting the adsorption capacity and adsorption potential of activated carbon and then affecting the buffer attenuation ability of activated carbon with certain intake concentrations and adsorption equilibrium. The degree of buffer attenuation is a function of EBCT. With the increase in EBCT, the ethanol pulse outflow concentration decreased and the buffer performance enhanced. EBCT plays an important role in the adsorption of saturated activated carbon. The pulse time, pulse multiple, and other influencing factors are affected by EBCT and cooperate with EBCT to affect the buffer attenuation performance of activated carbon.
3.7. Influence of Adsorbate Type on Pulse Load Buffering
The adsorbates used were ethanol and xylene, respectively. The cross-sectional wind speed was set at 0.3 m/s. The equilibrium adsorption concentration was 400 mg/m
3. The pulse time was 2 min. The pulse multiple was 10 times. The ventilation mode was positive ventilation. The variation curve of outlet concentration with time at different heights is shown in
Figure 12.
Xylene is non-polar and ethanol is polar, resulting in a faster mass transfer rate for ethanol compared to xylene.
At lower carbon bed heights, xylene exhibited a brief, sharp rise and subsequent decline during the pulse period. However, at other carbon bed heights, the xylene outlet concentration remained stable. At each carbon bed height, ethanol showed a trend of slowly increasing at first, reaching a peak, and then gradually decreasing. Firstly, xylene, being non-polar, exhibits a significantly greater adsorption capacity on activated carbon compared to ethanol. Under the same pulse condition, the buffer capacity of activated carbon for xylene was much greater than that of ethanol. Ethanol and xylene possess distinct adsorption potentials. Therefore, the buffering capacity of these two different adsorbates is different. In this experiment, the adsorption potential for ethanol was lower than the pulse concentration under the same inlet concentration. In contrast, the adsorption potential for xylene exceeded the pulse concentration. Therefore, the ethanol pulse volume had an overflow phenomenon, while xylene had no overflow phenomenon. With the intake of air, the adsorption effect of activated carbon on ethanol weakened, the load buffer disappeared, and the detection concentration increased slowly. However, activated carbon continued to adsorb xylene, and the outlet concentration was stable. When the air inlet was stopped, the ethanol detection concentration maintained a slow upward trend. Due to desorption, the residual ethanol gas in the activated carbon and the ethanol gas adsorbed on the activated carbon were gradually released with the clean gas. When the concentration reached a certain value, a large amount of pollutant molecules desorb, and then the detection concentration decreased. While xylene maintained a constant desorption rate, the outlet concentration remained unchanged. Conversely, the diffusion coefficient of ethanol in air was larger, and the diffusion coefficient of activated carbon was also larger. The diffusion rate was faster, the impact of the pulse load was more obvious, and the peak value was obvious. In summary, the buffer performance of activated carbon for xylene was better than that of ethanol. There is no increase or decrease in the concentration of xylene after the pulse, so R1 and R2 cannot be used to analyze their buffer attenuation performance in this case.
The effect of adsorbate on R
3 is shown in
Table 15.
The adsorption potential for xylene is greater than that for ethanol. Therefore, activated carbon with a specific intake concentration and adsorption equilibrium exhibits superior buffer attenuation performance for xylene. This is the same as the conclusion of the above analysis. Under the same pulse condition, the buffer capacity of activated carbon for xylene is significantly greater than that of ethanol. R3 can be employed to analyze the buffer attenuation performance of both substances in this scenario.
From the above analysis, the buffering capacity of the pulse load of adsorbate is related to the properties of adsorbate. Compared with polar substances, nonpolar substances exhibited a greater adsorption capacity on activated carbon. Activated carbon with a specific intake concentration and adsorption equilibrium demonstrates significant adsorption potential and good buffer attenuation performance. The diffusion coefficient of adsorbate affects the residence time of the adsorbate pulse load in activated carbon, which is reflected as buffer lag time.


 ,
, 


