Article

Analysis of Polycyclic Aromatic Hydrocarbons Using Magnetic Three-Dimensional Graphene Solid-Phase Extraction Coupled with Gas Chromatography–Mass Spectrometry

1
School of Chemistry, College of Science, University of Tehran, Tehran P.O. Box 14155-6619, Iran
2
Department of Nutrition, Dietetics and Food Sciences, Utah State University, Logan, UT 84322, USA
3
School of Environment, College of Engineering, University of Tehran, Tehran P.O. Box 14155-6619, Iran
4
Department of Environment and Energy, Sejong University, Seoul 05006, Republic of Korea
5
Envirowise Research Associate, Christchurch 8053, New Zealand
6
Faculty of Architecture and Urbanism, UTE University, Calle Rumipamba S/N and Bourgeois, Quito 170129, Ecuador
7
Department of Biomaterials, Saveetha Dental College and Hospital, Saveetha Institute of Medical and Technical Sciences, Chennai 600 077, India
*
Author to whom correspondence should be addressed.
Separations 2023, 10(11), 564; https://doi.org/10.3390/separations10110564
Submission received: 4 October 2023 / Revised: 2 November 2023 / Accepted: 8 November 2023 / Published: 10 November 2023
(This article belongs to the Section Environmental Separations)

Abstract

:
In this study, a composite material consisting of three-dimensional graphene aerogel and iron oxide nanoparticles (3DG/Fe3O4) was created and utilized for the purpose of magnetic solid-phase extraction (MSPE) of thirteen polycyclic aromatic hydrocarbon (PAH) compounds via gas chromatography–mass spectrometry/selected ion monitoring (GC-MS/SIM) analysis. The synthesized adsorbent underwent a range of characterization techniques, including scanning electron microscopy, vibrating sample magnetometry, Raman spectroscopy, X-ray diffraction, Brunauer–Emmett–Teller, Fourier transform-infrared spectroscopy, and Barrett–Joyner–Halenda techniques, to examine its properties and morphology. The synthesized adsorbent integrates the benefits of superior adsorption capacity from modified graphene oxide (GO) with the magnetic separability of magnetite microparticles, resulting in a high adsorption capacity with easy separation from sample solutions. The efficiency of the proposed method was optimized and modeled using a central composite design (CCD), which considered the primary factors influencing it. The optimal conditions were obtained as the adsorbent dosage of 10 mg, the extraction time of 4 min, and the salt concentration of 3% w/v. The limit of detection for the target PAHs was established to range from 0.016 to 0.2 ng mL−1 in optimal conditions, exhibiting a signal-to-noise ratio of 3. The linear dynamic range spanned from 5 to 100 ng mL−1, with determination coefficients (R2) ranging from 0.9913 to 0.9997. The intra- and inter-day precisions were calculated as relative standard deviations (RSDs) equal to 3.9% and 4.7%, respectively. The proposed method was successfully applied to the determination of PAHs in water samples (tap, river, and rainwater), and recoveries in the range of 71–110% (RSDs < 5.2%, n = 3) were obtained.

1. Introduction

Polycyclic aromatic hydrocarbon (PAH) is a complex class of condensed multi-ring benzenoid compounds in linear, angular, or cluster arrangements. Due to their highly carcinogenic and mutagenic properties, PAHs have garnered growing interest in contemporary pollution research [1,2]. Based on their frequency of occurrence in the environment, the United States Environmental Protection Agency (US-EPA) has identified 16 unsubstituted PAHs as priority pollutants [3]. These PAHs include acenaphthene, anthracite, fluoranthene, fluorene, naphthalene, phenanthrene, pyrene, benz[a]anthracene, benzo[b]fluoranthene, benzo[k]fluoranthene, benzo[ghi]perylene, benzo[a]pyrene, chrysene, dibenz[a,h]anthracene, and indeno [1,2,3-cd]pyrene. These sixteen EPA PAHs were identified in the 1970s [4]. However, identifying and measuring PAHs in environmental samples is challenging due to the complex matrix. Employing sample preparation techniques is a way to overcome this obstacle. The primary aims of sample preparation encompass the elimination of possible interferences, the analyte’s preconcentration, and the analyte’s conversion into a more appropriate state for detection or separation [5,6,7]. Solid-phase extraction (SPE) has become a widely utilized method for pre-treatment environmental samples that include small contaminants. The remarkable advantages can be related to factors such as a high enrichment factor, high recovery rates, cost-effectiveness, and minimum utilization of organic solvents [8,9]. In recent times, there has been a significant exploration of several solid-phase adsorbents, including molecularly imprinted polymers (MIPs) [10], magnetic nanomaterials [11], and carbon nanomaterials. Magnetic solid-phase extraction (MPSE) is a highly promising variant of solid-phase extraction (SPE) that utilizes magnetic adsorbents. These adsorbents can be effortlessly separated from the sample matrix utilizing an external magnet.
Consequently, MPSE offers the benefits of simplified operation and reduced extraction time during sample pre-treatment. Furthermore, within the framework of MSPE, the adsorbents can achieve uniform dispersion within the sample solution by applying vortexing or shaking. This process enhances the contact surface area between the adsorbents and analytes, facilitating a rapid mass transfer. This phenomenon significantly increases extraction efficiency within a short timeframe, a highly sought-after characteristic in sample preparations conducted at a high throughput rate [12,13].
Compared with traditional materials, nanoparticles (NPs) have been attracting the attention of many researchers. This is because reducing the particle size to nano-scale leads to a much higher specific surface area and adsorption capacity [14,15]. The emergence of carbon nanomaterials, particularly with the discovery of fullerene (C60), has become a prominent and significant phenomenon in the field of solid-phase extraction (SPE). This is primarily attributed to their exceptional ability to adsorb substances, substantial surface area, simplicity of surface modification, and distinctive mechanical and electrochemical properties [16]. Graphene (G) is a two-dimensional lattice of carbon atoms arranged in a honeycomb structure [17], which was discovered by Geim et al. in 2004 [18]. Graphene is expected to be a superior adsorbent for benzenoid-form compounds due to its extensive delocalized π-electron system and strong π-stacking interaction with the benzene-ring-containing compounds. Three-dimensional graphene (3DG) architectures, formed through the assembly of 2DG flake sheets, present distinct advantages beyond the intrinsic plain graphene/oxide. These advantages encompass a notably porous structure, commendable thermal and mechanical robustness, and a high tensile and considerable adsorption capacity, enabling them to withstand considerable strain of different adsorbates. To date, multiple methodologies have been devised for the creation of 3DG structures from graphene/oxide, including template-assisted production, chemical vapor deposition (CVD), self-assembly, 3D printing, thermal/electrochemical expansion, electrochemical reduction, and centrifugal evaporation-induced methods.
Considering this, self-assembly synthesized magnetic three-dimensional graphene nanocomposites (3DG/Fe3O4) were used as an effective adsorbent for the enrichment of thirteen PAHs, as priority pollutants before GC-MS/SIM determination. This study employed a central composite design (CCD) to optimize and establish a model for identifying PAHs in diverse aqueous environmental samples. Under optimal conditions, the approach was successfully employed to determine the selected PAHs at trace levels in water samples collected from tap, river, and precipitation sources.

2. Materials and Methods

2.1. Reagents and Materials

The certified mixture used in this study is EPA 525 PAH Mix A, which consists of 13 polycyclic aromatic hydrocarbons (PAHs) with concentration of 500 ng mL−1. The mixture contains benz[a]anthracene, benzo [b]fluoranthene, benzo[k]fluoranthene, anthracene, ben-zo[ghi]perylene, benzo [a]pyrene, chrysene, dibenz[a,h]anthracene, fluorene, acenaphthylene, and indeno [1,2,3-cd]. The chemical compounds pyrene, phenanthrene, and pyrene dissolved in methylene chloride were acquired from Supelco Analytical, a company based in Bellefonte, PA, USA. A standard solution of the target PAHs at a concentration of 50 ng mL−1 was generated by diluting the first standard in methanol. Standard solutions for experiments were created daily by diluting the stock standard solution in methanol. These solutions were then stored in opaque containers at a temperature of 4 °C until chemical analysis. The chemicals used in this study were obtained from Merck Chemicals, a supplier based in Darmstadt, Germany. The specific chemicals included acetonitrile (ACN) with a purity of more than 99%, tetrachloroethylene, biphenyl, iron sulfate heptahydrate (FeSO4·7H2O), ammonia solution (NH3) with a concentration of 25%, and sodium chloride (NaCl) with a minimum purity of 99.5%. The methanol (99.8%) was acquired from Sigma Aldrich Ltd. in St. Louis, MO, USA.

2.2. Apparatus

The surface morphology of the adsorbent 3DG/Fe3SO4 was analyzed using scanning electron microscopy (SEM) with the KYKY-EM3200 instrument (Beijing, China). The transmittance spectra employing KBr discs were recorded on an Equinox 55 FT-IR spectrometer (Bruker, Bremen, Germany). The magnetic properties of the adsorbent were assessed by using a vibrating sample magnetometer (VSM/AGFM, Kashan, Iran) at ambient temperature. The magnetic field was cycled within the range of −10 to 10 kilo-Oersted (kOe). The X-ray diffraction (XRD) patterns were obtained using an X’Pert Pro MPD X-ray diffractometer produced in Almelo, Netherlands. The X-ray source utilized Cu Kα radiation, which had a wavelength of 1.54178 Å. The Raman spectroscopy was conducted using a Senterra Dispersive Raman microscope manufactured by Bruker in Germany. The microscope was coupled with a laser light source that emitted light at a wavelength of 785 nm. The surface area, pore volume, and pore size analysis were performed utilizing the Brunauer–Emmett–Teller (BET) and Barrett–Joyner–Halenda (BJH) techniques. The investigations were conducted utilizing an ASAP 2000 Surface Area Analyzer produced by Micromeritics Instrument Corporation. The desorption process involved using a ZX-Classic vortex mixer type (Velp Scientifica, Milan, Italy). The pH values were measured using a WTW Inolab 720 pH meter (Weilheim, Germany). A Eurosonic 4D (Euronda, Montecchio Precalcino (Vincenza) Italy) ultrasonic water bath and a vortex mixer model ZX–Classic (Velp Scientifica, Milan, Italy) were used in the extraction procedure.

2.3. Gas Chromatography–Mass Spectrometry

The gas chromatography–mass spectrometry (GC-MS) analyses were conducted using an Agilent Technologies 7890A gas chromatograph system combined with a 5975C network mass-selective detector. The eluent gas used in this experiment was helium, with a purity of 99.999%. It was introduced at a flow rate of 1 mL min–1. The temperature of the injector was set to 280 °C. The samples (1 µL) were injected in a splitless mode for 1 min with a flow rate of 30 mL min–1. The extracted PAHs were subjected to chromatographic separations using an HP5-MS capillary fused silica column (length of 30 m, inner diameter of 0.25 mm, and film thickness of 0.25 μm). The temperature of the column was initially set to 90 °C and held for 5 min. It was then increased to 270 °C at a rate of 20 °C per min and sustained at this temperature for a period of 23 min. Initially, electron ionization data were obtained using a full scan method at an energy level of 70 electron volts (eV) to identify suitable masses. The range of masses scanned during the experiment was set to be between 40 and 500 atomic mass units (AMU). Finally, for quantitative analysis of PAH, the selective ion monitoring (SIM) mode was used to improve instrument sensitivity for low concentrations. For identification, the quantifier ion for each PAH was chosen as the basis peak. In contrast, the two ions with the highest intensity in the mass fragmentation of each individual PAH were picked as qualifier ions.

2.4. Synthesis of the Adsorbent

Initially, the synthesis of graphene oxide (GO) was conducted using the methodology described in the literature [19]. Subsequently, the 3DG/Fe3O4 composite was manufactured using the vacuum freeze-dried method [20]. In this experiment, a quantity of 0.5 g of GO was introduced into a solution containing 200 mL of distilled water. The resulting mixture was subjected to sonication for a duration of 15 min. Subsequently, a quantity of 3.5 g of FeSO4·7H2O was dissolved in 30 mL of distilled water. This resulting solution was then introduced into the solution containing GO, followed by subjecting the mixture to ultrasonic treatment for a duration of 5 min. Subsequently, the pH of the combination was modified to a value of 11 by employing an aqueous solution of NH3 (25%). The resulting suspension was then subjected to heating at a temperature of 90 °C for a duration of 6 h within an oil bath, with no agitation used. The nanoparticles were used to bind the reduced graphene oxide sheets, resulting in their self-assembly into a three-dimensional hydrogel. This self-assembly was facilitated by hydrophobic and π-π stacking interactions, which were enhanced by the reduction in oxygen-containing groups on the sheets. Subsequently, the 3DG/Fe3O4 particles were isolated through the utilization of paper filtering and subsequently rinsed with distilled water. Subsequently, the black precipitate underwent freeze-drying for a duration of 24 h, resulting in the production of a black magnetic 3DG/Fe3O4 aerogel [21].

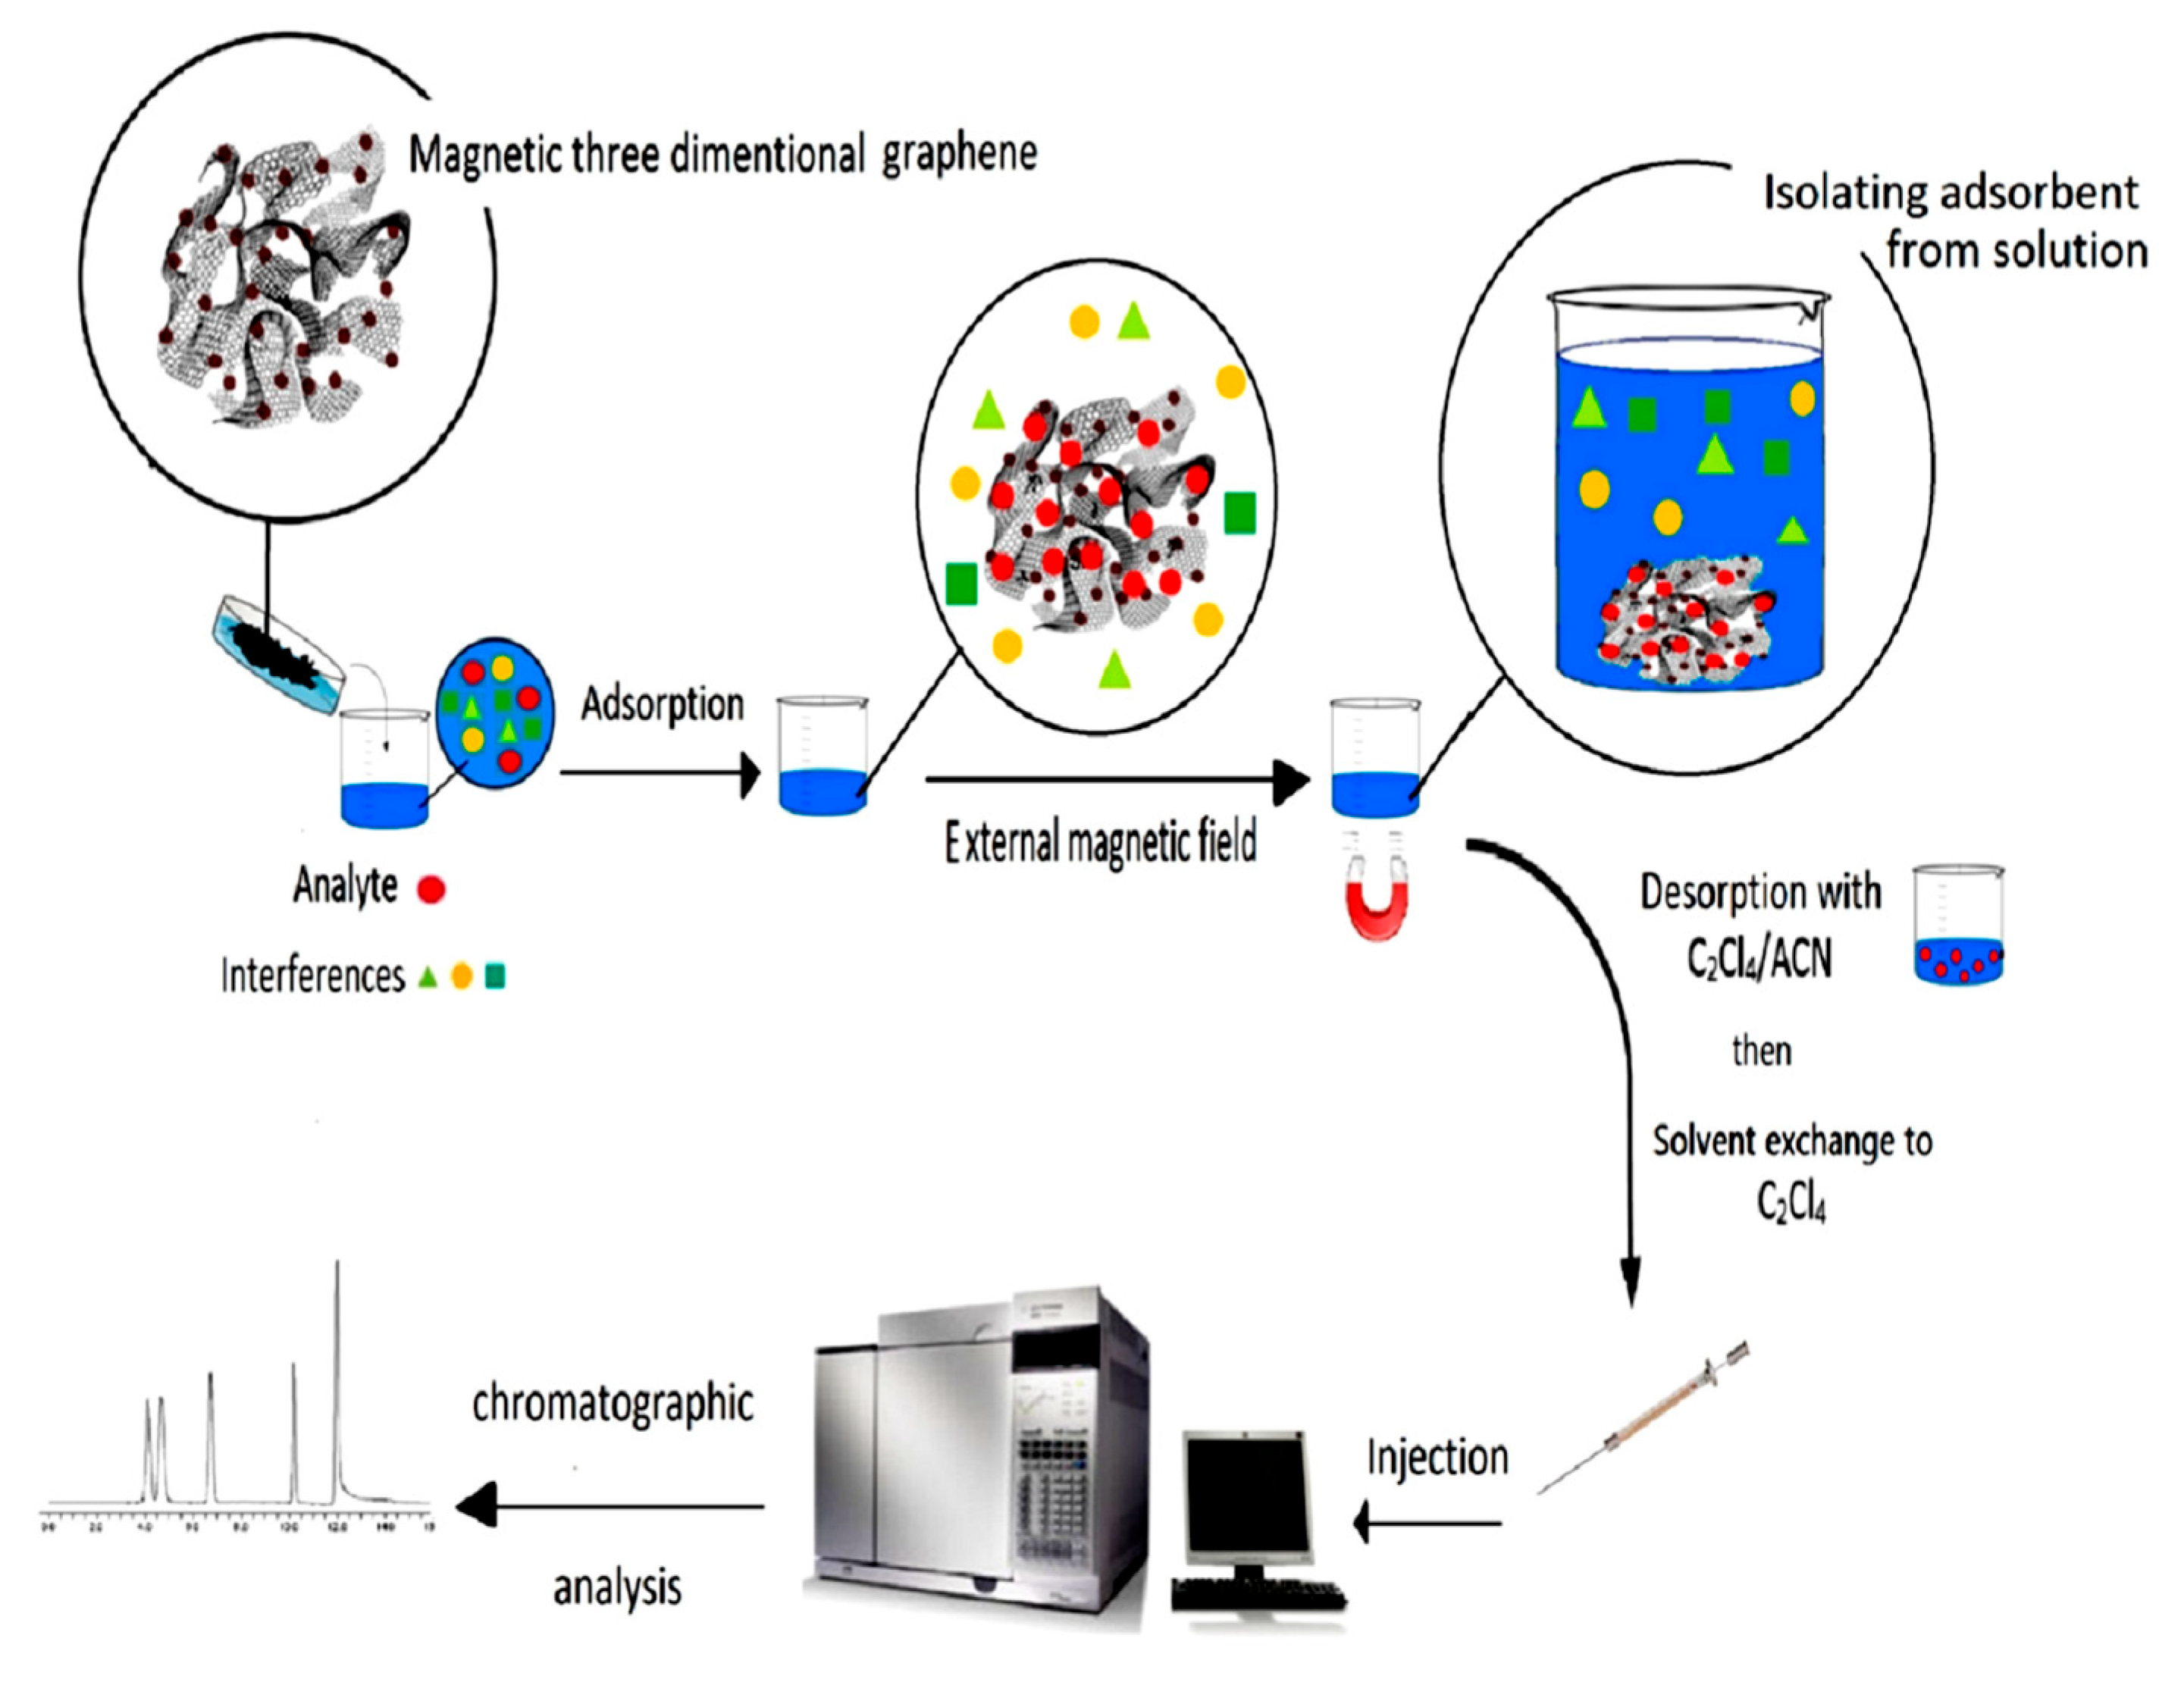
2.5. The MSPE Procedure

The procedure is described in Figure 1. First, 1.52 g of NaCl was dissolved into 50 mL of the sample solution to obtain a 3.04% w/v of NaCl, and then 10 mg of the adsorbent was added to the solution and shaken for 4 min. Subsequently, the dispersed magnetic 3DG/Fe3O4 nanoparticles were isolated from the sample solution using an external magnet, and the supernatant was poured away. Subsequently, the adsorbent underwent two washes using 1 mL of distilled water each to prevent any additional precipitation of NaCl during the enrichment process. Subsequently, a volume of 1 mL of a combination consisting of acetonitrile (ACN) and carbon tetrachloride (C2Cl4) in a ratio of 4:1 was introduced as the desorption solvent to the separated 3DG/Fe3O4. The resulting mixture was then subjected to vertexing for a duration of 30 s. The procedure was replicated two times, and afterward, the resultant desorption solutions were combined. Next, the solvent was evaporated under a nitrogen stream at 60 °C. Finally, the residue was dissolved in 0.1 mL of tetrachloroethylene, and 1 μL of it was analyzed using gas chromatography.

3. Results and Discussion

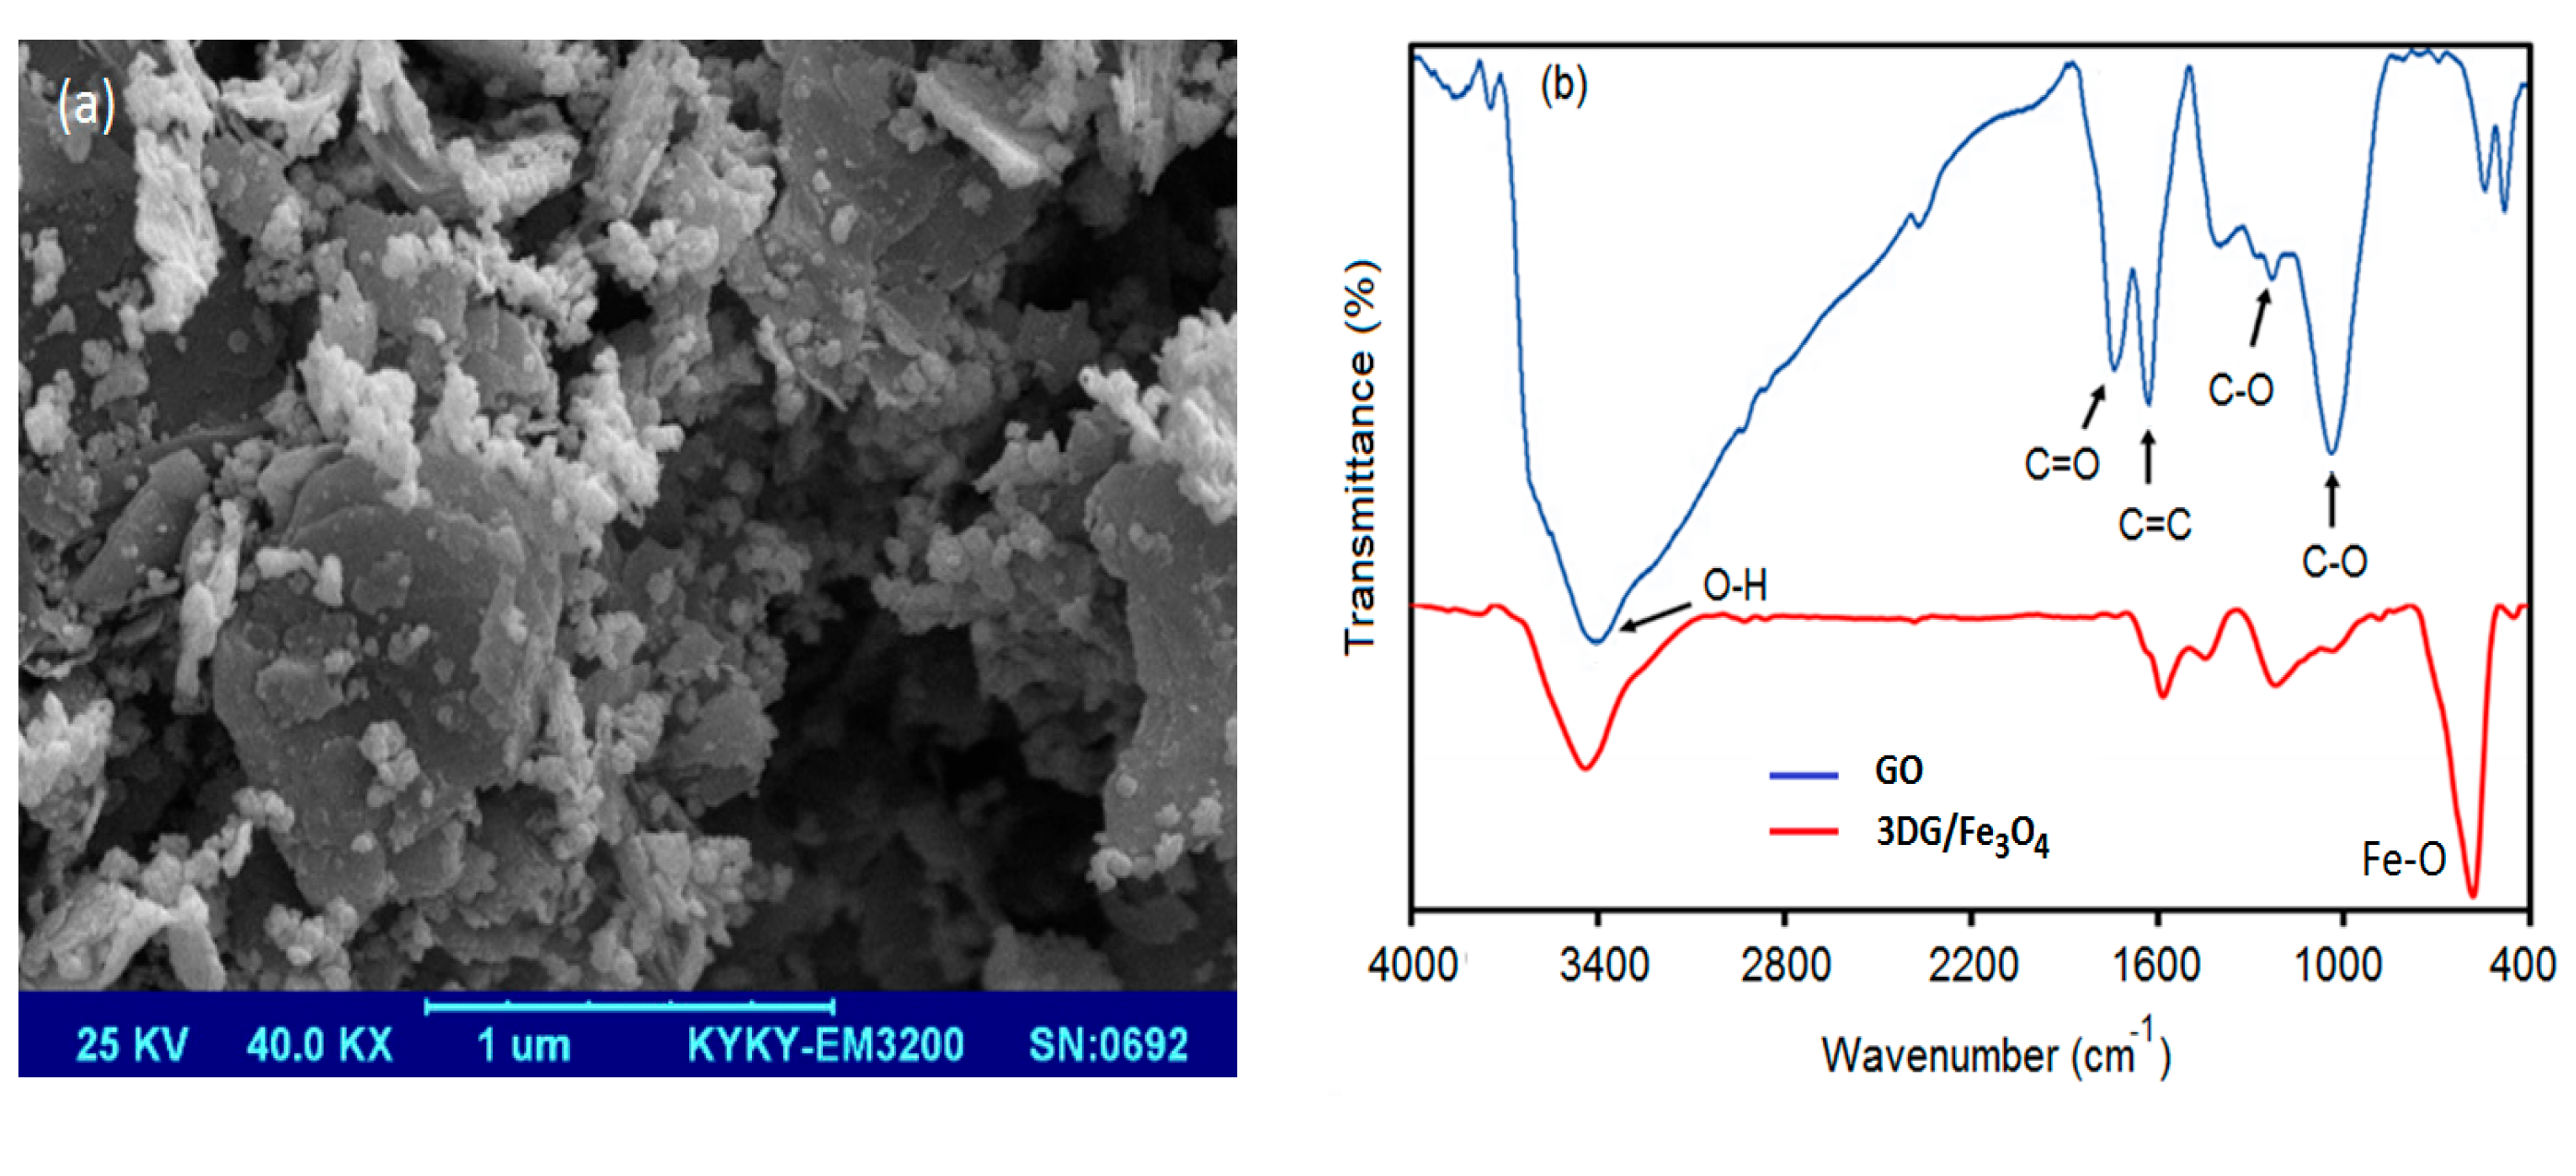
3.1. Characterization

The morphology, chemical composition and structure, and magnetic characteristics of the adsorbent were characterized using various techniques, including SEM, FTIR, VSM, XRD, Raman spectroscopy, BET, and BJH. Figure 2a shows the SEM imaging of 3DG/Fe3SO4, in which the reduced GO nanosheets are arbitrarily assembled into an interconnected porous 3D network structure, and the iron oxide nanoparticles are well spread in all parts of the 3DG assembly, attached to the graphene sheets. Figure 2b illustrates the FT-IR transmittance spectra of GO and 3DG/Fe3SO4. The main characteristic peaks in the GO spectrum that are observed at 3440, 1734, 1622, 1220, and 1034 cm−1 could be ascribed to the stretching vibrations of carbonyl C=O, aromatic C=C, epoxy C–O, and hydroxyl C–O functional groups, respectively. In the 3DG/Fe3O4 infrared spectrum, the intensity of oxygen-containing functional groups mentioned above has considerably decreased. This indicates an effective reduction in GO sheets during the synthesis of 3DG hydrogel. Furthermore, the peak at 574 cm–1 is assigned to the Fe–O stretching vibrations. Therefore, it can be inferred that the 3DG/Fe3O4 hydrogel has been effectively produced through the co-assembly process of graphene sheets and Fe3O4 nanoparticles.
The magnetic characteristics of the 3DG/Fe3O4 nanocomposite were examined through the utilization of the vibrating sample magnetometer (VSM) technique at ambient temperature. The resulting VSM graph is depicted in Figure 2c. In the case of superparamagnetic particles, the magnetization tends toward zero as the external field approaches zero. The saturation magnetization (Ms) can also be determined by analyzing the plateau region of the VSM curve [22,23]. The magnetic hysteresis curve exhibits an S-shaped characteristic and intersects the magnetization zero point, indicating the absence of both remanence and coercivity. This observation indicates the presence of the superparamagnetic characteristic in the 3DG/Fe3O4 material.
Furthermore, the observed saturation magnetization value of 54.8 emu g−1 indicates the exceptional magnetic characteristics of the material. Nevertheless, the recorded value is comparatively lower than the magnetization of the uncoated Fe particles (81.9 emu g−1), as documented in prior investigations [24]. The observed disparity can be ascribed to the impact of the non-magnetic layers of GO on the overall magnetization. According to a study conducted by Ma et al. [25], it was observed that a saturation magnetization of 16.3 emu g−1 was enough for the separation of magnetic particles from a solution through the utilization of a magnet. Therefore, the magnetic composite of three-dimensional graphene/Fe3O4, which has PAHs adsorbed onto its surface, can be easily isolated from a solution sample in less than 30 s using an external magnet. This is possible because of the composite’s superparamagnetic properties and high saturation magnetization.
Figure 2d presents the X-ray diffraction (XRD) patterns of GO, Fe3O4, and 3DG/Fe3O4. The X-ray diffraction (XRD) pattern of graphene oxide exhibits a distinct and well-defined peak at an angle of 2θ = 12.26°, which can be attributed to the (0 0 2) reflection of GO. The observed diffraction peaks at certain angles of 18° (111), 30° (220), 36° (311), 43° (400), 54° (422), and 64° (440) align with the expected diffraction pattern of Fe3O4 nanoparticles, as indicated by the standard X-ray diffraction (XRD) data for Fe3O4 (JCPDS, No. 65-3107). The XRD pattern seen in Figure 2d illustrates the ultimate state of the adsorbent, wherein the distinct peak corresponding to GO has been eliminated, revealing the presence of Fe3O4 nanoparticles. The observed patterns suggest the successful synthesis of 3DG/Fe3O4 in its entirety.
Further investigation was conducted on the structural modifications that occurred after the self-assembly and reduction process, encompassing disorganized and defective structures. This analysis involved the utilization of Raman spectroscopy to investigate the properties of GO and 3DG/Fe3O4, as depicted in Figure 2e. The dominant peaks identified in the GO spectra are located at around 1340 and 1590 cm−1, corresponding to the D and G bands, respectively. The D band arises because of the mode produced by structural defects and imperfections, resulting in a state of disorder. Conversely, the G band is indicative of sp2-hybridized carbon–carbon bonds. The intensity ratio, commonly denoted as ID/IG, is commonly utilized as a quantitative measure of disorder. In graphene oxide, the ratio of intensities between the D and G bands (ID/IG) is 0.95 but shows an increase to 1.28 in the context of three-dimensional graphene/iron(III) oxide (3DG/Fe3O4). The observed rise in the ID/IG ratio indicates that the reduction and magnetization processes have modified the GO structure.
The measurement of the specific surface area and pore size distribution of 3DG/Fe3O4 was carried out using the two methods of Brunauer–Emmett–Teller (BET) and Barrett–Joyner–Halenda (BJH), respectively (see Figure 2f). The characterization of the porous structure involves the observation of a hysteresis loop in the relative pressure (p/p0) range of 0.45–0.95 in the nitrogen adsorption–desorption isotherm. The adsorption–desorption behavior exhibited in a uniform pore system featuring a parallel wall slit-like pore structure is marked by a notable augmentation in adsorption at the relative saturation pressure, as well as a substantial reduction in desorption at specific relative saturation pressures. The BET analysis yielded a specific surface area of 218 m2 g–1 for the pure 3DG/Fe3O4 sample. The pore size of 3DG/Fe3O4 was determined using the BJH approach, revealing a narrow pore size distribution of around 5.9 nm (Figure 2f).

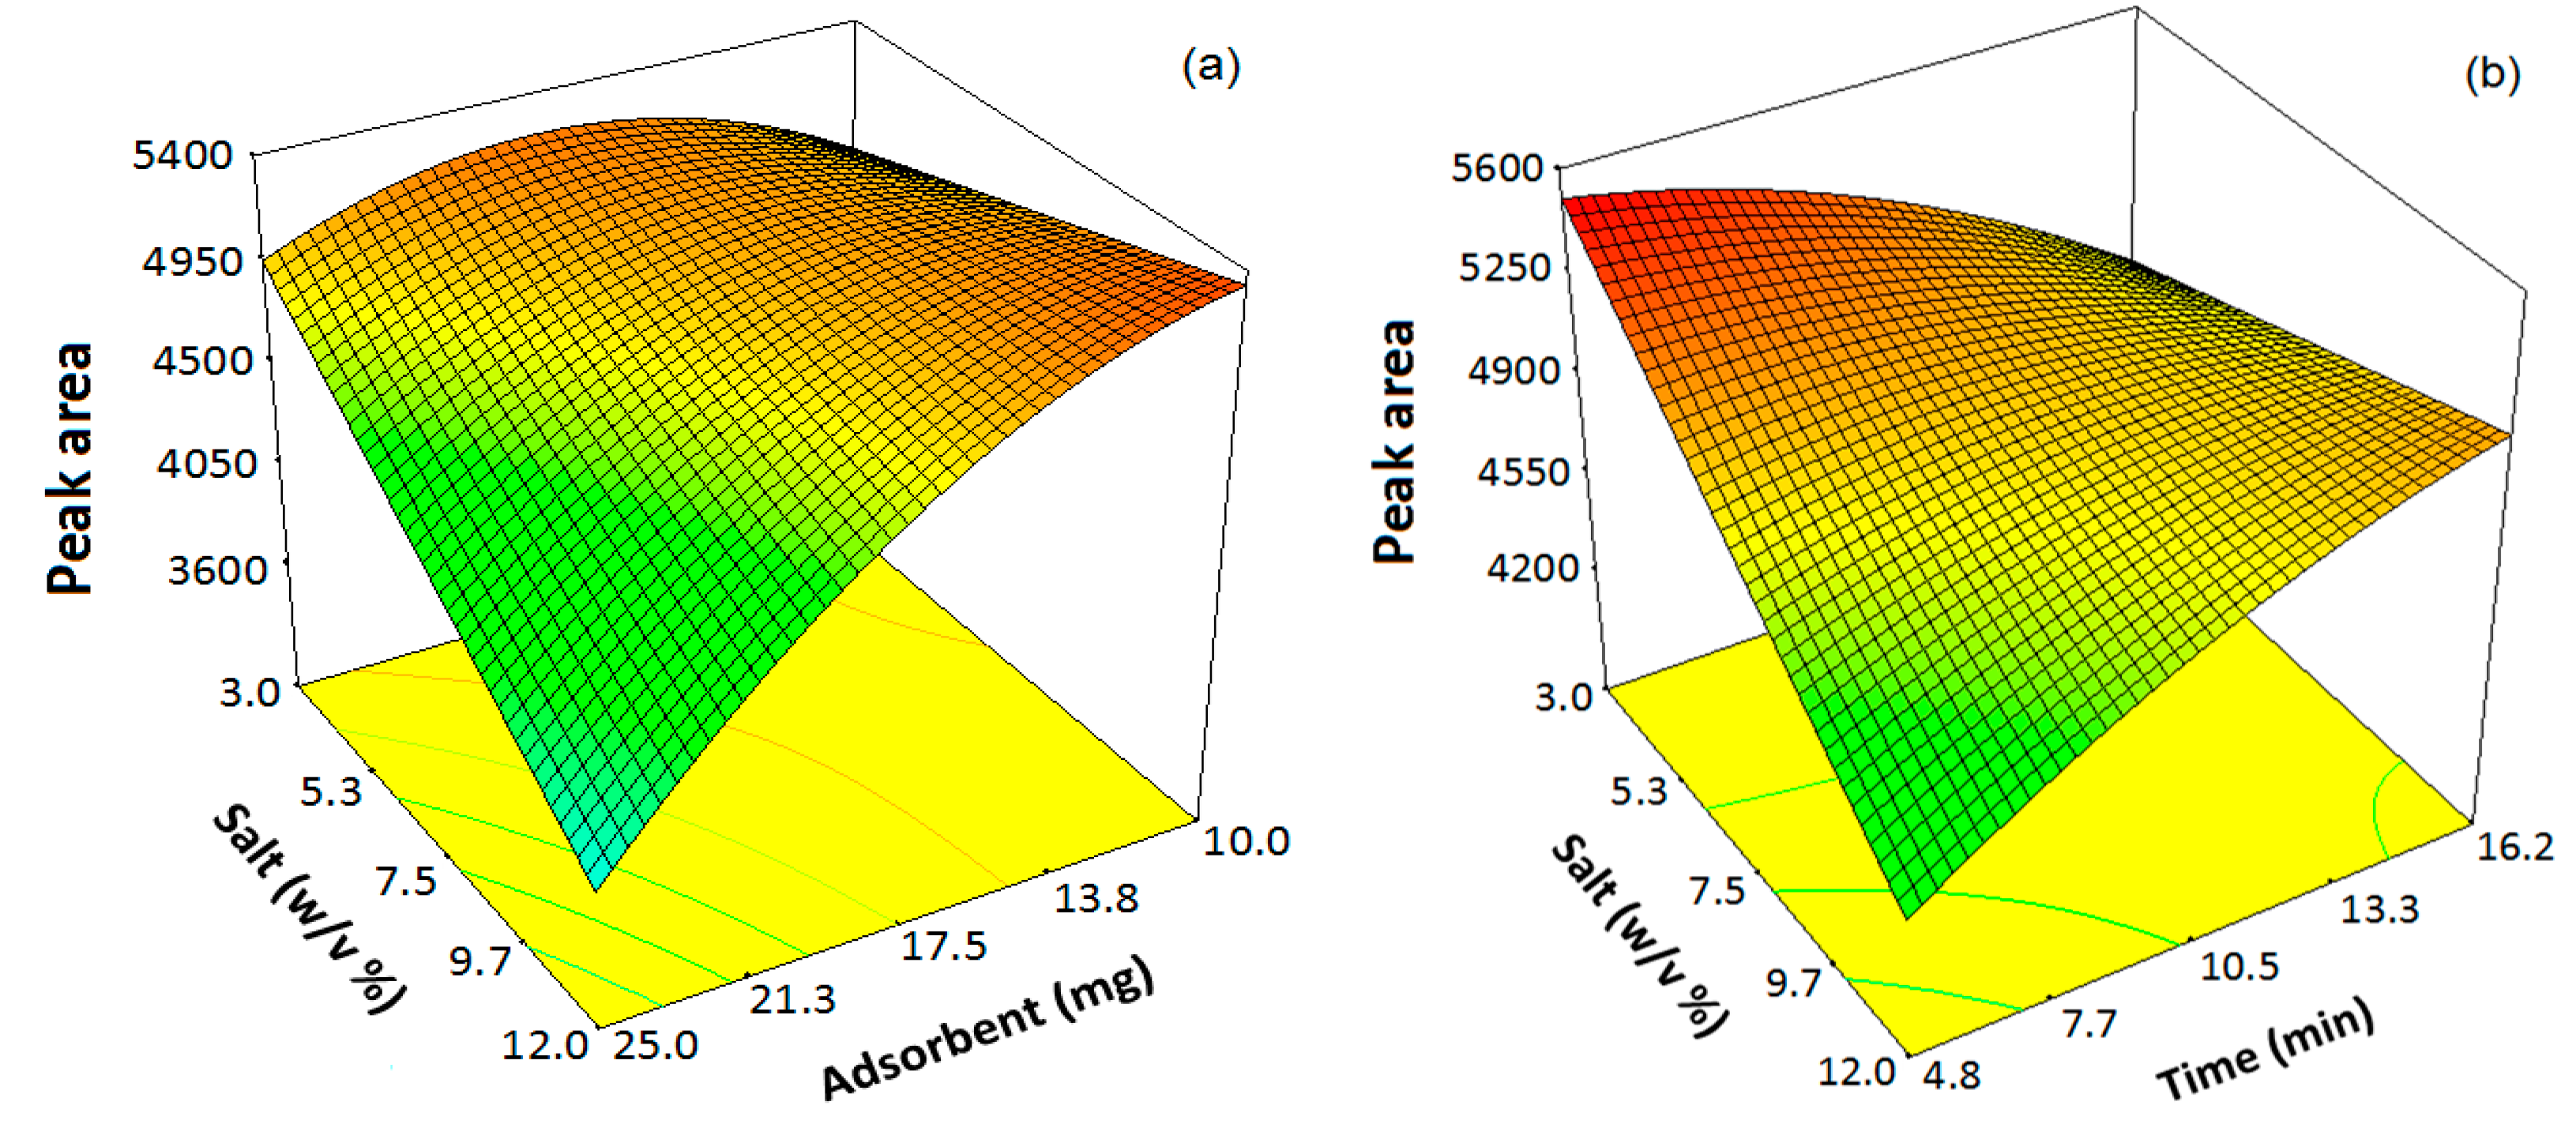
3.2. Response Surface Modeling and Optimization

In this study, a central composite design (CCD) method was utilized to optimize the magnetic solid-phase extraction of PAHs.
The CCD offers an efficient approach for rapid and systematic optimization of a method with multiple interacting parameters. A central composite design consists of a factorial design at two levels (Nf = 2k), a star design (Ns = 2k), and a set of replicated center points (N0), where k indicator is the number of parameters that are examined in five levels [26]. The star points are positioned at positive α and negative α distances from the center of the experimental domain. The value of α, necessary for ensuring rotatability, was determined to be ±1.682 through the utilization of the following equation.
α = ∜(Nf)
The main parameters, their levels, and symbols are given in Table S1. The efficiency of the MSPE process is influenced by several key characteristics, as determined through our initial analyses and experimental investigations. These parameters include the dose of adsorbent, the duration of extraction, and the concentration of salt. The extraction efficiency (response) was determined by measuring the peak area of thirteen PAHs through chromatographic analysis. The number of required experiments (N) for the CCD was determined to equal 23 using Equation (2):
N = Nf + Ns + N0
The order of experimental runs in optimization was randomized in order to decrease the effects of nuisance factors. Table S2 displays the matrix of the design, which encompasses the number and sequence of the experiments, the levels of the components within each experiment, and the corresponding responses (the Supplementary Data File). After performing all 23 experiments and analysis of obtained responses, a quadratic polynomial regression model was obtained through the stepwise selection method. The regression model with actual factors is given in Equation (3).
Y = 3585 + 252A + 18S − 44T − 13AS + 16ST − 5A2 − 3T2
where Y, A, S, and T represent the variables denoting the total chromatographic peak area, adsorbent dosage, salt concentration, and extraction time, respectively. The statistical significance of the model terms was assessed using the analysis of variance (ANOVA) approach, as presented in Table S3.
To determine how well the generated model fits the data, the statistical parameters of R2 (determination coefficient), adjusted-R2 (adj-R2), and predicted-R2 (pred-R2) were used. The coefficient of determination, denoted as R2, is a statistical metric that quantifies the degree of fit between the observed data and the regression line. Its value ranges from 0 to 1. The closer the value to unity, the better the fit achieved for the data. The adj-R2 is a modified version of R2 that has been adjusted for the number of terms in the model. It increases only if the optimized term improves the model more than would be expected by chance. The adj-R2 usually has a positive value lower than the R2. The predictive R-squared (pred-R2) is a metric that quantifies the ability of a regression model to accurately anticipate the responses of incoming observations. This statistical measure aids in assessing the adequacy of the model in accurately representing the original dataset while also highlighting its limitations in generating reliable predictions for novel observations. Both the adjusted R-squared (adj-R2) and anticipated R-squared (pred-R2) provide useful insights for assessing the adequacy of the number of terms in a model. The adjusted R-squared value has the potential to be positive or negative, and it consistently remains lower than the R-squared number. The predicted R-squared, like the adjusted R-squared, has the potential to assume negative values and consistently remains lower than the R-squared. Typically, a desirable outcome is to observe a difference of around 0.2 between the values of pred-R2 and adj-R2. The values of R2, adj-R2, and pred-R2 are 0.95, 0.93, and 0.81, respectively. The metrics serve to validate and demonstrate the appropriateness of the suggested model. Furthermore, the leverage and Cook’s distance test for the identification of outliers did not identify any outliers in the datasets.
The response surface plot in Figure 3a depicts the interaction between adsorbent dose and salt concentration in a three-dimensional (3D) representation. As can be seen, at low adsorbent dosages (5–14 mg), adding salt to the aqueous sample solution enhances the extraction efficiency of PAHs due to the salting-out effect. In this condition, the solubility of PAHs decreases with increasing molecular weight or the number of aromatic rings. Therefore, higher recoveries are obtained for PAHs with four or more aromatic rings, such as pyrene, benzo[a]anthracene, and chrysene [27]. When the adsorbent dose exceeds 14 mg, the addition of salt has a diminishing effect on the extraction efficiency. The loss of adsorption capacity can be caused by two main parameters: firstly, the deposition of salt in the pores of the 3DG/Fe3O4 hydrogel, and secondly, the rise in viscosity of the aqueous solution, which hinders the diffusion of analytes from the bulk solution to the adsorbent [28,29]. The effect of the interaction of salt and extraction time on the extraction efficiency was also studied, and the related 3D response surface plot is depicted in Figure 3b. The plot shows that if salt is added in the first time period of extraction (<7.2 min), the efficiency decreases due to the deposition of salt in the pores of 3DG/Fe3O4 hydrogel and reduces the adsorption capacity. However, at extraction times longer than 7.2 min, adding salt enhances extraction efficiency. This could be ascribed to the salting out effect. Finally, to obtain the optimum condition, the Nelder–Mead simplex optimization method was used, and the obtained optimal condition is as follows: 10 mg for adsorbent, 4 min for extraction time, and 3.0% w/v for salt concentration.
To assess the precision of the outcomes derived from the response surface model, an approach was implemented utilizing the optimal circumstances. The experimental response with three replicates was 5116 (RSD% = 2.1). Hence, a notable concurrence was seen between the computed optimal response and the experimental response.

3.3. Method Validation

The current investigation evaluated the linear dynamic range (LDR), limit of detection (LOD), limit of quantitation (LOQ), and precision of the suggested methodology under optimal conditions. The results of these assessments are displayed in Table 1. The linearity of the method being investigated was assessed by analyzing standard solutions of PAHs at different concentrations of 5, 10, 25, 50, and 100 ng mL−1. The solutions contained biphenyl at a concentration of 50 ng mL−1, which functioned as the internal standard. The calibration curves were generated using the graphical representation of the overall peak area against the amounts of PAHs. The approach exhibited linearity within the concentration range of 5 to 100 ng mL−1, with determination coefficients (R2) ranging from 0.9913 to 0.9997. The LODs and LOQs were determined using the following formulas: CLOD = 3 × Sd/m (where Sd is the standard deviation of the blank and m is the slope of the calibration graph), and CLOQ = 10 × Sd/m. The LODs were found to range from 0.016 to 0.20 ng mL−1, while the LOQs ranged from 0.053 to 0.66 ng mL−1. The assessment of the method’s precision was conducted by calculating the relative standard deviation (RSD%) through the repetition of the proposed procedure on three consecutive days. The RSDs for intra-day and inter-day measurements were found to be 3.9% and 4.7%, respectively.

3.4. Reusability of the Adsorbent

The investigation focused on examining the reusability of 3DG/Fe3O4 over a series of successive adsorption/elution cycles. Following the desorption of the analyte, the adsorbent underwent two subsequent washes, each consisting of 2 mL of ethanol and 2 mL of distilled water, respectively. Subsequently, the material was subjected to a drying process and then repurposed for subsequent iterations. The experimental findings indicate that the 3DG/Fe3O4 composite material exhibits a high degree of reusability, as it may be employed for extraction purposes for a minimum of 30 cycles without experiencing a notable decline in extraction recovery efficiency.

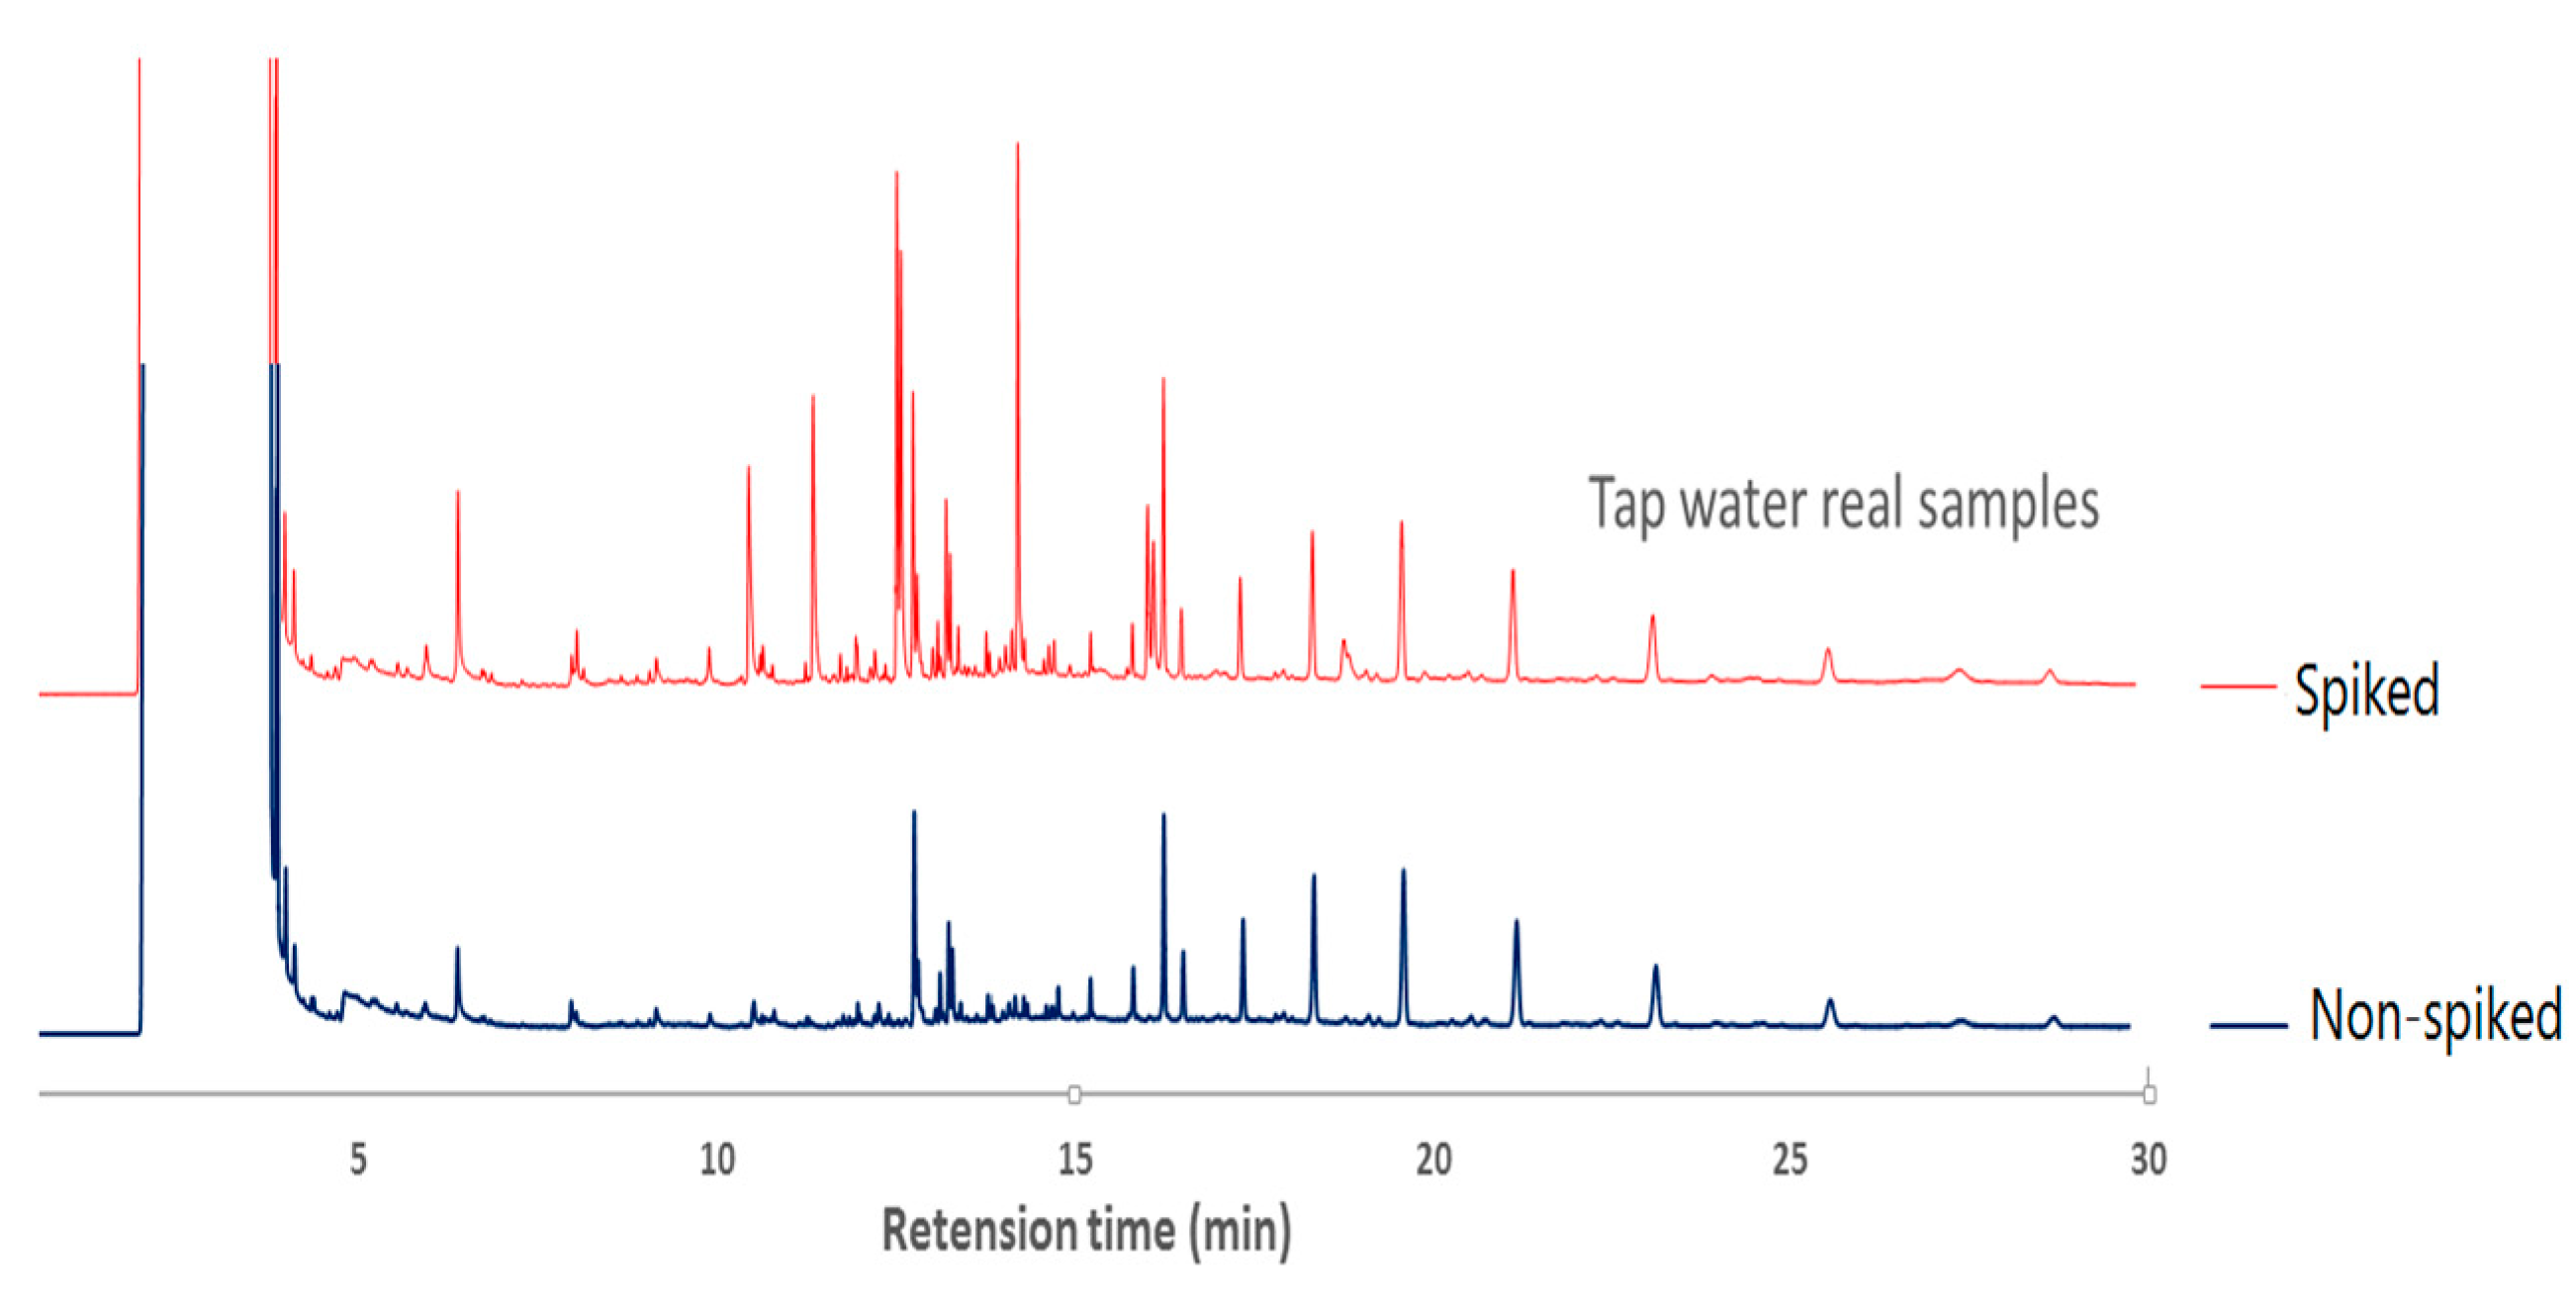
3.5. Analysis of Real Samples

The suitability of the suggested methodology for the analysis of PAHs in real samples was also assessed. For this, a variety of water samples, such as rainwater, river water, and tap water, were chosen and subjected to analysis using the prescribed methodology under the optimal parameters. The rainwater samples were collected at six different locations in Tehran (northern Iran) during periods of heavy rain and other periods of mixed rainfall. A water sample from the Darband River, located north of Tehran, Iran, was obtained for analysis. Numerous hookah-serving establishments can be found near riverbanks, where their effluent is discharged directly into the river without undergoing any form of treatment. The tap water sample was obtained from the laboratory located on the university campus. The water samples that were gathered underwent filtration using a membrane filter with a pore size of 0.45 mm. Subsequently, the filtered samples were stored in glass bottles designed to block out light and kept at a temperature of 4 °C until they were ready to be analyzed. To assess the matrix’s influence on the recovery method’s effectiveness, the samples were spiked with a standard solution, including a blend of PAHs at a concentration of 25 ng mL−1. Following that, the specimens underwent examination utilizing the suggested methodology. Determining relative recoveries (RRs) involved the application of Equation (4) to the results from the process, which are summarized in Table 2. The findings suggest that the approach developed has the potential to be effectively utilized for the measurement of PAHs at low concentrations in real water samples from the environment. The PAHs were not detected in tap water, and the high recoveries in tap water were due to a clean matrix. The low recoveries in river and rainwater could be due to the complex matrix samples. However, the PAHs were detected in river and rainwater, which probably contain discharge from industries and vehicle activities. Figure 4 illustrates the gas chromatography–flame ionization detection (GC-FID) chromatograms obtained for the standard mixture of PAHs, as well as the non-spiked and spiked tap water samples, all of which were analyzed using the optimized experimental parameters. Figure 5 shows the GC-Fid chromatogram of the non-spiked and spiked tap water samples.
R R % = C f o u n d C r e a l C a d d e d × 100
The concentration of the analyte in the spiked sample solution (Cfound), ascertained through the utilization of the calibration curve, can be compared with the concentration of the analyte in the non-spiked sample solution (Creal) and the concentration of the standard solution that was introduced to the real sample (Cadded).

3.6. Comparison with Other Methods

A comprehensive review of the literature was conducted to identify previously documented methodologies for the quantification of PAHs and to compare them with the suggested approach. As can be seen in Table 3 [13,30,31,32,33,34], the linearity of the proposed method (3 × 10³) is broader than that of the other MSPE methods such as Fe3O4-ppy MSPE-GC/MS (0.01–2). The precision is better than the methods mentioned in Table 3. Furthermore, the LODs exhibit similarities, but the dosage of adsorbent employed is lower in comparison to alternative methodologies. The shorter extraction time (4 min) and low adsorbent dosage (10 mg) in the present method can be attributed to the large surface area of the adsorbent that it provides. This property facilitates a fast mass transfer and rapid establishment of the extraction equilibrium.

4. Conclusions

This study highlights the potential of graphene nanomaterials as effective adsorbents for environmental pollutants, exploiting graphene’s unique attributes such as super high surface area and strong π−π interaction on the surface. Preconcentration, extraction, and analysis of thirteen PAHs in environmental water samples were carried out utilizing a response-surface-optimized MSPE approach coupled with GC-FID/MS. The extraction procedure was based on the magnetic three-dimensional graphene nanocomposite (3DG/Fe3O4). The favorable extraction performance of the adsorbent (3DG/Fe3O4) can be attributed to its structural properties. The accessibility of the phenyl rings of PEA grafted on the GO nanosheets allows for effective interaction with PAHs due to the presence of a delocalized electron system. The approach incorporates environmentally friendly chemistry (due to the minimal consumption of organic solvents), a reasonably inexpensive procedure, a quick extraction time, low adsorbent use, and much simplified adsorbent separation, all while avoiding time-consuming operations such as centrifugation. In addition, the extensive delocalized π-electron system and strong π-stacking interactions of 3DG/Fe3O4 with the aromatic-ring-containing compounds increase the selectivity of the adsorbent toward PAHs.

Supplementary Materials

The following supporting information can be downloaded at: https://www.mdpi.com/article/10.3390/separations10110564/s1, Table S1: The main parameters, their symbols and levels in the central composite design; Table S2: Design matrix for the central composite design; Table S3: Analysis of variance (ANOVA) for the central composite design.

Author Contributions

Conceptualization, H.S. and M.K.; methodology, H.R.N.; software, visualization, S.K. and S.M.; validation, M.E.B.; formal analysis, H.R.N.; investigation, A.M.; resources, S.R.; data curation, writing—review and editing, H.K. All authors have read and agreed to the published version of the manuscript.

Funding

This research received no external funding.

Data Availability Statement

Data are contained within the article and supplementary materials.

Acknowledgments

The authors acknowledge the University of Tehran for providing facilities.

Conflicts of Interest

The authors declare no conflict of interest.

References

  1. Nazir, N.A.M.; Raoov, M.; Mohamad, S. Spent tea leaves as an adsorbent for micro-solid-phase extraction of polycyclic aromatic hydrocarbons (PAHs) from water and food samples prior to GC-FID analysis. Microchem. J. 2020, 159, 105581. [Google Scholar] [CrossRef]
  2. Hamadan, R.; Al-Taee, M.M.; Mahdi, A.B.; Hadrawi, S.K.; Dwijendra, N.K.A.; Kavitha, M.; Mustafa, Y.F.; Wadday, A.K. Entrapment of polyethylene terephthalate derived carbon in Ca-alginate beads for solid phase extraction of polycyclic aromatic hydrocarbons from environmental water samples. Inorg. Chem. Comm. 2022, 146, 110147. [Google Scholar] [CrossRef]
  3. Menzie, C.A.; Potocki, B.B. Exposure to carinogenic PAHs in the Environment. Environ. Sci. Technol. 1992, 26, 1278–1284. [Google Scholar] [CrossRef]
  4. ATSDR. Toxicological Profile for Total Petroleum Hydrocarbons (TPH); U.S. Department of Health and Human Services, Public Health Service, Agency for Toxic Substances and Disease Registry: Atlanta, GA, USA, 1999; 315p.
  5. Bagheri, A.R.; Aramesh, N.; Gong, Z.; Cerda, V.; Lee, H.K. Two-dimensional materials as a platform in extraction methods: A review. TrAC Trend. Anal. Chem. 2022, 152, 116606. [Google Scholar] [CrossRef]
  6. Câmara, J.S.; Perestrelo, R.; Berenguer, C.V.; Andrade, C.F.P.; Gomes, T.M.; Olayanju, B.; Kabir, A.; Rocha, C.M.R.; Teixeira, J.A.; Pereira, J.A.M. Green extraction techniques as advanced sample preparation approaches in biological, food, and environmental matrices: A review. Molecules 2022, 27, 2953. [Google Scholar] [CrossRef] [PubMed]
  7. Ullah, N.; Tuzen, M. A comprehensive review on recent developments and future perspectives of switchable solvents and their applications in sample preparation techniques. Green Chem. 2023, 25, 1729–1748. [Google Scholar] [CrossRef]
  8. Abuzar, K.; Samanidou, V. Fabric phase sorptive extraction: A paradigm shift approach in analytical and bioanalytical sample preparation. Molecules 2021, 26, 865. [Google Scholar]
  9. Suseela, M.N.L.; Viswanadh, M.K.; Mehata, A.K.; Priya, V.; Setia, V.A.; Malik, A.K.; Gokul, P.; Selvin, J.; Muthu, M.S. Advances in solid-phase extraction techniques: Role of nanosorbents for the enrichment of antibiotics for analytical quantification. J. Chromatogr. A 2023, 1695, 463937. [Google Scholar] [CrossRef]
  10. Chen, L.; Xu, S.; Li, J. Recent advances in molecular imprinting technology: Current status, challenges and highlighted applications. Chem. Soc. Rev. 2011, 40, 2922. [Google Scholar] [CrossRef]
  11. Lin, J.H.; Wu, Z.-H.; Tseng, W.-L. Extraction of environmental pollutants using magnetic nanomaterials. Anal. Methods 2010, 2, 1874–1879. [Google Scholar] [CrossRef]
  12. Zhang, D.; Yang, X.-A.; Jin, C.-Z.; Zhang, W.-B. Ultrasonic assisted magnetic solid phase extraction of ultra-trace mercury with ionic liquid functionalized materials. Anal. Chim. Acta 2023, 1245, 340865. [Google Scholar] [CrossRef]
  13. Mohammad, F.; Shirani, M.; Rashidi-Nodeh, H. The recent advances in magnetic sorbents and their applications. TrAC Trend. Anal. Chem. 2021, 141, 116302. [Google Scholar]
  14. Somayeh, M.; Sabouri, Z.; Darroudi, M. Greener synthesis and medical applications of metal oxide nanoparticles. Ceram. Int. 2021, 47, 19632–19650. [Google Scholar]
  15. Zhang, T.; Wang, W.; Zhao, Y.; Bai, H.; Wen, T.; Kang, S.; Song, G.; Song, S.; Komarneni, S. Removal of heavy metals and dyes by clay-based adsorbents: From natural clays to 1D and 2D nanocomposites. Chem. Eng. J. 2021, 420, 127574. [Google Scholar] [CrossRef]
  16. Luo, X.; Zhang, F.; Ji, S.; Yang, B.; Liang, X. Graphene nanoplatelets as a highly efficient solid-phase extraction sorbent for determination of phthalate esters in aqueous solution. Talanta 2014, 120, 71–75. [Google Scholar] [CrossRef] [PubMed]
  17. Shahabaldin, R.; Mojiri, A.; Park, J.; Nawrot, N.; Wojciechowska, E.; Marraiki, N.; Zaghloul, N.S.S. Removal of lead ions from wastewater using lanthanum sulfide nanoparticle decorated over magnetic graphene oxide. Environ. Res. 2022, 204, 111959. [Google Scholar]
  18. Sadanala, K.C.; Chung, B.C. Graphene nanoplatelets as a solid phase extraction sorbent for analysis of chlorophenols in water. J. Korean Soc. Appl. Biol. Chem. 2013, 56, 673–678. [Google Scholar] [CrossRef]
  19. Mahpishanian, S.; Sereshti, H. Graphene oxide-based dispersive micro-solid phase extraction for separation and preconcentration of nicotine from biological and environmental water samples followed by gas chromatography-flame ionization detection. Talanta 2014, 130, 71–77. [Google Scholar] [CrossRef]
  20. Process, S.; Cong, H.; Ren, X.; Wang, P.; Yu, S. Macroscopic Multifunctional Graphene-Based Hydrogels and Aerogels by a Metal Ion Induced self-assembly process. ACS Nano. 2012, 6, 2693–2703. [Google Scholar]
  21. Mahpishanian, S.; Sereshti, H. Three-dimensional graphene aerogel-supported iron oxide nanoparticles as an efficient adsorbent for magnetic solid phase extraction of organophosphorus pesticide residues in fruit juices followed by gas chromatographic determination. J. Chromatogr. A 2016, 1443, 43–53. [Google Scholar] [CrossRef]
  22. Han, Q.; Wang, Z.; Xia, J.; Chen, S.; Zhang, X.; Ding, M. Facile and tunable fabrication of Fe3O4/graphene oxide nanocomposites and their application in the magnetic solid-phase extraction of polycyclic aromatic hydrocarbons from environmental water samples. Talanta 2012, 101, 388–395. [Google Scholar] [CrossRef] [PubMed]
  23. Maddah, B.; Shamsi, J. Extraction and preconcentration of trace amounts of diazinon and fenitrothion from environmental water by magnetite octadecylsilane nanoparticles. J. Chromatogr. A 2012, 1256, 40–45. [Google Scholar] [CrossRef] [PubMed]
  24. Deng, H.; Li, X.; Peng, Q.; Wang, X.; Chen, J.; Li, Y. Monodisperse magnetic single-crystal ferrite microspheres. Angew. Chem. 2005, 117, 2842–2845. [Google Scholar] [CrossRef]
  25. Ma, Z.; Guan, Y.; Liu, H. Synthesis and characterization of micron-sizedmonodisperse superparamagnetic polymer particles with amino groups. J. Polym. Sci. Part A Polym. Chem. 2005, 43, 3433–3439. [Google Scholar] [CrossRef]
  26. Bezerra, M.A.; Santelli, R.E.; Oliveira, E.P.; Villar, L.S.; Escaleira, L.A. Response surface methodology (RSM) as a tool for optimization in analytical chemistry. Talanta 2008, 76, 965–977. [Google Scholar] [CrossRef] [PubMed]
  27. Mahpishanian, S.; Sereshti, H.; Ahmadvand, M. A nanocomposite consisting of silica-coated magnetite and phenyl-functionalized graphene oxide for extraction of polycyclic aromatic hydrocarbon from aqueous matrices. J. Environ. Sci. 2017, 55, 164–173. [Google Scholar] [CrossRef] [PubMed]
  28. Razmi, H.; Jabbari, M. Development of graphene-carbon nanotube-coated magnetic nanocomposite as an efficient sorbent for HPLC determination of organophosphorus pesticides in environmental water samples. Int. J. Environ. Anal. Chem. 2015, 95, 1353–1369. [Google Scholar] [CrossRef]
  29. Karpierz, E.; Drabińska, A.; Bożek, R.; Kaźmierczak, P.; Wysmołek, A.; Kamińska, M.; Strupiński, W. ESR Spectroscopy of Graphene with Adsorbed NaCl Particles. Acta Phys. Pol. A 2014, 126, 1187–1189. [Google Scholar] [CrossRef]
  30. Mehdinia, A.; Khodaee, N.; Jabbari, A. Fabrication of graphene/Fe3O4@polythiophene nanocomposite and its application in the magnetic solid-phase extraction of polycyclic aromatic hydrocarbons from environmental water samples. Anal. Chim. Acta 2015, 868, 1–9. [Google Scholar] [CrossRef]
  31. Sarafraz-Yazdi, A.; Rokhian, T.; Amiri, A.; Ghaemi, F. Carbon nanofibers decorated with magnetic nanoparticles as a new sorbent for the magnetic solid phase extraction of selected polycyclic aromatic hydrocarbons from water samples. New J. Chem. 2015, 39, 5621–5627. [Google Scholar] [CrossRef]
  32. Liu, Y.; Li, H.; Lin, J.-M. Magnetic solid-phase extraction based on octadecyl functionalization of monodisperse magnetic ferrite microspheres for the determination of polycyclic aromatic hydrocarbons in aqueous samples coupled with gas chromatography-mass spectrometry. Talanta 2009, 77, 1037–1042. [Google Scholar] [CrossRef]
  33. Xu, S.-N.; Zhao, Q.; He, H.-B.; Yuan, B.-F.; Feng, Y.-Q.; Yu, Q.-W. Rapid determination of polycyclic aromatic hydrocarbons in environmental water based on magnetite nanoparticles/polypyrrole magnetic solid-phase extraction. Anal. Methods 2014, 6, 7046–7053. [Google Scholar] [CrossRef]
  34. Reyes-Gallardo, E.M.; Lucena, R.; Cárdenas, S.; Valcárcel, M. Magnetic nanoparticles-nylon 6 composite for the dispersive micro solid phase extraction of selected polycyclic aromatic hydrocarbons from water samples. J. Chromatogr. A 2014, 1345, 43–49. [Google Scholar] [CrossRef]
Figure 1. A schematic procedure for developed MSPE.
Separations 10 00564 g001
Figure 2. Characterization of nanocomposite: (a) SEM image; (b) FT-IR spectrum; (c) VSM curve; (d) XRD pattern; (e) Raman spectra; and (f) BET adsorption–desorption cycle.
Separations 10 00564 g002aSeparations 10 00564 g002b
Figure 3. Response surface plot of (a) salt concentration and dosage of adsorbent at a constant level of time of extraction, 10.5 min; (b) salt concentration and time of extraction at a constant level of dosage of adsorbent, 17.5 mg.
Separations 10 00564 g003
Figure 4. Chromatogram depicting the standard combination of thirteen PAHs at a concentration of 100 ng per mL in methanol (MeOH). (1) Acenaphthylene; (2) fluorene; (3) phenantherene; (4) anthracene; (5) pyrene; (6) benz[a]anthracene; (7) chrysene; (8) benzo[b]fluoranthene; (9) benzo[k]fluoranthene; (10) benzo[a]pyrene; (11) indeno [123-CD]pyrene; (12) dibenz[ah]anthracene; and (13) benzo[ghi]perylene. GC-FID: gas chromatography with flame ionization detection; PAHs: polycyclic aromatic hydrocarbons.
Separations 10 00564 g004
Figure 5. Chromatograms produced using the described approach for non-spiked and spiked tap water are presented as representative GC-FID chromatograms.
Separations 10 00564 g005
Table 1. Analytical merit of the developed MSPE-GC-FID method.
CompoundLDR aR2 bCalibration EquationLOD c LOQ dRSD e (%), n = 3
Acenaphthylene5–1000.9984Y = 3.6x + 13.00.020.052.1
Fluorene5–1000.9990Y = 8.4x − 20.60.110.362.6
Phenanthrene5–1000.9997Y = 11.3x − 7.20.200.731.9
Anthracene5–1000.9973Y = 11.8x − 7.80.200.733.0
Pyrene5–1000.9989Y = 15.8x − 11.30.020.063.1
Benz[a]anthracene5–1000.9945Y = 6.9x − 5.10.140.463.6
Chrysene5–1000.9948Y = 7.5x − 0.040.040.133.0
Benzo[b]fluoranthene5–1000.9925Y = 2.5x + 7.50.200.662.9
Benzo[k]fluoranthene5–1000.9913Y = 2.5x + 3.60.170.563.9
Benzo[a]pyrene5–1000.9913Y = 1.6x − 8.40.100.333.3
Indeno [123-CD]pyrene5–1000.9925Y = 0.2x − 1.30.120.403.5
Dibenz[ah]anthracene5–1000.9987Y = 0.2x − 1.00.120.403.8
benzo[ghi]perylene5–1000.9965Y = 0.2x − 1.80.120.402.8
a Dynamic range (ng mL−1). b Determination coefficient. c Limit of detection (ng mL−1). d Limit of quantification (ng mL−1). e Coefficient of variation.
Table 2. Determination of PAHs in real water samples.
CompoundAdded (ng mL−1)Found (ng mL−1)Recovery (%)
Tap WaterRiverRainwaterTap WaterRiverRainwaterTap WaterRiverRainwater
Acenaphthylene000n.d.2.840.6106.29106.6281.82
25252543.4529.4921.06
Fluorene000n.d.n.d.4.697.0373.4445.94
25252524.2518.3616.08
Phenanthrene000n.d.n.d.n.d.79.8862.2471.06
25252519.9715.5617.76
Anthracene000n.d.n.d.n.d.86.1766.1574.97
25252521.5416.5318.74
Pyrene000n.d.n.d.2.364.8546.4261.85
25252516.2111.617.79
Benz[a]anthracene000n.d.n.d.2.4659.117.4153.33
25252514.774.3513.33
Chrysene000n.d.n.d.1.150.9410.9341.34
25252512.732.7310.35
Benzo[b]fluoranthene000n.d.5.367.63102.6382.5885.08
25252525.6526.0121.27
Benzo[k]fluoranthene000n.d.n.d.n.d.103.9794.1279.58
25252525.9923.5319.89
Benzo[a]pyrene000n.d.n.d.n.d.98.8383.9168.73
25252524.7120.9717.18
Indeno [123-CD]pyrene000n.d.n.d.n.d.109.0897.5382.68
25252527.2724.3820.68
Dibenz[ah]anthracene000n.d.n.d.n.d.109.13101.5484.47
25252527.2825.3821.11
benzo[ghi]perylene000n.d.n.d.n.d.109.97101.3687.59
25252527.4925.3821.89
Table 3. A comparison of the MSPE-GC/FID/MS approach that was proposed with existing procedures for the determination of PAHs that have been described in the past.
AdsorbentMethodPAHsLOD aLDR bRSD c (%)Time (min)Dosage (mg)Ref.
G/Fe3O4@PT dMSPE-GC/FID50.01–0.020.03–804.3–6.31020[30]
CNFs-Fe3O4 eMSPE-GC/FID30.01–0.030.08–1003.2–11.21510[31]
M-C18 fMSPE-GC/MS160.8–3610–8002–10650[32]
Fe3O4-ppy gMSPE-GC/MS10(0.38 − 5.01) × 1030.01–213.3320[33]
MNPs-N6 hMSPE-UPLC i40.05–0.581–506.93240[34]
OPA/MMNPs jMSPE-GC/MS160.01–0.070.2–10017.6250[13]
3DG/Fe3O4MSPE-GC/FID/MS130.01–0.070.03–1002–7410This work
a Limit of detection (ng mL−1). b Linear dynamic range (ng mL−1). c Relative standard deviation. d Graphene/Fe3O4/polythiophene. e Magnetic carbon nanofibers. f Magnetic C18 microspheres. g Fe3O4/polypyrrole nanoparticles. h Magnetic nanoparticles-nylon 6. i Ultra-performance liquid chromatography. j n-Octadecylphosphonic-acid-modified mesoporous magnetic nanoparticles.
Disclaimer/Publisher’s Note: The statements, opinions and data contained in all publications are solely those of the individual author(s) and contributor(s) and not of MDPI and/or the editor(s). MDPI and/or the editor(s) disclaim responsibility for any injury to people or property resulting from any ideas, methods, instructions or products referred to in the content.

