Article

Ultrasonic (US)-Assisted Electrocoagulation (EC) Process for Oil and Grease (O&G) Removal from Restaurant Wastewater

by
Shefaa Omar Abu Nassar
1,
Mohd Suffian Yusoff
1,2,*,
Herni Halim
1,
Nurul Hana Mokhtar Kamal
1,
Mohammed J. K. Bashir
3,
Teh Sabariah Binti Abd Manan
1,
Hamidi Abdul Aziz
1,2 and
Amin Mojiri
4
1
School of Civil Engineering, Engineering Campus, Universiti Sains Malaysia, Nibong Tebal 14300, Malaysia
2
Solid Waste Management Cluster, Engineering Campus, Universiti Sains Malaysia, Nibong Tebal 14300, Malaysia
3
Department of Environmental Engineering, Faculty of Engineering and Green Technology, Universiti Tunku Abdul Rahman, Kampar 31900, Malaysia
4
Department of Civil and Environmental Engineering, Graduate School of Advanced Science and Engineering, Hiroshima University, Higashihiroshima 739-8527, Japan
*
Author to whom correspondence should be addressed.
Separations 2023, 10(1), 61; https://doi.org/10.3390/separations10010061
Submission received: 12 December 2022 / Revised: 10 January 2023 / Accepted: 13 January 2023 / Published: 16 January 2023
(This article belongs to the Collection Recent Advances in Environmental Separations Analysis)

Abstract

:
Restaurant wastewater contains a high concentration of O&G, up to 3434 mg/L. This study aims to (a) assess the efficiency of EC combined with US methods for O&G removal in restaurant wastewater, (b) identify the optimum condition for COD degradation using EC treatment via response surface methodology (RSM), and (c) determine the morphological surface of the aluminium (Al) electrode before and after EC treatment. The wastewater samples were collected from the Lembaran cafeteria at the Universiti Sains Malaysia (USM). The efficiency of EC, US, and US-EC, combined methods for O&G removal, was investigated using a batch reactor (pH 7). The interelectrode distance (ID, 2–6 cm), electrolysis time (T, 15–35 min), and current density (CD, 40–80 A/m2) were analysed, followed by RSM. The response variables were O&G (1000 mg/L) and chemical oxygen demand (COD low range, 1000 mg/L). The central composite design (CCD) with a quadratic model was used to appraise the effects and interactions of these parameters. The morphological surface of the electrode used was observed via scanning electron microscopy (SEM). The optimum removal efficiencies obtained were 95.4% (O&G) and 75.9% (COD) (ID: 2.4 cm, T: 30.5 min, and CD: 53.2 A/m2). The regression line fitted the data (R2 O&G: 0.9838, and R2 COD: 0.9558). The SEM images revealed that the use of US was useful in minimising cavitation on the electrode surface, which could lower the EC treatment efficacy. The US-EC combined technique is highly recommended for O&G removal from the food industry’s wastewater.

1. Introduction

The food business multiplies a significant amount of wastewater that is difficult to treat. The effluent typically contains a large amount of organic matter from meal leftovers, oils, spices, and detergents [1,2]. The principal contaminant in this kind of wastewater is O&G. Additionally, there are other sources of oily wastewater, including oilfield wastewater, wastewater from petroleum refineries, metal production and finishing wastewater, ship and automobile cleaning wastewater, food processing wastewater, slaughterhouse wastewater, and tannery wastewater [3]. As a result, in recent years, oily wastewater treatment has been one of the most pressing environmental issues. Oil biodegrades slowly in ecological systems, and oily molecules can prevent biological processes from working properly for a very long time [3,4]. In addition, chemical hydrolysis of O&G reactions with the existence of metal ions such as calcium in sewer lines through the saponification process results in O&G deposits that cause pipe blockages and sanitary sewer overflows (SSOs) [5]. Furthermore, oily wastewater has an impact on groundwater and surface water sources [6]. As a result, it must be subjected to a pretreatment process before discharge into waterways to meet the applicable environmental regulations and reduce O&G.
Various treatment processes have been utilised for O&G removals, such as traditional biological treatment [7], a grease trap [2], membrane technology [8], microbubble air flotation, and traditional dissolved air [9], as well as chemical coagulation, which had been used to remove the O&G but was insufficient to remove the light and fine scattered oil drops [10], as mentioned in the literature. However, despite their benefits, these techniques are still unsatisfactory for O&G removal. Therefore, there is an urgent need for the development of extremely effective techniques for eliminating O&G from water and wastewater.
EC has been successfully utilised to remove various toxins from wastewater throughout the previous decade [11], which are categorised as follows: heavy metals such as Cu and Ni [12] and iron [13], nonmetallic inorganic species such as ammonia [14], and organic pollutants such as dyes [15]. EC is an efficient method for eliminating O&G. Moreover, the EC process has many significant advantages, which include a high rate of pollution removal, small equipment size, ease of operation, and rapid sedimentation. Furthermore, EC has low capital and operational costs [16,17], and it is an environmentally friendly technology due to its low sludge production and lack of chemical additions [4,18]. The mechanisms of EC happen when using an anode and a cathode, and the water with contaminants will flow between those two fields, i.e., two aspects or electrodes. The most commonly used materials are (Al) and (Fe), which have good coagulation and contaminant removal properties and are readily available, affordable, low in toxicity, and have high valence [19]. When applying electricity, oxidation reactions occur at the anode to dissolve and produce metal cations, while the cathode undergoes reduction reactions to release hydroxyl anions and hydrogen gas H 2 [20]. In the EC process, these anions and cations mix and react to produce metal oxides and hydroxides, which function as coagulants [21]. After coagulation, the pollutants are converted into destabilised suspended materials in an aqueous media. Due to the destabilisation of particles, they will aggregate to form large particles called flocs, which are removed by precipitation or flocculation [22,23]. Electrochemical reactions (EC) take place on the anode and cathode, while solution reactions also play a role in the process. The electrochemical reactions use metal M ions as the cathode and anode, as shown in Equations (1)–(5) [24,25]:
Anode reaction (oxidation)
M ( s ) M ( aq )   n + + ne
2 H 2 O 4 H ( aq ) +   O 2 ( g ) + 4 e
Cathode reaction (reduction)
M ( aq )   n + + n e M ( s )
2 H 2 O   + 2 e   H 2 ( g ) + 2 OH
Solution reaction
M n + + n   OH   M ( OH ) n
When using aluminium and applying direct current voltage, the anode will be subjected to oxidation, generating Al3+(aq) ions, as shown in Equation (1); if the anode potential is excessively high, a secondary reaction will occur, as shown in Equation (2). While the cathode will be subjected to reduction, water is electrolysed in the cathode, generating small hydrogen bubbles H2(g) and hydroxide OH , as shown in Equation (4), and Equation (3) will be used if noble metal ions are present. The reaction of Al3+(aq) in solution with OH to form different monomeric–polymeric species is shown in Equation (5); it produces various hydroxyl complexes depending on pH, known as coagulants, which provide active surfaces for contaminating species to adsorb or precipitate and are thus separated by the coagulation–flotation process [26].
Many operating factors influence the EC process’s performance. The researchers investigated the material of the electrode, interelectrode distance, electrode mood connection, current density, pH, conductivity, electrolysis time, voltage, and speed stirring [26,27,28,29,30,31].
In actuality, according to the relevant literature, no individual treatment procedure can accomplish a whole, effective, and inexpensive purification process. Using hybrid technology with EC reduces the required operating time of EC, thereby reducing energy and electrode consumption [32,33]. The researcher utilised an ultrasonic combined EC process to enhance the overall efficiency [20,33,34,35]. On the other hand, there is a major limitation during the EC process, which is the formation of a passive layer on the surface of the electrodes. Therefore, the passive film increases energy consumption and reduces percentage removal because this layer reduces ion metal dissolving and ion transmission [18,36,37]. To prevent passivation, thus improving efficiency, the ultrasonic process was combined with the EC process in this study.
Ultrasound irradiation generates and grows a large number of small, high-energy bubbles when the negative pressure is sufficient to cause the liquid’s molecules to move farther apart and generate cavitation bubbles [20]. These bubbles collapse inside the solution depending on the insonation power and frequency applied [22], and the collapse of the bubbles results in a rapid rise in pressure (500 atm) and temperature (up to 5000 ). The high temperature causes a pyrolytic reaction that allows the formation of in situ free radicals that act as oxidants and other chemical oxidants that can attack contaminants [38,39]. These reactions are described according to Equations (6)–(8) [36]:
H 2 O   2 · OH   + 2 H + + 2 e
OH   · OH   + e
H 2 O · H   + · OH  
Therefore, combining ultrasound with the EC process enhances the generation of radicals, resulting in increased reaction rates and more effective pollutant elimination [20]. In addition, it increases the electrode’s life and minimises the cost of the treatment [40,41].
Classical method optimisation (one factor at a time) has been thoroughly explored, but there are certain drawbacks, including the need for more experimental runs, time, and a lack of illumination of the interaction effects of the operating factors [19]. RSM is becoming more popular in optimisation studies since it delivers more information about the interaction effect of selected factors with fewer experiments [42]. The two most popular designs for response surface modelling are CCD and Box–Behnken designs [43]. Many researchers have used RSM to optimise operating factors in EC treatment, for example, [43,44,45,46].
Table 1 displays the application of EC process for oily wastewater treatment and a comparison of the optimum operating condition. Previous studies mainly reported on the efficiency of the EC process for the licorice processing wastewater [47], O&G removal for oil tanning effluent [48], oil and grease from restaurant wastewater [49], slaughterhouses [50], petroleum refinery plants [51], automobile wash [52], olive oil mill wastewater [53], common restaurant wastewater [54] and palm oil mill effluent [55]. Ji et al. [49], Temitope and Abayomi [54], and El-Ezaby et al. [1] reported on restaurant wastewater from China, Nigeria, and Egypt. They presented different types of combinations for cathode and anode, such as Al-SS [49], carbon electrodes [53], and AL-AL [54]. There is no study on the efficiency of combined EC and US treatment methods for removing O&G from effluents generated in the food and beverages sector. Therefore, the novelty of this research has been justified accordingly based on the presented combined EC (Al-Al) and US for the removal of O&G from restaurant wastewater in Malaysia.
Thus, the objectives of this study are to (a) assess the efficiency of EC combined with the ultrasonic US method for O&G removal in restaurant wastewater, (b) to identify the optimum condition for the COD degradation using EC treatment via RSM, and (c) to determine the morphological surface of the electrode before and after EC treatment.

2. Materials and Methods

2.1. Wastewater Sampling and Collection

The restaurant wastewater used in this study was obtained from the Lembaran cafeteria of USM, which is located at a latitude of 5°9′3.39″ N and a longitude of 100°29′42.52″ E (Figure 1). The wastewater was collected using wide-mouth glass (for COD and O&G analysis) and plastic containers (for other water quality parameters). The physicochemical properties of the wastewater samples were analysed immediately after the collection. Samples were preserved according to APHA (2017) (acidified to reduce pH ≤ 2, H 2   SO 4 ) and kept in a cold room (<4 ) [56].
The physicochemical parameters (temperature (°C), conductivity (μS/cm), total dissolved solids (TDS, mg/L), and pH) of wastewater samples were measured by using a multiparameter probe (YSI multiparameter probe water quality meter). Meanwhile, the total suspended solids (TSS) and chemical oxygen demand (COD) were analysed via the colourimetric method (HACH spectrophotometer, Model DR 2800). Biochemical oxygen demand (BOD) was determined by the Winkler method and dissolved oxygen (DO) used the probe method with a DO 700 (EUTECH Instruments). The total nitrogen was measured by the persulfate digestion method. The O&G was measured by gravimetric separation funnel extraction. The results of the physicochemical characterisation of the effluent of restaurant wastewater are shown in Table 2.

2.2. Efficiency of US-Assisted EC Treatment Method

A schematic description of the batch experiment EC set-up employed in the current study is shown in Figure 2. The 500 mL glass beaker as utilised for all of the EC experiments, and the reactor’s dimensions were 11.5 cm in height by 8.5 cm in width. A total of 500 mL of wastewater from each experiment was poured into the EC reactor. Two rectangular plates of electrodes were used, with one employed as an anode and the other employed as a cathode; the electrodes’ dimensions were 11.5 × 5 cm, and their thickness was 0.80 mm. The geometric effective surface area of one electrode was 32.5 cm2 when immersed 6.5 cm in the solution. The space between the bottom of the electrode and the reactor cell was 2 cm to allow the stirring of the magnetic bar. The magnetic stirrer was used at 200 rpm for a continuous stirring of wastewater to keep the sample homogeneous during the EC process as well as to transport bubbles rapidly to avoid a double layer of oxide on the electrodes [55]. The electrodes’ surfaces were cleaned with tap water to remove any contaminants such as O&G, scales, and dust. They were then again rinsed with tap water and distilled water after being submerged for 5 min in 100 mL of a diluted 15% HCl solution for electrode activation purposes. Ultimately, they were dried and weighed. The process was repeated before every experiment. The electrodes were linked to a DC power source (model: PS3005) with an output voltage and current of (0–30 V) and (0–5 A), respectively.
The temperature employed for all experiments was 27 degrees Celsius, a pH of 7, and a voltage of 10 for EC wastewater treatment. To change the pH of the effluent, sulfuric acid (H2SO4, 3 M, 1 M) and sodium hydroxide (NaOH, 3 M, 1 M) were used. Furthermore, in order to increase the conductivity of the restaurant’s wastewater, 0.5 g NaCl per 500 mL of wastewater was added.
Laboratory tests were conducted at a variable interelectrode distance, electrolysis time, and current density to examine the performance of EC to remove the O&G as well as the COD from the restaurant wastewater. All the factors have five levels at 2–6 cm, 15–35 min, and 40–80 A/m2, respectively. The One-Factor-At-A-Time was utilised to obtain optimal operating conditions.
For the US-EC experiments, the EC was utilised simultaneously with continuous ultrasound. The total wastewater in the EC reactor cell was submerged in an ultrasonic bath filled with distilled water. The operating conditions for US-EC were obtained from the EC process’s optimum factors as well as the frequency and power of the ultrasonic bath (40 kHz, 110 w). The ultrasonic waves stir the solution without the aid of a magnetic bar.
The concentration of COD and O&G were calculated before and after treatment. After that, the % of removal efficiency of COD and O&G was calculated by Equation (9).
r e m o v a l   e f f i c i e n c y   ( % ) = C i n C f i C i n × 100
where C i n and C f i were described as the concentration before and after treatment for each response.

2.3. Statistical Optimisation Utilising RSM

The RSM was utilised to predict the individual and interplay effects of factors, which is useful to achieve the desired optimisation for factors and responses, thus reducing the number of runs [41,56].
In this research, the CCD was applied as an experimental design for RSM to optimise the factors and the responses via Design-Expert® software version 13 (Stat-Ease). The interelectrode distance (A), electrolysis time (B), and current density (C) were independent factors, with five level-three factors given in Table 3. The percentage removal (%) of O&G and COD were responses and were denoted Y1 and Y2, respectively. The values were coded through Equation (10) [57,58,59]:
c o d e d   v a l u e ( α ) = x r x c Δ x
where (α) is the coded value of the factors; x r is the actual value; x c is the actual value at the centre point; Δ x is the factor’s step change. Based on the numbers of factors and their levels, the CCD generates a total of 20 runs, including 8 factorial (cube points) that carry a coded value of (−1, 1), 6 axial (star points) that carry a coded value of (−2, 2), and 6 centre points in the cube that carry a coded value of (0), as shown in Equation (11)
t o t a l   r u n = 2 k + 2 K + C p
where K = number of factors, and C p number of replicas at the centre point.
Second-order regression was utilised to determine the interaction and influence of factors and the optimum value of responses that are not available with linear regression [60], which contains all terms in the first order in addition to all cross-products and quadratic terms in the following [19,60]:
Y = β 0 + i = 1 k β a x a + a < b   β a b x a x b + a = 1 k β a x a 2 +
where Y is the response; β 0 is a constant; β a , β a b , and β a a are the linear, interactive, and quadratic regression coefficients, respectively; and the x a and x b are the values of independent variables. The percentages of error ( ε ) for O&G and COD removal efficiency between the experiment value from the laboratory and the predicted value from the model examined by Equation (13):
ε ( % ) = | e x p e r i m e n t   v a l u e p r e d e c t e d   v a l u e e x p e r i m e n t   v a l u e × 100 % |
The CCD matrix with the actual values of factors and their responses after simulating the design in the laboratory, the experiment, and the predicted removal efficiency of the O&G and COD are shown in Table 4.

2.4. SEM

The morphological surface of the Al electrode before and after EC treatment and EC-US were observed via SEM (HITACHI TM3000).

3. Results and Discussion

3.1. Batch Experiments for the EC Treatment Method

The one-factor-at-a-time classical method was utilised in order to achieve optimal operating conditions. In order to determine the effects of the factors, one factor was varied at a time while holding the others constant. The laboratory tests were conducted at an interelectrode distance of 2–6 cm, electrolysis time of 15–35 min, and current density of 40–80 A/m2 to determine the performance of the EC process to remove the O&G as well as COD.

3.1.1. ID Factor

The importance of the interelectrode distance depends on the electrostatic force. When the optimum spacing between the electrodes is achieved, it provides maximum removal efficiency.
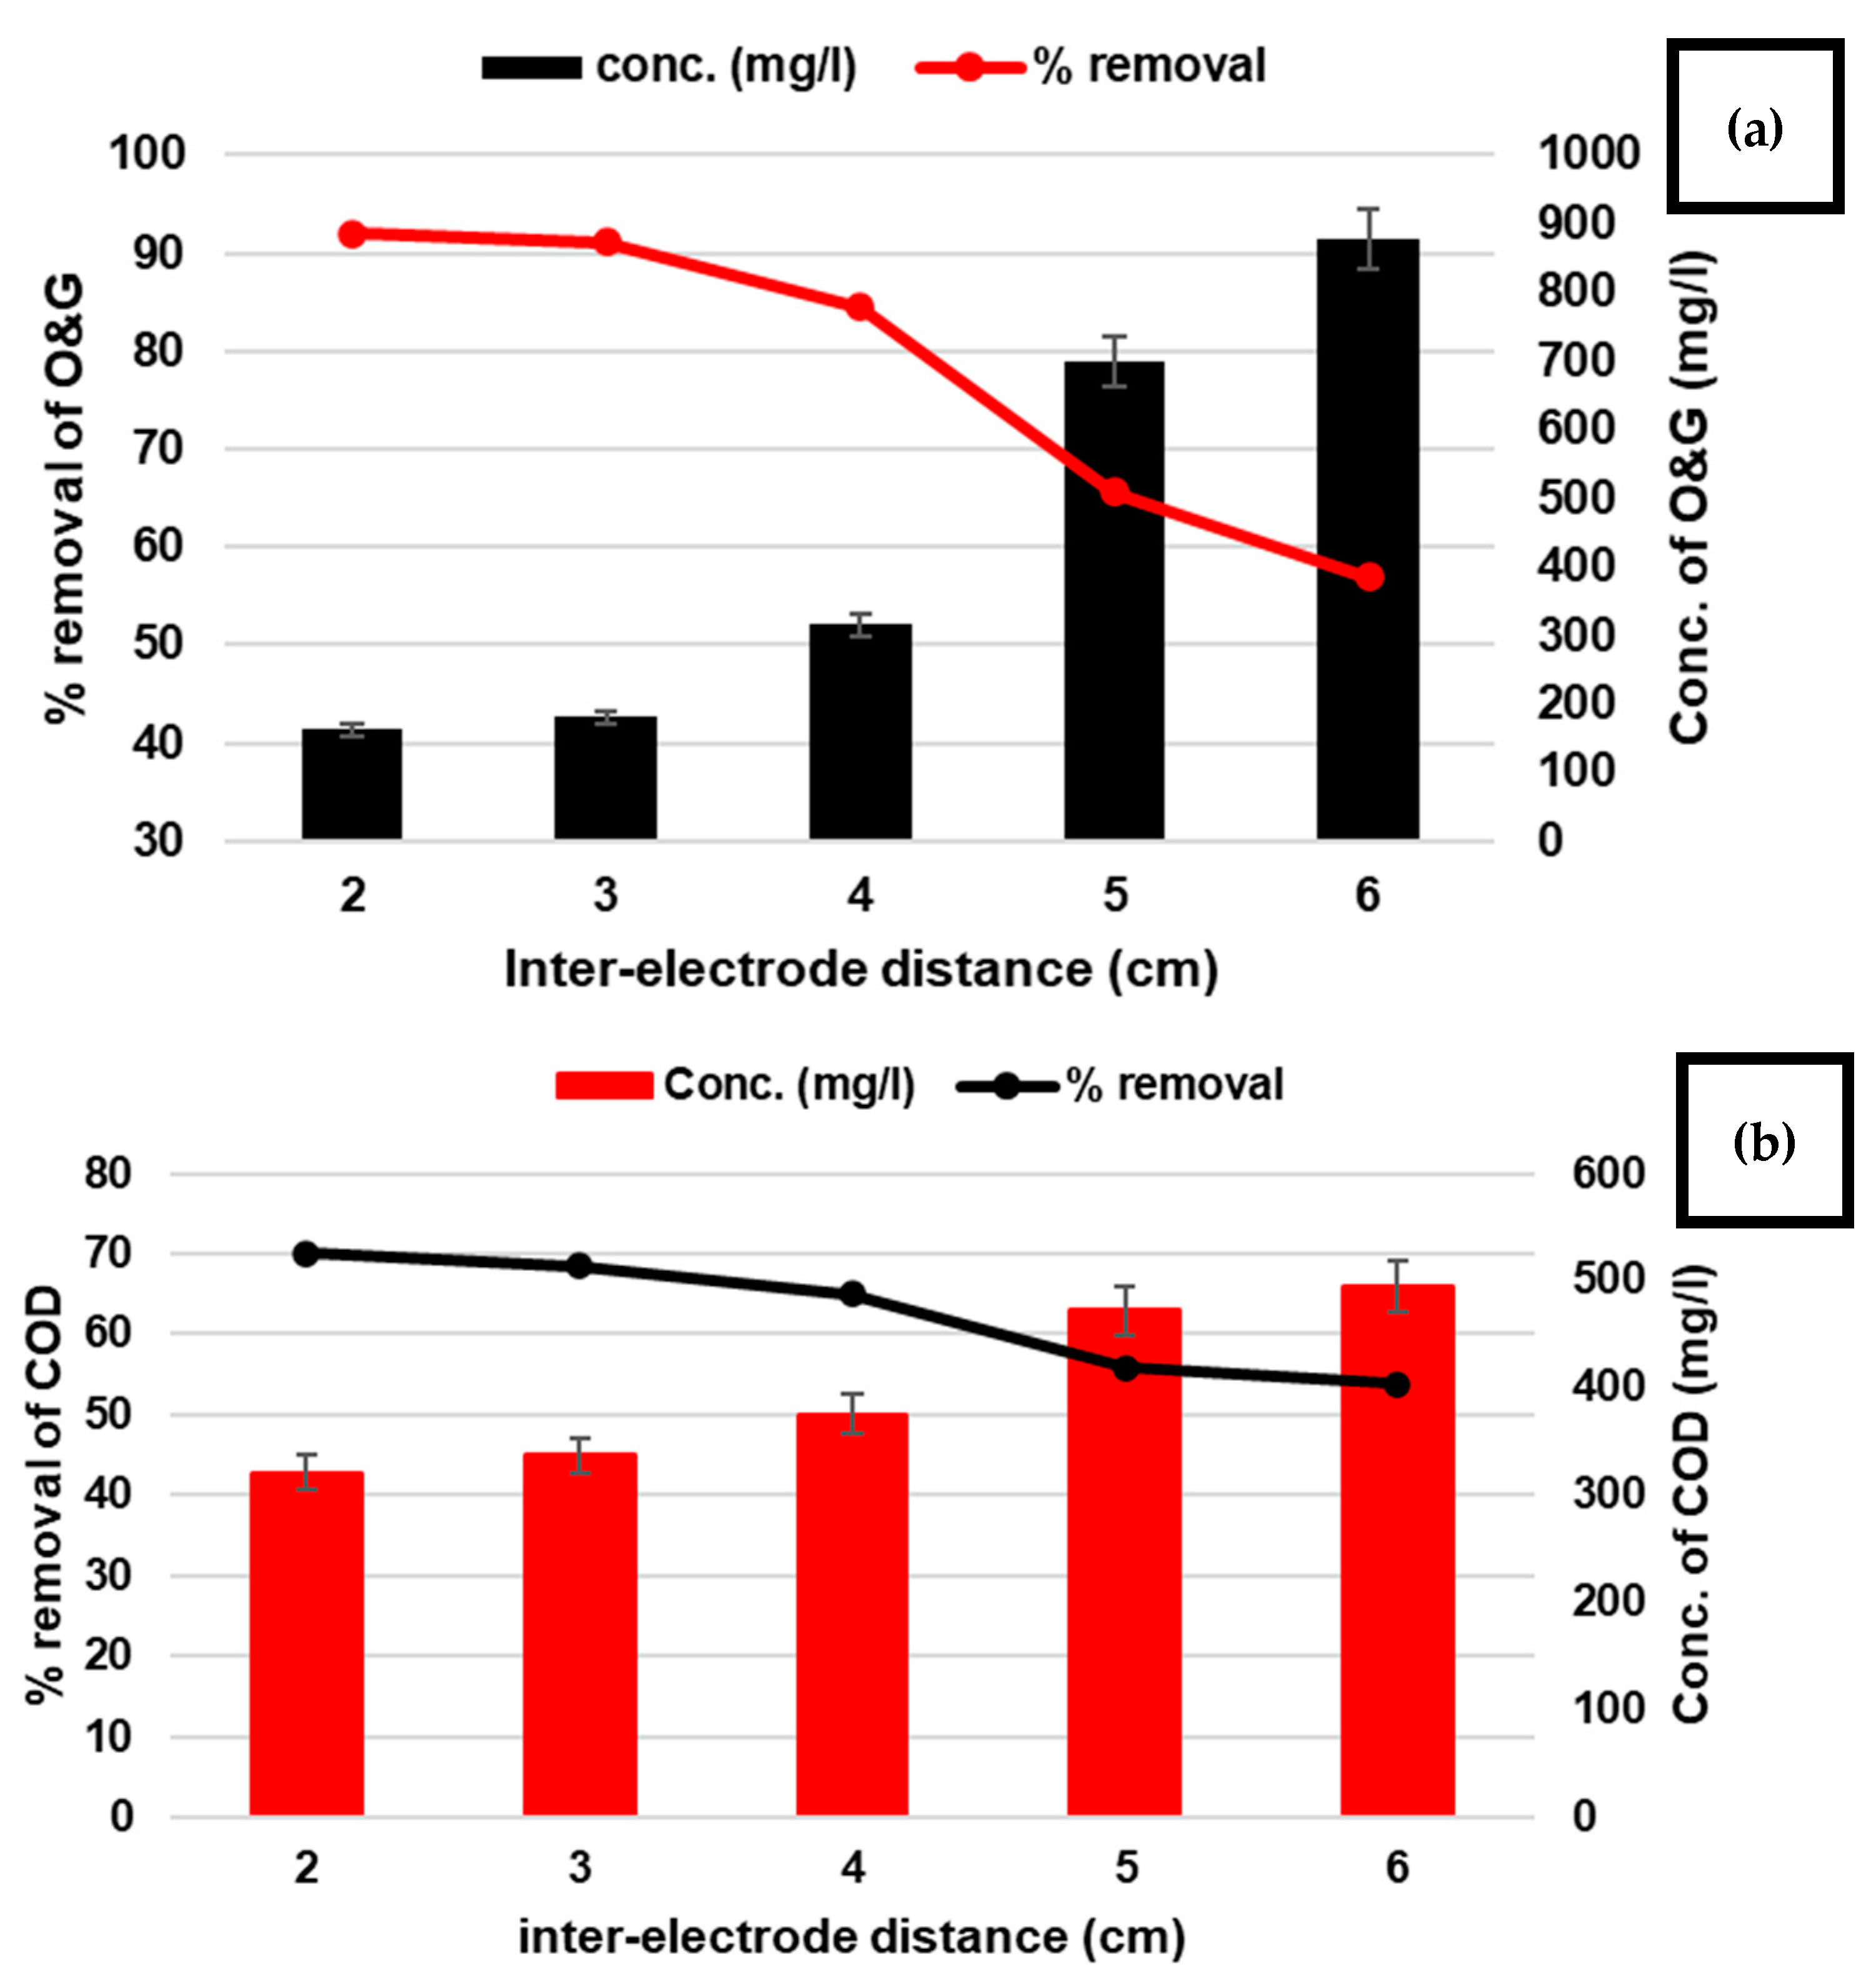
In this study, the interelectrode distance has five levels: 2, 3, 4, 5, and 6 cm. The removal of O&G and COD from restaurant wastewater effluent at its normal pH of 7 was investigated. Figure 3 shows the effective interelectrode distance for O&G and COD removal as well as their concentrations at 50 A/m2 current density and an electrolysis time of 20 min. O&G and COD removal efficiencies decreased from 92 to 56.9% and 70 to 53.8%, respectively. Meanwhile, the concentrations of the pollutants increased as the interelectrode distance increased, from 162 to 876 mg/L for O&G and 320.7 to 494.3 mg/L for COD.
The greater the interelectrode distance, the slower the generated ions move. Because of their slow movement, ions need more time to form the floc required for pollutant coagulation [16]. Naser et al. [51] achieved a high removal of COD at a 2 cm interelectrode distance. At the same interelectrode distance, El-Ezaby et al. [1] obtained a high removal of O&G as well as COD from restaurant wastewater.

3.1.2. T Factor

The optimisation of electrolysis time is important to the rate of production of metal ions, which affects the pollutants’ removal efficiency [61].
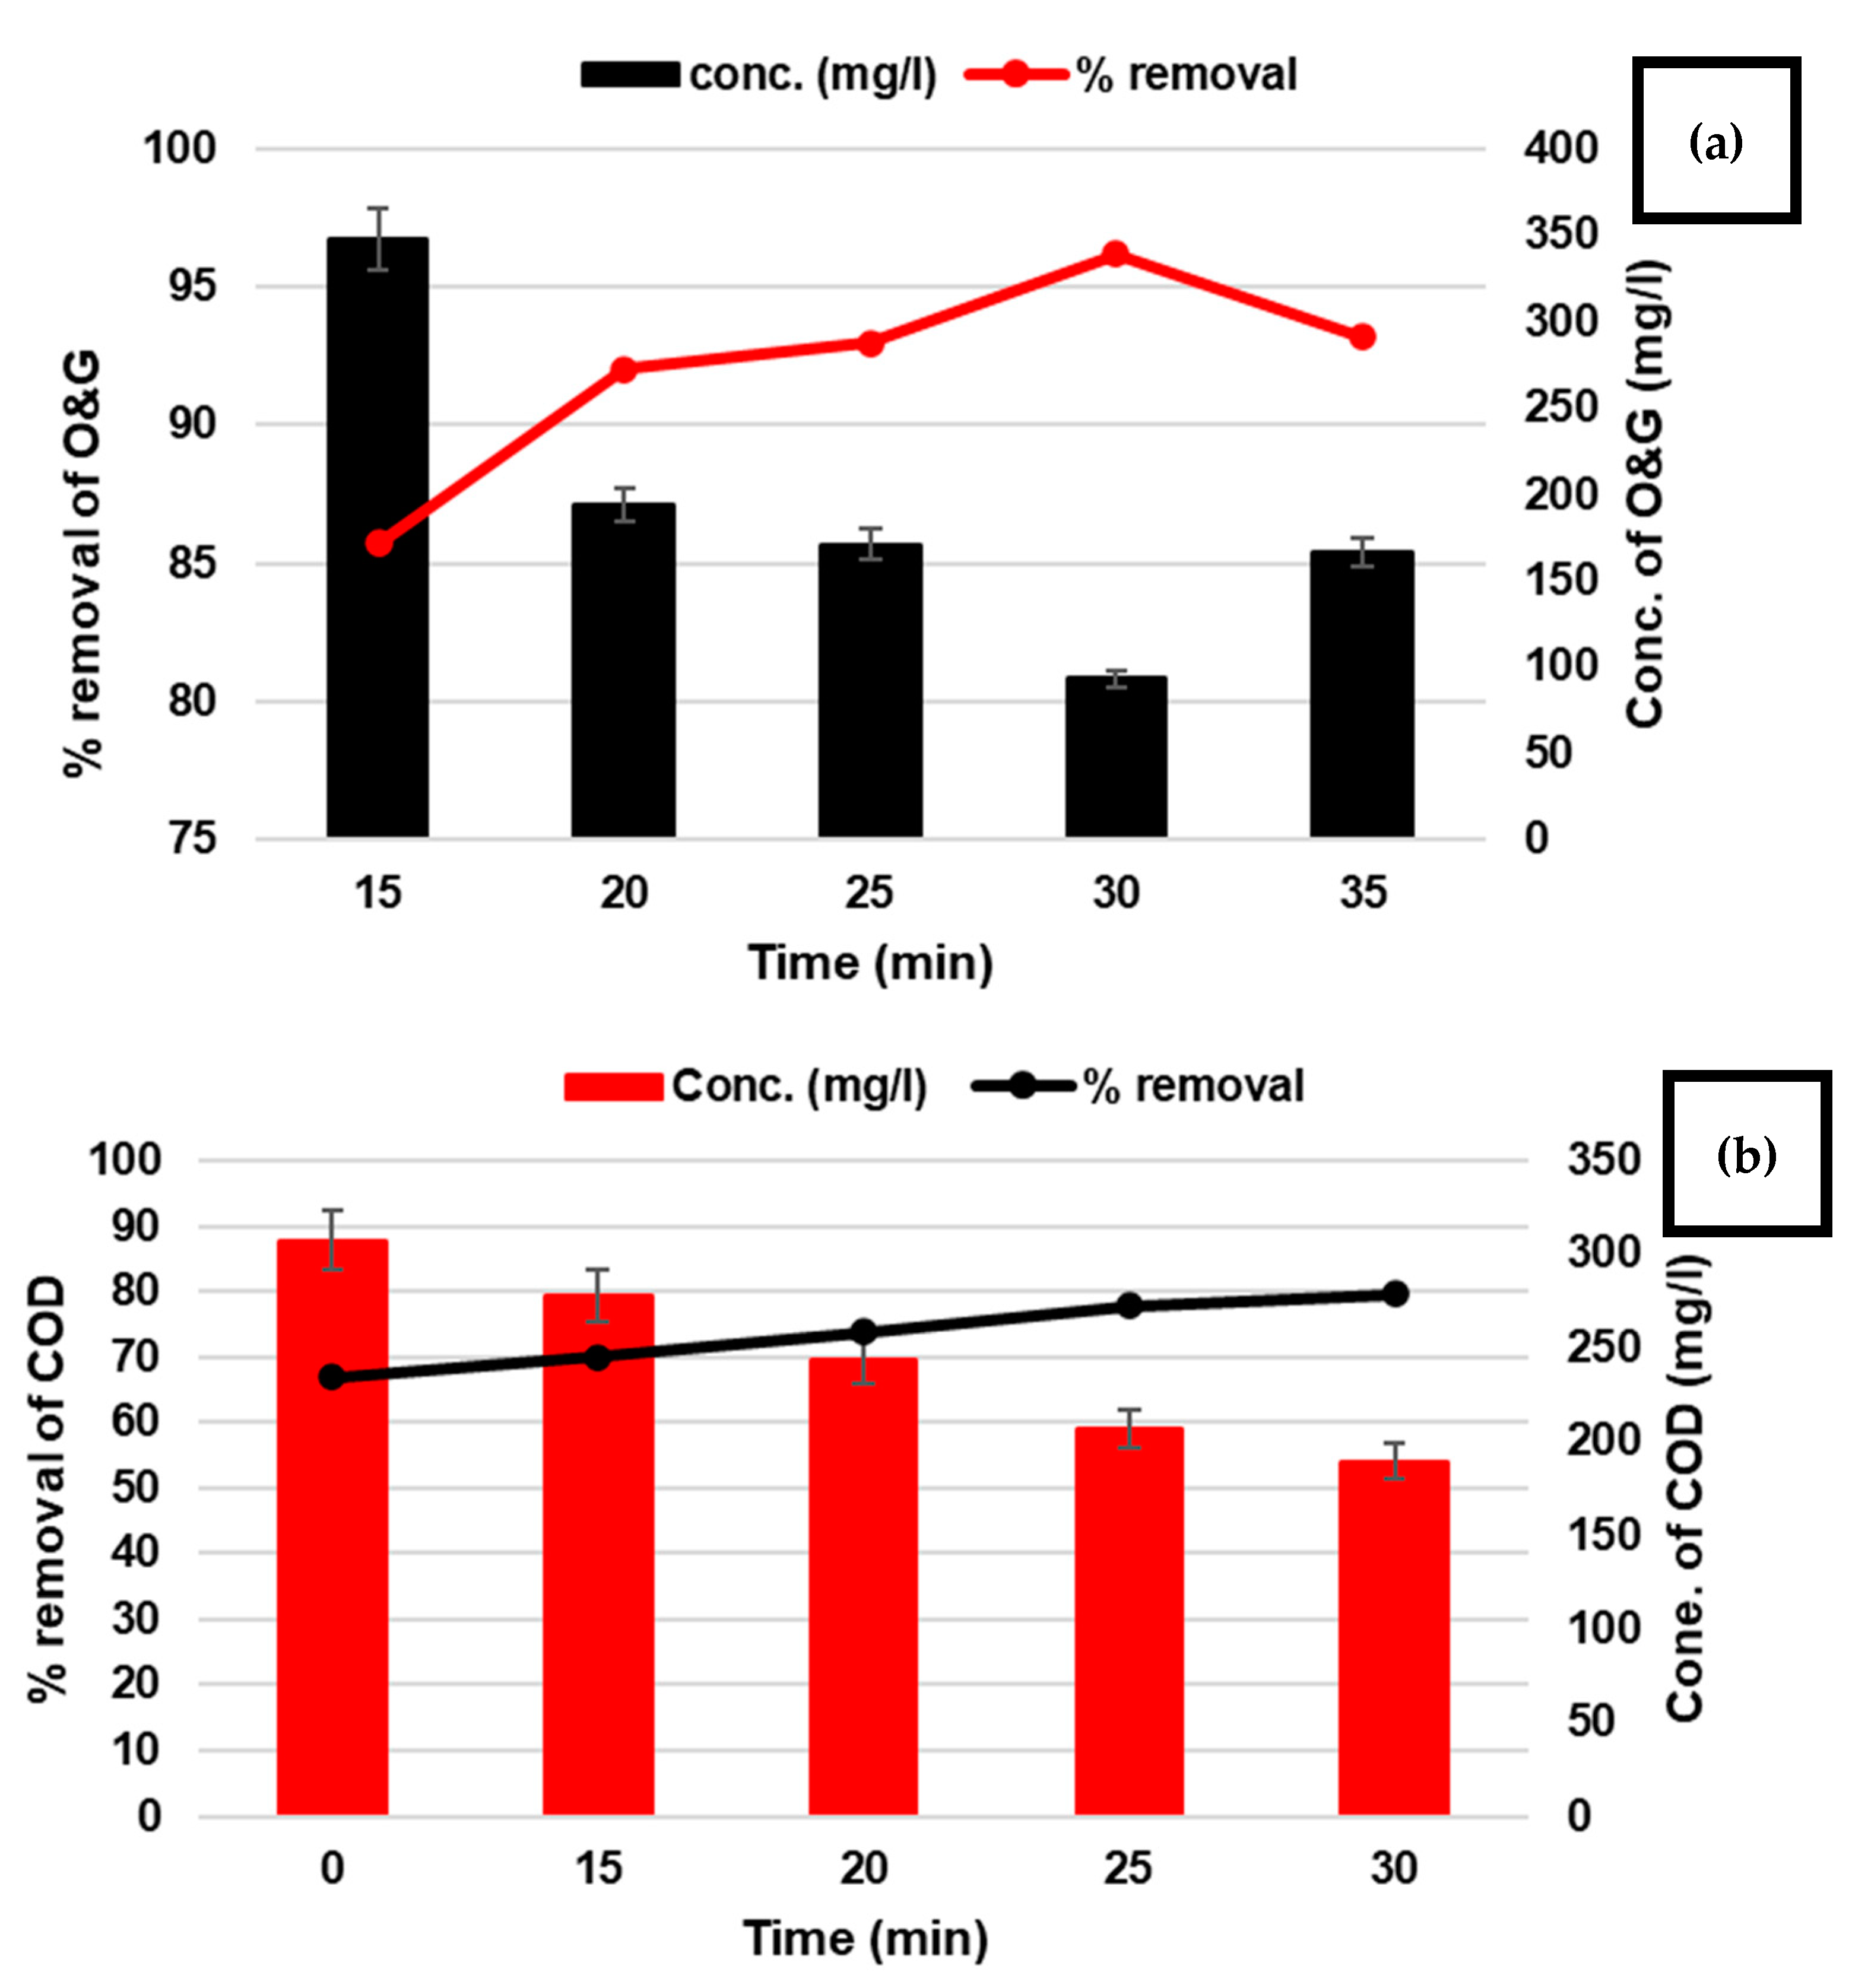
In this study, to determine the effect of electrolysis time on O&G as well as COD removal efficiency, five levels of time (15, 20, 25, 30, and 35 min) were studied at pH 7. The constant current density was 50 A/m2, and the interelectrode distance was 2 cm. Figure 4a illustrates the effect of the electrolysis time on the percentage of removal efficiency and the concentration of O&G. The study showed that the highest level of removal was obtained between 25 and 30 min. Consequently, the O&G removal efficiency increased as the electrolysis time was increased until it reached its optimum of 30 min. Due to the increased dissolution of Al2+ inside the solution, the aluminium hydroxide adsorbed oil and floated to the top of the solution’s surface. Therefore, the concentration of O&G was decreased until it reached 93.2 mg/L at 30 min of electrolysis time.
According to the study, the first 15 min were the most effective in reducing the concentration of COD; therefore, the concentration and the removal efficiency at electrolysis time 15 min were 307.5 mg/L and 66.8%, respectively. Figure 4b illustrates the slightly increasing rate of COD removal efficiency from 15 to 30 min; the removal efficiency increased from 66.8% to 77.8%. The optimum electrolysis time at 30 min was the COD removal of 77.8%.
According to the findings of Priya and Jeyanthi [52], when the electrolysis time increases, the removal rate of COD also increases. Several researchers found that the highest drop in COD concentration occurred during the first electrolysis time. In other words, the greatest change in the percentage of COD removal occurred in the first 10 min [48]. The greatest reduction in COD concentration was observed in the first 20 min when using the Al electrode, as well as the highest percentage, 74.5, was obtained from Hadramawt’s restaurant wastewater [1]. Ghahrchi et al. [53] also reported that the most significant COD removal occurred in 15 min.
In this research, the highest removal of O&G and COD was attained at an electrolysis time of 30 min; 96.2% and 77.8% were removed, respectively. A work conducted by [49] reported high O&G removal percentages of restaurant wastewater at 98% in 34 min. In addition, at 30 min, 95% O&G removal from slaughterhouse wastewater was reported [50]. As a result, the findings support those of previous studies.

3.1.3. CD Factor

Current density, defined as the current per active electrode surface area, is the most important factor influencing EC efficiency.
In this research, the current density was changed across five ranges: 40, 50, 60, 70, and 80 A/m2 in order to determine the optimum removal of O&G as well as COD from restaurant wastewater at pH 7. The interelectrode distance was 2 cm, and the electrolysis time was 30 min.
Figure 5a shows the effectiveness of O&G removal with the current density and the change in concentration. The optimum range of current density was 40–50 A/m2, and O&G efficiency increased from 80.7% to 96.5%. Meanwhile, the O&G concentration dropped from 467.9 to 84 mg/L. After reaching the optimum current density at 50 A/m2, the removal rate decreased from 50 to 80 A/m2.
Additionally, Figure 5b illustrates the effect of current density on the COD removal rate. It was discovered that COD removal efficiency increased as current density increased, with the highest removal efficiency for COD being 78.2%, using a current density of 60 A/m2. This is due to an increase in current density generating a high amount of Al3+ from the anode, which enhances floc formation. It also causes an increase in the production of H2 (air bubbles) from the cathode and a reduction in the size of air bubbles with an increase in the surface area, which results in increased removal efficiency for organic pollutants and O&G by flotation [25]. However, after reaching the optimum current density, the percentages of O&G and COD removal drop from 96.5 to 77.5% and 78.1 to 75.8%, respectively. Consequently, the current density of 50 A/m2 indicates the optimum value for removing O&G as well as COD from restaurant wastewater.
The results gained in this study are in line with previous studies. Increasing the current density increases the removal efficiency. That is due to the current density controlling electrode reactions in solution, such as the amount of metal ions dissolving from an electrode, gas production, and water reactions [22,50]. The continued increase in current density occurs as a side effect on the efficiency of EC by allowing side reactions, and large doses of coagulants can produce charge reversal of the colloids [54,61]. Additionally, it was reported by [52] that the continued increase in current density leads to a decrease in the removal efficiency of O&G as well as COD, resulting in the increased dissolution of the metal (doses of coagulants) and the creation of the passivation film on the electrode’s surface.

3.1.4. US, EC, and US-EC

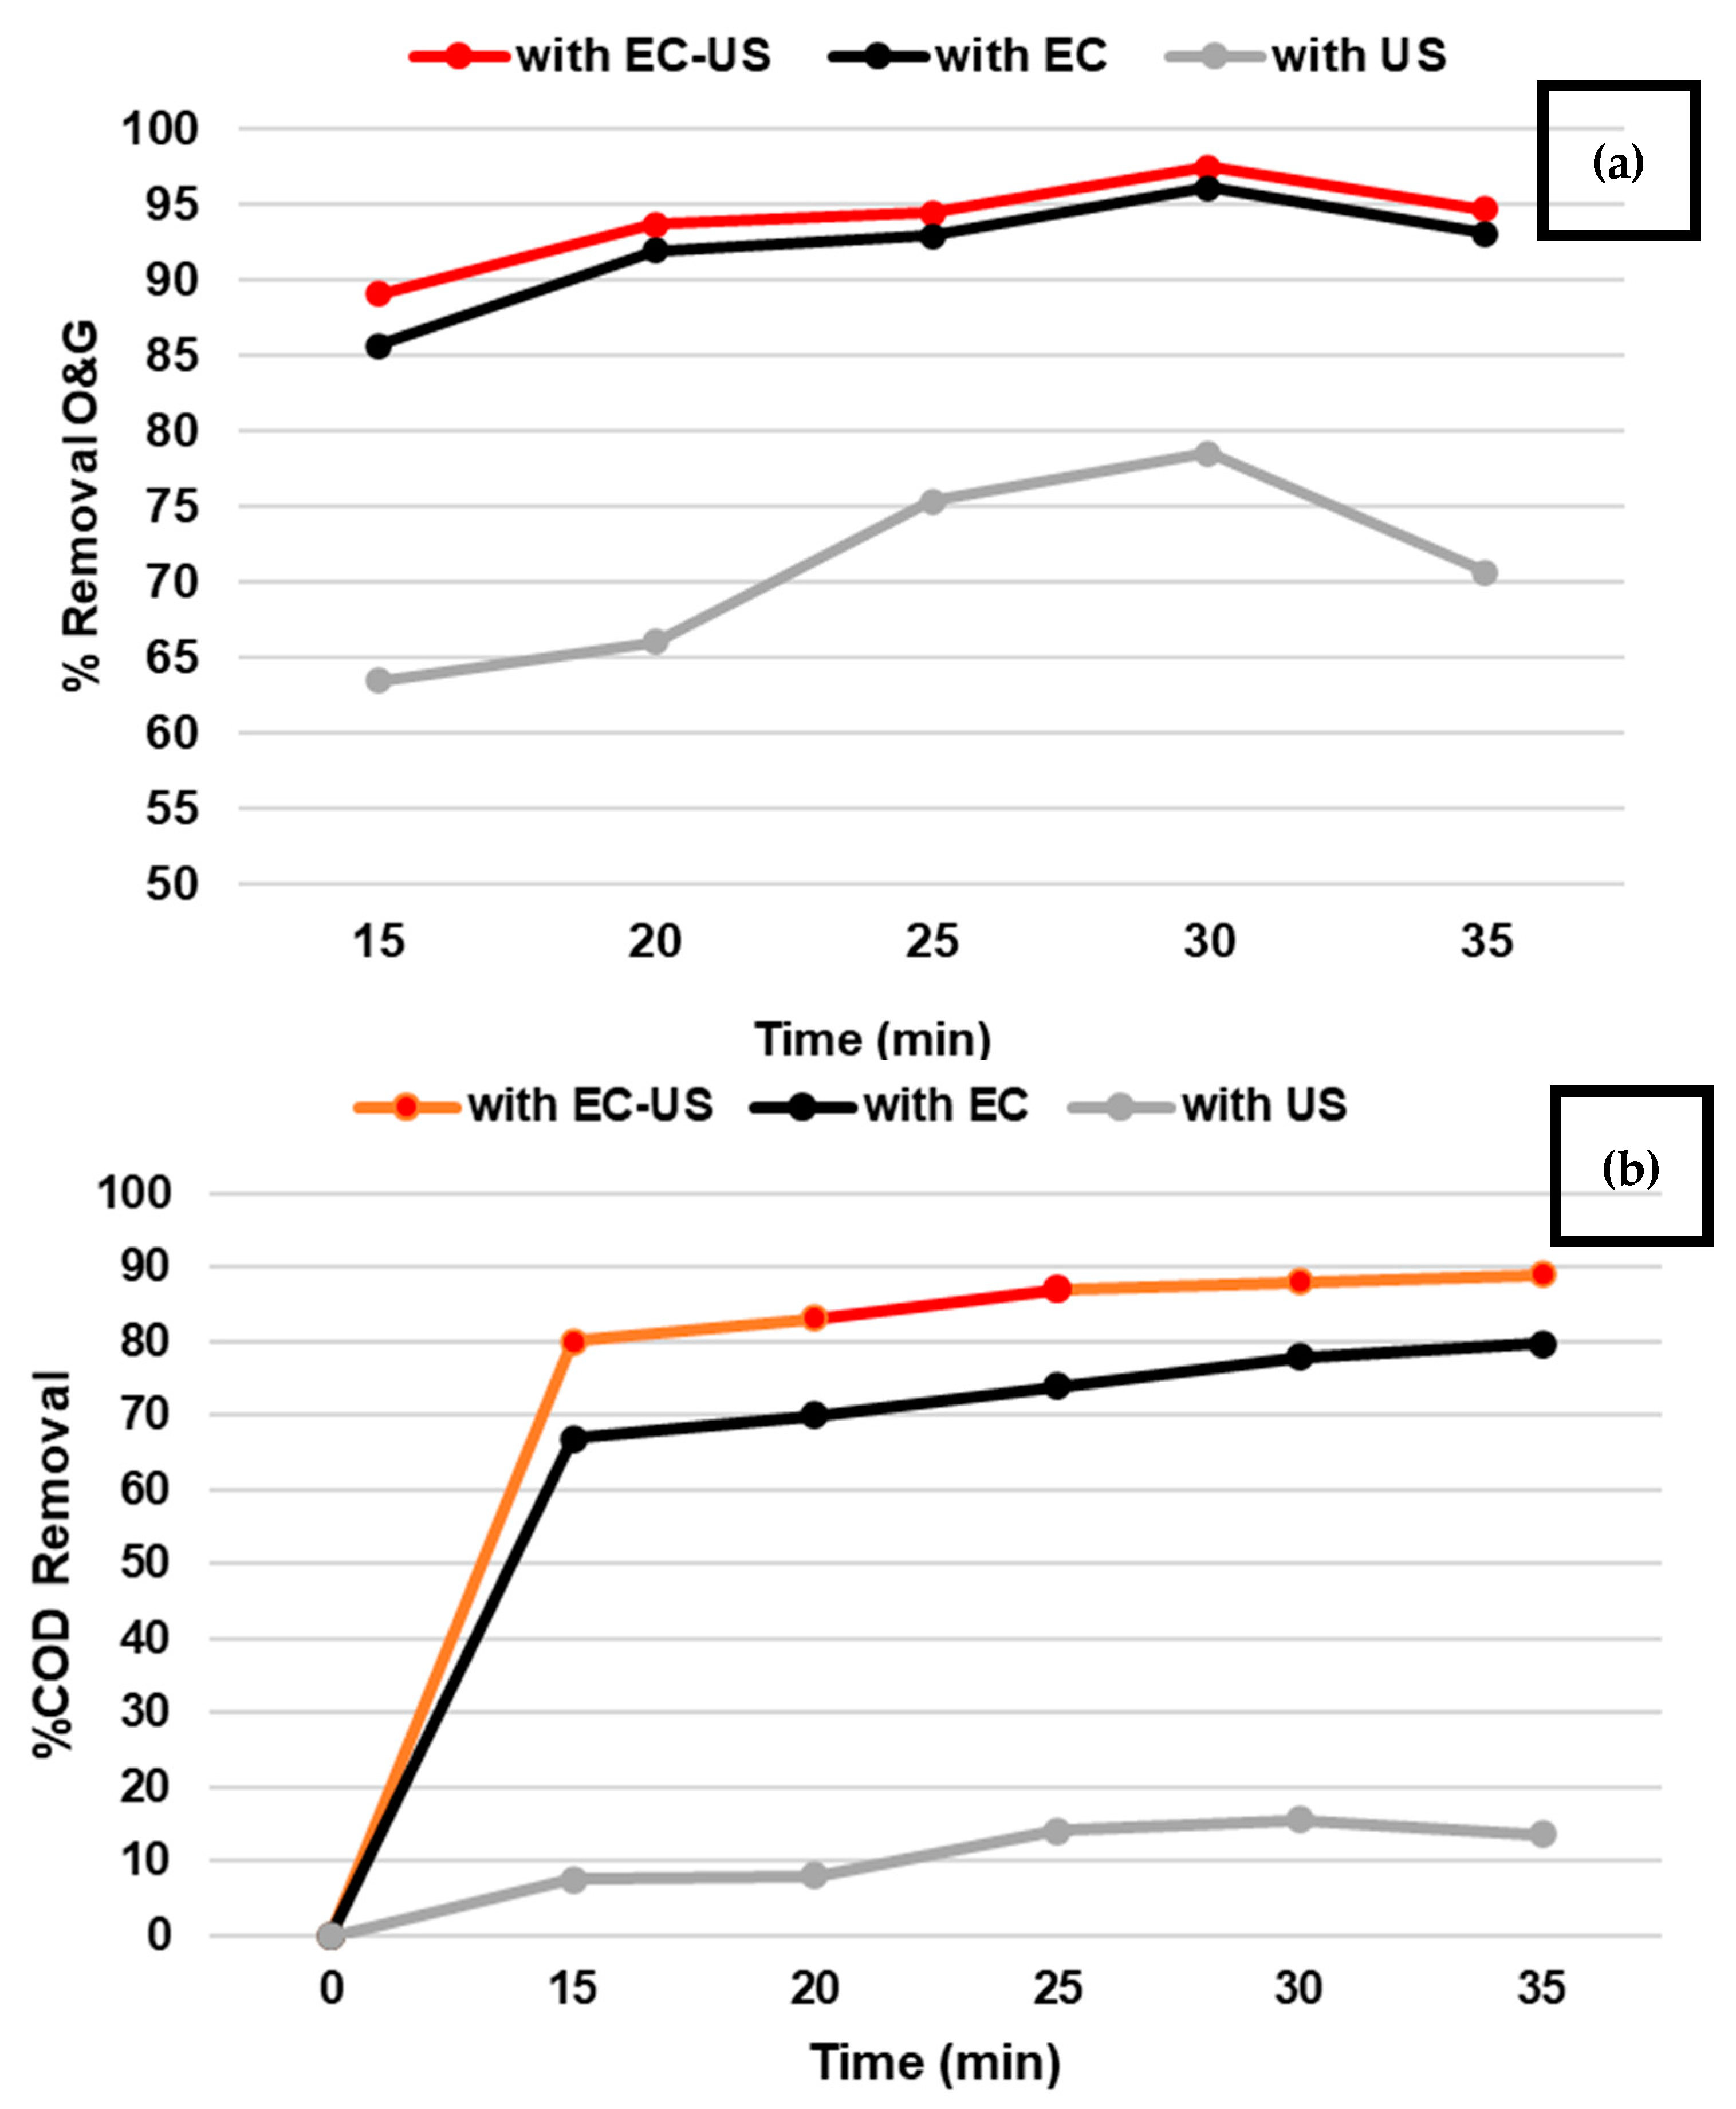
This study investigated the efficiency of the US, EC, and US-EC processes and compared the removal of O&G as well as COD with an interelectrode distance of 2 cm, electrolysis time of 30 min, current density of 50 A/m2, pH 7, and ultrasonic frequency of 40 kHz. Figure 6 illustrates the removal efficiencies of O&G and COD: 78.6, 96.6, and 97.6%, as well as 15.7, 77.8, and 88% for the US, EC, and US-EC processes, respectively.
Therefore, the US alone did not have an effective method to remove O&G and COD. The EC process achieves high removal rates of O&G and COD. However, the US-EC processes enhance the removal efficiency of O&G as well as COD. This enhancement was due to the ultrasound generating OH free radicals, which destroy contaminants and eliminate them. In addition, the cavitation phenomenon causes the regeneration of the electrodes, which increases the dissolution of metal ions, therefore increasing the efficiency of O&G and COD. Moreover, the US waves prevent the formation of gas bubbles on the electrodes during the EC process [34].

3.2. Statistical Analysis by RSM

The selection of factors and their levels, the coding of the real value, the selection of the design, and the simulation of the design of experiment (DOE) in the laboratory were described in the Section 2. Consequently, the suggestion of the mathematical model, verification of the model’s adequacy, illustration of the results by 3-D plots, and optimisation are as described below:
The fit of the model for the responses is determined by the coefficient of determination (R2) and the coefficient of variation (C.V) values; the value of R2 must be greater than 0.8 to indicate a good model for the data [62]. The C.V is the standard deviation-to-mean ratio, expressed as a percentage (%); C.V less than 10% indicates that the model is reproducible [63,64,65]. In this study, all the responses had an R2 greater than 0.90; as shown in Table 5, the R2 for O&G and COD was 98.38% and 95.58%, respectively. A low C.V of 3.18 and 2.98, respectively, was also found in the models for O&G and COD removal. As a result, the quadratic model was suggested to determine the influence of the factors and to optimise the removal of O&G and COD.
In this study, second-order quadratic regression was used to determine the optimum value of the factors and responses that are not available with linear regression [60]. The adequacy of the model was statistically determined by analysis of variance (ANOVA), and the statistical significance was examined by the F-test [66]. An analysis of variance (ANOVA) described the influence of factors and interactions between the responses. The model F-values for O&G and COD were 67.29 and 24.04, respectively. The model terms are evaluated by the p-value (probability) with a 95% confidence level. If the p-value of the model terms is less than 0.05, that indicates that they are significant [62]. As shown in Table 6, regarding analysis of variance (ANOVA) on COD removal (%), model terms A, B, A2, and C2 were highly significant. Model terms C and B2 were significant. AB, AC, and BC were not significant model terms.
Table 6 explains the analysis of variance (ANOVA) on COD removal (%); model terms A and B were highly significant. C2 was a significant model term. C, AB, AC, BC, A2, and B2 were more than 0.05, indicating that they are not significant. In order to improve the suggested model, one can exclude the insignificant model terms [60]. Therefore, the final regression equation for O&G as well as COD removal contains only the significant model terms, as shown in Table 6. The p-value for the lack of fit for the O&G removal model was 0.2107, and for the COD removal model, it was 0.2938. Therefore, the value of the lack of fit was not significant. In other words, the lack of fit was good in both models.
These findings demonstrated the quadratic model was highly accurate to the predicted value, which means the predicted value was close to the experiment value for O&G and COD removal.
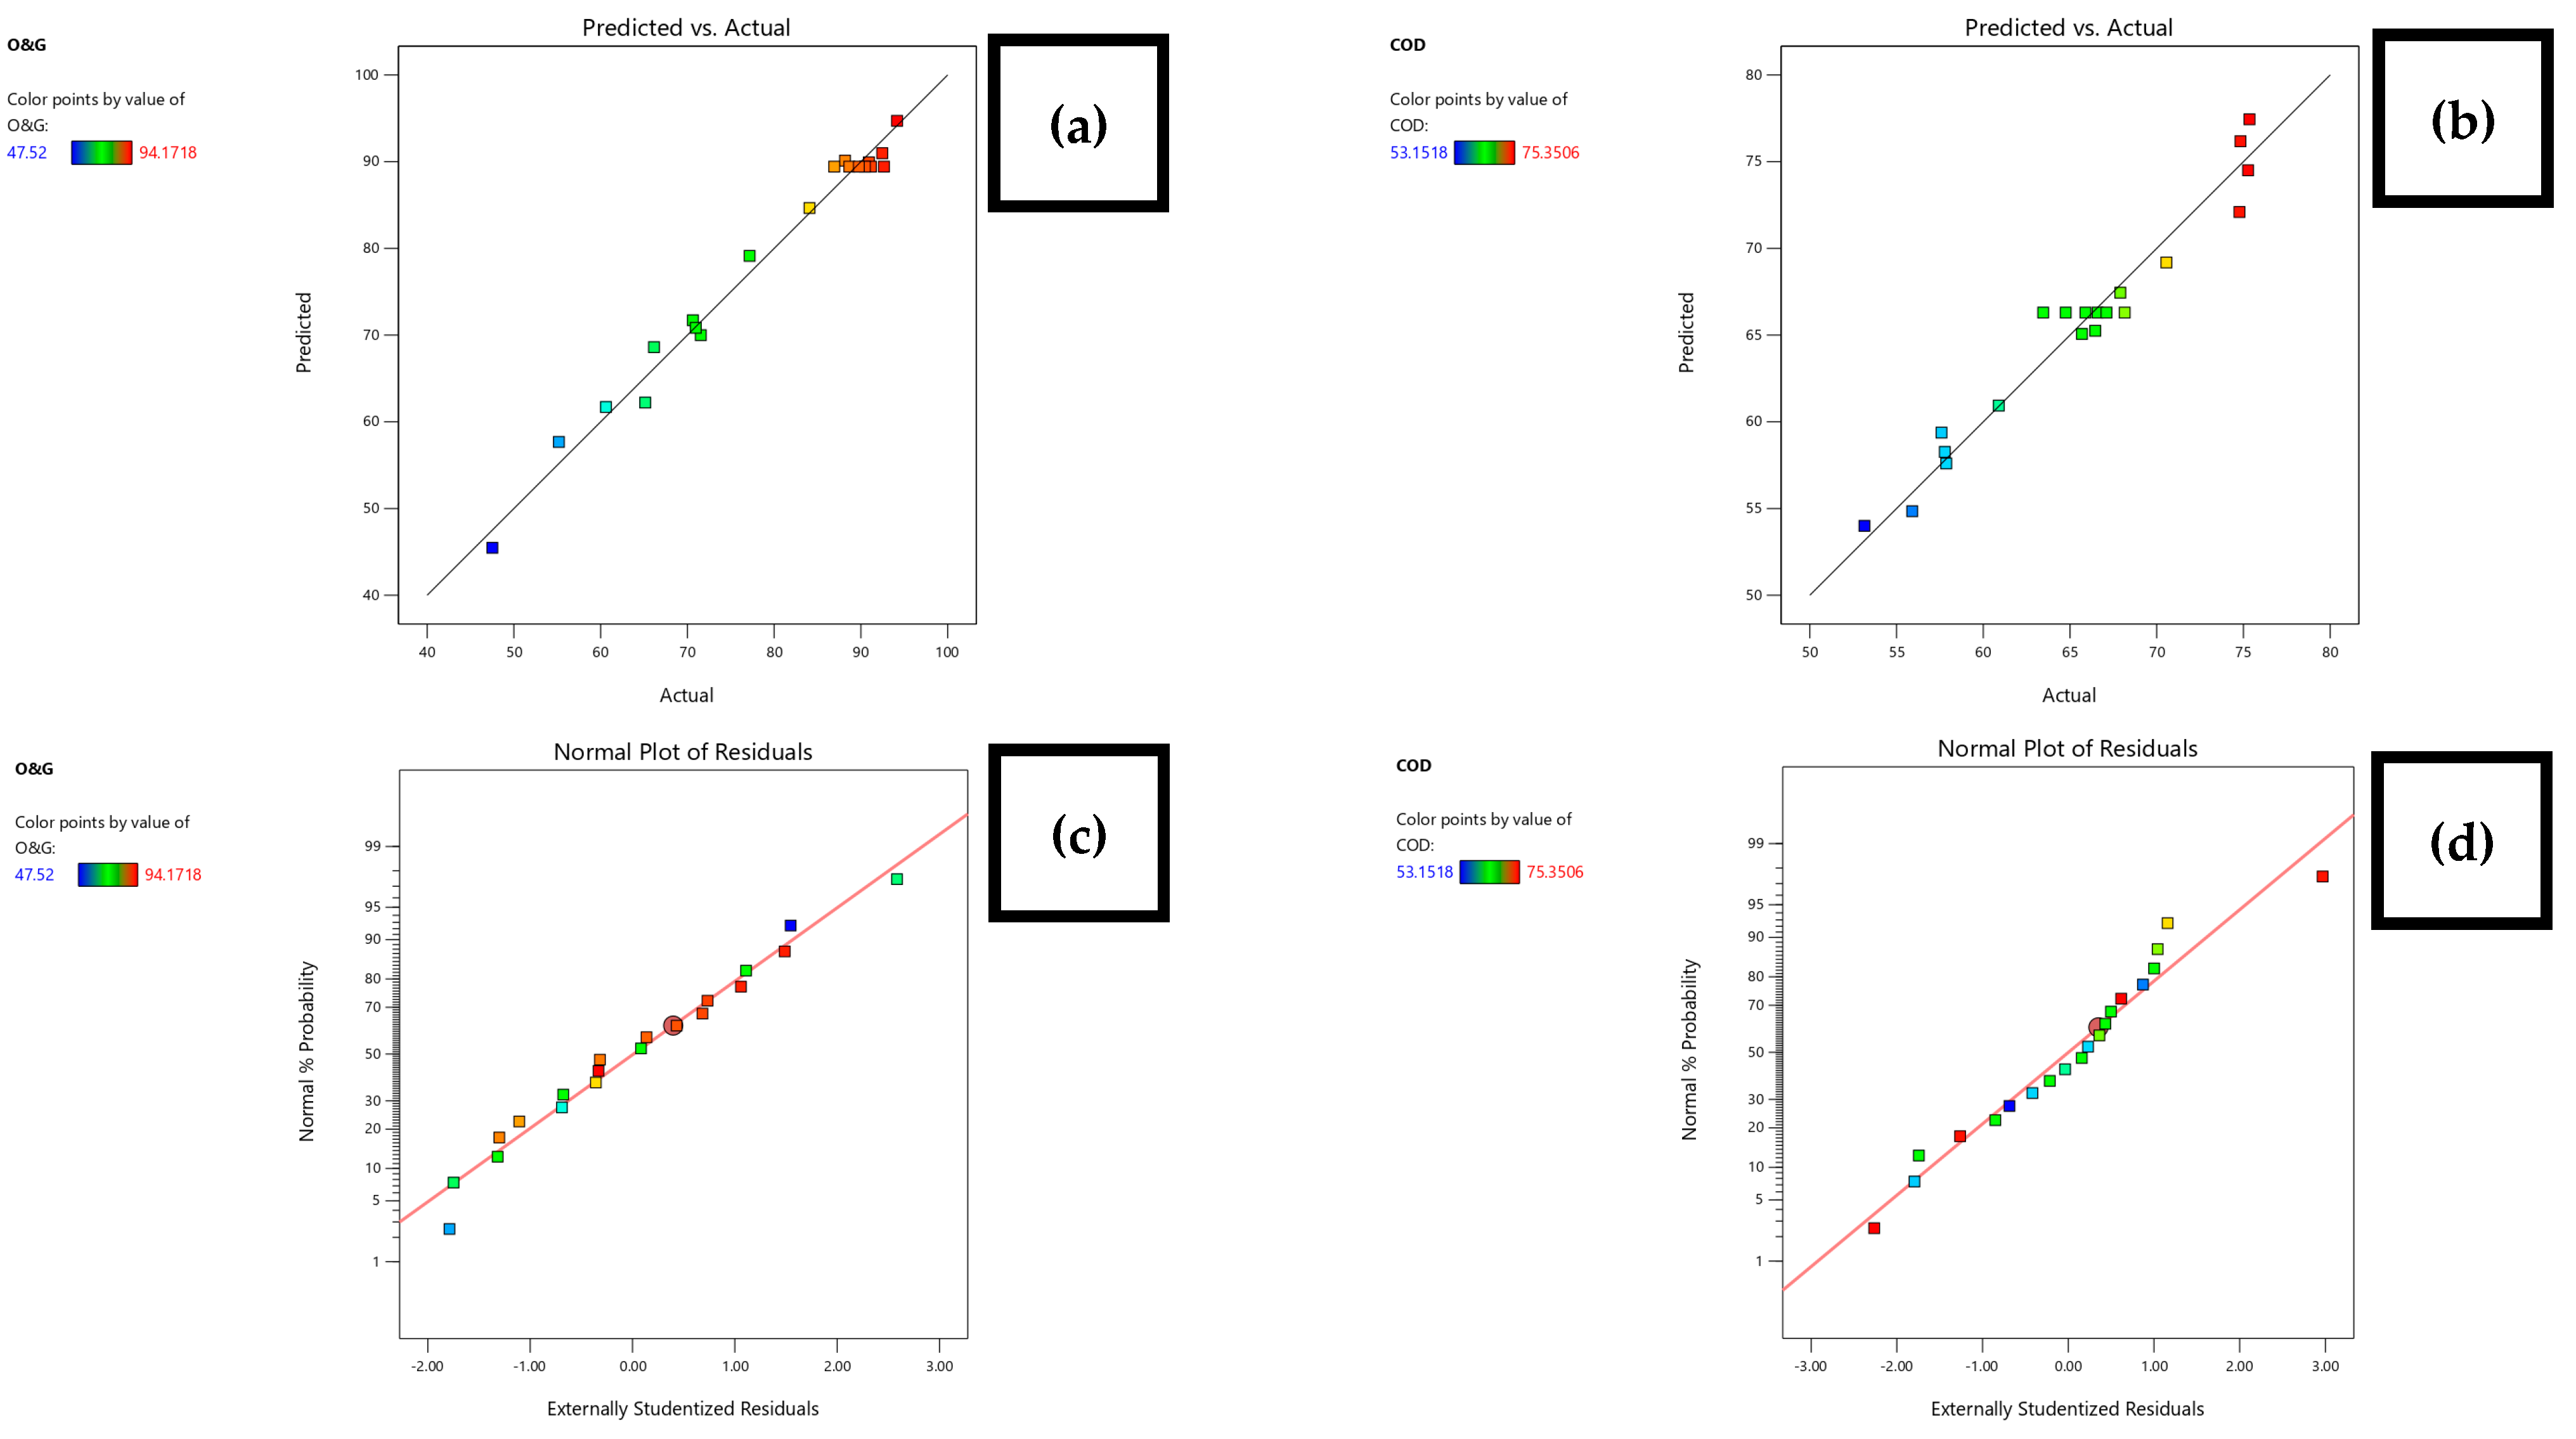
Diagnostics plots such as predicted versus actual plots, as well as a normal plot, were also used to evaluate the model’s adequacy. Figure 7a,b illustrate the comparison between the experiment value from the laboratory versus the predicted value from the model, showing the O&G and COD removal rates by indicating that the blue colour point, as minimum, was 47.52 and 53.15%, and the red colour point, as the maximum, was 94.17 and 75.35%, respectively. As observed, the predicted points are close to the diagnostic line, i.e., the clear correlations between the experiment value and the predicted value by the model. This result agrees with the R2 value for both O&G and COD removal, which was equal to 98.38% and 95.58%, which indicates the quadratic model had high accuracy in predicting the removal rates. Figure 7c,d show the residuals’ normal plots for O&G and COD removal rates, respectively. If residuals fulfil the normal distribution, the points will drop along a red line, according to the normal probability plot. As observed clearly from the plots, the data had a normal distribution with a few sprinkled points; this is a common occurrence [55].
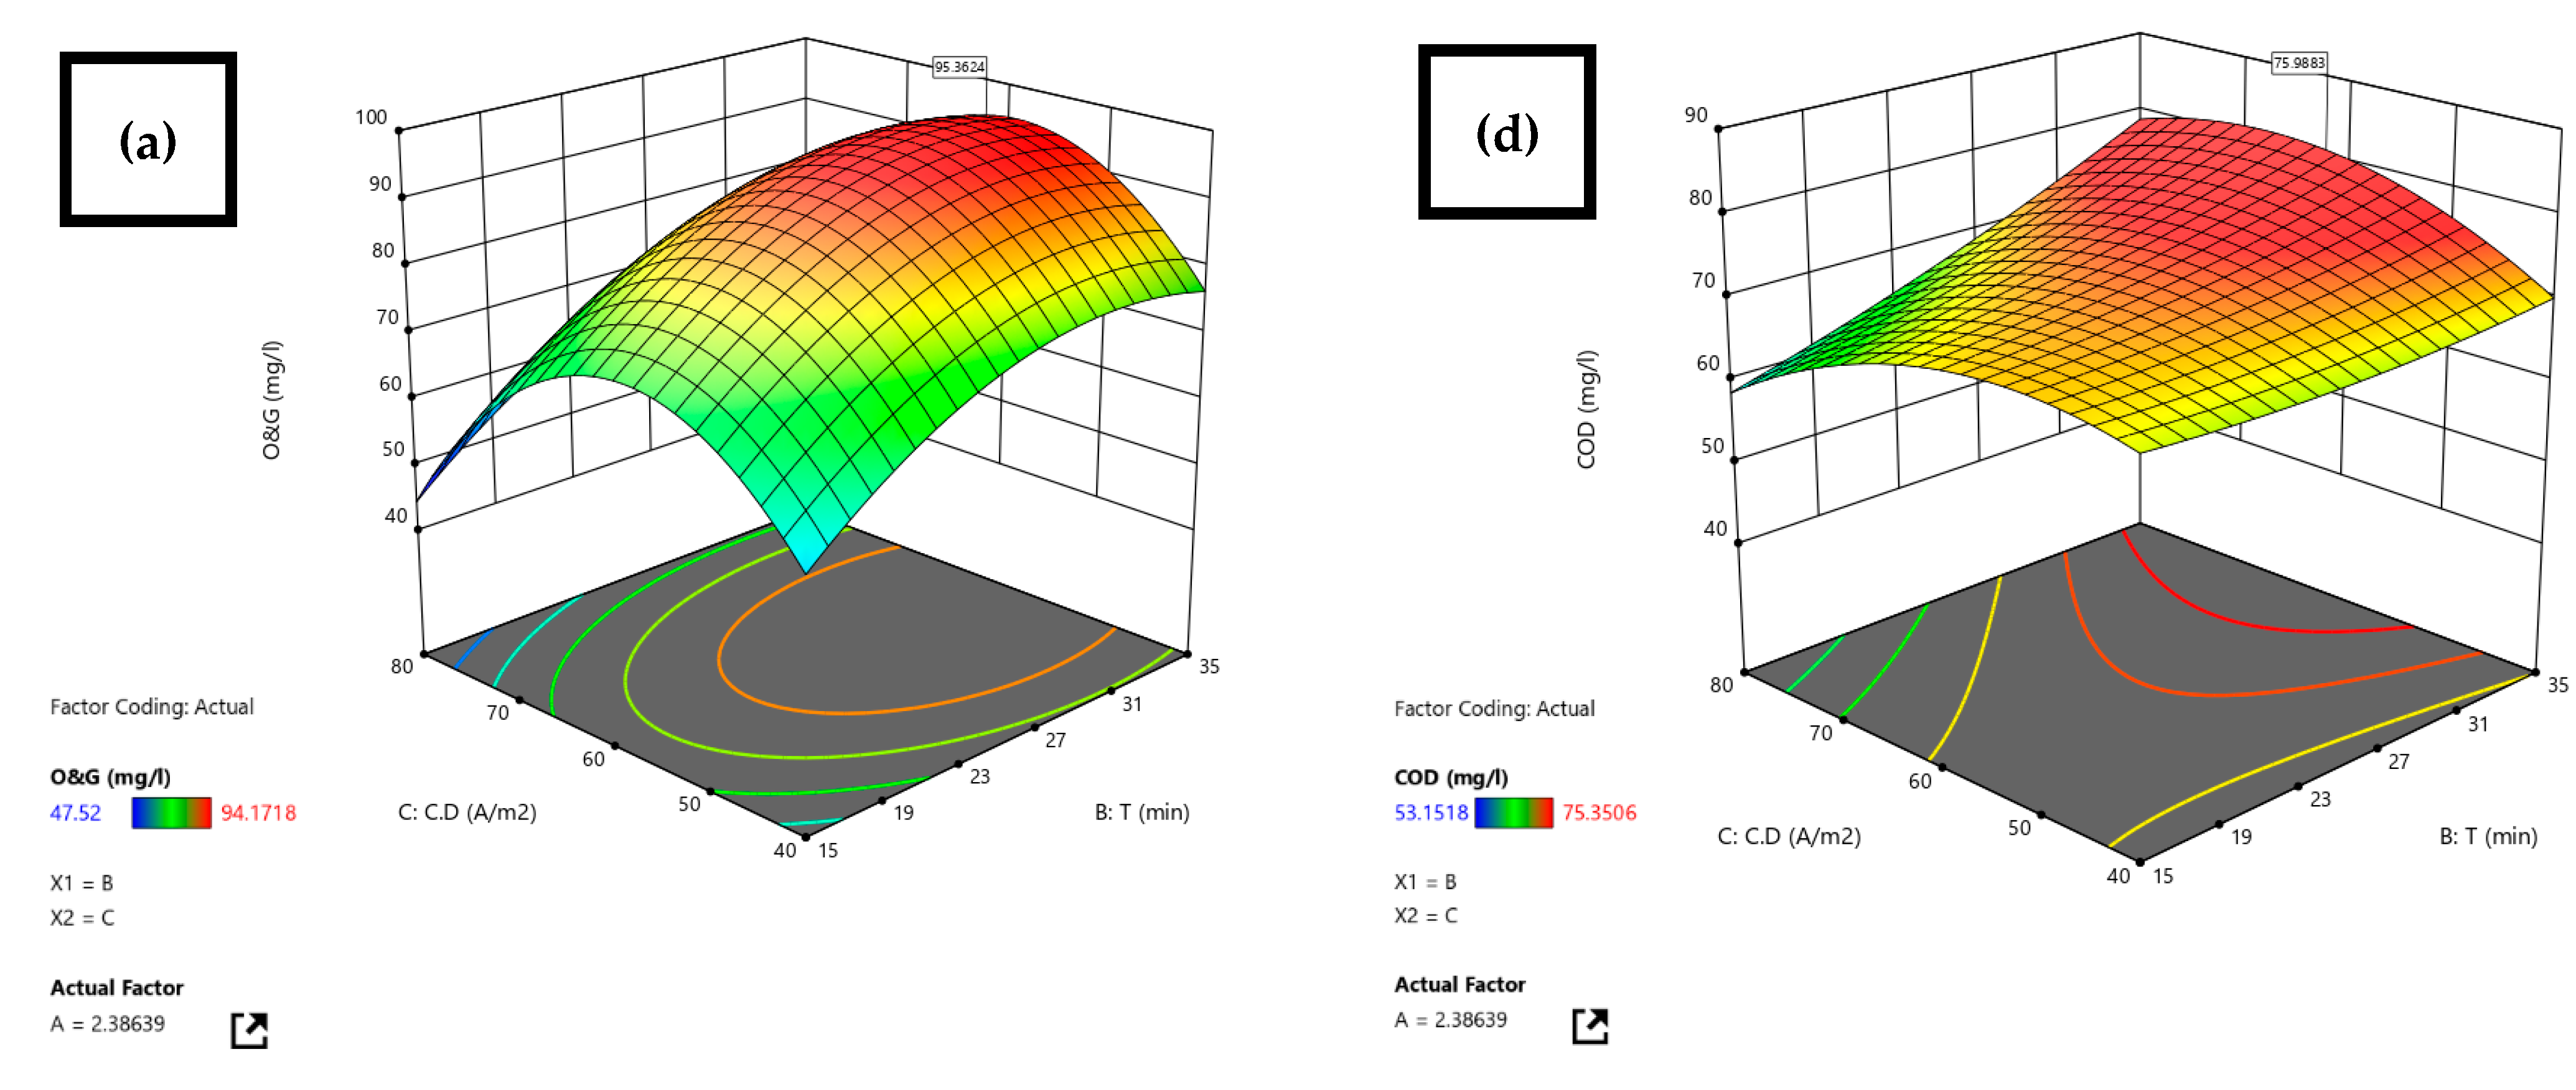
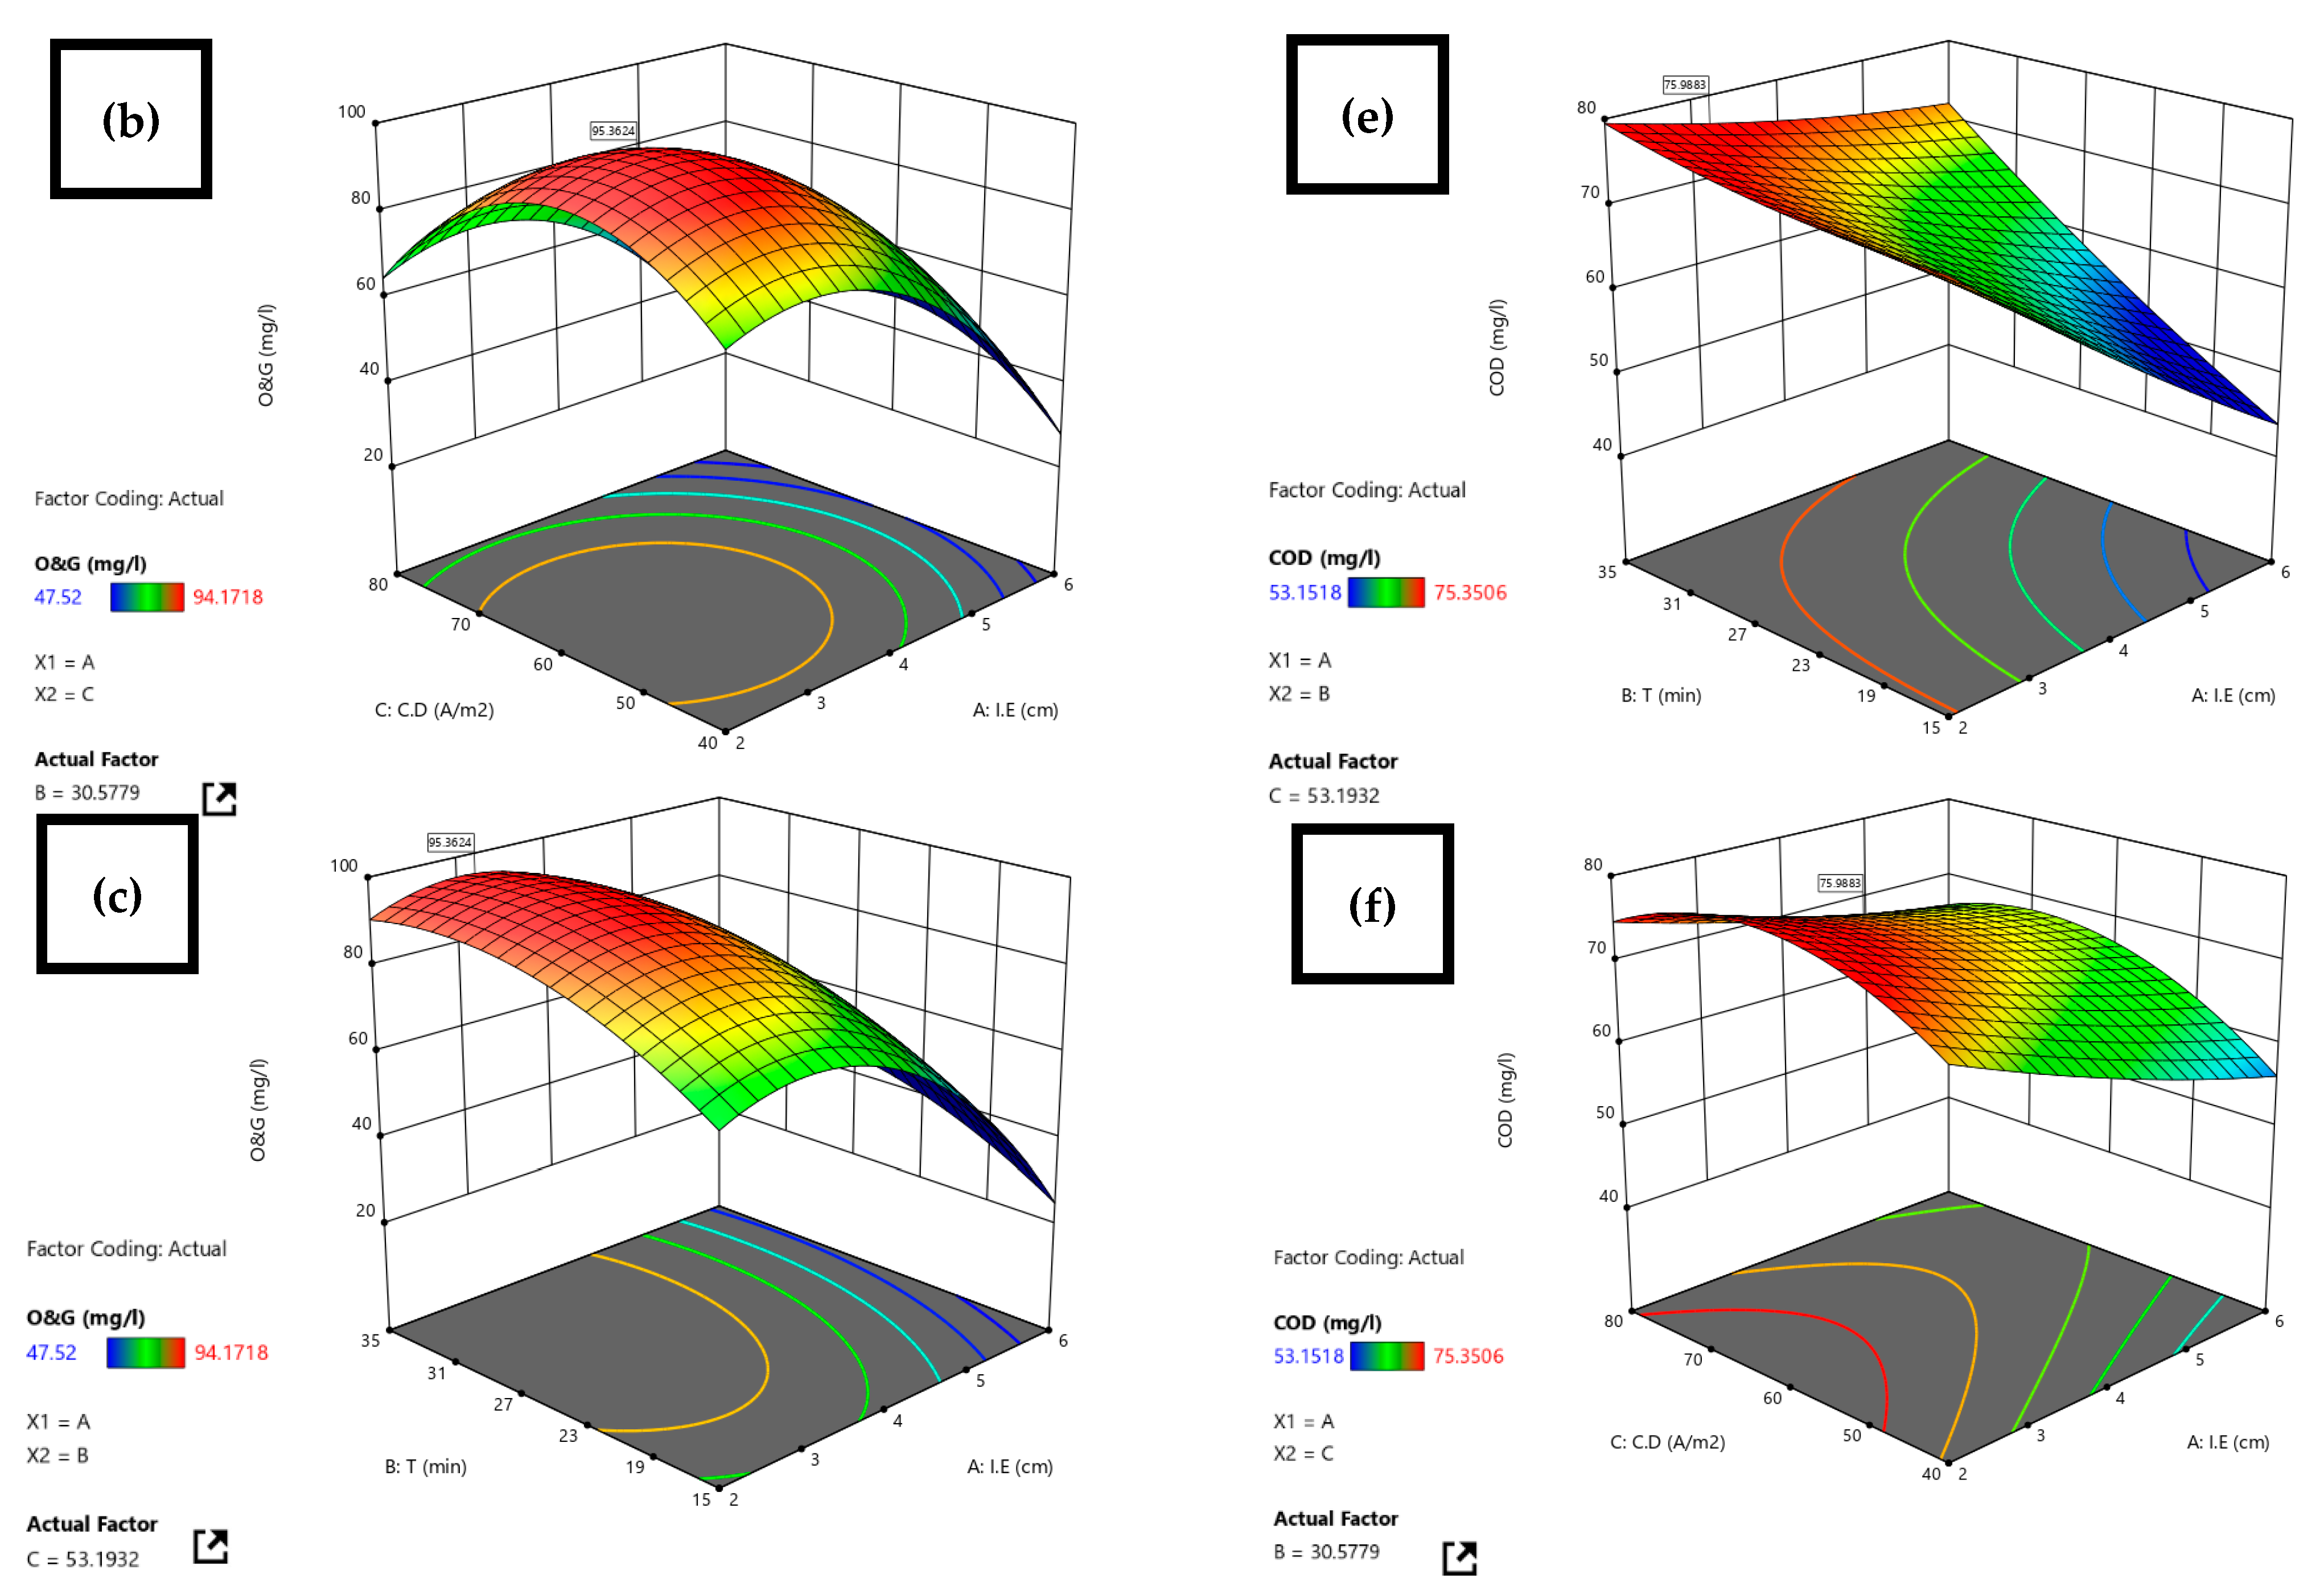
The CCD generated 3-D surface plots to investigate the individual and interaction of all factors on the O&G and COD removal. The plots were created to determine the combined effects of two factors at a time while holding the third constant. Figure 8 shows a 3-D surface plot of the predicted value of O&G and COD removal at a variable interelectrode distance, electrolysis time, and current density. The results from the 3-D surface plots are in the same line as the results from the classical method.
All of the factors, including interelectrode distance, electrolysis time, and current density, were set to 2–4 cm, 15–35 min, and 40–80 A/m2, respectively, with the O&G and COD removal set to the maximum value during RSM optimisation. Table 7 displays the optimum operating conditions determined by RSM, as well as the experiment value and predicted value of the removal rate.

3.3. SEM

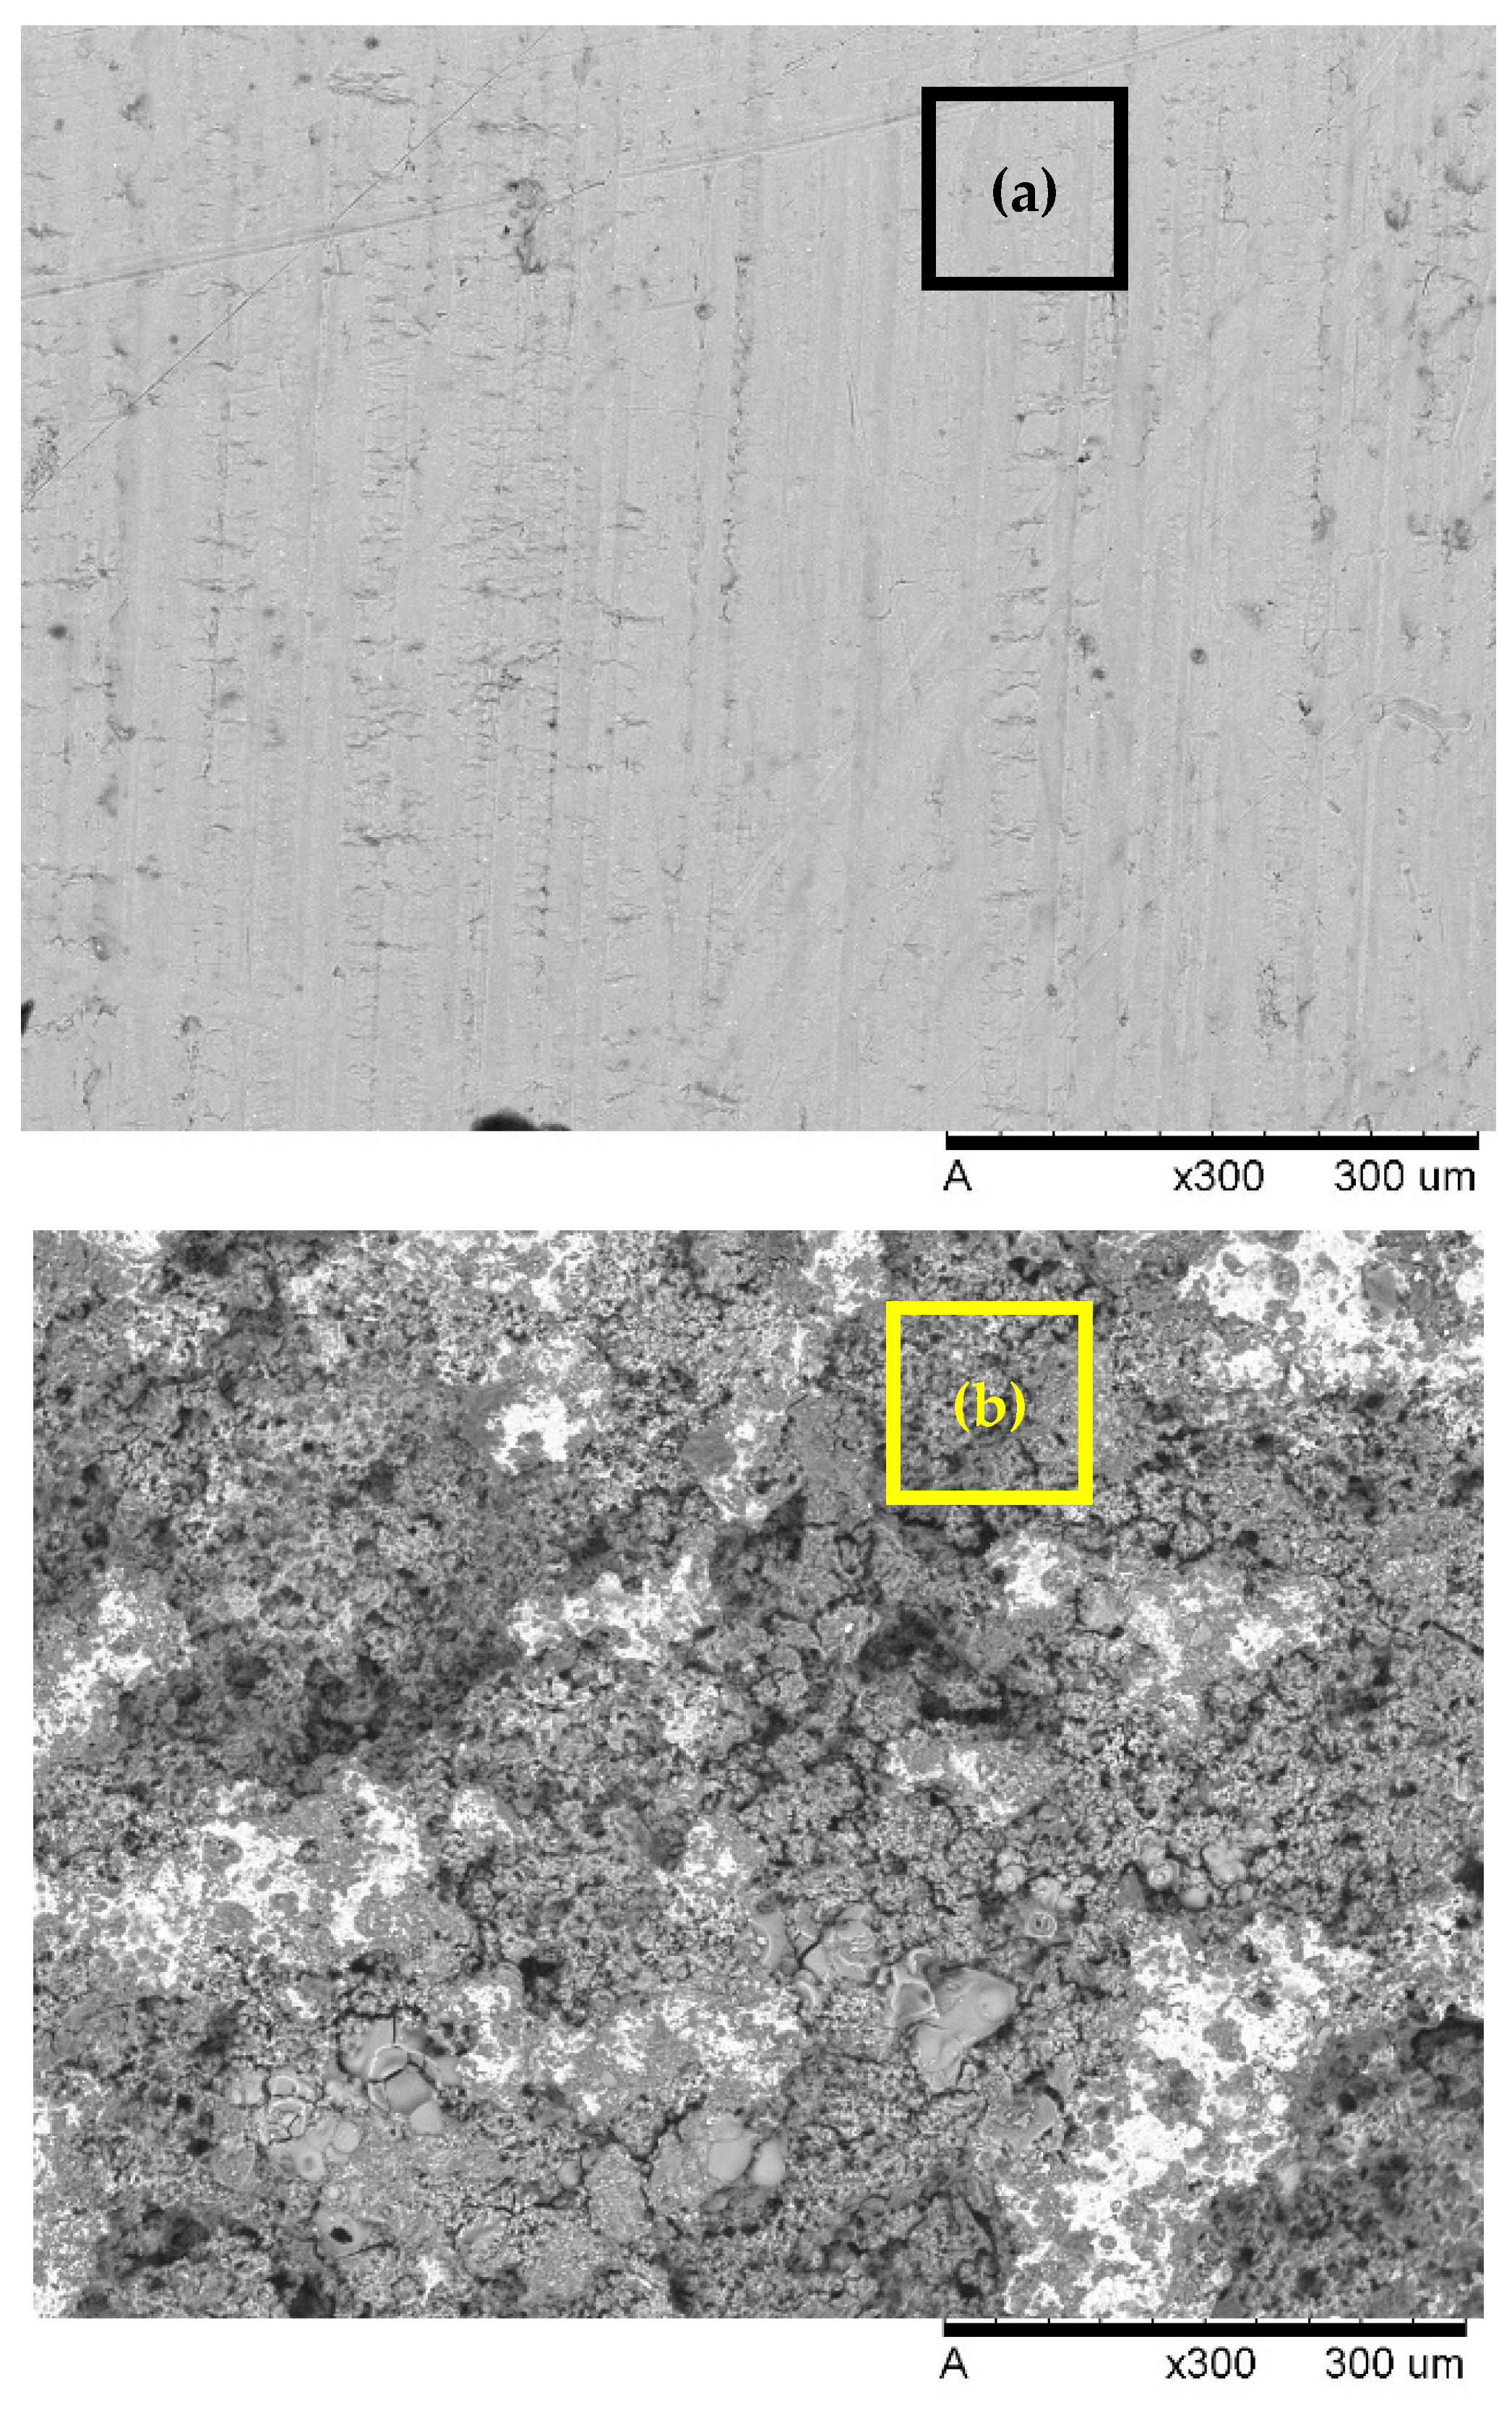
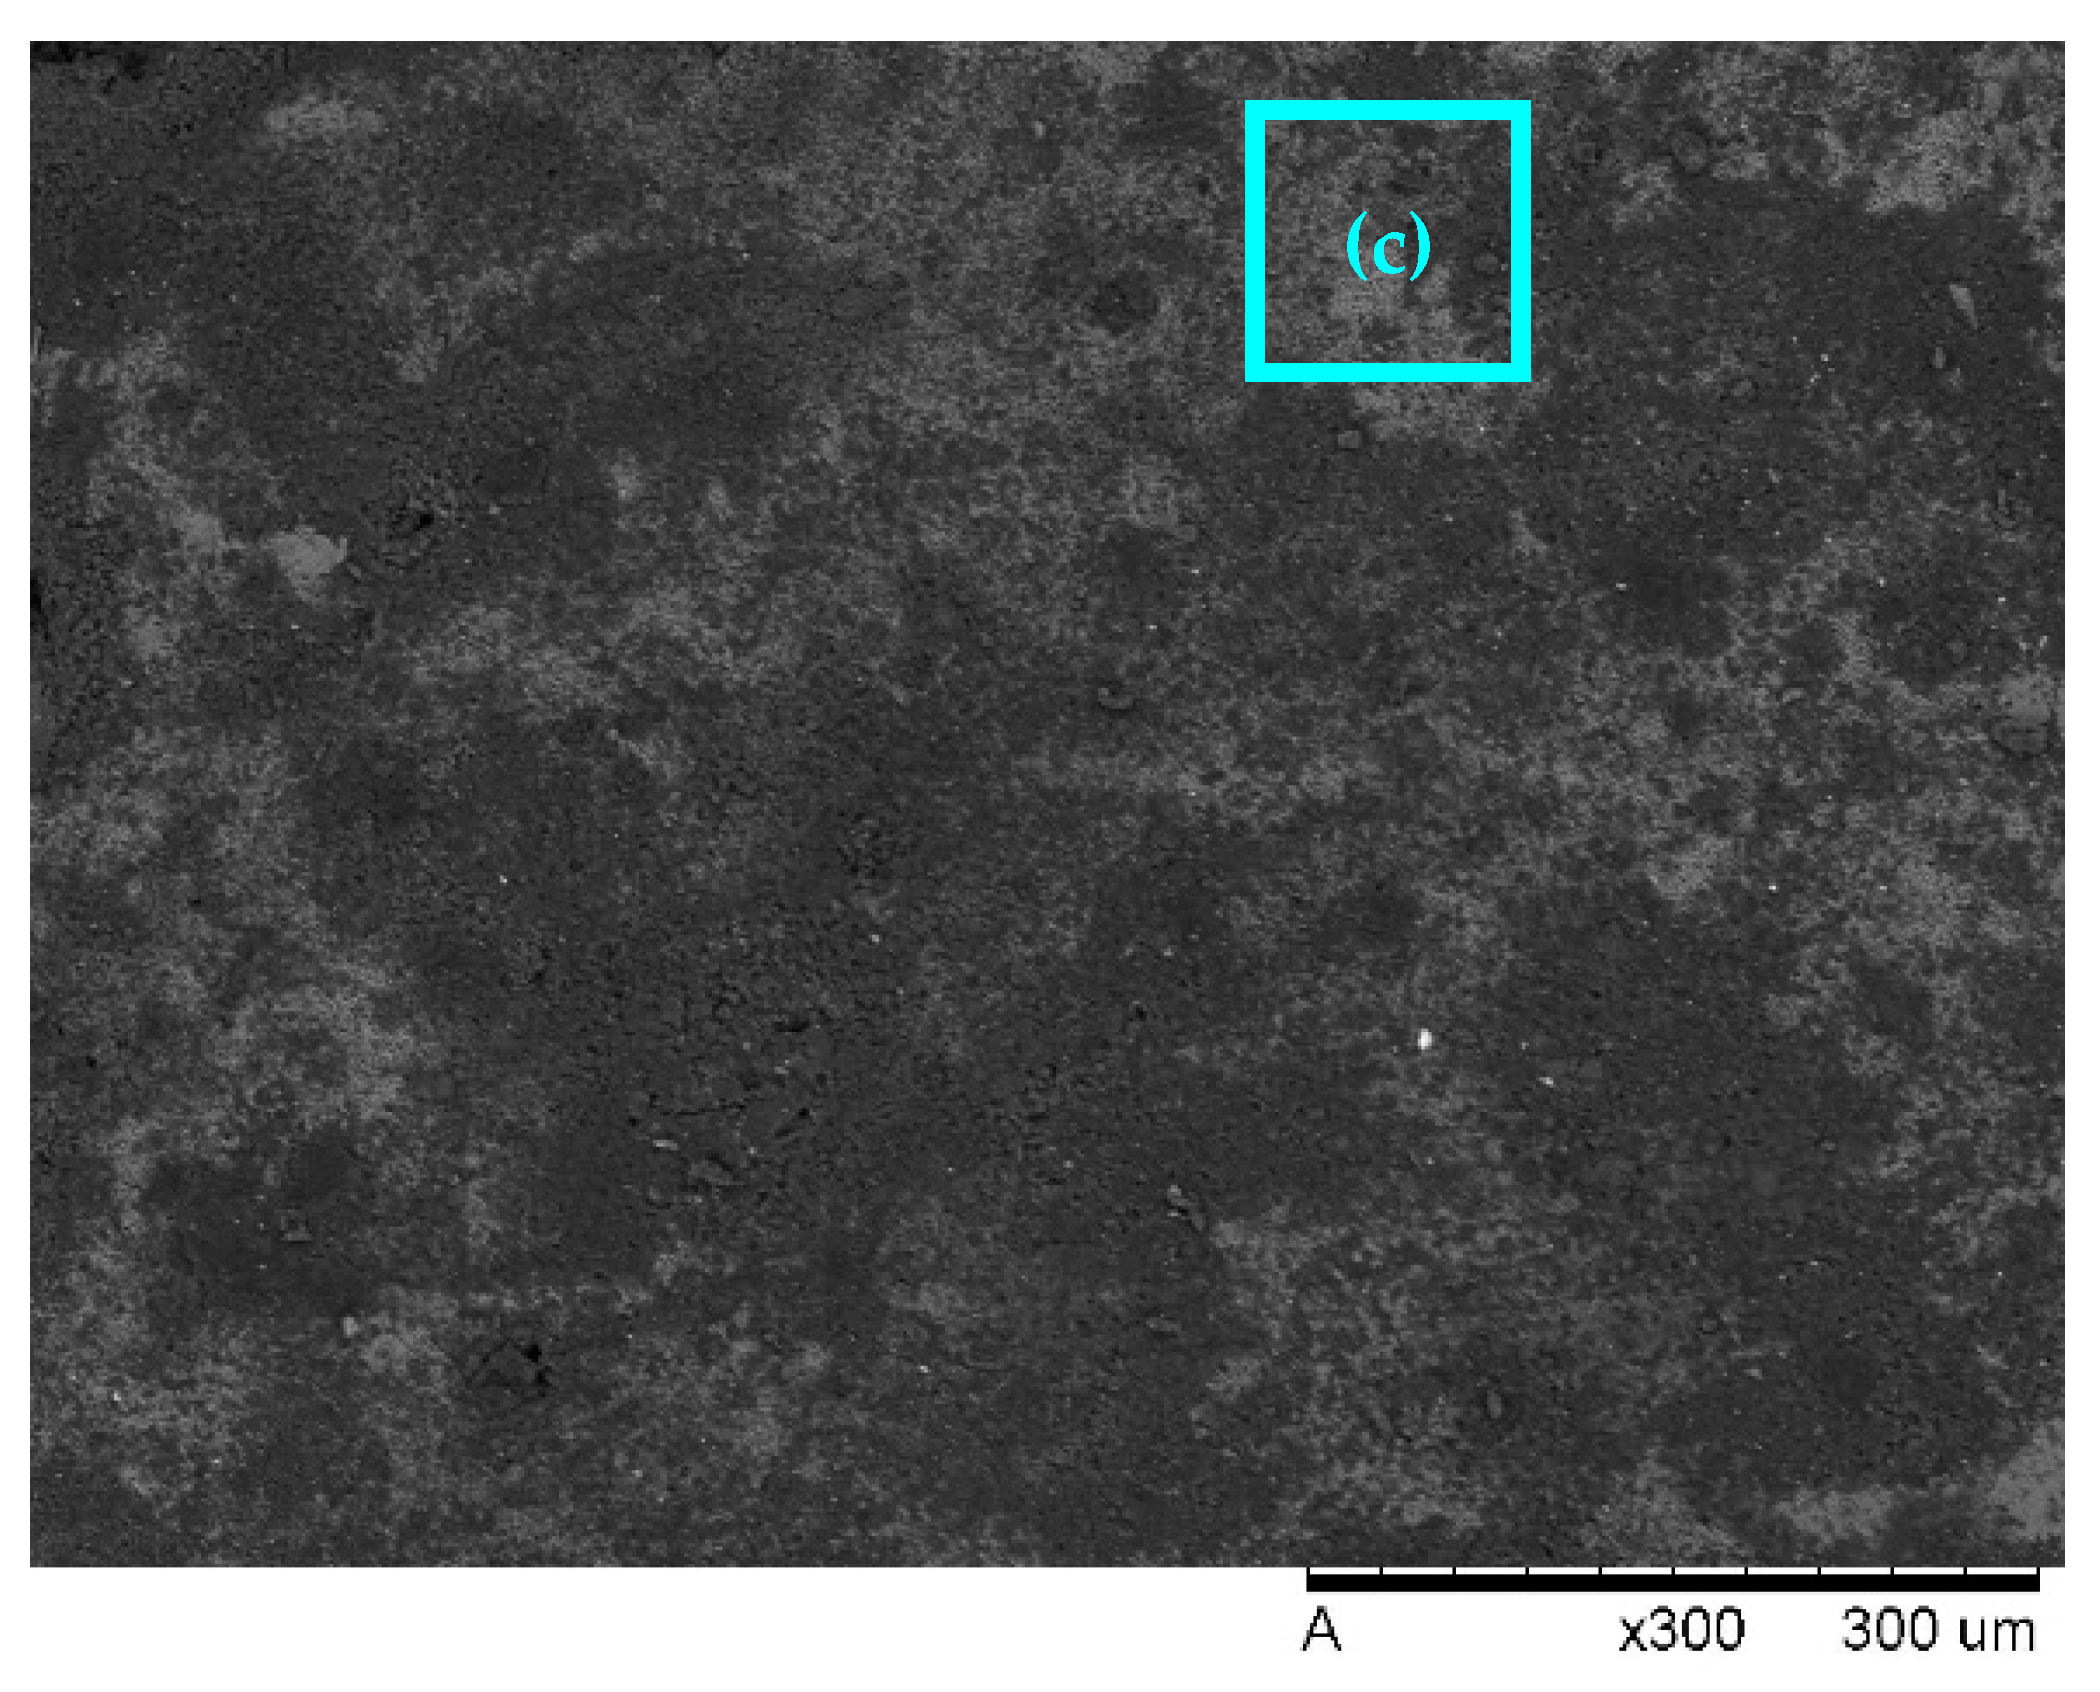
In this research, the surface of the Al electrode before and after EC treatment was characterised by SEM. Figure 9a shows the surface of the Al electrode before the EC process. The electrode’s surface was smooth prior to connecting to DC. Figure 9b illustrates the SEM image for the Al electrode after the EC process. The passive layer on the surface of the electrodes was observed during the EC process. Figure 9c shows the effect of ultrasound on the electrode’s surface. It was found that the surface was smooth. In other words, this study observed that the ultrasound was effective in removing the passive film from the electrode’s surface.
References [18,67] investigated the effectiveness of ultrasonics in preventing the passive layer from the electrode’s surface due to their cavitation phenomenon, which can cause physical and chemical effects. Physical effects include shock waves, microjets, turbulence, and acoustic streaming that lead to enhancing the chemical reaction rate, increasing the mass transfer of pollutants between the electrodes, and reducing the diffusion layer thickness [40,68]. This prevents the passivation at the surface of the anode and increases the anode dissolution [40]. In addition, it extends the electrode’s life and lowers the cost of treatment [41].

4. Conclusions

This study demonstrated that the EC process was used effectively and that extremely high levels of O&G were removed from restaurant wastewater effluent. Various operating conditions’ effects on the EC process, such as interelectrode distance, electrolysis time, and current density, were investigated for maximum O&G and COD removal using an experimental design RSM. Based on CCD, the optimum removal efficiencies of O&G and COD with Al electrodes were 95.4% and 75.9%, respectively, at the optimum operating conditions of 2.4 cm interelectrode distance, 30.5 min electrolysis time, and 53.2 A/m2 current density. The quadratic model in this research was utilised to evaluate the correlation between the experiment and predicted removal efficiency. The experiment’s removal efficiency was 95.9 for O&G and 75.3 for COD, which was near the predicted removal efficiency. In addition, the analysis of variance (ANOVA) shows the R2 > 0.80, CV < 10%, and p-value < 0.05, which describe the high accuracy of the quadratic model. The conclusion reached as an outcome of this study was that ultrasound alone was insufficient. On the other side, the US aided the EC process by agitating the sample. This increased the mass transfer rate. In addition, it removed the passive film from the electrode’s surface, which increased the dissolution of metal ions. As a result, the US-EC processes were an efficient technique to improve removal effectiveness and prevent the passive film from forming on the electrode’s surface. After obtaining the results, the high efficiency of the treatment method was shown as a pretreatment method for removing O&G in restaurants, and this, in turn, reduced maintenance and repairs for treatment plants. One of the most important considerations when designing the experimental set-up is cost. The problem that we faced was consuming electrodes quickly. In subsequent studies, I recommend searching for reusable materials such as beverage cans. Additionally, in our study, continuous ultrasound was used, and this increased the breaking of flocs, so I recommend using intermittent ultrasound.

Author Contributions

Conceptualization, M.S.Y. and H.H.; methodology, S.O.A.N. and M.S.Y.; formal analysis, S.O.A.N. and N.H.M.K.; resources, M.J.K.B. and T.S.B.A.M.; writing—original draft preparation, S.O.A.N.; writing—review and editing, H.A.A. and A.M.; supervision, M.S.Y. and H.H.; funding acquisition, M.S.Y. and H.H. All authors have read and agreed to the published version of the manuscript.

Funding

Ministry of Higher Education Malaysia for Fundamental Research Grant Scheme with Project Code: FRGS/1/2021/WAB02/USM/03/3.

Data Availability Statement

Data is contained within the article. The data presented in this study are as shown in the article.

Conflicts of Interest

The authors declare no conflict of interest.

Abbreviations

ECElectrocoagulationRSMResponse surface methodology
USUltrasonicCCDCentral composite design
O&GOil and greaseIDInterelectrode distance
CODChemical oxygen demandTElectrolysis time
BODBiological oxygen demandCDCurrent density
TSSTotal suspended SolidsSEMScanning electron microscopy
DODissolved oxygenFeIron
TDSTotal dissolved solidsSSstainless steel
TNTotal nitrogenAlAluminium
C.VCoefficient of variation R2Coefficient of determination

References

  1. El-Ezaby, K.H.; El-Gammal, M.I.; Shaaban, Y.A. Electrocoagulation Treatment for Wastewaters from some Restaurants in New Damietta City-Egypt. J. Environ. Sci. Mansoura Univ. 2020, 49, 87–98. [Google Scholar] [CrossRef]
  2. Yau, Y.-H.; Rudolph, V.; Lo, C.C.-M.; Wu, K.-C. Restaurant oil and grease management in Hong Kong. Environ. Sci. Pollut. Res. 2021, 28, 40735–40745. [Google Scholar] [CrossRef]
  3. An, C.; Huang, G.; Yao, Y.; Zhao, S. Emerging usage of electrocoagulation technology for oil removal from wastewater: A review. Sci. Total. Environ. 2017, 579, 537–556. [Google Scholar] [CrossRef] [PubMed]
  4. Shokri, A.; Fard, M.S. A critical review in electrocoagulation technology applied for oil removal in industrial wastewater. Chemosphere 2021, 288, 132355. [Google Scholar] [CrossRef] [PubMed]
  5. Wallace, T.; Gibbons, D.; O’Dwyer, M.; Curran, T.P. International evolution of fat, oil and grease (FOG) waste management—A review. J. Environ. Manag. 2017, 187, 424–435. [Google Scholar] [CrossRef] [PubMed] [Green Version]
  6. Fox, C.; O’Hara, P.; Bertazzon, S.; Morgan, K.; Underwood, F.; Paquet, P. A preliminary spatial assessment of risk: Marine birds and chronic oil pollution on Canada’s Pacific coast. Sci. Total. Environ. 2016, 573, 799–809. [Google Scholar] [CrossRef] [Green Version]
  7. Gao, L.-L.; Lu, Y.-C.; Zhang, J.-L.; Li, J.; Zhang, J.-D. Biotreatment of restaurant wastewater with an oily high concentration by newly isolated bacteria from oily sludge. World J. Microbiol. Biotechnol. 2019, 35, 179. [Google Scholar] [CrossRef] [PubMed]
  8. Kalla, S. Use of membrane distillation for oily wastewater treatment–a review. J. Environ. Chem. Eng. 2021, 9, 104641. [Google Scholar] [CrossRef]
  9. Zheng, T.; Wang, Q.; Shi, Z.; Huang, P.; Li, J.; Zhang, J.; Wang, J. Separation of Pollutants from Oil-Containing Restaurant Wastewater by Novel Microbubble Air Flotation and Traditional Dissolved Air Flotation. Sep. Sci. Technol. 2015, 50, 2568–2577. [Google Scholar] [CrossRef]
  10. Sravanth, T.; Ramesh, S.; Gandhimathi, R.; Nidheesh, P.V. Continuous treatability of oily wastewater from locomotive wash facilities by electrocoagulation. Sep. Sci. Technol. 2019, 55, 583–589. [Google Scholar] [CrossRef]
  11. Jiang, W.-M.; Chen, Y.-M.; Chen, M.-C.; Liu, X.-L.; Liu, Y.; Wang, T.; Yang, J. Removal of emulsified oil from polymer-flooding sewage by an integrated apparatus including EC and separation process. Sep. Purif. Technol. 2018, 211, 259–268. [Google Scholar] [CrossRef]
  12. El-Ashtoukhy, E.-S.; Amin, N.; Fouad, Y.; Hamad, H. Intensification of a new electrocoagulation system characterized by minimum energy consumption and maximum removal efficiency of heavy metals from simulated wastewater. Chem. Eng. Process.—Process. Intensif. 2020, 154, 108026. [Google Scholar] [CrossRef]
  13. Abdulhadi, B.; Kot, P.; Hashim, K.; Shaw, A.; Muradov, M.; Al-Khaddar, R. Continuous-flow electrocoagulation (EC) process for iron removal from water: Experimental, statistical and economic study. Sci. Total Environ. 2021, 760, 143417. [Google Scholar] [CrossRef]
  14. Hamid, M.A.A.; Aziz, H.A.; Yusoff, M.S.; Rezan, S.A. Optimization and Analysis of Zeolite Augmented Electrocoagulation Process in the Reduction of High-Strength Ammonia in Saline Landfill Leachate. Water 2020, 12, 247. [Google Scholar] [CrossRef] [Green Version]
  15. Shabestar, M.P.; Moghaddam, M.R.A.; Karamati-Niaragh, E. Evaluation of energy and electrode consumption of Acid Red 18 removal using electrocoagulation process through RSM: Alternating and direct current. Environ. Sci. Pollut. Res. 2021, 28, 67214–67223. [Google Scholar] [CrossRef] [PubMed]
  16. Bharath, M.; Krishna, B.; Kumar, B.M. A Review of Electrocoagulation Process for Wastewater Treatment. Int. J. ChemTech Res. 2018, 11, 289–302. [Google Scholar] [CrossRef]
  17. Nigri, E.M.; Santos, A.L.A.; Rocha, S.D.F. Removal of organic compounds, calcium and strontium from petroleum industry effluent by simultaneous electrocoagulation and adsorption. J. Water Process. Eng. 2020, 37, 101442. [Google Scholar] [CrossRef]
  18. He, C.-C.; Hu, C.-Y.; Lo, S.-L. Integrating chloride addition and ultrasonic processing with electrocoagulation to remove passivation layers and enhance phosphate removal. Sep. Purif. Technol. 2018, 201, 148–155. [Google Scholar] [CrossRef]
  19. Hakizimana, J.N.; Gourich, B.; Chafi, M.; Stiriba, Y.; Vial, C.; Drogui, P.; Naja, J. Electrocoagulation process in water treatment: A review of electrocoagulation modeling approaches. Desalination 2017, 404, 1–21. [Google Scholar] [CrossRef]
  20. Emerick, T.; Vieira, J.L.; Silveira, M.H.L.; João, J.J. Ultrasound-assisted electrocoagulation process applied to the treatment and reuse of swine slaughterhouse wastewater. J. Environ. Chem. Eng. 2020, 8, 104308. [Google Scholar] [CrossRef]
  21. Benekos, A.K.; Zampeta, C.; Argyriou, R.; Economou, C.N.; Triantaphyllidou, I.-E.; Tatoulis, T.I.; Tekerlekopoulou, A.; Vayenas, D.V. Treatment of table olive processing wastewaters using electrocoagulation in laboratory and pilot-scale reactors. Process. Saf. Environ. Prot. 2019, 131, 38–47. [Google Scholar] [CrossRef]
  22. Garcia-Segura, S.; Eiband, M.M.S.G.; de Melo, J.V.; Martinez-Huitle, C.A. Electrocoagulation and advanced electrocoagulation processes: A general review about the fundamentals, emerging applications and its association with other technologies. J. Electroanal. Chem. 2017, 801, 267–299. [Google Scholar] [CrossRef] [Green Version]
  23. Brahmi, K.; Bouguerra, W.; Hamrouni, B.; Elaloui, E.; Loungou, M.; Tlili, Z. Investigation of electrocoagulation reactor design parameters effect on the removal of cadmium from synthetic and phosphate industrial wastewater. Arab. J. Chem. 2019, 12, 1848–1859. [Google Scholar] [CrossRef]
  24. Tegladza, I.D.; Xu, Q.; Xu, K.; Lv, G.; Lu, J. Electrocoagulation processes: A general review about role of electro-generated flocs in pollutant removal. Process. Saf. Environ. Prot. 2021, 146, 169–189. [Google Scholar] [CrossRef]
  25. Kumar, D.; Sharma, C. Paper industry wastewater treatment by electrocoagulation and aspect of sludge management. J. Clean. Prod. 2022, 360, 131970. [Google Scholar] [CrossRef]
  26. Barrera-Díaz, C.E.; Balderas-Hernández, P.; Bilyeu, B. Electrocoagulation: Fundamentals and prospectives. In Electrochemical Water and Wastewater Treatment; Elsevier: Amsterdam, The Netherlands, 2018; pp. 61–76. [Google Scholar]
  27. Safari, S.; Aghdam, M.A.; Kariminia, H. Electrocoagulation for COD and diesel removal from oily wastewater. Int. J. Environ. Sci. Technol. 2016, 13, 231–242. [Google Scholar] [CrossRef] [Green Version]
  28. Verma, A.K. Treatment of textile wastewaters by electrocoagulation employing Fe-Al composite electrode. J. Water Process. Eng. 2017, 20, 168–172. [Google Scholar] [CrossRef]
  29. AlJaberi, F.Y.; Alardhi, S.M.; Ahmed, S.A.; Salman, A.D.; Juzsakova, T.; Cretescu, I.; Le, P.-C.; Chung, W.; Chang, S.; Nguyen, D. Can electrocoagulation technology be integrated with wastewater treatment systems to improve treatment efficiency? Environ. Res. 2022, 214, 113890. [Google Scholar] [CrossRef] [PubMed]
  30. Demirci, Y.; Pekel, L.; Alpbaz, M. Investigation of different electrode connections in electrocoagulation of textile wastewater treatment. Int. J. Electrochem. Sci. 2015, 10, 2685–2693. [Google Scholar]
  31. Neto, S.L.d.C.; Viviani, J.C.T.; Weschenfelder, S.E.; Cunha, M.d.F.R.d.; Junior, A.E.O.; Costa, B.R.D.S.; Mazur, L.P.; Marinho, B.A.; da Silva, A.; de Souza, A.A.U.; et al. Evaluation of petroleum as extractor fluid in liquid-liquid extraction to reduce the oil and grease content of oilfield produced water. Process. Saf. Environ. Prot. 2022, 161, 263–272. [Google Scholar] [CrossRef]
  32. Oktiawan, W.; Samadikun, B.P.; Junaidi; Bramahesa, I.G.N.; Taqiyya, T.A.; Amrullah, M.R.; Basyar, C. Effect of electrode configuration and voltage variations on electrocoagulation process in surfactant removal from laundry wastewater. IOP Conf. Series: Earth Environ. Sci. 2021, 896, 012049. [Google Scholar] [CrossRef]
  33. Almukdad, A.; Hafiz, M.A.; Yasir, A.T.; Alfahel, R.; Hawari, A.H. Unlocking the application potential of electrocoagulation process through hybrid processes. J. Water Process. Eng. 2021, 40, 101956. [Google Scholar] [CrossRef]
  34. Asaithambi, P.; Aziz, A.R.A.; Sajjadi, B.; Daud, W.M.A.B.W. Sono assisted electrocoagulation process for the removal of pollutant from pulp and paper industry effluent. Environ. Sci. Pollut. Res. 2017, 24, 5168–5178. [Google Scholar] [CrossRef]
  35. Dizge, N.; Akarsu, C.; Ozay, Y.; Gulsen, H.E.; Adiguzel, S.K.; Mazmanci, M.A. Sono-assisted electrocoagulation and cross-flow membrane processes for brewery wastewater treatment. J. Water Process. Eng. 2018, 21, 52–60. [Google Scholar] [CrossRef]
  36. Al-Rubaiey, N.A.; Al-Barazanjy, M.G. Ultrasonic Technique in Treating Wastewater by Electrocoagulation. Eng. Technol. J. 2018, 36, 54–62. [Google Scholar] [CrossRef]
  37. Moradi, M.; Vasseghian, Y.; Arabzade, H.; Khaneghah, A.M. Various wastewaters treatment by sono-electrocoagulation process: A comprehensive review of operational parameters and future outlook. Chemosphere 2021, 263, 128314. [Google Scholar] [CrossRef]
  38. Prajapati, A.K. Sono-assisted electrocoagulation treatment of rice grain based distillery biodigester effluent: Performance and cost analysis. Process. Saf. Environ. Prot. 2021, 150, 314–322. [Google Scholar] [CrossRef]
  39. Ohrdes, H.; Ille, I.; Twiefel, J.; Wallaschek, J.; Nogueira, R.; Rosenwinkel, K.-H. A control system for ultrasound devices utilized for inactivating E. coli in wastewater. Ultrason. Sonochem. 2018, 40, 158–162. [Google Scholar] [CrossRef]
  40. Hashim, K.S.; Ali, S.S.M.; AlRifaie, J.K.; Kot, P.; Shaw, A.; Al Khaddar, R.; Idowu, I.; Gkantou, M. Escherichia coli inactivation using a hybrid ultrasonic–electrocoagulation reactor. Chemosphere 2020, 247, 125868. [Google Scholar] [CrossRef]
  41. Ritesh, P.; Srivastava, V.C. Understanding of ultrasound enhanced electrochemical oxidation of persistent organic pollutants. J. Water Process. Eng. 2020, 37, 101378. [Google Scholar] [CrossRef]
  42. Manojkumar, N.; Muthukumaran, C.; Sharmila, G. A comprehensive review on the application of response surface methodology for optimization of biodiesel production using different oil sources. J. King Saud Univ.—Eng. Sci. 2022, 34, 198–208. [Google Scholar] [CrossRef]
  43. Hanrahan, G.; Lu, K. Application of Factorial and Response Surface Methodology in Modern Experimental Design and Optimization. Crit. Rev. Anal. Chem. 2006, 36, 141–151. [Google Scholar] [CrossRef]
  44. Khorram, A.G.; Fallah, N. Treatment of textile dyeing factory wastewater by electrocoagulation with low sludge settling time: Optimization of operating parameters by RSM. J. Environ. Chem. Eng. 2018, 6, 635–642. [Google Scholar] [CrossRef]
  45. Deveci, E.; Akarsu, C.; Gönen, Ç.; Özay, Y. Enhancing treatability of tannery wastewater by integrated process of electrocoagulation and fungal via using RSM in an economic perspective. Process. Biochem. 2019, 84, 124–133. [Google Scholar] [CrossRef]
  46. Bajpai, M.; Katoch, S.S.; Kadier, A.; Ma, P.-C. Treatment of pharmaceutical wastewater containing cefazolin by electrocoagulation (EC): Optimization of various parameters using response surface methodology (RSM), kinetics and isotherms study. Chem. Eng. Res. Des. 2021, 176, 254–266. [Google Scholar] [CrossRef]
  47. Abbasi, S.; Mirghorayshi, M.; Zinadini, S.; Zinatizadeh, A.A. A novel single continuous electrocoagulation process for treatment of licorice processing wastewater: Optimization of operating factors using RSM. Process. Saf. Environ. Prot. 2020, 134, 323–332. [Google Scholar] [CrossRef]
  48. Lakshmi, P.M.; Sivashanmugam, P. Treatment of oil tanning effluent by electrocoagulation: Influence of ultrasound and hybrid electrode on COD removal. Sep. Purif. Technol. 2013, 116, 378–384. [Google Scholar] [CrossRef]
  49. Ji, M.; Jiang, X.; Wang, F. A mechanistic approach and response surface optimization of the removal of oil and grease from restaurant wastewater by electrocoagulation and electroflotation. Desalination Water Treat. 2015, 55, 2044–2052. [Google Scholar] [CrossRef]
  50. Yusoff, M.S.; Azwan, A.M.; Zamri, M.F.M.A.; Aziz, H.A. Removal of colour, turbidity, oil and grease for slaughterhouse wastewater using electrocoagulation method. AIP Conf. Proc. 2017, 1892, 040012. [Google Scholar] [CrossRef]
  51. Naser, G.F.; Mohammed, T.J.; Abbar, A.H. Treatment of Al-Muthanna Petroleum Refinery Wastewater by Electrocoagulation Using a Tubular batch Electrochemical Reactor. IOP Conf. Ser. Earth Environ. Sci. 2021, 779, 012094. [Google Scholar] [CrossRef]
  52. Priya, M.; Jeyanthi, J. Removal of COD, oil and grease from automobile wash water effluent using electrocoagulation technique. Microchem. J. 2019, 150, 104070. [Google Scholar] [CrossRef]
  53. Ghahrchi, M.; Rezaee, A.; Adibzadeh, A. Study of kinetic models of olive oil mill wastewater treatment using electrocoagulation process. Desalination Water Treat. 2021, 211, 123–130. [Google Scholar] [CrossRef]
  54. Adegoke, A.T.; Abayomi, E.T. A preliminary study on the treatment of restaurant wastewater using electrocoagulation technique. J. Degraded Min. Lands Manag. 2020, 7, 2029–2033. [Google Scholar] [CrossRef]
  55. Nasrullah, M.; Ansar, S.; Krishnan, S.; Singh, L.; Peera, S.G.; Zularisam, A. Electrocoagulation treatment of raw palm oil mill effluent: Optimization process using high current application. Chemosphere 2022, 299, 134387. [Google Scholar] [CrossRef] [PubMed]
  56. APHA. Standard Methods for the Examination of Water and Wastewater, 23rd ed.; American Public Health Association (APHA): Washington, DC, USA, 2017; Volume 91. [Google Scholar]
  57. Zhao, S.; Huang, G.; Cheng, G.; Wang, Y.; Fu, H. Hardness, COD and turbidity removals from produced water by electrocoagulation pretreatment prior to Reverse Osmosis membranes. Desalination 2014, 344, 454–462. [Google Scholar] [CrossRef]
  58. Zargazi, M.; Entezari, M.H. Sono-electrodeposition of novel bismuth sulfide films on the stainless steel mesh: Photocatalytic reduction of Cr (VI). J. Hazard. Mater. 2020, 384, 121300. [Google Scholar] [CrossRef]
  59. Carroll Croarkin and Paul TobiasNist/Sematech, Engineering Statistics Handbook; National Institute of Standards and Technology: Washington, DC, USA, 2012.
  60. Breig, S.J.M.; Luti, K.J.K. Response surface methodology: A review on its applications and challenges in microbial cultures. Mater. Today Proc. 2021, 42, 2277–2284. [Google Scholar] [CrossRef]
  61. Tahreen, A.; Jami, M.S.; Ali, F. Role of electrocoagulation in wastewater treatment: A developmental review. J. Water Process. Eng. 2020, 37, 101440. [Google Scholar] [CrossRef]
  62. Akkaya, G.K. Treatment of petroleum wastewater by electrocoagulation using scrap perforated (Fe-anode) and plate (Al and Fe-cathode) metals: Optimization of operating parameters by RSM. Chem. Eng. Res. Des. 2022, 187, 261–275. [Google Scholar] [CrossRef]
  63. Zhou, Z.; Yang, Y.; Li, X.; Li, P.; Zhang, T.; Lv, X.; Liu, L.; Dong, J.; Zheng, D. Optimized removal of natural organic matter by ultrasound-assisted coagulation of recycling drinking water treatment sludge. Ultrason. Sonochem. 2018, 48, 171–180. [Google Scholar] [CrossRef]
  64. Dahlan, I.; Azhar, E.E.M.; Hassan, S.R.; Aziz, H.A.; Hung, Y.-T. Statistical Modeling and Optimization of Process Parameters for 2,4-Dichlorophenoxyacetic Acid Removal by Using AC/PDMAEMA Hydrogel Adsorbent: Comparison of Different RSM Designs and ANN Training Methods. Water 2022, 14, 3061. [Google Scholar] [CrossRef]
  65. Ciggin, A.S.; Sarica, E.S.; Doğruel, S.; Orhon, D. Impact of ultrasonic pretreatment on Fenton-based oxidation of olive mill wastewater—Towards a sustainable treatment scheme. J. Clean. Prod. 2021, 313, 127948. [Google Scholar] [CrossRef]
  66. He, C.-C.; Hu, C.-Y.; Lo, S.-L. Evaluation of sono-electrocoagulation for the removal of Reactive Blue 19 passive film removed by ultrasound. Sep. Purif. Technol. 2016, 165, 107–113. [Google Scholar] [CrossRef]
  67. Noor, M.H.M.; Azli, M.F.Z.M.; Ngadi, N.; Inuwa, I.M.; Opotu, L.A.; Mohamed, M. Optimization of sonication-assisted synthesis of magnetic Moringa oleifera as an efficient coagulant for palm oil wastewater treatment. Environ. Technol. Innov. 2022, 25, 102191. [Google Scholar] [CrossRef]
  68. Patidar, R.; Srivastava, V.C. Ultrasound-assisted enhanced electroxidation for mineralization of persistent organic pollutants: A review of electrodes, reactor configurations and kinetics. Crit. Rev. Environ. Sci. Technol. 2021, 51, 1667–1701. [Google Scholar] [CrossRef]
Figure 1. Map of the study area and sample collection.
Separations 10 00061 g001
Figure 2. EC set-up.
Separations 10 00061 g002
Figure 3. The effect of ID on the (%) removal efficiency and concentration of (a) O&G and (b) COD using the EC process with a constant electrolysis time of 20 min and 50 A/m2 current density.
Separations 10 00061 g003
Figure 4. The effect of T on the (%) removal efficiency and concentration of (a) O&G and (b) COD using the EC process with a constant interelectrode distance of 2 cm and 50 A/m2 current density.
Separations 10 00061 g004
Figure 5. The effect of CD on the (%) removal efficiency and concentration of (a) O&G and (b) COD using the EC process with a constant interelectrode distance of 2 cm and a 30 min electrolysis time.
Separations 10 00061 g005
Figure 6. Comparison of US, EC, and US-EC processes on (a) O&G (%) and (b) COD removal (%), with optimum operating condition: 2 cm interelectrode distance and 50 A/m2 current density.
Separations 10 00061 g006
Figure 7. The actual value versus the predicted value: (a) O&G, (b) COD, normal distribution plots (c) O&G, and (d) COD.
Separations 10 00061 g007
Figure 8. Three-dimensional plots for the effect of individual and interaction of the factors on the O&G and COD removal: (a) interaction effect of CD vs. T on O&G removal (%), (b) interaction effect of CD vs. ID on O&G removal (%), (c) interaction effect of T vs. ID on O&G removal (%), (d) interaction effect of CD vs. T on COD removal (%), (e) interaction effect of T vs. ID on COD removal (%), and (f) interaction effect of CD vs. ID on COD removal (%).
Separations 10 00061 g008aSeparations 10 00061 g008b
Figure 9. The characterisation of the electrode (a) before treatment, (b) after the EC process, (c) after US-EC.
Separations 10 00061 g009aSeparations 10 00061 g009b
Table 1. The application of EC process for oily wastewater treatment.
Wastewater TypeElectrode CombinationOptimum pHIE (cm)T (Min)CDTreatment Efficiency (%)Optimisation StudySEM Image(s) on the ElectrodeRef.
Oil Tanning EffluentFe-Fen.a.1.5-20 mA/cm2COD 89.6Linear regression analysisn.a.[48]
Restaurant WastewaterAl-SS5–63.63443 A/m2O&G 95RSM [49]
SlaughterhouseAl-Fen.a.0.530-98 O&G
92 colour
91 turbidity
n.a.n.a.[50]
Petroleum Refinery PlantAL-SS724515 mA/cm2COD 95.3n.a.n.a.[51]
Automobile WashCu (anode)–Al (cathode)654025 A/m2COD 95.1
O&G 92.5
n.a.n.a.[52]
Olive Oil Mill WastewaterAl-SS716012.5 mA/cm2COD 99n.a.n.a.[53]
Restaurant Wastewatercarbon electrodes n.a.1901.0 AmpPP 40.75
PO43− 33
P2O5 32.83
COD 25.83
n.a.n.a.[54]
Restaurants WWAl-Al7.0326040 mA/cm2COD 84.6, 74.5, 89.15, 68.5, 92.79%
O&G 100%, 100%, 92.42, 94.5, 87.76%
n.a.n.a.[1]
Palm Oil Mill Effluentsteel wool 4.370.8644.97542 mA/cm2COD 97.21
BOD 99.26
Suspended solid 99.00
n.a.n.a.[55]
Restaurant WWAl-Al72.430.553.2COD 75.9
O&G 95.4
RSMBefore treatment, after EC, after US-EC treatmentCurrent research
(Fe) iron, (SS) stainless steel, (n.a.) not available, (ID) interelectrode distance, (T) electrolysis time, (CD) current density.
Table 2. Characterisation of the restaurant wastewater.
ParametersUnitValueLimit Value from the Environmental Quality (Regulation 2009)
Temperature°C3040
PH-66.0–9.0
Electrical conductivityµs/cm332.4-
DOmg/L2.1-
DO%28
TDSmg/L268-
BODmg/L379250
TSSmg/L373.9300
CODmg/L955500
TNmg/L22.650
O&Gmg/L343450
Table 3. The coded independent factors and levels of the independent factors used for CCD.
SignIndependent FactorsUnitFactors Level
−2−1012
A (ID)interelectrode distancecm23456
B (T)electrolysis timemin1520253035
C (CD)current densityA/m24050607080
Table 4. Design matrix CCD showing actual and predicted responses.
RunPoint TypeFactorsO&G Removal (%)COD Removal (%)
ID (cm)T (min)CD (A/m2)Experiment ValuePredicted ValueExperiment ValuePredicted Value
1star4356092.4790.9875.3577.44
2Factorial5305070.6371.7166.4665.25
3Factorial3305094.1794.7174.7772.1
4Center4256090.4789.4366.5966.3
5star6256047.5245.4857.7858.26
6Factorial3207077.1779.1365.6965.07
7Factorial5307066.1568.6170.5669.19
8Center4256088.6789.4364.7666.3
9Factorial3205084.0884.6667.967.45
10Center4256092.6589.4365.8966.3
11star4254070.9770.8457.5959.38
12Factorial3307088.1790.1175.2774.5
13Center4256089.7689.4363.4666.3
14Center4256086.9289.4367.166.3
15star2256090.9289.9374.8376.18
16Center4256091.1589.4368.1566.3
17star4258065.1462.2360.8960.94
18Factorial5205060.6161.7155.9154.85
19Factorial5207055.1957.6853.1554
20star4156071.557057.8757.6
Table 5. Fit summary models.
Fit Summary Model for O&G Removal (%)
SourceModel
p-Value
Lack of Fit
p-Value
Adjusted R2Predicted
R2
Design Model0.00080.00110.66050.5671
Linear0.00070.00070.58140.4808
2FI0.99950.00040.48540.2949
Quadratic<0.00010.21070.96910.9043Suggested
Cubic0.90060.03320.9559−0.8096Aliased
Model summaryR2Adj. R2C.V
98.38%96.91%3.18%
Fit Summary Model for COD Removal (%)
SourceModel
p-value
Lack of Fit
p-value
Adjusted
R2
Predicted
R2
Design Model<0.00010.07670.82280.7778
Linear<0.00010.06570.80320.6937
2FI0.37850.06100.80730.6894
Quadratic0.00970.29380.91610.7559Suggested
Cubic0.64640.09280.9025−1.9485Aliased
Model summaryR2Adj. R2C.V
95.58%91.61%2.98%
Table 6. Analysis of variance (ANOVA) and regression model validation on O&G (%) and COD (%) removal.
ANOVA for Quadratic Model for O&G
SourceS.Sd.fM.SF-Valuep-Value
Model3783.929420.4467.29<0.0001significant
A-I. E1975.9711975.97316.27<0.0001
B-T440.181440.1870.45<0.0001
C-C. D74.29174.2911.890.0062
AB0.001410.00140.00020.9883
AC1.1211.120.17940.6809
BC0.429710.42970.06880.7984
A2741.931741.93118.75<0.0001
B2125.691125.6920.120.0012
C2823.911823.91131.87<0.0001
Residual62.48106.25
Lack of Fit42.6358.532.150.2107not significant
Pure Error19.8553.97
Cor Total3846.4019
Final Equation O & G   ( % ) = 89.43 11.11 A + 5.25 B 2.15 C 5.43 A 2 2.24 B 2 5.72 C 2
ANOVA for Quadratic Model for COD
SourceS.Sd.fM.SF-Valuep-Value
Model821.61991.2924.04<0.0001significant
A-I. E320.951320.9584.51<0.0001
B-T393.741393.74103.67<0.0001
C-C. D2.4312.430.63950.4425
AB16.55116.554.360.0634
AC1.1711.170.30920.5904
BC11.44111.443.010.1133
A21.3411.340.35260.5659
B22.3612.360.62140.4488
C259.24159.2415.600.0027
Residual37.98103.80
Lack of Fit23.7554.751.670.2938not significant
Pure Error14.2352.85
Cor Total859.5819
Final Equation C O D   ( % ) = 66.30 4.48 A + 4.96 B 1.53 C 2
S.S: sum of squares; d.f: degree of freedom; M.S: mean square.
Table 7. Optimisation of the O&G and COD removal from the experiment and predicted value.
ID
(cm)
T
(min)
CD
(A/m2)
O&G Removal (%)Error
(%)
COD Removal (%)Error
(%)
PredictedExperimentPredictedExperiment
2.430.553.295.495.90.5275.975.30.8
Regarding the results, the verifying experiment removal rate was nearly as high as the predicted O&G and COD removal rates; the removal of O&G and COD was 95.4, 95.9, and 75.9, 75.3, respectively; this confirms the high value of R2. As a result, there was a strong correlation between the quadratic regression model and the removal efficiency of O&G and COD removal.
Disclaimer/Publisher’s Note: The statements, opinions and data contained in all publications are solely those of the individual author(s) and contributor(s) and not of MDPI and/or the editor(s). MDPI and/or the editor(s) disclaim responsibility for any injury to people or property resulting from any ideas, methods, instructions or products referred to in the content.