


The Hidden Cost of High Aspirations: Examining the Stress-Enhancing Effect of Motivational Goals Using Vignette Methodology


Abstract
1. Introduction
2. Theoretical Background
2.1. Motivational Schemas and Goals
2.2. Stress and Well-Being
2.2.1. Avoidance Goals, Conflict Schemas, and Discordance
2.2.2. Incongruence
3. Materials and Methods
3.1. Study Design
3.2. Pilot Study
3.3. Study Participants
3.4. Data Collection Procedure and Data Collection Tools
3.5. Instruments
3.6. Preparation of the Dataset and Data Analysis
3.7. Model Estimation
4. Results
4.1. Assumptions and Descriptive Analyisis
4.2. Inferential Hypothesis Testing
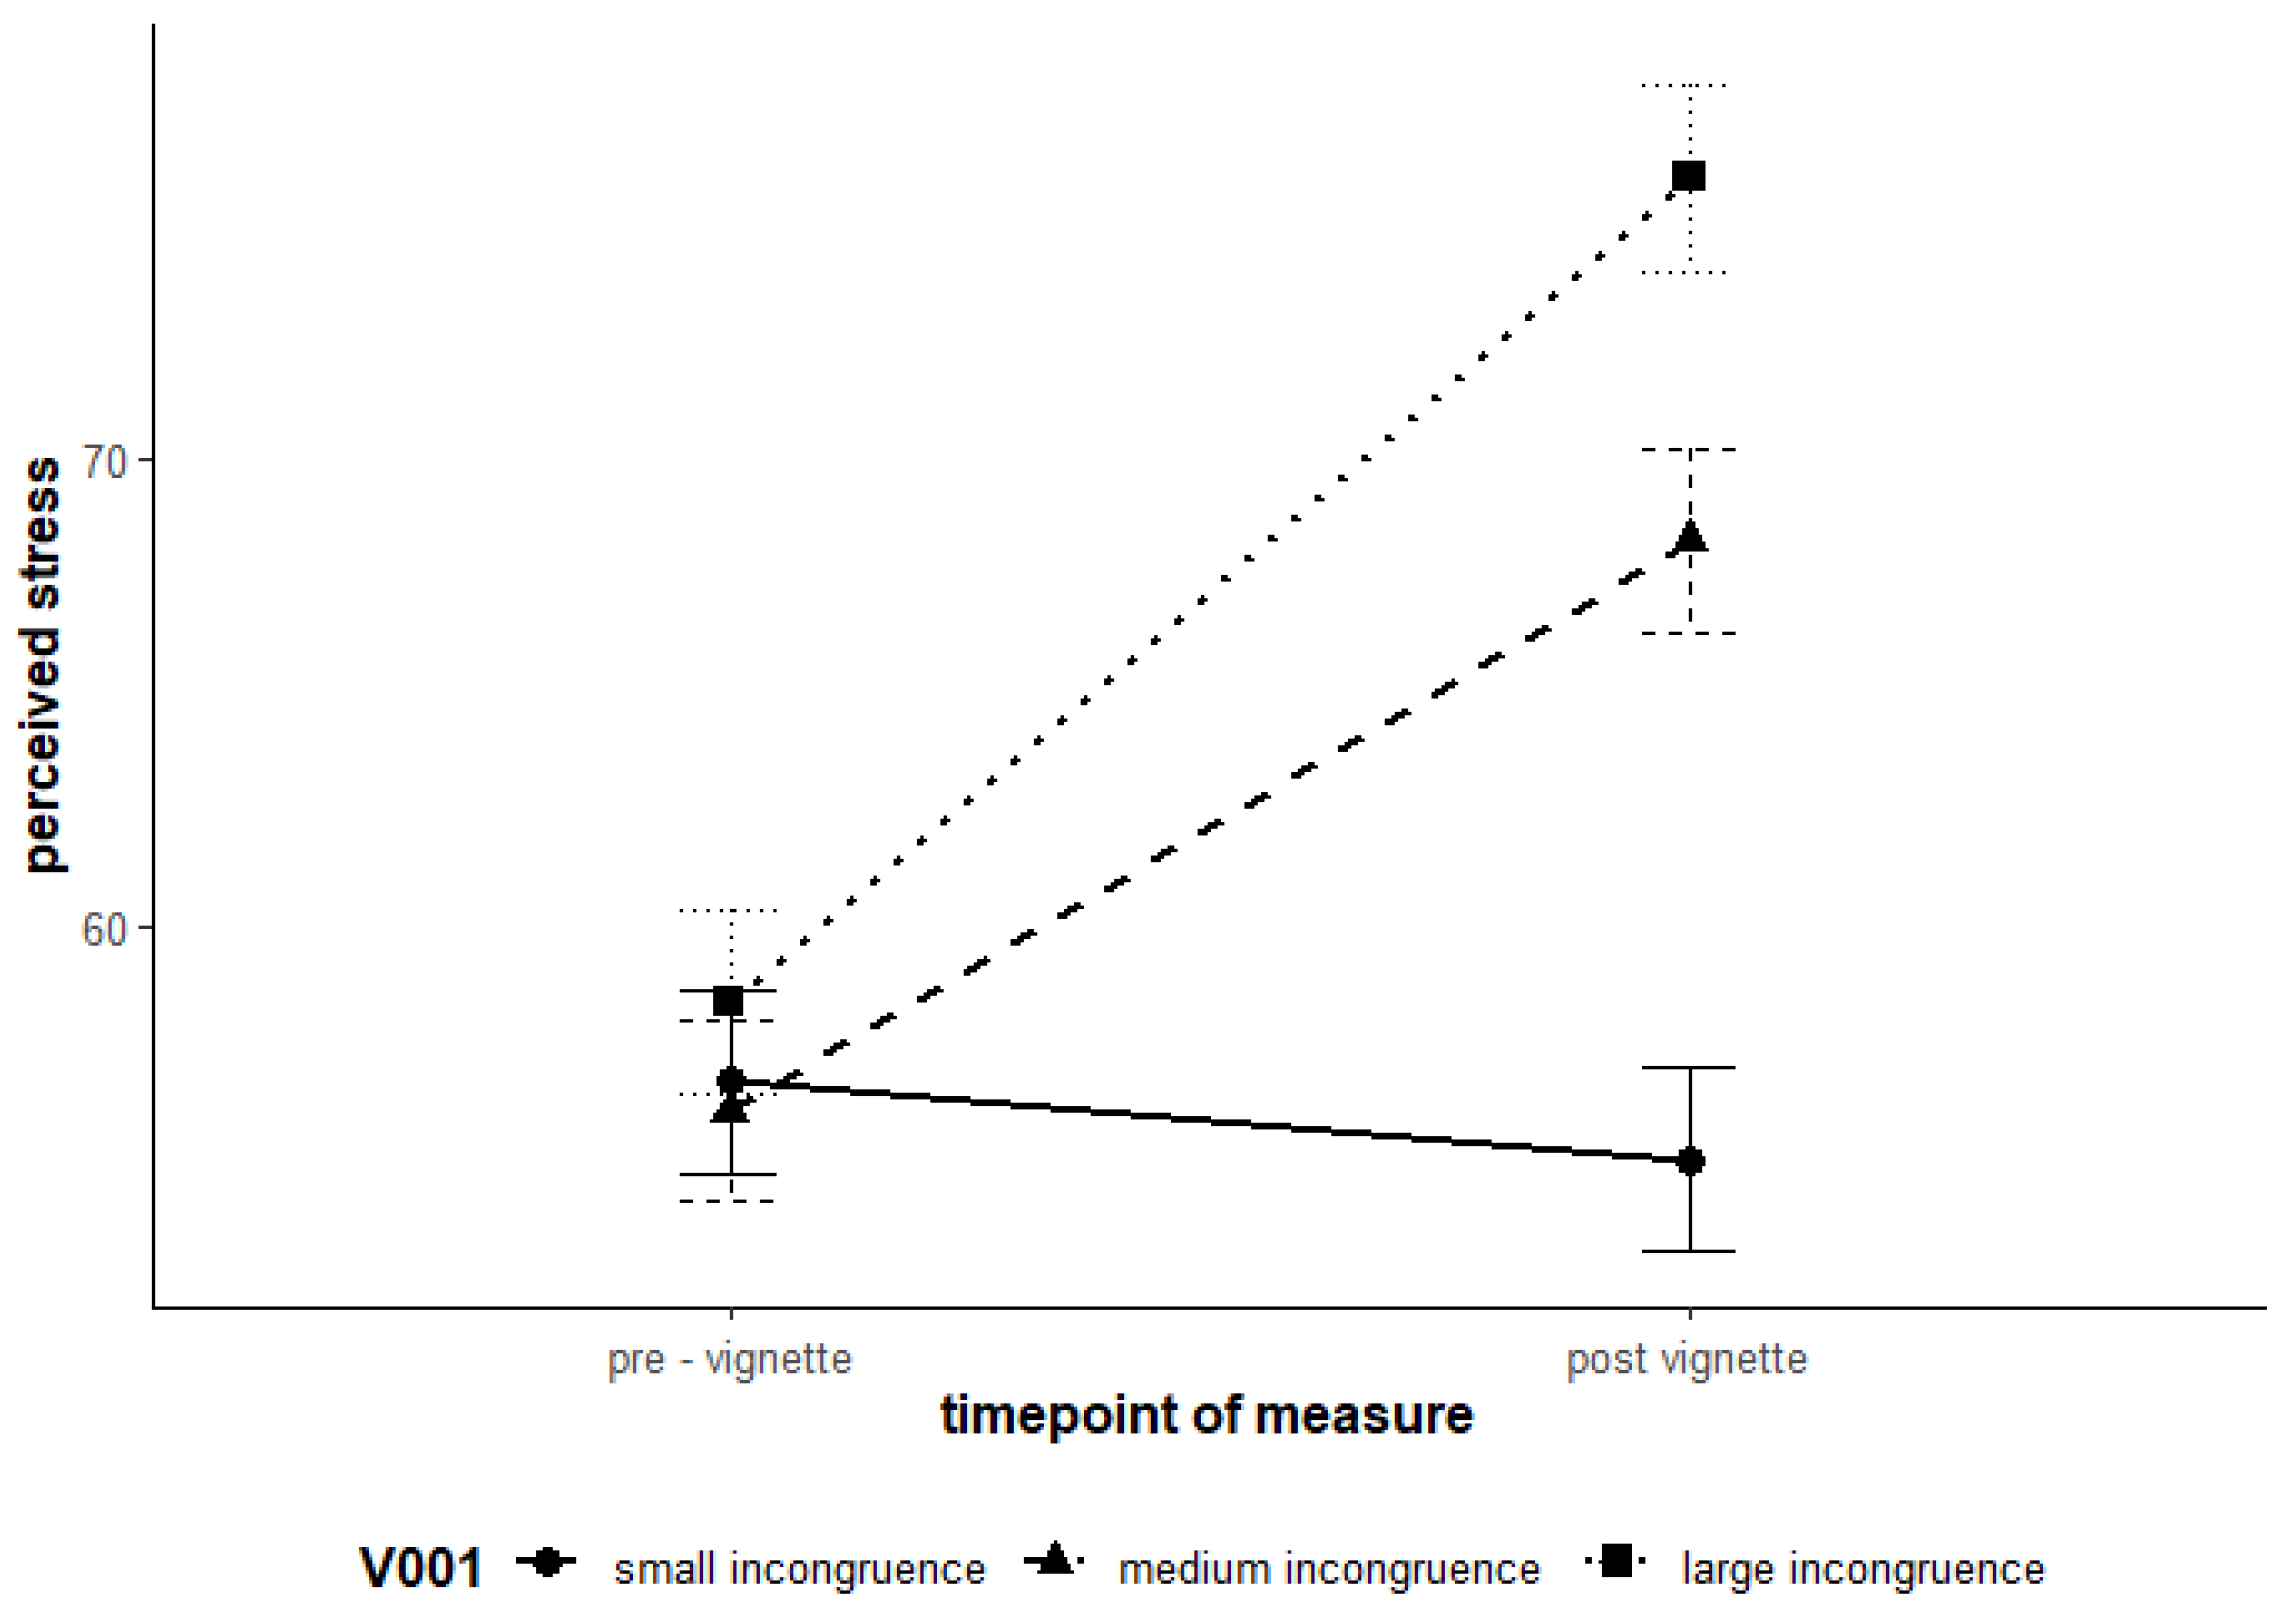
4.2.1. Failure, Stress, and Wellbeing
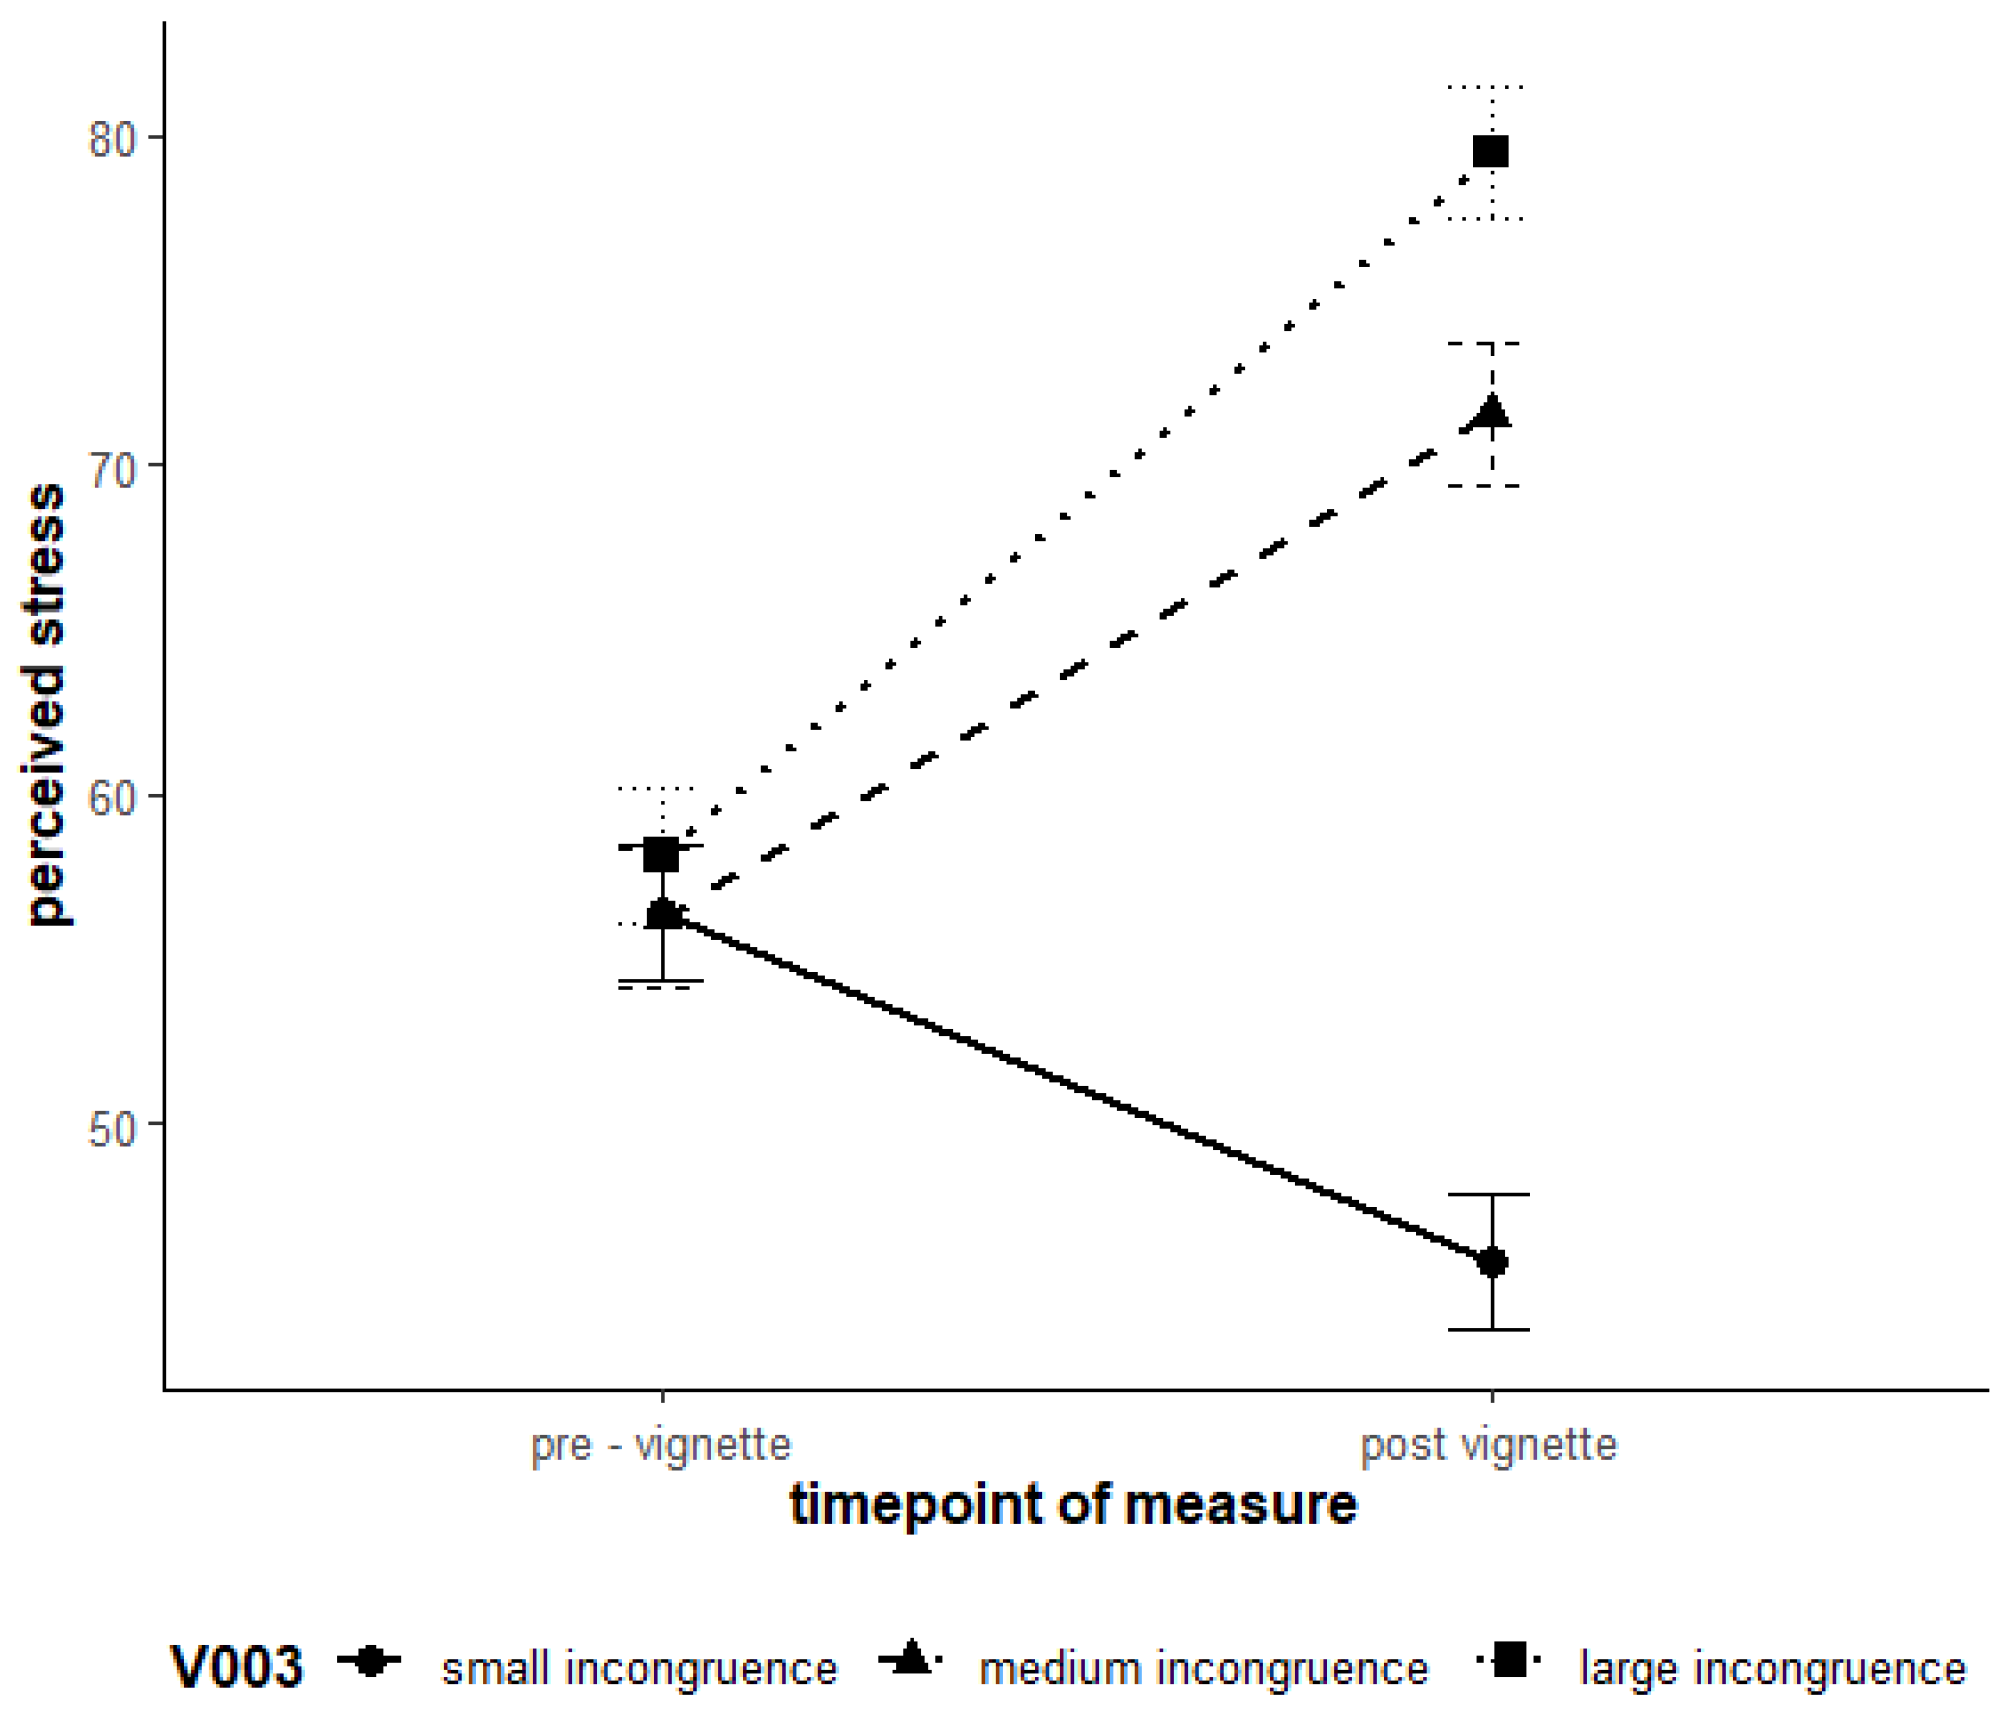
4.2.2. Devaluation, Stress, and Wellbeing
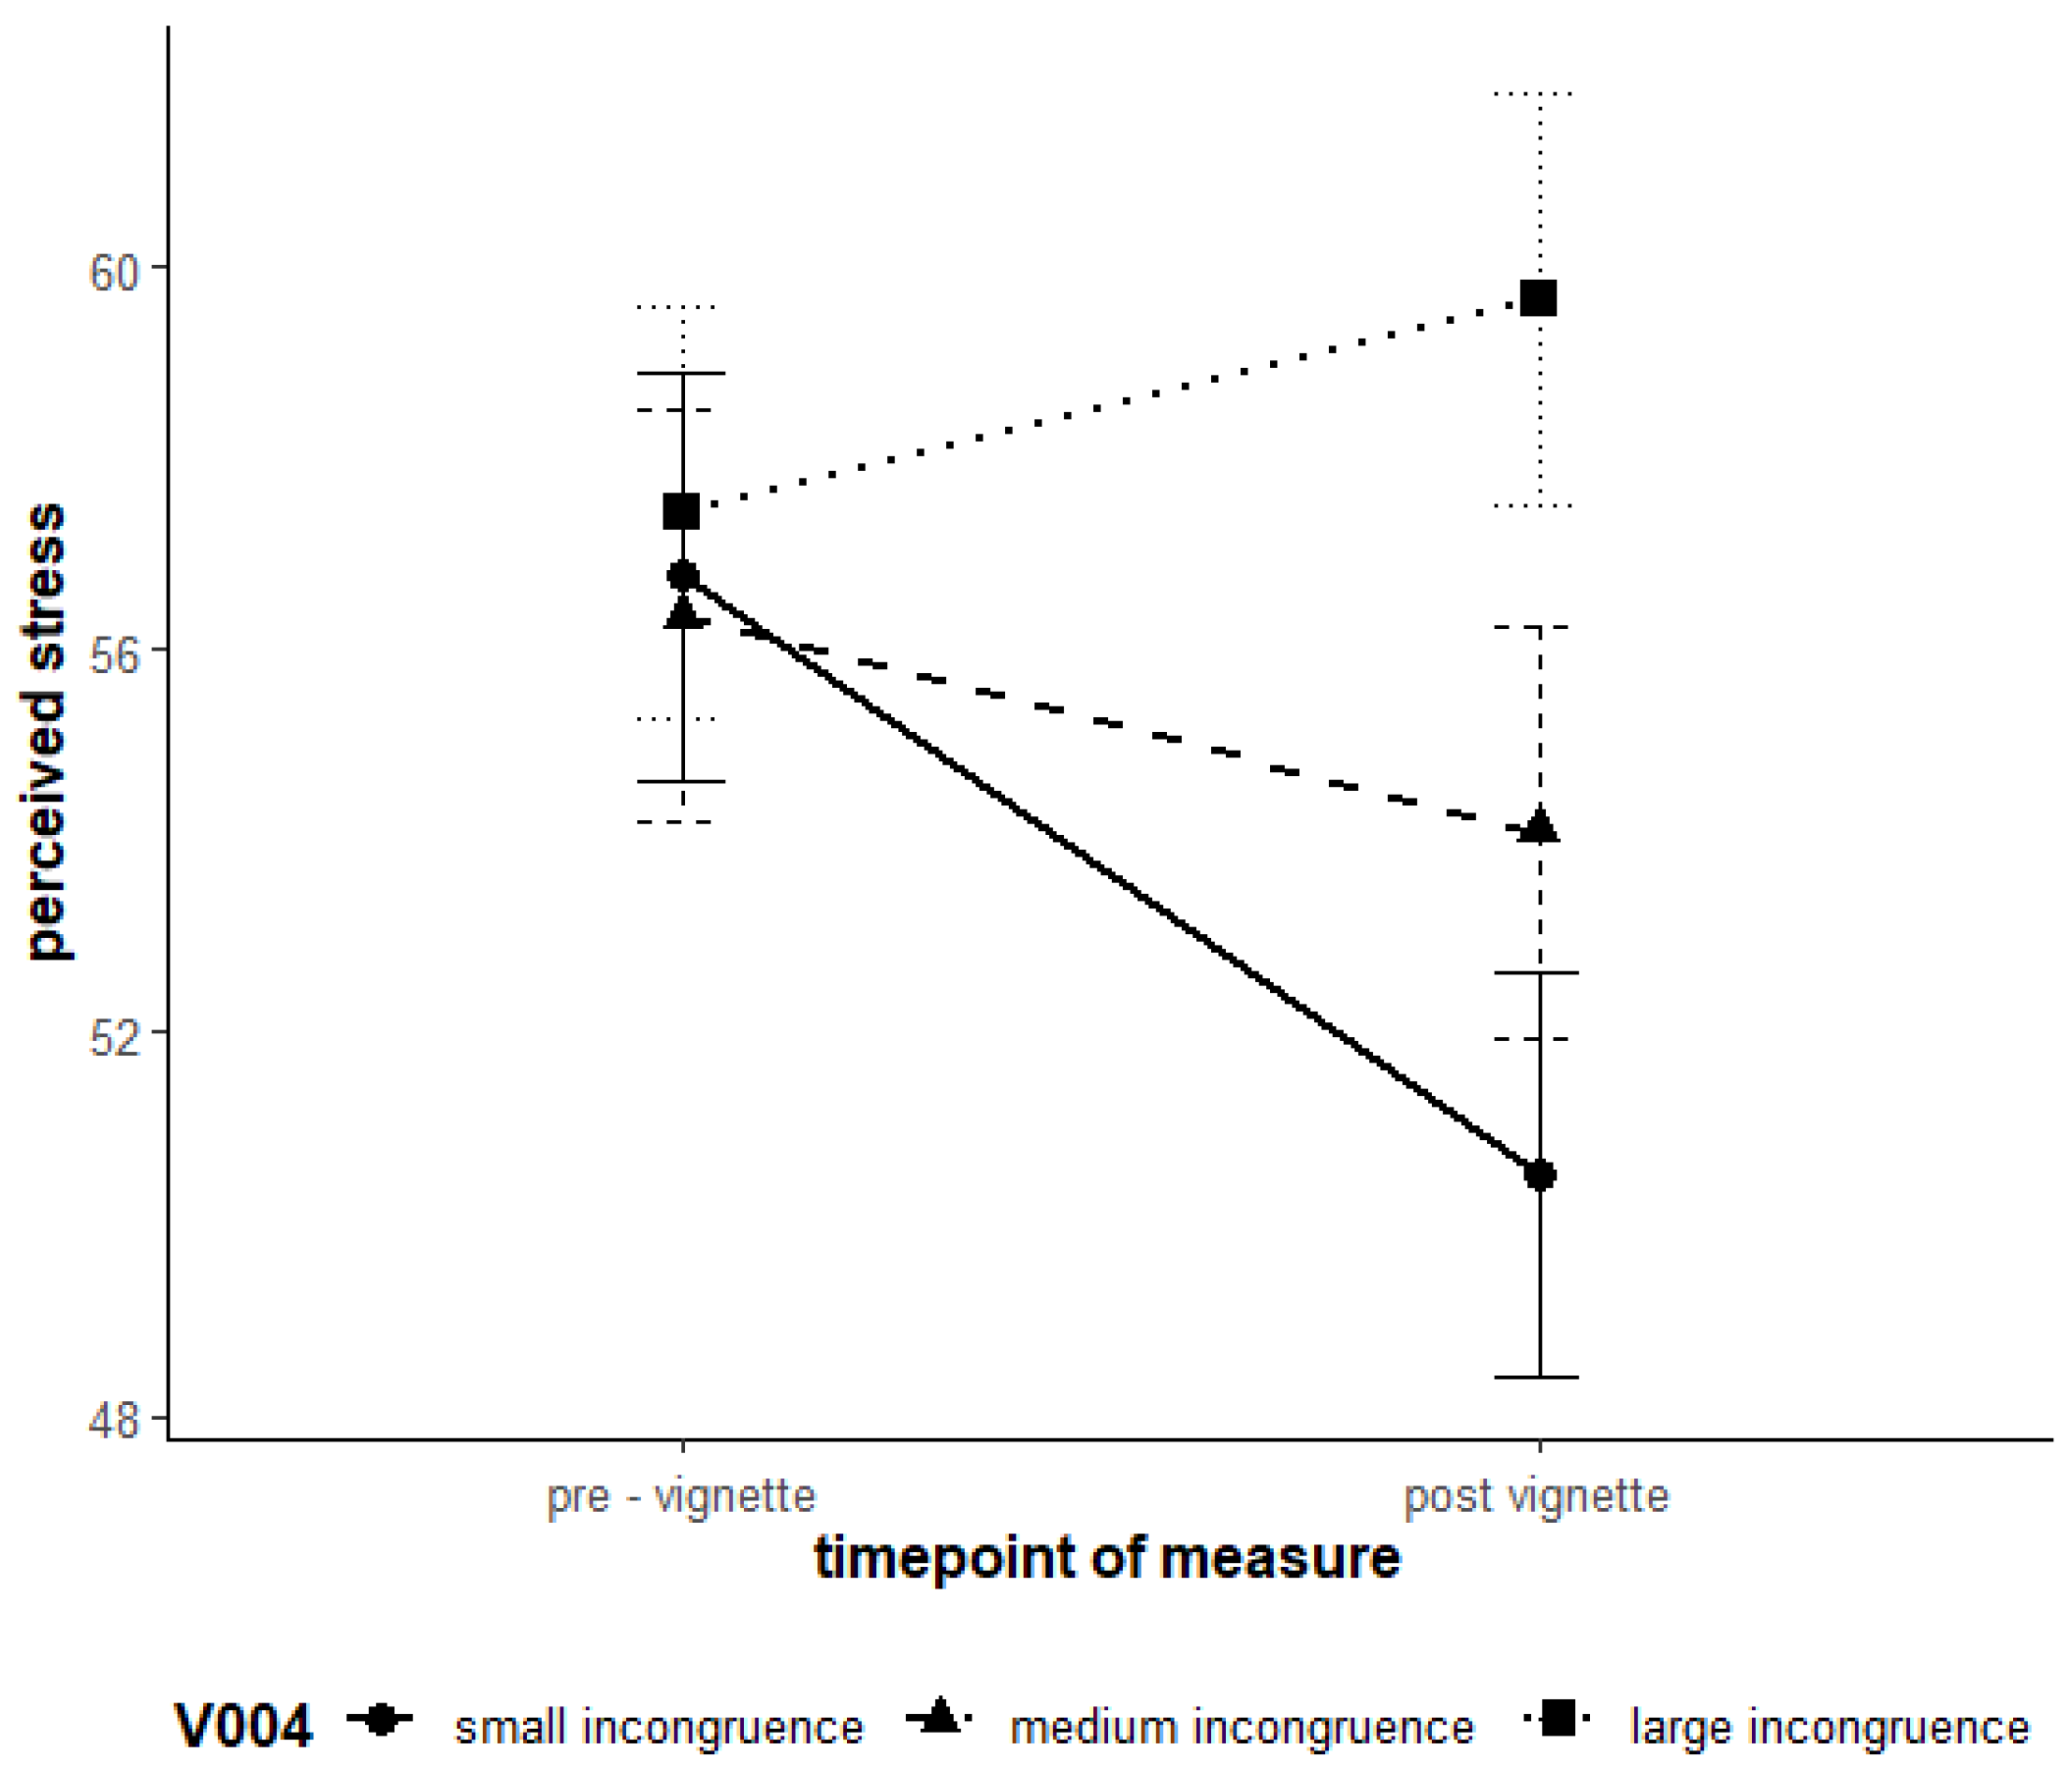
4.2.3. Dependence, Stress, and Wellbeing
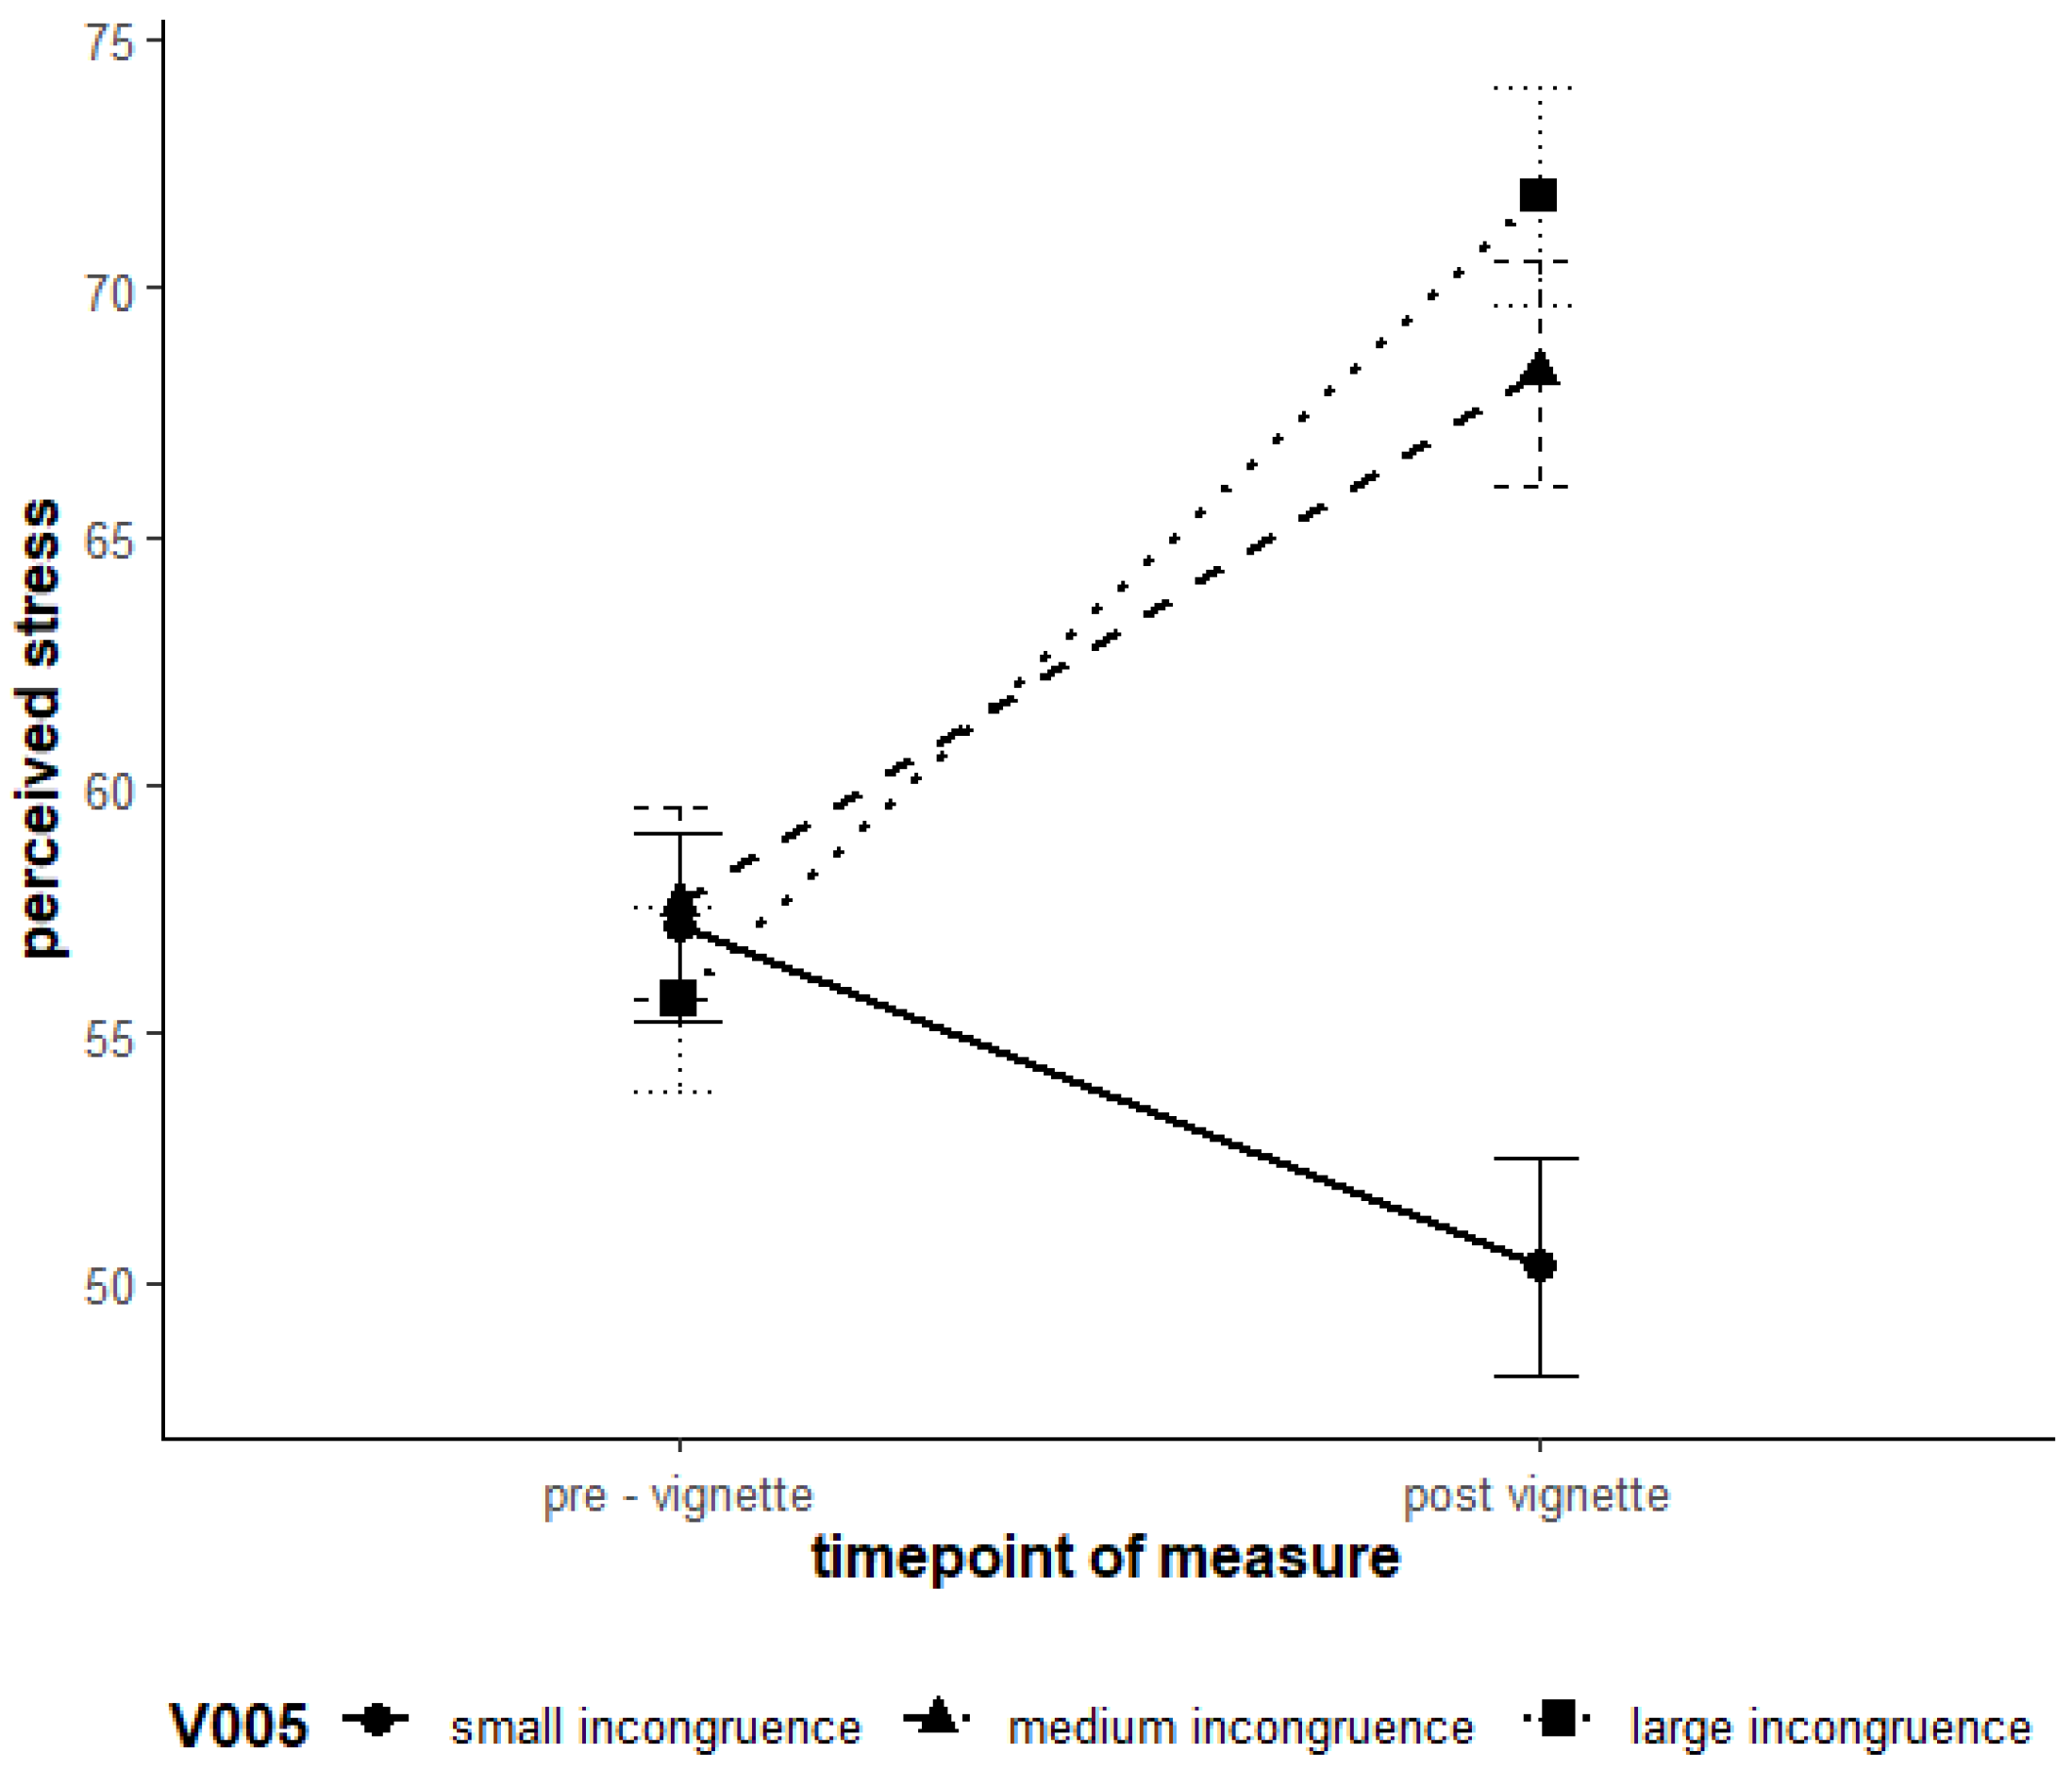
4.2.4. Loss of Control, Stress, and Wellbeing
5. Discussion
5.1. Theoretical Implications
5.2. Practical Implications
5.3. Limitations
5.4. Conclusions
Author Contributions
Funding
Institutional Review Board Statement
Informed Consent Statement
Data Availability Statement
Conflicts of Interest
Appendix A

| Avoidance Goal | Incongruence Level | Vignette Text |
|---|---|---|
| Failure | None to Low | Your task was to create an error-free and perfectly structured presentation. You created a presentation that is almost perfect but contains a minor mistake in one graphic. However, the mistake goes unnoticed. |
| Failure | Medium | Your task was to create an error-free and perfectly structured presentation. Your presentation contains several minor mistakes that are noticed and pointed out by your supervisors. You feel that perfection was not achieved. |
| Failure | High | Your task was to create an error-free and perfectly structured presentation. Your presentation is incomplete and full of errors. Your supervisors criticize the lack of diligence and the errors in your data. |
| Devaluation | None to Low | Imagine sitting at a table with your colleagues during a shared lunch break. You have engaging conversations about the weekend, exchange personal stories, and laugh together. You can contribute to most topics. You feel mostly included and appreciated. |
| Devaluation | Medium | Imagine sitting at a table with your colleagues during a shared lunch break. The conversations mainly revolve around topics that don’t interest you. You try to participate, but your contributions are often overlooked or quickly forgotten. You feel a bit left out. |
| Devaluation | High | Imagine sitting at a table with your colleagues during a shared lunch break. Your colleagues completely ignore you. They continue their conversations as if you weren’t there, and you feel isolated and excluded. When you try to participate, you’re ignored or the conversations abruptly end. |
| Dependance | None to Low | You were given the task to complete a project on your own. You need to ask a colleague for help with a minor issue, but otherwise, you complete the project independently. |
| Dependance | Medium | You were given the task to complete a project on your own. However, you rely on the help of a colleague to complete an important subtask. |
| Dependance | High | You were given the task to complete a project on your own. However, you are heavily dependent on the support of your colleagues, without which the project would not work. |
| Loss of control | Low | You have an important project pending. A small part of the project does not go as planned, but you can quickly fix the issue and get back on track. |
| Loss of control | Medium | You have an important project pending. An unforeseen issue arises that changes the timeline. You partially lose control of the project. |
| Loss of control | High | You have an important project pending. Several unforeseen problems disrupt your project, and you almost completely lose control. |
Appendix B
References
- Aguinis, H., & Bradley, K. J. (2014). Best practice recommendations for designing and implementing experimental vignette methodology studies. Organizational Research Methods, 17(4), 351–371. [Google Scholar] [CrossRef]
- Aguinis, H., Gottfredson, R. K., & Culpepper, S. A. (2013). Best-practice recommendations for estimating cross-level interaction effects using multilevel modeling. Journal of Management, 39(6), 1490–1528. [Google Scholar] [CrossRef]
- Aksu, Ç., & Ayar, D. (2023). The effects of visualization meditation on the depression, anxiety, stress and achievement motivation levels of nursing students. Nurse Education Today, 120, 105618. [Google Scholar] [CrossRef] [PubMed]
- Anderson, N. B. (1989). Racial differences in stress-induced cardiovascular reactivity and hypertension: Current status and substantive issues. Psychological Bulletin, 105(1), 89–105. [Google Scholar] [CrossRef]
- Atzmüller, C., & Steiner, P. M. (2010). Experimental vignette studies in survey research. Methodology: European Journal of Research Methods for the Behavioral and Social Sciences, 6(3), 128–138. [Google Scholar] [CrossRef]
- Berking, M., Grosse Holtforth, M., & Jacobi, C. (2003). Veränderung klinisch relevanter Ziele und Therapieerfolg: Eine Studie an Patienten während einer stationären Verhaltenstherapie [Changes in clinically relevant goals and therapy outcome: A study with inpatients undergoing cognitive behavioral therapy]. Psychotherapie, Psychosomatik, Medizinische Psychologie, 53(3–4), 171–177. [Google Scholar] [CrossRef]
- Bhui, K. S., Dinos, S., Stansfeld, S. A., & White, P. D. (2012). A synthesis of the evidence for managing stress at work: A review of the reviews reporting on anxiety, depression, and absenteeism. Journal of Environmental and Public Health, 2012(1), 515874. [Google Scholar]
- Bolger, N., & Zuckerman, A. (1995). A framework for studying personality in the stress process. Journal of Personality and Social Psychology, 69(5), 890–902. [Google Scholar] [CrossRef]
- Borst, G., & Kosslyn, S. M. (2008). Visual mental imagery and visual perception: Structural equivalence revealed by scanning processes. Memory & Cognition, 36(4), 849–862. [Google Scholar] [CrossRef]
- Boyd, N. G., Lewin, J. E., & Sager, J. K. (2009). A model of stress and coping and their influence on individual and organizational outcomes. Journal of Vocational Behavior, 75(2), 197–211. [Google Scholar]
- Carver, C. S., & Scheier, M. F. (1998). On the self-regulation of behavior. Erlbaum. [Google Scholar]
- Chen, W.-Q., Siu, O.-L., Lu, J.-F., Cooper, C. L., & Phillips, D. R. (2009). Work stress and depression: The direct and moderating effects of informal social support and coping. Stress Health, 25, 431–443. [Google Scholar] [CrossRef]
- Coats, E. J., Janoff-Bulman, R., & Alpert, N. (1996). Approach versus avoidance goals: Differences in self-evaluation and well-being. Personality and Social Psychology Bulletin, 22(10), 1057–1067. [Google Scholar] [CrossRef]
- Cohen, J. (1988). Statistical power analysis for the behavioral sciences (2nd ed.). Lawrence Erlbaum Associates. [Google Scholar]
- Cohen, J. (1992). A power primer. Psychological Bulletin, 112(1), 155–159. [Google Scholar] [CrossRef]
- Day, A. L., & Livingstone, H. A. (2003). Gender differences in perceptions of stressors and utilization of social support among university students. Canadian Journal of Behavioural Science/Revue Canadienne des Sciences du Comportement, 35(2), 73–83. [Google Scholar] [CrossRef]
- Ebert, T., Först, R., & Bipp, T. (2024). The dark and potentially bright sides of work-avoidance goal orientation. Frontiers in Organizational Psychology, 2, 1445014. [Google Scholar] [CrossRef]
- Edwards, J. (1998). Cybernetic theory of stress, coping, and well-being: Review and extension to work and family. In C. L. Cooper (Ed.), Theories of organizational stress (pp. 122–152). Oxford University Press. [Google Scholar]
- Edwards, J. R. (1992). A cybernetic theory of stress, coping, and well-being in organizations. Academy of Management Review, 17, 238–274. [Google Scholar] [CrossRef]
- Edwards, J. R. (1993). Problems with the use of profile similarity indices in the study of congruence in organizational research. Personnel Psychology, 46, 641–665. [Google Scholar] [CrossRef]
- Edwards, J. R. (1994). The study of congruence in organizational behavior research: Critique and a proposed alternative. Organizational Behavior and Human Decision Processes, 58, 51–100. [Google Scholar] [CrossRef]
- Edwards, J. R., & Van Harrison, R. (1993). Job demands and worker health: Three-dimensional reexamination of the relationship between person-environment fit and strain. Journal of Applied Psychology, 78(4), 628–648. [Google Scholar] [CrossRef]
- Elliot, A. J., Sheldon, K. M., & Church, M. A. (1997). Avoidance personal goals and subjective well-being. Personality and Social Psychology Bulletin, 23(9), 915–927. [Google Scholar] [CrossRef]
- Emmons, R. A. (1996). Striving and feeling: Personal goals and subjective well-being. In P. M. Gollwitzer, & J. A. Bargh (Eds.), The psychology of action: Linking cognition and motivation to behavior (pp. 313–337). The Guilford Press. [Google Scholar]
- Enders, C. K., & Tofighi, D. (2007). Centering predictor variables in cross-sectional multilevel models: A new look at an old issue. Psychological Methods, 12(2), 121–138. [Google Scholar] [CrossRef] [PubMed]
- Epstein, S. (1990). Cognitive-experiential self-theory. In L. A. Pervin (Ed.), Handbook of personality: Theory and research (pp. 165–192). The Guilford Press. [Google Scholar]
- Franco, M., & Trombetta, M. (2010). Cybernetic theory as a new approach to studying workers’ well-being. Croatian Economic Survey, 12(1), 163–198. Available online: https://hrcak.srce.hr/52494 (accessed on 27 April 2025).
- Fries, A., & Grawe, K. (2006). Inkonsistenz und psychische Gesundheit: Eine Metaanalyse [Inconsistency and mental health: A meta-analysis]. Zeitschrift für Psychiatrie, Psychologie und Psychotherapie, 54(2), 133–148. [Google Scholar] [CrossRef]
- Gehring, J., & Klein, G. (2015). Leben mit der Koronaren Herzkrankheit [Life with coronary heart disease]. Urban und Vogel. [Google Scholar]
- Gorges, J., Neumann, P., & Störtländer, J. C. (2022). Teachers between a rock and a hard place: Goal conflicts affect teaching motivation mediated by basic need satisfaction. Frontiers in Psychology, 13, 876521. [Google Scholar] [CrossRef]
- Graham, J. W. (2009). Missing data analysis: Making it work in the real world. Annual Review of Psychology, 60, 549–576. [Google Scholar] [CrossRef] [PubMed]
- Grawe, K. (1998). Psychologische therapie [Psychological therapy]. Hogrefe. [Google Scholar]
- Grawe, K. (2004). Neuropsychotherapie [Neuropsychotherapy]. Hogrefe. [Google Scholar]
- Grosse Holtforth, M., & Grawe, F. (2003). Der inkongruenzfragebogen (INK). Ein messinstrument zur analyse motivationaler inkongruenz [The incongruence questionnaire (INK). An instrument for the analysis of motivational incongruence]. Zeitschrift für Klinische Psychologie und Psychotherapie, 32, 315–323. [Google Scholar] [CrossRef]
- Grosse Holtforth, M., & Grawe, K. (2000). Fragebogen zur Analyse Motivationaler Schemata (FAMOS) [Questionnaire for analyzing motivational schemas (FAMOS)]. Zeitschrift für Klinische Psychologie und Psychotherapie, 29(3), 170–179. [Google Scholar]
- Grosse Holtforth, M., Grawe, K., & Castonguay, L. G. (2006). Predicting a reduction of avoidance motivation in psychotherapy: Toward the delineation of differential processes of change operating at different phases of treatment. Psychotherapy Research, 16(5), 639–644. [Google Scholar]
- Hassard, J., Teoh, K. R. H., Visockaite, G., Dewe, P., & Cox, T. (2018). The cost of work-related stress to society: A systematic review. Journal of Occupational Health Psychology, 23, 1–17. [Google Scholar] [CrossRef]
- Helton, W. S., & Näswall, K. (2015). Short stress state questionnaire: Factor structure and state change assessment. European Journal of Psychological Assessment, 31(1), 20–30. [Google Scholar] [CrossRef]
- Hobfoll, S. E. (1989). Conservation of resources: A new attempt at conceptualizing stress. American Psychologist, 44, 513–524. [Google Scholar] [CrossRef] [PubMed]
- Hobfoll, S. E. (2002). Social and psychological resources and adaptation. Review of General Psychology, 6, 307–324. [Google Scholar] [CrossRef]
- Holland, P., Cooper, B., & Sheehan, C. (2017). Employee voice, supervisor support, and engagement: The mediating role of trust. Human Resource Management, 56, 915–929. [Google Scholar] [CrossRef]
- Hox, J. J., Moerbeek, M., & van de Schoot, R. (2017). Multilevel analysis: Techniques and applications (3rd ed.). Routledge. [Google Scholar] [CrossRef]
- Huether, G. (2002). Und nichts wird fortan so sein wie bisher… Die Folgen traumatischer Kindheitserfahrungen für die weitere Hirnentwicklung [And nothing will be any longer the same as before… The impact of early traumatization on further brain development]. Analytische Kinder-und Jugendlichenpsychotherapie, 33, 461–476. [Google Scholar]
- JASP Team. (2024). JASP (Version 0.19.3) [Computer software]. JASP.
- Jex, S., & Yankelevich, M. (2008). Work stress. In J. Barling, & C. L. Cooper (Eds.), The SAGE handbook of organizational behavior: Volume I—Micro approaches (pp. 498–518). SAGE Publications Ltd. [Google Scholar] [CrossRef]
- Karasek, R. A. (1979). Job demands, job decision latitude, and mental strain: Implications for job redesign. Administrative Science Quarterly, 24(2), 285–308. [Google Scholar] [CrossRef]
- Karasek, R. A., & Theorell, T. (1990). Healthy work: Stress, productivity and the reconstruction of working life. Basic Books. [Google Scholar]
- Kavosi, Z., Ranaei Kordshouli, H., Zare Saadabadi, M., & Ghorbanian, A. (2018). The factors related to the employees’ job stress: A meta-analysis. Health Management & Information Science, 5(4), 145–151. [Google Scholar]
- Kealy, K. L. K., & Arbuthnott, K. D. (2003). Phenomenal characteristics of co-created guided imagery and autobiographical memories. Applied Cognitive Psychology, 17(7), 801–818. [Google Scholar] [CrossRef]
- Kim, K. Y., Eisenberger, R., & Baik, K. (2016). Perceived organizational support and affective commitment: Moderating influence of perceived organizational competence. Journal of Organizational Behavior, 37, 558–583. [Google Scholar] [CrossRef]
- Krohne, H., Egloff, B., Kohlmann, C.-W., & Tausch, A. (1996). Untersuchungen mit einer deutschen Version der “Positive and Negative Affect Schedule” (PANAS). Diagnostica, 42, 139–156. [Google Scholar] [CrossRef]
- Kröll, C., Doebler, P., & Nüesch, S. (2017). Meta-analytic evidence of the effectiveness of stress management at work. European Journal of Work and Organizational Psychology, 26(5), 677–693. [Google Scholar] [CrossRef]
- Lazarus, R. S. (1993). From psychological stress to the emotions: A history of changing outlooks. Annual Review of Psychology, 44, 1–21. [Google Scholar] [CrossRef] [PubMed]
- Leiner, D. J. (2024). SoSci survey (Version 3.6.12) [Computer software]. Available online: https://www.soscisurvey.de (accessed on 11 January 2025).
- Little, R. J. A. (1988). A test of missing completely at random for multivariate data with missing values. Journal of the American Statistical Association, 83(404), 1198–1202. [Google Scholar] [CrossRef]
- Lorah, J. (2018). Effect size measures for multilevel models: Definition, interpretation, and TIMSS example. Large-Scale Assessments in Education, 6(1), 8. [Google Scholar] [CrossRef]
- Meyer, I. H., Schwartz, S., & Frost, D. M. (2008). Social patterning of stress and coping: Does disadvantaged social statuses confer more stress and fewer coping resources? Social Science & Medicine, 67(3), 368–379. [Google Scholar] [CrossRef]
- Miller, G. A., Galanter, E., & Pibram, K. H. (1960). Plans and the structure of behavior. Holt. [Google Scholar]
- Nakagawa, S., & Schielzeth, H. (2013). A general and simple method for obtaining R2 from generalized linear mixed-effects models. Methods in Ecology and Evolution, 4(2), 133–142. [Google Scholar] [CrossRef]
- Nguyen, J., & Brymer, E. (2018). Nature-based guided imagery as an intervention for state anxiety. Frontiers in Psychology, 9, 1858. [Google Scholar] [CrossRef]
- Nunnally, J. C. (1967). Psychometric theory. McGraw-Hill. [Google Scholar]
- Pervin, L. A. (1989). Goal concepts in personality and social psychology. Erlbaum. [Google Scholar]
- Posit PBC. (2024). RStudio (Version 2024.09.1) [Computer software]. Posit Software.
- Powers, W. T. (1973). Behavior: The control of perception. Aldine. [Google Scholar]
- R Core Team. (2021). R: A language and environment for statistical computing. R Foundation for Statistical Computing. [Google Scholar]
- Rensing, L., Koch, M., Rippe, B., & Rippe, V. (2005). Mensch im Stress: Psyche, Körper, Moleküle [Humans under stress: Mind, body, molecules]. Springer. [Google Scholar]
- Richardson, K. M., & Rothstein, H. R. (2008). Effects of occupational stress management intervention programs: A meta-analysis. Journal of Occupational Health Psychology, 13(1), 69–93. [Google Scholar] [CrossRef] [PubMed]
- Ringgold, V., Shields, G. S., Hauck, F., Kurz, M., Schindler-Gmelch, L., Abel, L., Richer, R., Eskofier, B. M., & Rohleder, N. (2024). The Short Stress State Questionnaire in German (SSSQ-G): A multi-study validation. European Journal of Health Psychology, 31(4), 189–200. [Google Scholar] [CrossRef]
- Rossi, P. H., & Anderson, A. B. (1982). The factorial survey approach: An introduction. In P. H. Rossi, & S. L. Nock (Eds.), Measuring social judgments: The factorial survey approach (pp. 15–49). Sage Publications. [Google Scholar]
- Sakaki, M., Murayama, K., Izuma, K., Aoki, R., Yomogita, Y., Sugiura, A., Singhi, N., Matsumoto, M., & Matsumoto, K. (2024). Motivated with joy or anxiety: Does approach-avoidance goal framing elicit differential reward-network activation in the brain? Cognitive. Affective & Behavioral Neuroscience, 24(3), 469–490. [Google Scholar] [CrossRef]
- Sapolsky, R. M. (1994). Individual differences and the stress response. Seminars in Neuroscience, 6(4), 261–269. [Google Scholar] [CrossRef]
- Schmiedl, A., Schulte, E.-M., & Kauffeld, S. (2022). The demands-buffering role of perceived and received social support for perceived stress and cortisol levels. European Journal of Health Psychology, 29(4), 175–186. [Google Scholar] [CrossRef]
- Shavitt, S., Cho, Y. I., Johnson, T. P., Jiang, D., Holbrook, A., & Stavrakantonaki, M. (2016). Culture moderates the relation between perceived stress, social support, and mental and physical health. Journal of Cross-Cultural Psychology, 47(7), 956–980. [Google Scholar] [CrossRef]
- Steiner, P. M., & Atzmüller, C. (2006). Optimal design for experimental vignette methodology studies: An approach to complex experimental designs. Behavioral Research Methods, 38(2), 223–230. [Google Scholar] [CrossRef]
- Stich, J. F., Tarafdar, M., Stacey, P., & Cooper, C. L. (2019). E-mail load, workload stress and desired e-mail load: A cybernetic approach. Information Technology & People, 32(2), 430–452. [Google Scholar] [CrossRef]
- Świątkowski, W., & Dompnier, B. (2021). When pursuing bad goals for good reasons makes it even worse: A social value approach to performance-avoidance goal pursuit. Social Psychology of Education, 24(3), 653–677. [Google Scholar] [CrossRef] [PubMed]
- Tetrick, L. E., & Winslow, C. J. (2015). Workplace stress management interventions and health promotion. Annual Review of Organizational Psychology and Organizational Behavior, 2(1), 583–603. [Google Scholar] [CrossRef]
- Van der Klink, J. J., Blonk, R. W., Schene, A. H., & Van Dijk, F. J. (2001). The benefits of interventions for work-related stress. American journal of public health, 91(2), 270. [Google Scholar] [CrossRef]
- Viswesvaran, C., Sanchez, J. I., & Fisher, J. (1999). The role of social support in the process of work stress: A meta-analysis. Journal of Vocational Behavior, 54, 314–334. [Google Scholar]
- Wirtz, M. A. (Ed.). (2020). Dorsch—Lexikon der Psychologie (19, überarbeitete Auflage) [Dorsch—Encyclopedia of Psychology (19, revised edition)]. Hogrefe. Available online: https://dorsch.hogrefe.com/ (accessed on 10 May 2025).
| Correct Assignment to Avoidance Goal | Correct Assignment to the Incongruence Situation | ||||||
|---|---|---|---|---|---|---|---|
| Vignette | Count | Count in % | X2 | Count | Count in % | X2 | |
| N | 148 | 224 | |||||
| Failure | 111 | 72.9 | 277.75 *** | ||||
| G1 | 181 | 80.8 | 232.03 *** | ||||
| G2 | 157 | 70.1 | 148.56 *** | ||||
| G3 | 184 | 82.1 | 244 *** | ||||
| Devaluation | 120.3 | 81.3 | 34.51 *** | ||||
| G1 | 153 | 63.3 | 135.65 *** | ||||
| G2 | 162 | 72.3 | 153.25 *** | ||||
| G3 | 171 | 76.3 | 188.85 *** | ||||
| Dependence | 104.67 | 70.7 | 240.19 *** | ||||
| G1 | 179 | 79.9 | 221.63 *** | ||||
| G2 | 156 | 69.6 | 133.56 *** | ||||
| G3 | 152 | 67.9 | 122.82 *** | ||||
| Loss of Control | 106.3 | 71.9 | 255.82 *** | ||||
| G1 | 164 | 73.2 | 165.57 *** | ||||
| G2 | 151 | 67.4 | 121.94 *** | ||||
| G3 | 176 | 78.6 | 211.54 *** | ||||
| Nullmodel | Model A: Interaction | Model B: Random Intercept | Model C: AR(1)-Structure | R2 | |||||||||
|---|---|---|---|---|---|---|---|---|---|---|---|---|---|
| AIC | BIC | LogLik | Df | ICC | LogLik | L.Ratio | Df | LogLik | L.Ratio | Df | LogLik | ||
| Failure | 0.266 | ||||||||||||
| Failure | 7759.09 | 7759.09 | −3876.55 | 3 | −3660.23 | 432.64 *** | 14 | −3660.11 | 0.22 | 16 | −3660.23 | 0.34 | |
| Conflict Schema | 7759.09 | 7773.63 | −3876.55 | 3 | −3666.99 | 419.11 *** | 14 | −3660.11 | 13.76 | 16 | −3666.99 | 0.33 | |
| Devaluation | 0.211 | ||||||||||||
| Devaluation | 7884.824 | 7899.32 | −3939.41 | 3 | −3639.06 | 600.71 *** | 14 | −3638.87 | 0.36 | 16 | −3639.06 | 0.44 | |
| Conflict Schema | 7884.824 | 7899.32 | −3939.41 | 3 | −3638.79 | 601.24 *** | 14 | −3638.87 | 0.16 | 16 | −3638.79 | 0.44 | |
| Dependance | 0.447 | ||||||||||||
| Dependance | 7322.78 | 7337.25 | −3658.39 | 3 | −3629.04 | 58.71 *** | 14 | −3629.03 | 0.01 | 16 | −3629.04 | 0.05 | |
| Conflict Schema | 7322.78 | 7337.25 | −3658.39 | 3 | −3628.61 | 59.56 *** | 14 | −3629.03 | 0.84 | 16 | −3628.61 | 0.05 | |
| Loss of Control | 0.313 | ||||||||||||
| Loss of Control | 7574.95 | 7589.39 | −3784.47 | 3 | −3581.36 | 406.22 *** | 14 | −3575.25 | 12.22 *** | 16 | −3581.36 | 0.27 | |
| Conflict Schema | 7574.95 | 7589.39 | −3784.47 | 3 | −3582.61 | 403.72 | 14 | −3575.25 | 14.72 *** | 16 | −3582.61 | 0.34 | |
| Nullmodel | Model A: Interaction | Model B: Random Intercept | Modell C: AR(1)-Structure | R2 | |||||||||
|---|---|---|---|---|---|---|---|---|---|---|---|---|---|
| AIC | BIC | LogLik | Df | ICC | LogLik | L.Ratio | Df | LogLik | L.Ratio | Df | LogLik | ||
| Failure | 0.553 | ||||||||||||
| Failure | 6292.181 | 6306.72 | −3143.10 | 3 | −3096.66 | 92.87 *** | 14 | −3082.94 | 27.44 *** | 16 | −3096.65 | 0.10 | |
| Conflict Schema | 6292.181 | 6306.72 | −3143.10 | 3 | −3082.94 | 92.87 *** | 14 | −3079.95 | 33.41 *** | 16 | −3092.92 | 0.10 | |
| Devaluation | 0.417 | ||||||||||||
| Devaluation | 6336.932 | 6351.43 | −3165.47 | 3 | −3107.52 | 115.90 *** | 14 | −3093.70 | 27.65 *** | 16 | −3107.51 | 0.15 | |
| Conflict Schema | 6336.932 | 6351.43 | −3165.47 | 3 | −3107.52 | 115.90 *** | 14 | −3092.12 | 30.80 *** | 16 | 0.10 | ||
| Dependance | 0.556 | ||||||||||||
| Dependance | 5994.96 | 6009.43 | −2994.48 | 3 | −2986.03 | 16.90 | 14 | −2986.03 | 5.75 * | 16 | −2986.02 | 0.02 | |
| Conflict Schema | 5994.96 | 6009.41 | −2994.48 | 3 | −2986.50 | 15.95 | 14 | −2983.45 | 6.11 ** | 16 | −2986.50 | 0.02 | |
| Loss of Control | 0.381 | ||||||||||||
| Loss of Control | 6360.36 | 6374.81 | −3177.18 | 3 | −3113.15 | 128.07 *** | 14 | −3074.91 | 76.47 *** | 16 | −3113.15 | 0.13 | |
| Conflict Schema | 6360.36 | 6374.81 | −3177.18 | 3 | −3114.22 | 125.92 *** | 14 | −3078.22 | 72.00 *** | 16 | −3114.22 | 0.13 | |
| Variables | Time of Measurement 1 | Time of Measurement 2 | |||
|---|---|---|---|---|---|
| M | SD | M | SD | ||
| Dependant Variables | |||||
| SSSQ-G Failure | |||||
| G1 | 56.18 | 13.65 | 54.72 | 12.11 | |
| G2 | 56.29 | 12.62 | 68.49 | 13.19 | |
| G3 | 58.29 | 13.41 | 75.99 | 13.78 | |
| SSSQ-G Devaluation | |||||
| G1 | 56.04 | 12.69 | 45.84 | 11.18 | |
| G2 | 56.19 | 12.32 | 71.55 | 12.66 | |
| G3 | 58.28 | 14.72 | 79.66 | 14.81 | |
| SSSQ-G Dependence | |||||
| G1 | 56.74 | 13.15 | 50.45 | 12.20 | |
| G2 | 56.42 | 13.78 | 54.05 | 14.38 | |
| G3 | 57.36 | 13.17 | 59.72 | 13.78 | |
| SSSQ-G Loss of Control | |||||
| G1 | 56.99 | 13.90 | 50.29 | 13.69 | |
| G2 | 57.64 | 13.55 | 68.21 | 14.52 | |
| G3 | 55.78 | 12.53 | 71.83 | 15.58 | |
| PANAS_n Failure | |||||
| G1 | 14.57 | 6.42 | 14.75 | 6.20 | |
| G2 | 14.87 | 5.93 | 17.06 | 8.09 | |
| G3 | 16.29 | 7.42 | 18.93 | 9.61 | |
| PANAS_n Devaluation | |||||
| G1 | 14.92 | 6.45 | 12.51 | 4.48 | |
| G2 | 15.17 | 5.98 | 16.92 | 8.15 | |
| G3 | 15.47 | 7.19 | 20.07 | 10.62 | |
| PANAS_n Dependence | |||||
| G1 | 14.42 | 6.03 | 14.17 | 6.54 | |
| G2 | 15.59 | 7.15 | 15.71 | 7.42 | |
| G3 | 15.41 | 6.36 | 16.39 | 7.64 | |
| PANAS_n Loss of Control | |||||
| G1 | 14.58 | 5.77 | 14.33 | 7.12 | |
| G2 | 15.44 | 7.04 | 19.31 | 10.18 | |
| G3 | 15.40 | 6.77 | 19.52 | 10.01 | |
| Variable | Time of Measurement 1 | Time of Measurement 2 | |||
|---|---|---|---|---|---|
| M | SD | M | SD | ||
| Performance/Failure | |||||
| Failure | |||||
| G1 | 3.69 | 0.74 | 3.70 | 0.74 | |
| G2 | 3.82 | 0.68 | 3.83 | 0.68 | |
| G3 | 3.74 | 0.76 | 3.76 | 0.77 | |
| Conflict schema | |||||
| G1 | 14.20 | 4.19 | 14.24 | 4.19 | |
| G2 | 14.98 | 4.49 | 15.05 | 4.49 | |
| G3 | 14.53 | 4.45 | 14.62 | 4.48 | |
| Recognition/Devaluation | |||||
| Devaluation | |||||
| G1 | 3.84 | 0.72 | 3.84 | 0.72 | |
| G2 | 3.97 | 0.65 | 3.98 | 0.65 | |
| G3 | 3.97 | 0.75 | 3.97 | 0.75 | |
| Conflict schema | |||||
| G1 | 15.81 | 4.53 | 15.81 | 4.54 | |
| G2 | 16.62 | 4.53 | 16.71 | 4.52 | |
| G3 | 16.87 | 4.74 | 16.85 | 4.74 | |
| Independence/Dependence | |||||
| Dependence | |||||
| G1 | 4.01 | 0.70 | 52.91 | 15.29 | |
| G2 | 3.93 | 0.68 | 65.85 | 13.65 | |
| G3 | 4.06 | 0.73 | 68.11 | 15.95 | |
| Conflict schema | |||||
| G1 | 17.35 | 4.79 | 17.34 | 4.79 | |
| G2 | 16.92 | 4.36 | 16.89 | 4.37 | |
| G3 | 17.81 | 4.65 | 17.89 | 4.58 | |
| Control/Loss of Control | |||||
| Loss of control | |||||
| G1 | 2.59 | 0.89 | 2.59 | 0.89 | |
| G2 | 2.62 | 0.91 | 2.62 | 0.91 | |
| G3 | 2.62 | 0.93 | 2.62 | 0.93 | |
| Conflict schema | |||||
| G1 | 10.33 | 4.26 | 10.36 | 4.28 | |
| G2 | 10.73 | 4.45 | 10.74 | 4.43 | |
| G3 | 10.61 | 4.57 | 10.62 | 4.57 | |
| Stress | Wellbeing | |||||||||||
|---|---|---|---|---|---|---|---|---|---|---|---|---|
| Model | Value | t a | p b | df | SE c | f2 | Value | t a | p b | df | SE c | f2 |
| Intercept | 35.190 | 13.43 | <0.001 | 471 | 0.99 | 14.727 | 28.766 | <0.001 | 471 | 0.52 | ||
| Failure d | 6.160 | 8.70 | <0.001 | 471 | 1.33 | 0.22 | 1.736 | 2.520 | 0.012 | 471 | 0.70 | 0.06 |
| Conflict Schema d | 1.660 | 4.32 | <0.001 | 471 | 0.24 | 0.19 | 0.341 | 2.795 | 0.02 | 471 | 0.14 | 0.07 |
| Time of Measurement (1) | 13.782 | 8.903 | <0.001 | 457 | 1.57 | 0.10 | 1.995 | 2.565 | 0.006 | 457 | 0.75 | 0.006 |
| Group (2) | 19.252 | 8.903 | <0.001 | 457 | 1.57 | 0.10 | 2.458 | 3.147 | 0.002 | 457 | 0.78 | 0.006 |
| Group (3) | 3.065 | 1.869 | 0.163 | 457 | 2.19 | 0.784 | 0.718 | 0.498 | 457 | 1.16 | ||
| Time of Measurement × Group (2) e | 1.380 | 0.663 | 0.507 | 457 | 2.08 | −0.278 | −0.268 | 0.777 | 457 | 0.98 | ||
| Time of Measurement × Group (3) e | 0.715 | 1.994 | 0.05 | 457 | 0.36 | 0.229 | 0.179 | 0.184 | 457 | 0.18 | ||
| Stress | Wellbeing | |||||||||||
|---|---|---|---|---|---|---|---|---|---|---|---|---|
| Model | Value | t a | p b | df | SE c | f2 | Value | t a | p b | df | SE c | f2 |
| Intercept | 56.765 | 52.620 | <0.001 | 456 | 1.08 | 14.434 | 27.553 | <0.001 | 456 | 0.48 | ||
| Devaluation d | −0.133 | −0.086 | 0.931 | 456 | 1.54 | 0.02 | −0.637 | −0.847 | 0.398 | 456 | 0.89 | 0.003 |
| Conflict Schema d | −0.221 | −0.979 | 0.328 | 456 | 0.22 | 0.02 | −0.186 | −1.690 | 0.195 | 456 | 0.14 | 0.006 |
| Time of Measurement (1) | 3.989 | 2.513 | <0.001 | 451 | 1.59 | 0.02 | 0.365 | 0.489 | 0.628 | 451 | 0.71 | 0.001 |
| Group (2) | 8.467 | 5.333 | <0.001 | 451 | 1.59 | 0.02 | 1.186 | 1.585 | 0.091 | 451 | 0.69 | 0.001 |
| Group (3) | 3.272 | 1.419 | 0.157 | 451 | 2.31 | 0.584 | 0.539 | 0.590 | 451 | 1.08 | ||
| Time of Measurement × Group (2) e | 4.204 | 1.891 | 0.059 | 451 | 2.22 | 1.028 | 0.984 | 0.326 | 451 | 1.04 | ||
| Time of Measurement × Group (3) e | 0.313 | 0.8995 | 0.369 | 451 | 0.35 | 0.001 | 0.009 | 0.994 | 451 | 0.18 | ||
| Stress | Wellbeing | |||||||||||
|---|---|---|---|---|---|---|---|---|---|---|---|---|
| Model | Value | t a | p b | df | SE c | f2 | Value | t a | p b | df | SE c | f2 |
| Intercept | 56.765 | 52.620 | <0.001 | 456 | 1.08 | 14.434 | 27.553 | <0.001 | 456 | 0.48 | ||
| Dependence d | −0.133 | −0.086 | 0.931 | 456 | 1.54 | 0.02 | −0.637 | −0.847 | 0.398 | 456 | 0.89 | 0.003 |
| Conflict Schema d | −0.221 | −0.979 | 0.328 | 456 | 0.22 | 0.02 | −0.186 | −1.690 | 0.195 | 456 | 0.14 | 0.006 |
| Time of Measurement (1) | 3.989 | 2.513 | <0.001 | 451 | 1.59 | 0.02 | 0.365 | 0.489 | 0.628 | 451 | 0.71 | 0.001 |
| Group (2) | 8.467 | 5.333 | <0.001 | 451 | 1.59 | 0.02 | 1.186 | 1.585 | 0.091 | 451 | 0.69 | 0.001 |
| Group (3) | 3.272 | 1.419 | 0.157 | 451 | 2.31 | 0.584 | 0.539 | 0.590 | 451 | 1.08 | ||
| Time of Measurement × Group (2) e | 4.204 | 1.891 | 0.059 | 451 | 2.22 | 1.028 | 0.984 | 0.326 | 451 | 1.04 | ||
| Time of Measurement × Group (3) e | 0.313 | 0.8995 | 0.369 | 451 | 0.35 | 0.001 | 0.009 | 0.994 | 451 | 0.18 | ||
| Stress | Wellbeing | |||||||||||
|---|---|---|---|---|---|---|---|---|---|---|---|---|
| Model | Value | t a | p b | df | SE c | f2 | Value | t a | p b | df | SE c | f2 |
| Intercept | 57.160 | 54.723 | <0.001 | 456 | 0.98 | 0.30 | 14.726 | 29.319 | <0.001 | 456 | 0.43 | |
| Loss of Control d | 7.768 | 7.134 | <0.001 | 456 | 1.14 | 0.30 | 2.779 | 4.949 | <0.001 | 456 | 0.56 | 0.08 |
| Conflict Schema d | 1.596 | 6.967 | <0.001 | 456 | 0.25 | 0.559 | 4.733 | <0.001 | 456 | 0.12 | 0.08 | |
| Time of Measurement (1) | 17.513 | 10.642 | <0.001 | 443 | 1.65 | 0.14 | 4.174 | 4.177 | <0.001 | 456 | 0.92 | 0.02 |
| Group (2) | 22.974 | 14.203 | <0.001 | 443 | 1.63 | 0.14 | 4.515 | 4.602 | <0.001 | 456 | 0.95 | 0.02 |
| Group (3) | 1.643 | 0.898 | 0.399 | 443 | 1.94 | 4.167 | 4.180 | 0.087 | 443 | 1.21 | ||
| Time of Measurement × Group (2) e | −0.404 | −0.227 | 0.820 | 443 | 1.78 | 4.487 | 4.583 | 0.817 | 443 | 1.14 | ||
| Time of Measurement × Group (3) e | 0.462 | 1.216 | 0.225 | 443 | 0.43 | 0.441 | 1.919 | 0.109 | 443 | 0.27 | ||
Disclaimer/Publisher’s Note: The statements, opinions and data contained in all publications are solely those of the individual author(s) and contributor(s) and not of MDPI and/or the editor(s). MDPI and/or the editor(s) disclaim responsibility for any injury to people or property resulting from any ideas, methods, instructions or products referred to in the content. |
© 2025 by the authors. Published by MDPI on behalf of the University Association of Education and Psychology. Licensee MDPI, Basel, Switzerland. This article is an open access article distributed under the terms and conditions of the Creative Commons Attribution (CC BY) license (https://creativecommons.org/licenses/by/4.0/).
Share and Cite
Gschneidner, T.; Kortsch, T. The Hidden Cost of High Aspirations: Examining the Stress-Enhancing Effect of Motivational Goals Using Vignette Methodology. Eur. J. Investig. Health Psychol. Educ. 2025, 15, 128. https://doi.org/10.3390/ejihpe15070128
Gschneidner T, Kortsch T. The Hidden Cost of High Aspirations: Examining the Stress-Enhancing Effect of Motivational Goals Using Vignette Methodology. European Journal of Investigation in Health, Psychology and Education. 2025; 15(7):128. https://doi.org/10.3390/ejihpe15070128
Chicago/Turabian StyleGschneidner, Tamara, and Timo Kortsch. 2025. "The Hidden Cost of High Aspirations: Examining the Stress-Enhancing Effect of Motivational Goals Using Vignette Methodology" European Journal of Investigation in Health, Psychology and Education 15, no. 7: 128. https://doi.org/10.3390/ejihpe15070128
APA StyleGschneidner, T., & Kortsch, T. (2025). The Hidden Cost of High Aspirations: Examining the Stress-Enhancing Effect of Motivational Goals Using Vignette Methodology. European Journal of Investigation in Health, Psychology and Education, 15(7), 128. https://doi.org/10.3390/ejihpe15070128