


A Bayesian Structural Equation Model to Predict Quality of Life in European Older Adults

Abstract
1. Introduction
2. Materials and Methods
2.1. Data and Participants
2.2. Measures
2.3. Statistical Analysis
3. Results
4. Discussion
Supplementary Materials
Author Contributions
Funding
Institutional Review Board Statement
Informed Consent Statement
Data Availability Statement
Acknowledgments
Conflicts of Interest
Abbreviations
| QoL | Quality of life |
References
- Acock, A. C. (2014). A gentle introduction to stata (4th ed.). Stata Press. [Google Scholar]
- Bandari, R., Khankeh, H. R., Shahboulaghi, F. M., Ebadi, A., Keshtkar, A. A., & Montazeri, A. (2019). Defining loneliness in older adults: Protocol for a systematic review. Systematic Reviews, 8, 4–9. [Google Scholar] [CrossRef]
- Belenguer-Varea, A., Avellana-Zaragoza, J. A., Inglés, M., Cunha-Pérez, C., Cuesta-Peredo, D., Borrás, C., Viña, J., & Tarazona-Santabalbina, F. J. (2023). Effect of familial longevity on frailty and sarcopenia: A case-control study. International Journal of Environmental Research and Public Health, 20(2), 1534. [Google Scholar] [CrossRef]
- Bergmann, M., Scherpenzeel, A., & Börsch-Supan, A. (Eds.). (2019). SHARE wave 7 methodology: Panel innovations and life histories. MEA, Max Planck Institute for Social Law and Social Policy. [Google Scholar]
- Bonanni, R., Gino Grillo, S., Cariati, I., Tranquillo, L., Iundusi, R., Gasbarra, E., Tancredi, V., & Tarantino, U. (2023). Osteosarcopenia and pain: Do we have a way out? Biomedicines, 11(5), 1285. [Google Scholar] [CrossRef]
- Borrat-Besson, C., Ryser, V.-A., & Gonçalves, J. (2015). An evaluation of the CASP-12 scale used in the Survey of Ageing and Retirement in Europe (SHARE) to measure quality of life among people aged 50+. FORS Working Paper Series, Paper 2015-4. FORS. Available online: https://forscenter.ch/wp-content/uploads/2018/07/fors_wps_2015-04_borrat-besson.pdf (accessed on 15 May 2022).
- Börsch-Supan, A., Brandt, M., Hunkler, C., Kneip, T., Korbmacher, J., Malter, F., Schaan, B., Stuck, S., & Zuber, S. (2013). Data resource profile: The survey of health, ageing and retirement in Europe (SHARE). International Journal of Epidemiology, 42, 992–1001. [Google Scholar] [CrossRef]
- Carrasco, P. M., Crespo, D., Rubio, C., & Montenegro-Peña, M. (2022). Loneliness in the elderly: Association with health variables, pain, and cognitive performance. A population-based study. Clínica y Salud, 33(2), 51–58. [Google Scholar] [CrossRef]
- Cesari, M., Marzetti, E., Canevelli, M., & Guaraldi, G. (2017). Geriatric syndromes: How to treat. Virulence, 8(5), 577–585. [Google Scholar] [CrossRef]
- Chan, W. C. H., Kwan, C. W., Chi, I., & Chong, A. M. L. (2014). The impact of loneliness on the relationship between depression and pain of Hong Kong Chinese terminally ill patients. Journal of Palliative Medicine, 17, 527–532. [Google Scholar] [CrossRef]
- Chen, M. Z., Wong, M. W. K., Lim, J. Y., & Merchant, R. A. (2021). Frailty and quality of life in older adults with metabolic syndrome—Findings from the healthy older people everyday (HOPE) study. The Journal of Nutrition, Health & Aging, 25(5), 637–644. [Google Scholar] [CrossRef]
- Chiou, J. H., Liu, L. K., Lee, W. J., Peng, L. N., & Chen, L. K. (2018). What factors mediate the inter-relationship between frailty and pain in cognitively and functionally sound older adults? A prospective longitudinal ageing cohort study in Taiwan. BMJ Open, 8, e018716. [Google Scholar]
- Choi, J., & Levy, R. (2017). Markov chain monte carlo estimation methods for structural equation modeling: A comparison of subject-level data and moment-level data approaches. Biometrics & Biostatistics International Journal, 6(5), 463–474. [Google Scholar] [CrossRef]
- Conacher, A. (2017). Scottish public health network social isolation & loneliness: What is the Scope for public health action? Alison McCann Phil Mackie. [Google Scholar]
- De Luca, V., Femminella, G. D., Leonardini, L., Patumi, L., Palummeri, E., Roba, I., Aronni, W., Toccoli, S., Sforzin, S., Denisi, F., Basso, A. M., Ruatta, M., Obbia, P., Rizzo, A., Borgioli, M., Eccher, C., Farina, R., Conforti, D., Mercurio, L., … Illario, M. (2023). Digital health service for identification of frailty risk factors in community-dwelling older adults: The SUNFRAIL+ study protocol. International Journal of Environmental Research and Public Health, 20(5), 3861. [Google Scholar] [CrossRef]
- Depaoli, S. (2021). Bayesian structural equation modeling. The Guilford Press. [Google Scholar]
- Eurostat. (2020). Ageing Europe—Looking at the lives of older people in the EU. Publications Office of the European Union. [Google Scholar]
- Eurostat. (2023). Demography of Europe. Publications Office of the European Union. [Google Scholar]
- Farrugia, M., Erickson, K., Wendel, E., Platek, M. E., Ji, W., Attwood, K., Ma, S. J., Gu, F., Singh, A. K., & Ray, A. D. (2021). Change in physical performance correlates with decline in quality of life and frailty status in head and neck cancer patients undergoing radiation with and without chemotherapy. Cancers, 13(7), 1638. [Google Scholar] [CrossRef] [PubMed]
- Fekete, M., Patyán, L., Hüse, L., Huszti, E., & Takács, P. (2022). Differences of subjective well-being in European long-term care regimes. European Journal of Mental Health, 17(1), 5–14. [Google Scholar] [CrossRef]
- Frias-Goytia, G. L., Lojo-Seoane, C., Mallo, S. C., Nieto-Vieites, A., Juncos-Rabadán, O., & Pereiro, A. X. (2024). A systematic review of quality of life (QoL) studies using the CASP scale in older adults. Quality of Life Research, 33(11), 2915–2927. [Google Scholar] [CrossRef] [PubMed]
- Giddens, A. (1990). The consequences of modernity. Polity Press. [Google Scholar]
- Giné-Garriga, M. J., Jerez-Roig, J., Coll-Planas, L., Skelton, D. A., Inzitari, M., Booth, J., & Souza, D. L. (2020). Is loneliness a predictor of the modern geriatric giants? Analysis from the survey of health, ageing, and retirement in Europe. Maturitas, 144, 93–101. [Google Scholar] [CrossRef]
- Gould, C. E., Carlson, C., Alfaro, A. J., Chick, C. F., Bruce, M. L., & Forman-Hoffman, V. L. (2021). Changes in quality of life and loneliness among middle-aged and older adults participating in therapist-guided digital mental health intervention. Frontiers in Public Health, 9, 746904. [Google Scholar] [CrossRef]
- Guerriero, F., & Reid, M. C. (2020). Linking persistent pain and frailty in older adults. Pain Medicine, 21, 61–66. [Google Scholar]
- Hamren, K., Chungkham, H. S., & Hyde, M. (2015). Religion, spirituality, social support and quality of life: Measurement and predictors CASP-12 (v2) amongst older Ethiopians living in Addis Ababa. Aging & Mental Health, 19(7), 610–621. [Google Scholar] [CrossRef]
- Hoogendijk, E. O., Suanet, B., Dent, E., Deeg, D. J., & Aartsen, M. J. (2016). Adverse effects of frailty on social functioning in older adults: Results from the longitudinal aging study amsterdam. Maturitas, 83, 45–50. [Google Scholar] [CrossRef]
- Hughes, M. E., Waite, L. J., Hawkley, L. C., & Cacioppo, J. T. (2004). A short scale for measuring loneliness in large surveys: Results from two population-based studies. Research on Aging, 26, 655–672. [Google Scholar] [CrossRef]
- Hyde, M., Wiggins, R. D., Higgs, P., & Blane, D. B. (2003). A measure of quality of life in early old age: The theory, development and properties of a needs satisfaction model (CASP-19). Aging & Mental Health, 7(3), 186–194. [Google Scholar] [CrossRef]
- Iglesias-López, E., García-Isidoro, S., & Castellanos-Sánchez, V. O. (2021). COVID-19 pandemic: Pain, quality of life and impact on public health in the confinement in Spain. Annals of Palliative Medicine, 10, 4338–4353. [Google Scholar] [CrossRef] [PubMed]
- Inouye, S. K., Studenski, S., Tinetti, M. E., & Kuchel, G. A. (2007). Geriatric syndromes: Clinical, research, and policy implications of a core geriatric concept: (See editorial comments by Dr. William Hazzard on pp 794–796). Journal of the American Geriatrics Society, 55(5), 780–791. [Google Scholar] [CrossRef] [PubMed]
- Jenkins, N., Welstead, M., Stirland, L., Hoogendijk, E. O., Armstrong, J., Robitaille, A., & Muñiz-Terrera, G. (2023). Frailty trajectories and associated factors in the years prior to death: Evidence from 14 countries in the Survey of Health, Aging and Retirement in Europe. BMC Geriatrics, 23(1), 49. [Google Scholar] [CrossRef]
- Kahana, E., & Kahana, B. (2003). Contextualizing successful aging: New directions in an age-old search. In R. Settersten, Jr. (Ed.), Invitation to the life course (pp. 225–255). Baywood. [Google Scholar]
- Kahana, E., Kahana, B., & Lee, J. E. (2014). Proactive approaches to successful aging: One clear path through the forest. Gerontology, 60, 466–474. [Google Scholar] [CrossRef]
- Kahana, E., Kelley-Moore, J., & Kahana, B. (2012). Proactive aging: A longitudinal study of stress, resources, agency, and well-being in late life. Aging & Mental Health, 16(4), 438–451. [Google Scholar] [CrossRef]
- Kaplan, D., & Depaoli, S. (2012). Bayesian structural equation modeling. In R. H. Hoyle (Ed.), Handbook of structural equation modeling (pp. 650–673). The Guilford Press. [Google Scholar]
- Karcioglu, O., Topacoglu, H., Dikme, O., & Dikme, O. (2018). A systematic review of the pain scales in adults: Which to use? The American Journal of Emergency Medicine, 36(4), 707–714. [Google Scholar] [CrossRef]
- Kaye, A. D., Baluch, A., & Scott, J. T. (2010). Pain management in the elderly population: A review. The Ochsner Journal, 10, 179–187. [Google Scholar]
- Kerry, M. J. (2018). Bifactor model of the CASP-12’s general factor for measuring quality of life in older patients. Journal of Patient-Reported Outcomes, 2(1), 57. [Google Scholar] [CrossRef]
- Lee, H., Chong, J., Jung, H. W., Baek, J. Y., Lee, E., & Jang, I. Y. (2021). Association of the FRAIL scale with geriatric syndromes and health-related outcomes in Korean older adults. Annals of Geriatric Medicine and Research, 25, 79–85. [Google Scholar] [CrossRef]
- Lee, S. Y., & Song, X. Y. (2004). Evaluation of the bayesian and maximum likelihood approaches in analyzing structural equation models with small sample sizes. Multivariate Behavioral Research, 39, 653–686. [Google Scholar] [PubMed]
- Li, B., Li, W., Bi, J., Meng, Q., & Fei, J. (2016). Predicting factors associated with frailty in aged patients with bone-arthrosis pain in the clinic. The Physician and Sports Medicine, 44, 391–396. [Google Scholar] [CrossRef]
- Lin, T., Zhao, Y., Xia, X., Ge, N., & Yue, J. (2020). Association between frailty and chronic pain among older adults: A systematic review and meta-analysis. European Geriatric Medicine, 11(6), 945–959. [Google Scholar] [CrossRef] [PubMed]
- Marttinen, M. K., Kautiainen, H., Haanpää, M., Pohjankoski, H., Vuorimaa, H., Hintikka, J., & Kauppi, M. J. (2019). Pain-related factors in older adults. Scandinavian Journal of Pain, 9, 987. [Google Scholar] [CrossRef]
- Muthén, B. O., & Asparouhov, T. (2012). Bayesian structural equation modeling: A more flexible representation of substantive theory. Psychological Methods, 17, 313–335. [Google Scholar]
- Muthén, L. K., & Muthén, B. O. (2017). Mplus: Statistical analysis with latent variables: User’s guide (8th ed.). Muthén & Muthén. [Google Scholar]
- Newman-Norlund, R., Newman-Norlund, S., Sayers, S., McLain, A. C., Riccardi, N., & Fridriksson, J. (2022). Effects of social isolation on quality of life in elderly adults. PLoS ONE, 17(11), e0276590. [Google Scholar] [CrossRef]
- Oliver, A., Sentandreu-Mañó, T., Tomás, J. M., Fernández, I., & Sancho, P. (2021). Quality of life in european older adults of share wave 7: Comparing the old and the oldest-old. Journal of Clinical Medicine, 10(13), 2850. [Google Scholar] [CrossRef]
- Otones, P., García, E., & Pedraz, A. (2019). Chronic pain and frailty in community-dwelling older adults: A systematic review. Pain Management Nurses, 20, 309–315. [Google Scholar]
- Patrick, B. C., Skinner, E. U., & Connell, J. P. (1993). What motivate schildren’ sbehaviour and emotion in theacademic domain? Journal of Personality and Social Psychology, 65, 781–791. [Google Scholar]
- Petretto, D. R., Pili, R., Gaviano, L., & Zuddas, C. (2016). Envejecimiento activo y de éxito o saludable: Una breve historia de modelos conceptuales. Revista Española de Geriatría y Gerontología, 51, 229–241. [Google Scholar] [CrossRef]
- Pérez-Rojo, G., Martín, N., Noriega, C., & López, J. (2018). Psychometric properties of the CASP-12 in a Spanish older community dwelling sample. Aging & Mental Health, 22(5), 700–708. [Google Scholar] [CrossRef]
- Prell, T., Wientzek, R., & Schönenberg, A. (2023). Self-management of geriatric syndromes—An observational study. BMC Geriatrics, 23, 731. [Google Scholar] [CrossRef]
- Richards, T. A., Oman, D., DiMartino, A., & Kotwal, A. A. (2024). A Technology-based intervention impacts quality of life for low-income older adults by reducing loneliness and improving healthcare self-efficacy and self-rated health. Journal of Applied Gerontology, 44(5), 825–837. [Google Scholar] [CrossRef] [PubMed]
- Rodríguez-Blázquez, C., Ribeiro, O., Ayala, A., Teixeira, L., Araújo, L., & Forjaz, M. J. (2020). Psychometric properties of the CASP-12 scale in Portugal: An analysis using SHARE data. International Journal of Environmental Research and Public Health, 17(18), 6610. [Google Scholar] [CrossRef]
- Romero-Ortuño, R. (2011). El Instrumento de Fragilidad para atención primaria de la encuesta de salud, envejecimiento y jubilación en europa (SHARE-FI): Resultados de la muestra española. Revista Española de Geriatría y Gerontología, 46, 243–249. [Google Scholar]
- Russell, D., Peplau, L. A., & Cutrona, C. E. (1980). The Revised UCLA loneliness scale: Concurrent and discriminant validity evidence. Journal of Personality and Social Psychology, 39, 472–480. [Google Scholar]
- Salaffi, F., Sarzi-Puttini, P., & Atzeni, F. (2015). How to measure chronic pain: New concepts. Best Practice & Research Clinical Rheumatology, 29(1), 164–186. [Google Scholar] [CrossRef]
- Santos-Eggimann, B., Cuénoud, P., Spagnoli, J., & Junod, J. (2009). Prevalence of frailty in middle-aged and older community-dwelling Europeans living in 10 countries. Journal of Gerontology series A, 64, 675–681. [Google Scholar]
- Saraiva, M. D., Suzuki, G. S., Lin, S. M., de Andrade, D. C., Jacob-Filho, W., & Suemoto, C. K. (2018). Persistent pain is a risk factor for frailty: A systematic review and meta-analysis from prospective longitudinal studies. Age and Ageing, 47, 785–793. [Google Scholar]
- SHARE-ERIC. (2024). Survey of health, ageing and retirement in europe (SHARE) wave 8: COVID-19 Survey 1. Release version: 9.0.0. SHARE-ERIC. Data set. [Google Scholar] [CrossRef]
- Sim, J., Bartlam, B., & Bernard, M. (2011). The CASP-19 as a measure of quality of life in old age: Evaluation of its use in a retirement community. Quality of Life Research, 20, 997–1004. [Google Scholar] [CrossRef]
- Smith, T. O., Dainty, J. R., Williamson, E., & Martin, K. R. (2019). Association between musculoskeletal pain with social isolation and loneliness: Analysis of the English longitudinal study of ageing. British Journal of Pain, 13, 82–90. [Google Scholar] [CrossRef] [PubMed]
- Song, X., & Lee, S. (2012). Basic and advanced bayesian structural equation modeling: With applications in the medical and behavioral sciences. John Wiley. [Google Scholar] [CrossRef]
- Towers, A., Yeung, P., Stevenson, B., Stephens, C., & Alpass, F. (2015). Quality of life in indigenous and non-indigenous older adults: Assessing the CASP-12 factor structure and identifying a brief CASP-3. Quality of Life Research, 24, 193–203. [Google Scholar] [CrossRef] [PubMed]
- Turner, B. (1995). Aging and identity. Some reflectionson the somatization of the self. In M. Featherstone, & A. Wernick (Eds.), Images of aging (pp. 245–260). Routledge. [Google Scholar]
- UN-Population. (2020). World population ageing highlights. October 2020. Available online: https://www.un.org/development/desa/pd/ (accessed on 22 May 2022).
- Vestjens, L., Cramm, J. M., & Nieboer, A. P. (2018). The influence of quality of primary care on productive interactions among community-living frail older persons and their general practitioners and practice nurses. International Journal of Integrated Care, 18(s2), 107. [Google Scholar] [CrossRef]
- Wang, S., Zhao, M., Shi, Y., Zhang, M., Ying, J., Li, H., Li, Y., Xing, Z., Zhang, H., & Sun, J. (2021). Associations of frailty, loneliness and the quality of life of empty nesters: A cross-sectional study in rural areas. International Journal of Nursing Practice, 25, e12947. [Google Scholar] [CrossRef]
- Wood, B. M., Nicholas, M. K., Blyth, F., Asghari, A., & Gibson, S. (2010). Assessing pain in older people with persistent pain: The NRS is valid but only provides part of the picture. The Journal of Pain, 11(12), 1259–1266. [Google Scholar] [CrossRef]
- Woolford, S. J., Sohan, O., Dennison, E. M., Cooper, C., & Patel, H. P. (2020). Approaches to the diagnosis and prevention of frailty. Aging Clinical and Experimental Research, 32(9), 1629–1637. [Google Scholar] [CrossRef]
- World Health Organization. (2024). Ageing and health. Available online: https://www.who.int/news-room/fact-sheets/detail/ageing-and-health (accessed on 22 May 2022).
- Wu, S. Y., Hsu, L. L., Hsu, C. C., Hsieh, T. J., Su, S. C., Peng, Y. W., Guo, T., Kang, Y., & Pan, W. H. (2018). Dietary education with customised dishware and food supplements can reduce frailty and improve mental well-being in elderly people: A single-blind randomized controlled study. Asia Pacific Journal of Clinical Nutrition, 7, 1018–1030. [Google Scholar] [CrossRef]
- Yu, R., Tong, C., Ho, F., & Woo, J. (2020). Effects of a multicomponent frailty prevention program in prefrail community-dwelling older persons: A randomized controlled trial. Journal of the American Medical Directors Association, 21(2), 294.e1–294.e10. [Google Scholar] [CrossRef]
- Zapata-Lamana, R., Poblete-Valderrama, F., Ledezma-Dames, A., Pavón-León, P., Leiva, A. M., Fuentes-Alvarez, M. T., Cigarroa, I., & Parra-Rizo, M. A. (2022). Health, functional ability, and environmental quality as predictors of life satisfaction in physically active older adults. Social Sciences, 11(6), 265. [Google Scholar] [CrossRef]

| Factor | Indicator | Range | Factor Loading | S.D. | C.I. | |||
|---|---|---|---|---|---|---|---|---|
| Control | 1 | 1–4 | 2.42 | 2 | 0.99 | 0.658 | 0.003 | 0.652, 0.664 |
| 2 | 1–4 | 2.76 | 3 | 0.96 | 0.693 | 0.003 | 0.687, 0.699 | |
| 3 | 1–4 | 3.10 | 3 | 0.96 | 0.678 | 0.003 | 0.672, 0.684 | |
| Autonomy | 1 | 1–4 | 3.15 | 3 | 0.88 | 0.501 | 0.004 | 0.494, 0.509 |
| 2 | 1–4 | 3.14 | 3 | 0.95 | 0.169 | 0.005 | 0.160, 0.179 | |
| 3 | 1–4 | 2.61 | 3 | 1.14 | 0.390 | 0.004 | 0.381, 0.399 | |
| Pleasure | 1 | 1–4 | 3.45 | 4 | 0.73 | 0.698 | 0.003 | 0.692, 0.704 |
| 2 | 1–4 | 3.45 | 4 | 0.70 | 0.732 | 0.003 | 0.727, 0.738 | |
| 3 | 1–4 | 3.35 | 4 | 0.72 | 0.569 | 0.003 | 0.562, 0.575 | |
| Self-realization | 1 | 1–4 | 2.99 | 3 | 0.86 | 0.747 | 0.002 | 0.743, 0.752 |
| 2 | 1–4 | 2.97 | 3 | 0.88 | 0.780 | 0.002 | 0.776, 0.784 | |
| 3 | 1–4 | 2.92 | 3 | 0.87 | 0.797 | 0.002 | 0.793, 0.801 | |
| Frailty | Activity | 1–4 | 3.29 | 4 | 1.06 | 0.359 | 0.009 | 0.341, 0.376 |
| Appetite | 0–1 | 0.11 | 0 | 0.31 | 0.518 | 0.008 | 0.503, 0.534 | |
| Fatigue | 0–1 | 0.37 | 0 | 0.48 | −0.455 | 0.005 | −0.464, −0.446 | |
| Strength | 1–98 | 31.54 | 30 | 10.87 | 0.643 | 0.004 | 0.634, 0.651 | |
| Slowness | 0–1 | 0.22 | 0 | 0.41 | −0.595 | 0.007 | −0.608, −0.580 | |
| Pain | 5 drugs | 0–1 | 0.32 | 0 | 0.46 | 0.504 | 0.005 | 0.493, 0.514 |
| Drugs for pain | 0–2 | 0.33 | 0 | 0.63 | 0.493 | 0.005 | 0.483, 0.503 | |
| Loneliness | 1 | 1–3 | 1.42 | 1 | 0.66 | 0.606 | 0.007 | 0.593, 0.620 |
| 2 | 1–3 | 1.33 | 1 | 0.58 | 0.780 | 0.005 | 0.770, 0.790 | |
| 3 | 1–3 | 1.25 | 1 | 0.52 | 0.798 | 0.005 | 0.788, 0.808 |
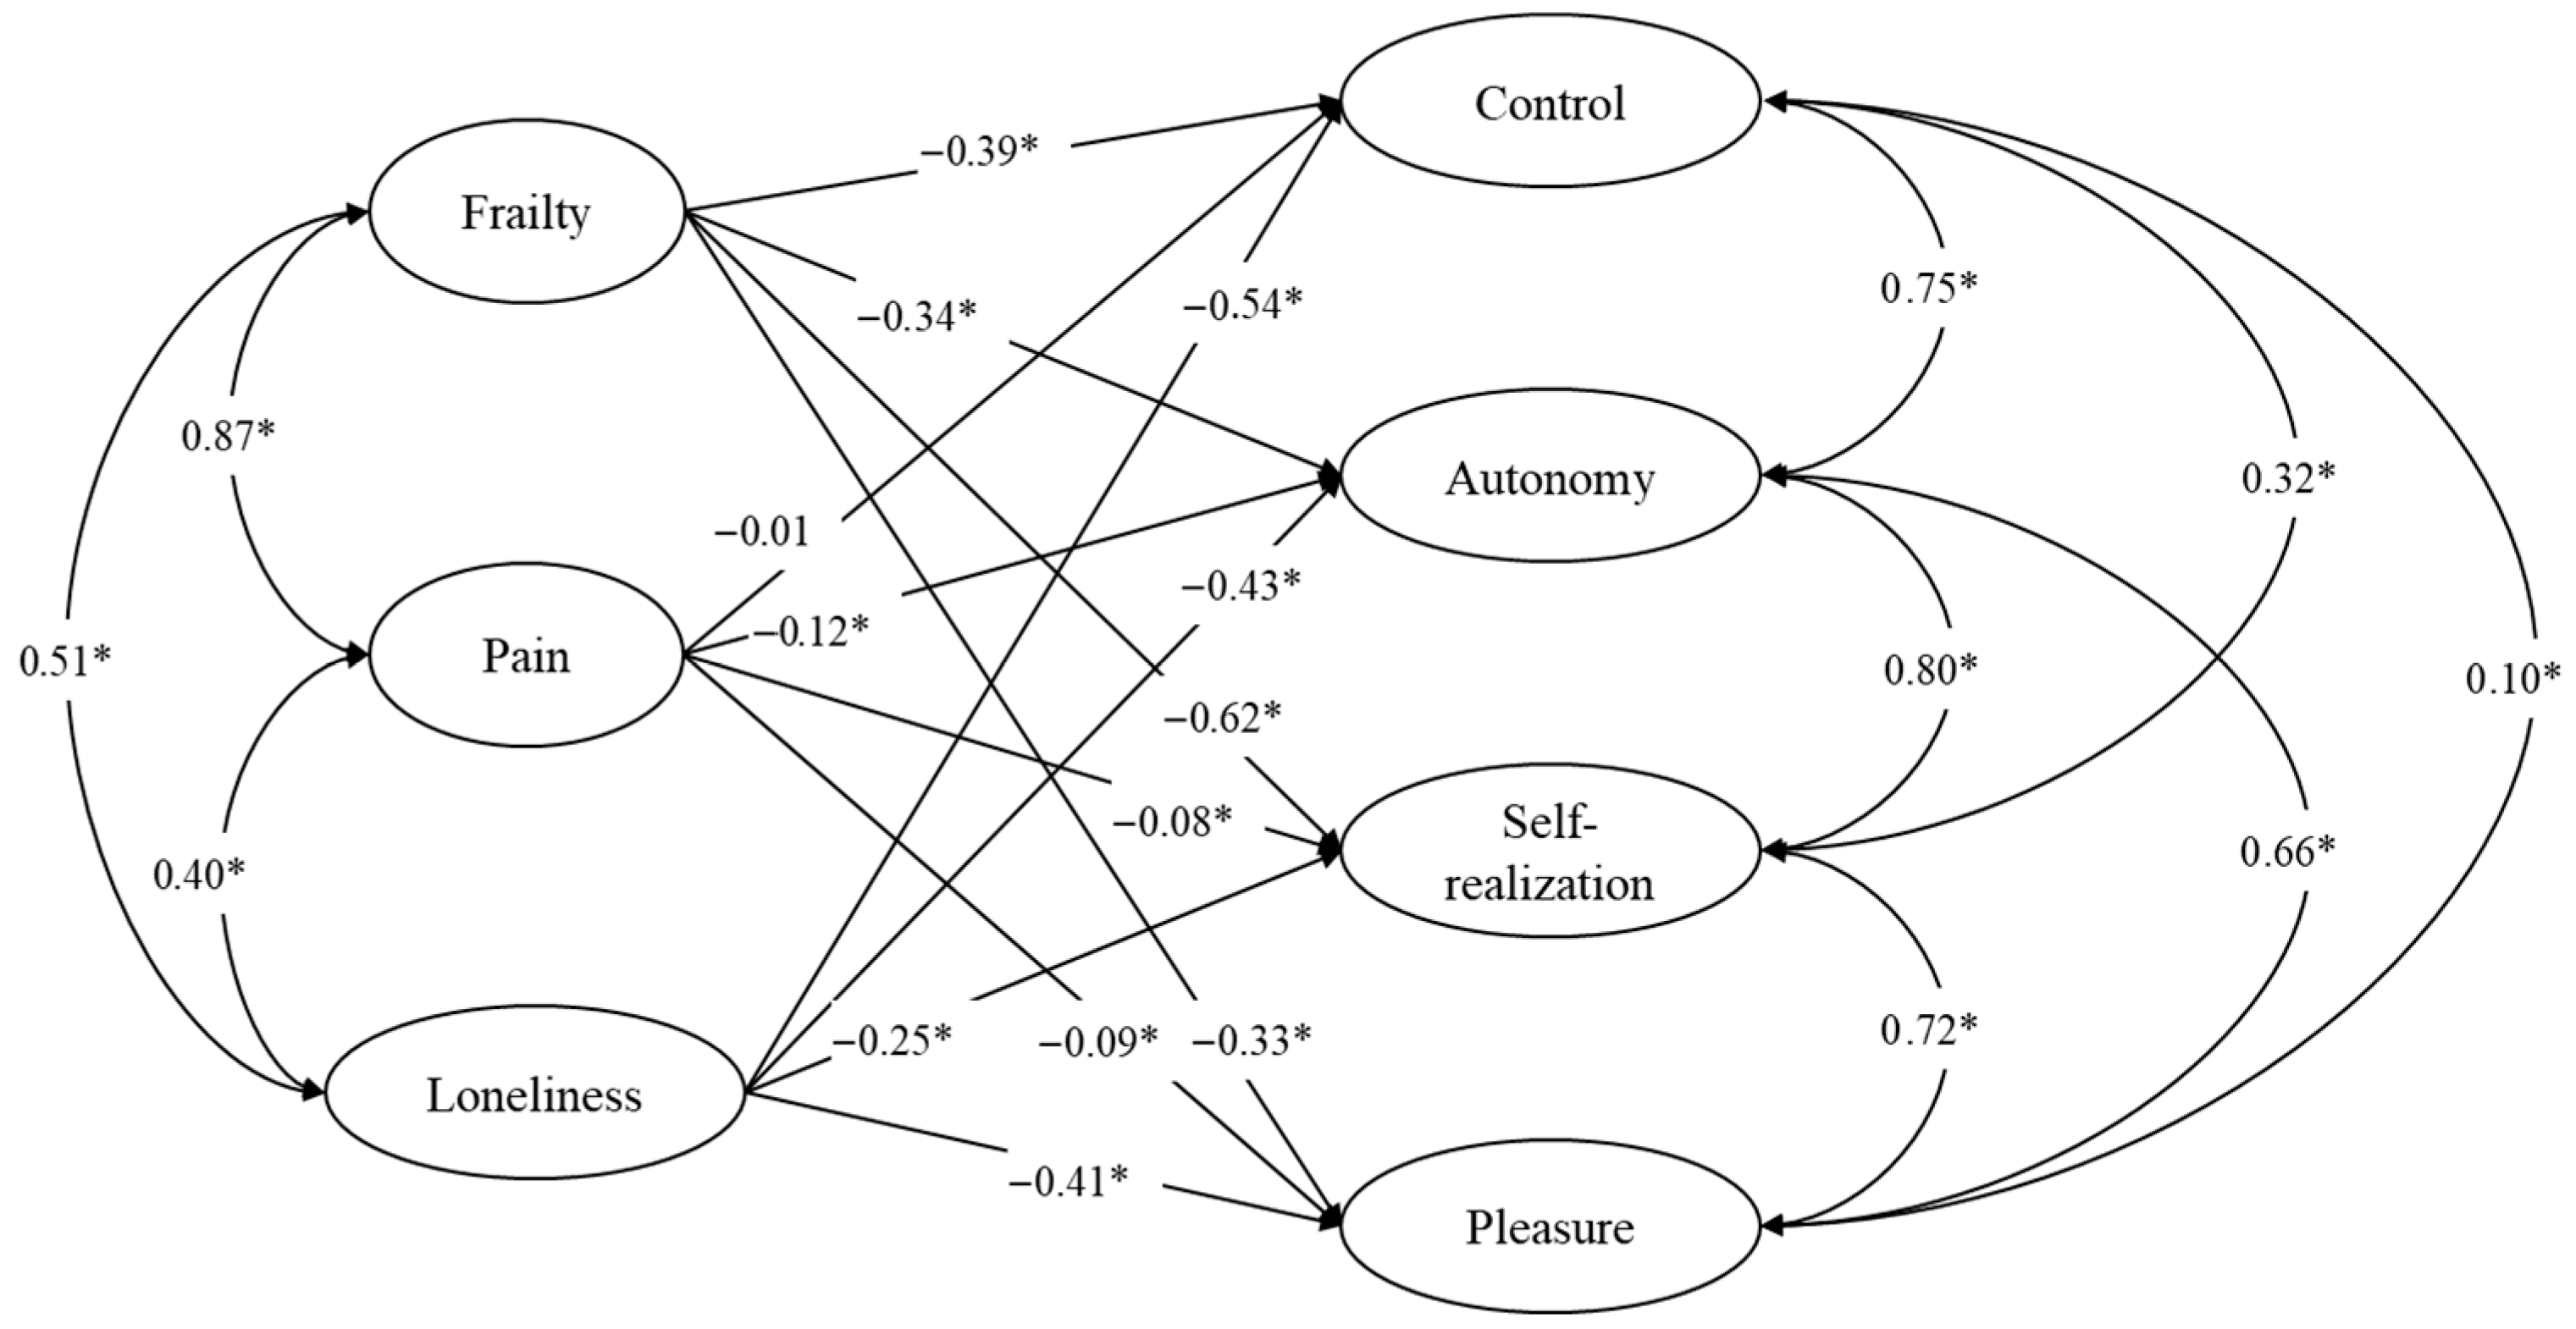
| Dependent Variables | Predictors | β | S.D. | p-Value | C.I. |
|---|---|---|---|---|---|
| Control | Frailty | −0.387 | 0.039 | 0.000 | −0.464, −0.313 |
| Pain | −0.013 | 0.038 | 0.367 | −0.085, 0.064 | |
| Loneliness | −0.537 | 0.011 | 0.000 | −0.559, −0.515 | |
| Autonomy | Frailty | −0.345 | 0.051 | 0.000 | −0.448, −0.247 |
| Pain | −0.118 | 0.049 | 0.010 | −0.211, −0.019 | |
| Loneliness | −0.431 | 0.017 | 0.000 | −0.465, −0.397 | |
| Pleasure | Frailty | −0.336 | 0.039 | 0.000 | −0.415, −0.262 |
| Pain | 0.089 | 0.038 | 0.007 | 0.018, 0.166 | |
| Loneliness | −0.407 | 0.013 | 0.000 | −0.432, −0.382 | |
| Self-realization | Frailty | −0.622 | 0.038 | 0.000 | −0.701, −0.554 |
| Pain | 0.076 | 0.037 | 0.012 | 0.010, 0.153 | |
| Loneliness | −0.252 | 0.012 | 0.000 | −0.274, −0.228 | |
| Correlated Variables | r | S.D. | p-Value | C.I. | |
| Control | Autonomy | 0.752 | 0.015 | 0.000 | 0.721, 0.778 |
| Pleasure | 0.099 | 0.014 | 0.000 | 0.072, 0.125 | |
| Self-realization | 0.318 | 0.013 | 0.000 | 0.293, 0.342 | |
| Autonomy | Pleasure | 0.663 | 0.013 | 0.000 | 0.637, 0.688 |
| Self-realization | 0.792 | 0.013 | 0.000 | 0.766, 0.817 | |
| Pleasure | Self-realization | 0.717 | 0.006 | 0.000 | 0.705, 0.729 |
| Frailty | Pain | 0.875 | 0.009 | 0.000 | 0.859, 0.892 |
| Loneliness | 0.506 | 0.009 | 0.000 | 0.487, 0.524 | |
| Pain | Loneliness | 0.405 | 0.013 | 0.000 | 0.379, 0.429 |
Disclaimer/Publisher’s Note: The statements, opinions and data contained in all publications are solely those of the individual author(s) and contributor(s) and not of MDPI and/or the editor(s). MDPI and/or the editor(s) disclaim responsibility for any injury to people or property resulting from any ideas, methods, instructions or products referred to in the content. |
© 2025 by the authors. Published by MDPI on behalf of the University Association of Education and Psychology. Licensee MDPI, Basel, Switzerland. This article is an open access article distributed under the terms and conditions of the Creative Commons Attribution (CC BY) license (https://creativecommons.org/licenses/by/4.0/).
Share and Cite
Tomás, J.M.; Sanz, A.; Torres, Z. A Bayesian Structural Equation Model to Predict Quality of Life in European Older Adults. Eur. J. Investig. Health Psychol. Educ. 2025, 15, 127. https://doi.org/10.3390/ejihpe15070127
Tomás JM, Sanz A, Torres Z. A Bayesian Structural Equation Model to Predict Quality of Life in European Older Adults. European Journal of Investigation in Health, Psychology and Education. 2025; 15(7):127. https://doi.org/10.3390/ejihpe15070127
Chicago/Turabian StyleTomás, José M., Aitana Sanz, and Zaira Torres. 2025. "A Bayesian Structural Equation Model to Predict Quality of Life in European Older Adults" European Journal of Investigation in Health, Psychology and Education 15, no. 7: 127. https://doi.org/10.3390/ejihpe15070127
APA StyleTomás, J. M., Sanz, A., & Torres, Z. (2025). A Bayesian Structural Equation Model to Predict Quality of Life in European Older Adults. European Journal of Investigation in Health, Psychology and Education, 15(7), 127. https://doi.org/10.3390/ejihpe15070127