
Relationships Between Self-Esteem and Personal Attributes, Income, Consumption, and Assets: Japanese Panel Study


Abstract
:1. Introduction
2. Materials and Methods
2.1. Data
- Condition 1: Fewer than five responses.
- Condition 2: All responses are ones or zeros.
- Condition 3: Residing outside Japan.
2.2. Model
- : the binary response of respondent r in year t.
- : a vector of explanatory variables for respondent r in year t.
3. Results
3.1. Estimation Results Using Data from All Respondents
3.2. Estimation Results with Data Stratified by Marital Status and Gender
4. Discussion
5. Conclusions
Author Contributions
Funding
Institutional Review Board Statement
Informed Consent Statement
Data Availability Statement
Acknowledgments
Conflicts of Interest
Abbreviations
| MCMC | Markov chain Monte Carlo |
| ASIS | ancillarity–sufficiency interweaving strategy |
| WAIC | widely applicable information criterion |
Appendix A
Appendix A.1. Full Conditional of α
Appendix A.2. Full Conditional of β
Appendix A.3. Full Conditional of μα
Appendix A.4. Full Conditional of
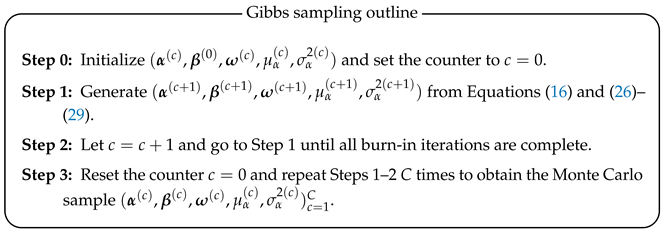
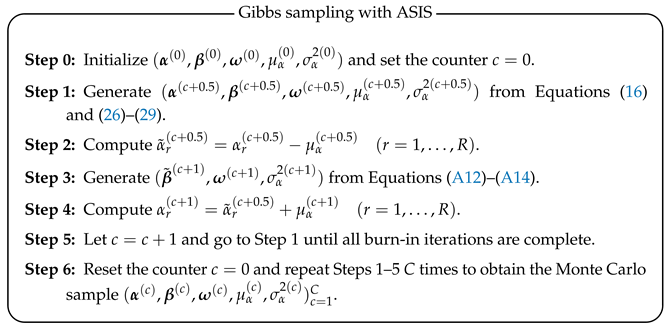
Appendix A.5. Gibbs Sampling and Efficiency Improvement Using ASIS
References
- Albikawi, Z. F. (2023). Anxiety, depression, self-esteem, internet addiction and predictors of cyberbullying and cybervictimization among female nursing university students: A cross sectional study. International Journal of Environmental Research and Public Health, 20(5), 4293. [Google Scholar] [CrossRef] [PubMed]
- Al Saigh, R., Herzallah, R., & Alhusban, A. (2022). Problematic use of social media platforms and its association with depression in pharmacy students. American Journal of Pharmaceutical Education, 86(5), 8625. [Google Scholar] [CrossRef]
- Arens, A. K., & Hasselhorn, M. (2014). Age and gender differences in the relation between self-concept facets and self-esteem. The Journal of Early Adolescence, 34(6), 760–791. [Google Scholar] [CrossRef]
- Auttama, N., Seangpraw, K., Ong-Artborirak, P., & Tonchoy, P. (2021). Factors associated with self-esteem, resilience, mental health, and psychological self-care among university students in Northern Thailand. Journal of Multidisciplinary Healthcare 14, 1213–1221. [Google Scholar] [CrossRef]
- Aydm, B., & San, S. V. (2011). Internet addiction among adolescents: The role of self-esteem. Procedia—Social and Behavioral Sciences, 15, 3500–3505. [Google Scholar] [CrossRef]
- Bahrainian, S. A., Alizadeh, K. H., Raeisoon, M. R., Gorji, O. H., & Khazaee, A. (2014). Relationship of internet addiction with self-esteem and depression in university students. Journal of Preventive Medicine and Hygiene, 55(3), 86–89. [Google Scholar] [PubMed]
- Bannink, R., Pearce, A., & Hope, S. (2016). Family income and young adolescents’ perceived social position: Associations with self-esteem and life satisfaction in the UK Millennium Cohort Study. Archives of Disease in Childhood, 101(10), 917–921. [Google Scholar] [CrossRef]
- Barragán Martín, A. B., Pérez-Fuentes, M. d. C., Molero Jurado, M. d. M., Martos Martínez, Á., Simón Márquez, M. d. M., Sisto, M., & Gázquez Linares, J. J. (2021). Emotional intelligence and academic engagement in adolescents: The mediating role of self-esteem. Psychology Research and Behavior Management, 14, 307–316. [Google Scholar] [CrossRef]
- Baumeister, R. F., Campbell, J. D., Krueger, J. I., & Vohs, K. D. (2003). Does high self-esteem cause better performance, interpersonal success, happiness, or healthier lifestyles? Psychological Science in the Public Interest, 4(1), 1–44. [Google Scholar] [CrossRef]
- Bhar, S., Ghahramanlou-Holloway, M., Brown, G., & Beck, A. T. (2008). Self-esteem and suicide ideation in psychiatric outpatients. Suicide and Life-Threatening Behavior, 38(5), 511–516. [Google Scholar] [CrossRef] [PubMed]
- Bigizadeh, S., Sharifi, N., Javadpour, S., Poornowrooz, N., Jahromy, F. H., & Jamali, S. (2021). Attitude toward violence and its relationship with self-esteem and self-efficacy among Iranian women. Journal of Psychosocial Nursing and Mental Health Services, 59(4), 31–37. [Google Scholar] [CrossRef]
- Bleidorn, W., Arslan, R. C., Denissen, J. J. A., Rentfrow, P. J., Gebauer, J. E., Potter, J., & Gosling, S. D. (2016). Age and gender differences in self-esteem—A cross-cultural window. Journal of Personality and Social Psychology, 111(3), 396–410. [Google Scholar] [CrossRef] [PubMed]
- Błachnio, A., Przepiorka, A., & Pantic, I. (2016). Association between Facebook addiction, self-esteem and life satisfaction: A cross-sectional study. Computers in Human Behavior, 55, 701–705. [Google Scholar] [CrossRef]
- Boden, J. M., Fergusson, D. M., & Horwood, L. J. (2007). Self-esteem and violence: Testing links between adolescent self-esteem and later hostility and violent behavior. Social Psychiatry and Psychiatric Epidemiology, 42(11), 881–891. [Google Scholar] [CrossRef]
- Cameranesi, M., & Piotrowski, C. C. (2017). Self-esteem in children exposed to intimate partner violence: A critical review of the role of sibling relationships and agenda for future research. Journal of Child & Adolescent Trauma, 11(3), 339–351. [Google Scholar] [CrossRef]
- Casale, S., Fioravanti, G., Bocci Benucci, S., Falone, A., Ricca, V., & Rotella, F. (2022). A meta-analysis on the association between self-esteem and problematic smartphone use. Computers in Human Behavior, 134, 107302. [Google Scholar] [CrossRef]
- Chen, H.-C., Wang, J.-Y., Lin, Y.-L., & Yang, S.-Y. (2020). Association of internet addiction with family functionality, depression, self-efficacy and self-esteem among early adolescents. International Journal of Environmental Research and Public Health, 17(23), 8820. [Google Scholar] [CrossRef]
- Chen, X., Dai, B., Li, S., & Liu, L. (2024). Childhood maltreatment, shame, and self-esteem: An exploratory analysis of influencing factors on criminal behavior in juvenile female offenders. BMC Psychology, 12(1), 257. [Google Scholar] [CrossRef]
- Colmsee, I.-S. O., Hank, P., & Bošnjak, M. (2021). Low self-esteem as a risk factor for eating disorders: A meta-analysis. Zeitschrift für Psychologie, 229(1), 48–69. [Google Scholar] [CrossRef]
- Colwell, J., & Kato, M. (2003). Investigation of the relationship between social isolation, self-esteem, aggression and computer game play in Japanese adolescents. Asian Journal of Social Psychology, 6(2), 149–158. [Google Scholar] [CrossRef]
- de la Torre-Cruz, T., Luis-Rico, I., di Giusto-Valle, C., Escolar-Llamazares, M.-C., Hortigüela-Alcalá, D., Palmero-Cámara, C., & Jiménez, A. (2021). A mediation model between self-esteem, anxiety, and depression in sport: The role of gender differences in speleologists. International Journal of Environmental Research and Public Health, 18(16), 8765. [Google Scholar] [CrossRef] [PubMed]
- Deng, Y., Li, X., Liu, L., & Chui, W. H. (2020). Suicide attempts and perceived social support among chinese drug users: The mediating role of self-esteem and depression. International Journal of Environmental Research and Public Health, 18(1), 208. [Google Scholar] [CrossRef] [PubMed]
- Donnellan, M. B., Trzesniewski, K. H., Robins, R. W., Moffitt, T. E., & Caspi, A. (2005). Low self-esteem is related to aggression, antisocial behavior, and delinquency. Psychological Science, 16(4), 328–335. [Google Scholar] [CrossRef]
- Fontaine, K. R., & Jones, L. C. (1997). Self-esteem, optimism, and postpartum depression. Journal of Clinical Psychology, 53(1), 59–63. [Google Scholar] [CrossRef]
- Gao, W., Luo, Y., Cao, X., & Liu, X. (2022). Gender differences in the relationship between self-esteem and depression among college students: A cross-lagged study from China. Journal of Research in Personality, 97, 104202. [Google Scholar] [CrossRef]
- Geman, S., & Geman, D. (1984). Stochastic relaxation, gibbs distributions, and the Bayesian restoration of images. IEEE Transactions on Pattern Analysis and Machine Intelligence, PAMI-6(6), 721–741. [Google Scholar] [CrossRef]
- Gentile, B., Grabe, S., Dolan-Pascoe, B., Twenge, J. M., Wells, B. E., & Maitino, A. (2009). Gender differences in domain-specific self-esteem: A meta-analysis. Review of General Psychology, 13(1), 34–45. [Google Scholar] [CrossRef]
- Gerymski, R., Dymecka, J., Iszczuk, A., & Bidzan, M. (2023). Perceived stress and life satisfaction in pregnant women during the COVID-19 pandemic: The mediating role of fear of childbirth and self-esteem. Health Psychology Report, 12(3), 197–208. [Google Scholar] [CrossRef]
- Gerymski, R., & Szeląg, M. (2023). Sexual well-being in individuals with schizophrenia: A pilot study on the role of self-esteem and acceptance of illness. European Journal of Investigation in Health, Psychology and Education, 13(7), 1318–1329. [Google Scholar] [CrossRef]
- Gnardellis, C., Vagka, E., Lagiou, A., & Notara, V. (2023). Nomophobia and its association with depression, anxiety and stress (DASS scale), among young adults in Greece. European Journal of Investigation in Health, Psychology and Education, 13(12), 2765–2778. [Google Scholar] [CrossRef]
- Greenberg, J., Solomon, S., Pyszczynski, T., Rosenblatt, A., Burling, J., Lyon, D., Simon, L., & Pinel, E. (1992). Why do people need self-esteem? Converging evidence that self-esteem serves an anxiety-buffering function. Journal of Personality and Social Psychology, 63(6), 913–922. [Google Scholar] [CrossRef]
- Hofer, A., Mizuno, Y., Frajo-Apor, B., Kemmler, G., Suzuki, T., Pardeller, S., Welte, A.-S., Sondermann, C., Mimura, M., Wartelsteiner, F., Fleischhacker, W. W., & Uchida, H. (2016). Resilience, internalized stigma, self-esteem, and hopelessness among people with schizophrenia: Cultural comparison in Austria and Japan. Schizophrenia Research, 171(1), 86–91. [Google Scholar] [CrossRef] [PubMed]
- Hu, Y., Cai, Y., Wang, R., Gan, Y., & He, N. (2023). The relationship between self-esteem and aggressive behavior among Chinese adolescents: A moderated chain mediation model. Frontiers in Psychology, 14, 1191134. [Google Scholar] [CrossRef] [PubMed]
- Jankowiak, B., Jaskulska, S., Sanz-Barbero, B., Waszyńska, K., Claire, K. D., Bowes, N., Silva, E., Neves, S., Albaladejo-Blázquez, N., Pyżalski, J., Chmura-Rutkowska, I., & Vives-Cases, C. (2021). Will i like myself if you hurt me? experiences of violence and adolescents’ self-esteem. Sustainability, 13(21), 11620. [Google Scholar] [CrossRef]
- Josephs, R. A., Markus, H. R., & Tafarodi, R. W. (1992). Gender and self-esteem. Journal of Personality and Social Psychology, 63(3), 391–402. [Google Scholar] [CrossRef]
- Kalata, U., Jarkiewicz, M., Pomian, A., Zwierzchowska, A. J., Horosz, E., Majkusiak, W., Rutkowska, B., & Barcz, E. M. (2024). The influence of successful treatment of stress urinary incontinence and pelvic organ prolapse on depression, anxiety, and insomnia—A prospective intervention impact assessment study. Journal of Clinical Medicine, 13(6), 1528. [Google Scholar] [CrossRef]
- Kernis, M. H. (2005). Measuring self-esteem in context: The importance of stability of self-esteem in psychological functioning. Journal of Personality, 73(6), 1569–1605. [Google Scholar] [CrossRef]
- Kircaburun, K. (2016). Self-esteem, daily internet use and social media addiction as predictors of depression among Turkish adolescents. Journal of Education and Practice 7, 64–72. [Google Scholar]
- Kurnaz, M. F., Teke, E., & Günaydın, H. A. (2020). Relationship between self-esteem and life satisfaction: A meta-analysis study. Research on Education and Psychology, 4(2), 236–253. [Google Scholar]
- Liao, J., Xia, T., Xu, X., & Pan, L. (2023). The effect of appearance anxiety on social anxiety among college students: Sequential mediating effects of self-efficacy and self-esteem. Behavioral Sciences, 13(8), 692. [Google Scholar] [CrossRef]
- Lin, C.-C. (2015). Self-esteem mediates the relationship between dispositional gratitude and well-being. Personality and Individual Differences, 85, 145–148. [Google Scholar] [CrossRef]
- Liu, X., Cao, X., & Gao, W. (2022). Does low self-esteem predict anxiety among chinese college students? Psychology Research and Behavior Management, 15, 1481–1487. [Google Scholar] [CrossRef]
- Luijten, C. C., van de Bongardt, D., & Nieboer, A. P. (2023). Adolescents’ friendship quality and over-time development of well-being: The explanatory role of self-esteem. Journal of Adolescence, 95(5), 1057–1069. [Google Scholar] [CrossRef] [PubMed]
- Ma, C. M. S. (2022). Relationships between social networking sites use and self-esteem: The moderating role of gender. International Journal of Environmental Research and Public Health, 19(18), 11462. [Google Scholar] [CrossRef] [PubMed]
- Macinnes, D. L. (2006). Self-esteem and self-acceptance: An examination into their relationship and their effect on psychological health. Journal of Psychiatric and Mental Health Nursing, 13(5), 483–489. [Google Scholar] [CrossRef]
- McMullin, J. A., & Cairney, J. (2004). Self-esteem and the intersection of age, class, and gender. Journal of Aging Studies, 18(1), 75–90. [Google Scholar] [CrossRef]
- Nakakita, M., & Nakatsuma, T. (2023). Hierarchical Bayesian analysis of racehorse running ability and jockey skills. International Journal of Computer Science in Sport, 22(2), 1–25. [Google Scholar] [CrossRef]
- Nakakita, M., & Nakatsuma, T. (2024). A hierarchical Bayesian approach for identifying socioeconomic factors influencing self-rated health in Japan. Healthcare Analytics, 6, 100367. [Google Scholar] [CrossRef]
- O’Connor, R. C., Rasmussen, S., & Hawton, K. (2009). Predicting deliberate self-harm in adolescents: A six month prospective study. Suicide and Life-Threatening Behavior, 39(4), 364–375. [Google Scholar] [CrossRef]
- Okunlola, O. B., Odukoya, J. A., & Gesinde, A. M. (2020). Outcomes of sexual abuse on self-esteem among adolescents: A systematic review. Cogent Social Sciences, 7(1), 1856296. [Google Scholar] [CrossRef]
- Opiri, J. A., & Lang, C. (2017). The impact of the self-esteem and consumption values on consumers attitude and intention to purchase luxury fashion products. In International textile and apparel association annual conference proceedings (Vol. 73). Iowa State University Digital Press. [Google Scholar]
- Orth, U., & Robins, R. W. (2022). Is high self-esteem beneficial? Revisiting a classic question. American Psychologist, 77(1), 5–17. [Google Scholar] [CrossRef]
- Orth, U., Robins, R. W., Trzesniewski, K. H., Maes, J., & Schmitt, M. (2009). Low self-esteem is a risk factor for depressive symptoms from young adulthood to old age. Journal of Abnormal Psychology, 118(3), 472–478. [Google Scholar] [CrossRef] [PubMed]
- Pandey, R., Tiwari, G. K., Parihar, P., & Rai, P. K. (2019). Positive, not negative, self-compassion mediates the relationship between self-esteem and well-being. Psychology and Psychotherapy: Theory, Research and Practice, 94(1), 1–15. [Google Scholar] [CrossRef]
- Paradise, A. W., & Kernis, M. H. (2002). Self-esteem and psychological well-being: Implications of fragile self-esteem. Journal of Social and Clinical Psychology, 21(4), 345–361. [Google Scholar] [CrossRef]
- Pignault, A., Rastoder, M., & Houssemand, C. (2023). The relationship between self-esteem, self-efficacy, and career decision-making difficulties: Psychological flourishing as a mediator. European Journal of Investigation in Health, Psychology and Education, 13(9), 1553–1568. [Google Scholar] [CrossRef] [PubMed]
- Polson, N. G., Scott, J. G., & Windle, J. (2013). Bayesian inference for logistic models using Pólya–Gamma latent variables. Journal of the American Statistical Association, 108(504), 1339–1349. [Google Scholar] [CrossRef]
- Pyszczynski, T., Greenberg, J., Solomon, S., Arndt, J., & Schimel, J. (2004). Why do people need self-esteem? A theoretical and empirical review. Psychological Bulletin, 130(3), 435–468. [Google Scholar] [CrossRef] [PubMed]
- Radford, M. H., Mann, L., Ohta, Y., & Nakane, Y. (1993). Differences between Australian and Japanese students in decisional self-esteem, decisional stress, and coping styles. Journal of Cross-Cultural Psychology, 24(3), 284–297. [Google Scholar] [CrossRef]
- Raymore, L. A., Godbey, G. C., & Crawford, D. W. (1994). Self-esteem, gender, and socioeconomic status: Their relation to perceptions of constraint on leisure among adolescents. Journal of Leisure Research, 26(2), 99–118. [Google Scholar] [CrossRef]
- Rentzsch, K., Wenzler, M. P., & Schütz, A. (2016). The structure of multidimensional self-esteem across age and gender. Personality and Individual Differences, 88, 139–147. [Google Scholar] [CrossRef]
- Roberts, R. E. L., & Bengtson, V. L. (1993). Relationships with parents, self-esteem, and psychological well-being in young adulthood. Social Psychology Quarterly, 56(4), 263–277. [Google Scholar] [CrossRef]
- Rohe, W. M., & Stegman, M. A. (1994). The effects of homeownership: On the self-esteem, perceived control and life satisfaction of low-income people. Journal of the American Planning Association, 60(2), 173–184. [Google Scholar] [CrossRef]
- Rosenberg, M. (1965). Society and the adolescent self-image. Princeton University Press. Available online: http://www.jstor.org/stable/j.ctt183pjjh (accessed on 14 January 2025).
- Saito, W., Nakakita, M., & Nakatsuma, T. (2024). Comparative analysis of Japanese rice wine export trends: Large firms in the Nada Region vs. SMES in other regions. World, 5(3), 700–722. [Google Scholar] [CrossRef]
- Shahar, G., & Henrich, C. C. (2010). Do depressive symptoms erode self-esteem in early adolescence? Self and Identity, 9(4), 403–415. [Google Scholar] [CrossRef]
- Shen, A. C.-T. (2008). Self-esteem of young adults experiencing interparental violence and child physical maltreatment: Parental and peer relationships as mediators. Journal of Interpersonal Violence, 24(5), 770–794. [Google Scholar] [CrossRef] [PubMed]
- Shi, H., Zhao, H., Ren, Z., Li, X., He, M., Zha, S., Qiao, S., Li, Y., Pu, Y., Liu, H., & Zhang, X. (2022). Associations of parent-adolescent relationship and self-esteem with emotional and behavioral problems among Chinese adolescents. Journal of Affective Disorders 311, 126–133. [Google Scholar] [CrossRef]
- Soto-Sanz, V., Blanco, M., Cebriá, A., Gabilondo, A., Gili, M., Roca, M., Lagares, C., Alonso, J., Piqueras, J., Rodríguez-Marín, J., Pérez-Vázquez, M., Rodríguez-Jiménez, T., Castellví, P., Miranda-Mendizábal, A., Parés-Badell, O., & Almenara, J. (2019). Self-esteem and suicidal behaviour in youth: A meta-analysis of longitudinal studies. Psicothema, 3(31), 246–254. [Google Scholar] [CrossRef]
- Sowislo, J. F., & Orth, U. (2013). Does low self-esteem predict depression and anxiety? A meta-analysis of longitudinal studies. Psychological Bulletin, 139(1), 213–240. [Google Scholar] [CrossRef] [PubMed]
- Steinsbekk, S., Wichstrøm, L., Stenseng, F., Nesi, J., Hygen, B. W., & Skalická, V. (2021). The impact of social media use on appearance self-esteem from childhood to adolescence—A 3-wave community study. Computers in Human Behavior 114, 106528. [Google Scholar] [CrossRef]
- Sunderland, M., Forbes, M. K., Mewton, L., Baillie, A., Carragher, N., Lynch, S. J., Batterham, P. J., Calear, A. L., Chapman, C., Newton, N. C., Teesson, M., & Slade, T. (2020). The structure of psychopathology and association with poor sleep, self-harm, suicidality, risky sexual behavior, and low self-esteem in a population sample of adolescents. Development and Psychopathology, 33(4), 1208–1219. [Google Scholar] [CrossRef]
- Szcześniak, M., Bajkowska, I., Czaprowska, A., & Sileńska, A. (2022). Adolescents’ self-esteem and life satisfaction: Communication with peers as a mediator. International Journal of Environmental Research and Public Health, 19(7), 3777. [Google Scholar] [CrossRef]
- Szeto, A. C. H., Sorrentino, R. M., Yasunaga, S., Otsubo, Y., Kouhara, S., & Sasayama, I. (2009). Using the implicit association test across cultures: A case of implicit self-esteem in Japan and Canada. Asian Journal of Social Psychology, 12(3), 211–220. [Google Scholar] [CrossRef]
- Szkody, E., Steele, E. H., & McKinney, C. (2021). Effects of parenting styles on psychological problems by self esteem and gender differences. Journal of Family Issues, 42(9), 1931–1954. [Google Scholar] [CrossRef]
- Tatnell, R., Kelada, L., Hasking, P., & Martin, G. (2014). Longitudinal analysis of adolescent nssi: The role of intrapersonal and interpersonal factors. Journal of Abnormal Child Psychology, 42(6), 885–896. [Google Scholar] [CrossRef] [PubMed]
- Torres, S., Araújo, C. A., Fitzgerald, A., Dooley, B., Leondari, A., Costa, C. M., Olenik-Shemesh, D., Sygkollitou, E., Burusic, J., Boone, L., Šuvak-Martinović, M., Välimäki, M., Anttila, M., Heiman, T., & Babarović, T. (2022). An international study of correlates of women’s positive body image. European Journal of Investigation in Health, Psychology and Education, 12(10), 1521–1534. [Google Scholar] [CrossRef]
- Trong Dam, V. A., Do, H. N., Thi Vu, T. B., Vu, K. L., Do, H. M., Thi Nguyen, N. T., Nguyen, T. T., Thi Vu, T. M., Thi Nguyen, T. P., Auquier, P., Boyer, L., Fond, G., Latkin, C. A., Ho, C. S. H., & Ho, R. C. M. (2023). Associations between parent-child relationship, self-esteem, and resilience with life satisfaction and mental wellbeing of adolescents. Frontiers in Public Health, 11, 1012337. [Google Scholar] [CrossRef]
- Truong, Y., & McColl, R. (2011). Intrinsic motivations, self-esteem, and luxury goods consumption. Journal of Retailing and Consumer Services, 18(6), 555–561. [Google Scholar] [CrossRef]
- Trzesniewski, K. H., Donnellan, M. B., Moffitt, T. E., Robins, R. W., Poulton, R., & Caspi, A. (2006). Low self-esteem during adolescence predicts poor health, criminal behavior, and limited economic prospects during adulthood. Developmental Psychology, 42(2), 381–390. [Google Scholar] [CrossRef] [PubMed]
- Tu, J., & Fu, H. (2024). The path to happiness for music students: Music empathy and music engagement as potential sources of subjective well-being. Humanities and Social Sciences Communications, 11(1), 1037. [Google Scholar] [CrossRef]
- Valenti, G. D., & Faraci, P. (2021). Predicting university adjustment from coping-styles, self-esteem, self-efficacy, and personality: Findings from a survey in a sample of Italian students. European Journal of Investigation in Health, Psychology and Education, 11(3), 894–907. [Google Scholar] [CrossRef]
- von Soest, T., Wagner, J., Hansen, T., & Gerstorf, D. (2018). Self-esteem across the second half of life: The role of socioeconomic status, physical health, social relationships, and personality factors. Journal of Personality and Social Psychology, 114(6), 945–958. [Google Scholar] [CrossRef]
- Wang, P., Wang, X., Wu, Y., Xie, X., Wang, X., Zhao, F., Ouyang, M., & Lei, L. (2018). Social networking sites addiction and adolescent depression: A moderated mediation model of rumination and self-esteem. Personality and Individual Differences, 127, 162–167. [Google Scholar] [CrossRef]
- Watanabe, S. (2010). Asymptotic equivalence of bayes cross validation and widely applicable information criterion in singular learning theory. Journal of Machine Learning Research, 11(116), 3571–3594. [Google Scholar]
- Wågan, F. A., Darvik, M. D., & Pedersen, A. V. (2021). Associations between self-esteem, psychological stress, and the risk of exercise dependence. International Journal of Environmental Research and Public Health, 18(11), 5577. [Google Scholar] [CrossRef] [PubMed]
- Wodarz, R., & Rogowska, A. M. (2024). The moderating effect of body appreciation on the relationship between self-esteem and life satisfaction. European Journal of Investigation in Health, Psychology and Education, 14(4), 870–887. [Google Scholar] [CrossRef]
- Yıldırım, N., Karaca, A., Cangur, S., Acıkgoz, F., & Akkus, D. (2017). The relationship between educational stress, stress coping, self-esteem, social support, and health status among nursing students in Turkey: A structural equation modeling approach. Nurse Education Today, 48, 33–39. [Google Scholar] [CrossRef]
- Yılmaz, M. N., & Dundar, C. (2022). The relationship between orthorexia nervosa, anxiety, and self-esteem: A cross-sectional study in Turkish faculty members. BMC Psychology, 10(1), 82. [Google Scholar] [CrossRef]
- Yoo, T., Kim, S.-W., Kim, S.-Y., Lee, J.-Y., Kang, H.-J., Bae, K.-Y., Kim, J.-M., Shin, I.-S., & Yoon, J.-S. (2015). Relationship between suicidality and low self-esteem in patients with schizophrenia. Clinical Psychopharmacology and Neuroscience, 13(3), 296–301. [Google Scholar] [CrossRef] [PubMed]
- Yu, Y., & Meng, X.-L. (2011). To center or not to center: That is not the question—An ancillarity–sufficiency interweaving strategy (ASIS) for boosting MCMC efficiency. Journal of Computational and Graphical Statistics, 20(3), 531–570. [Google Scholar] [CrossRef]
- Zapata-Lamana, R., Sanhueza-Campos, C., Stuardo-Álvarez, M., Ibarra-Mora, J., Mardones-Contreras, M., Reyes-Molina, D., Vásquez-Gómez, J., Lasserre-Laso, N., Poblete-Valderrama, F., Petermann-Rocha, F., Parra-Rizo, M. A., & Cigarroa, I. (2021). Anxiety, low self-esteem and a low happiness index are associated with poor school performance in chilean adolescents: A cross-sectional analysis. International Journal of Environmental Research and Public Health, 18(21), 11685. [Google Scholar] [CrossRef]


| Frequency | Mean | ||||
|---|---|---|---|---|---|
| Variable | Description | 1 | 0 | 1 | 0 |
| Self-esteem | Having self-esteem (default: No) | ||||
| y | Yes | 10,021 | 9071 | 1 | 0 |
| Spouse | Having a spouse (default: No) | ||||
| Yes | 14,240 | 4852 | 0.538 | 0.487 | |
| Sex | (default: Female) | ||||
| Male | 9373 | 9719 | 0.516 | 0.534 | |
| Year | (default: 2014) | ||||
| 2015 | 2269 | 16,823 | 0.552 | 0.521 | |
| 2016 | 2271 | 16,821 | 0.527 | 0.525 | |
| 2017 | 2265 | 16,827 | 0.517 | 0.526 | |
| 2018 | 2271 | 16,821 | 0.520 | 0.526 | |
| 2019 | 2129 | 16,963 | 0.496 | 0.529 | |
| 2020 | 2009 | 17,083 | 0.529 | 0.524 | |
| 2021 | 1853 | 16,239 | 0.502 | 0.527 | |
| 2022 | 1758 | 17,334 | 0.507 | 0.527 | |
| Age | (default: –39) | ||||
| 40–49 | 4121 | 14,971 | 0.568 | 0.513 | |
| 50–59 | 4324 | 14,768 | 0.516 | 0.527 | |
| 60–69 | 4240 | 14,852 | 0.492 | 0.534 | |
| 70– | 4322 | 14,770 | 0.500 | 0.532 | |
| Region | Region in which respondent resides (default: Kanto) | ||||
| Hokkaido | 912 | 18,180 | 0.508 | 0.528 | |
| Tohoku | 1226 | 17,866 | 0.502 | 0.526 | |
| Chubu | 3358 | 15,734 | 0.509 | 0.528 | |
| Kinki | 3521 | 15,571 | 0.538 | 0.522 | |
| Chugoku | 1195 | 17,897 | 0.519 | 0.525 | |
| Shikoku | 518 | 18,574 | 0.475 | 0.526 | |
| Kyushu | 2052 | 17,040 | 0.545 | 0.522 | |
| Size of city | Size of city in which respondent resides (default: Major [government-designated] | ||||
| Other cities | 11,578 | 7514 | 0.520 | 0.533 | |
| Towns and villages | 1791 | 17,301 | 0.523 | 0.525 | |
| Variable | Description | Mean | SD | Median | Max | Min |
|---|---|---|---|---|---|---|
| Satisfaction level | ||||||
| Household income | 2.458 | 0 | 5 | |||
| Employment status | 2.336 | 0 | 5 | |||
| Housing | 2.328 | 0 | 5 | |||
| Amount of leisure time | 2.349 | 0 | 5 | |||
| Leisure time activities | 2.208 | 0 | 5 | |||
| Health | 2.198 | 0 | 5 | |||
| Life overall | 1.931 | 0 | 5 | |||
| Household finances | ||||||
| Amount of savings and deposits | 4.789 | 2.989 | 5.920 | 10.309 | 0 | |
| Amount of securities | 1.304 | 2.522 | 0 | 10.021 | 0 | |
| Borrowings | 2.525 | 3.264 | 0 | 10.820 | 0 | |
| Household’s annual income | 6.250 | 0.737 | 6.347 | 9.210 | 0 | |
| Household’s asset income | 0.552 | 1.518 | 0 | 9.306 | 0 | |
| Individual income | ||||||
| Respondent’s business and salary income | 4.847 | 2.381 | 5.861 | 8.987 | 0 | |
| Respondent’s investment income | 0.592 | 1.483 | 0 | 9.210 | 0 | |
| Respondent’s other income | 2.452 | 2.507 | 2.398 | 7.645 | 0 | |
| Spouse’s business and salary income | 2.340 | 2.484 | 0 | 7.824 | 0 | |
| Spouse’s investment income | 0.176 | 0.799 | 0 | 7.456 | 0 | |
| Spouse’s other income | 1.277 | 1.950 | 0 | 7.700 | 0 | |
| Other family members’ total income | 2.635 | 2.810 | 0 | 8.638 | 0 | |
| Household consumption | ||||||
| Food, eating out, and school lunches | 4.244 | 0.523 | 4.262 | 6.553 | 0 | |
| Rent, land rent, home repairs | 1.449 | 1.904 | 0 | 8.700 | 0 | |
| Furniture and digital consumer electronics purchases | 1.192 | 1.506 | 0 | 8.189 | 0 | |
| Clothing and shoes | 1.995 | 1.278 | 2.398 | 6.547 | 0 | |
| Education, culture, and amusement | 2.035 | 1.656 | 2.398 | 8.061 | 0 | |
| Other expenditures | 4.580 | 0.884 | 4.700 | 8.320 | 0 | |
| Other expenses | ||||||
| Loan repayments | 0.964 | 1.177 | 0 | 6.804 | 0 | |
| Donations to charity and religious organizations | 2.121 | 3.841 | 0 | 14.988 | 0 | |
| Market value of the house and the plot | ||||||
| House’s market value | 7.930 | 5.438 | 6.909 | 16.118 | 0 | |
| Plot’s market value | 7.979 | 4.593 | 7.314 | 13.816 | 0 |
| Variable | Model 1 | Model 2 | Model 3 | Model 4 |
|---|---|---|---|---|
| Year | ||||
| ✓ | ✓ | ✓ | ✓ | |
| ✓ | ✓ | ✓ | ✓ | |
| ✓ | ✓ | ✓ | ✓ | |
| ✓ | ✓ | ✓ | ✓ | |
| ✓ | ✓ | ✓ | ✓ | |
| ✓ | ✓ | ✓ | ✓ | |
| ✓ | ✓ | ✓ | ✓ | |
| ✓ | ✓ | ✓ | ✓ | |
| Age | ||||
| ✓ | ✓ | ✓ | ✓ | |
| ✓ | ✓ | ✓ | ✓ | |
| ✓ | ✓ | ✓ | ✓ | |
| ✓ | ✓ | ✓ | ✓ | |
| Region | ||||
| ✓ | ✓ | ✓ | ✓ | |
| ✓ | ✓ | ✓ | ✓ | |
| ✓ | ✓ | ✓ | ✓ | |
| ✓ | ✓ | ✓ | ✓ | |
| ✓ | ✓ | ✓ | ✓ | |
| ✓ | ✓ | ✓ | ✓ | |
| ✓ | ✓ | ✓ | ✓ | |
| City size | ||||
| ✓ | ✓ | ✓ | ✓ | |
| ✓ | ✓ | ✓ | ✓ | |
| Satisfaction level | ||||
| ✓ | ✓ | |||
| ✓ | ✓ | |||
| ✓ | ✓ | |||
| ✓ | ✓ | |||
| ✓ | ✓ | |||
| ✓ | ✓ | |||
| ✓ | ✓ | |||
| Household finances | ||||
| ✓ | ✓ | |||
| ✓ | ✓ | |||
| ✓ | ✓ | |||
| ✓ | ✓ | |||
| ✓ | ✓ | |||
| Individual income | ||||
| ✓ | ✓ | |||
| ✓ | ✓ | |||
| ✓ | ✓ | |||
| ✓ | ✓ | |||
| ✓ | ✓ | |||
| ✓ | ✓ | |||
| ✓ | ✓ | |||
| Household consumption | ||||
| ✓ | ✓ | |||
| ✓ | ✓ | |||
| ✓ | ✓ | |||
| ✓ | ✓ | |||
| ✓ | ✓ | |||
| ✓ | ✓ | |||
| Other expenses | ||||
| ✓ | ✓ | |||
| ✓ | ✓ | |||
| House and plot market value | ||||
| ✓ | ✓ | |||
| ✓ | ✓ |
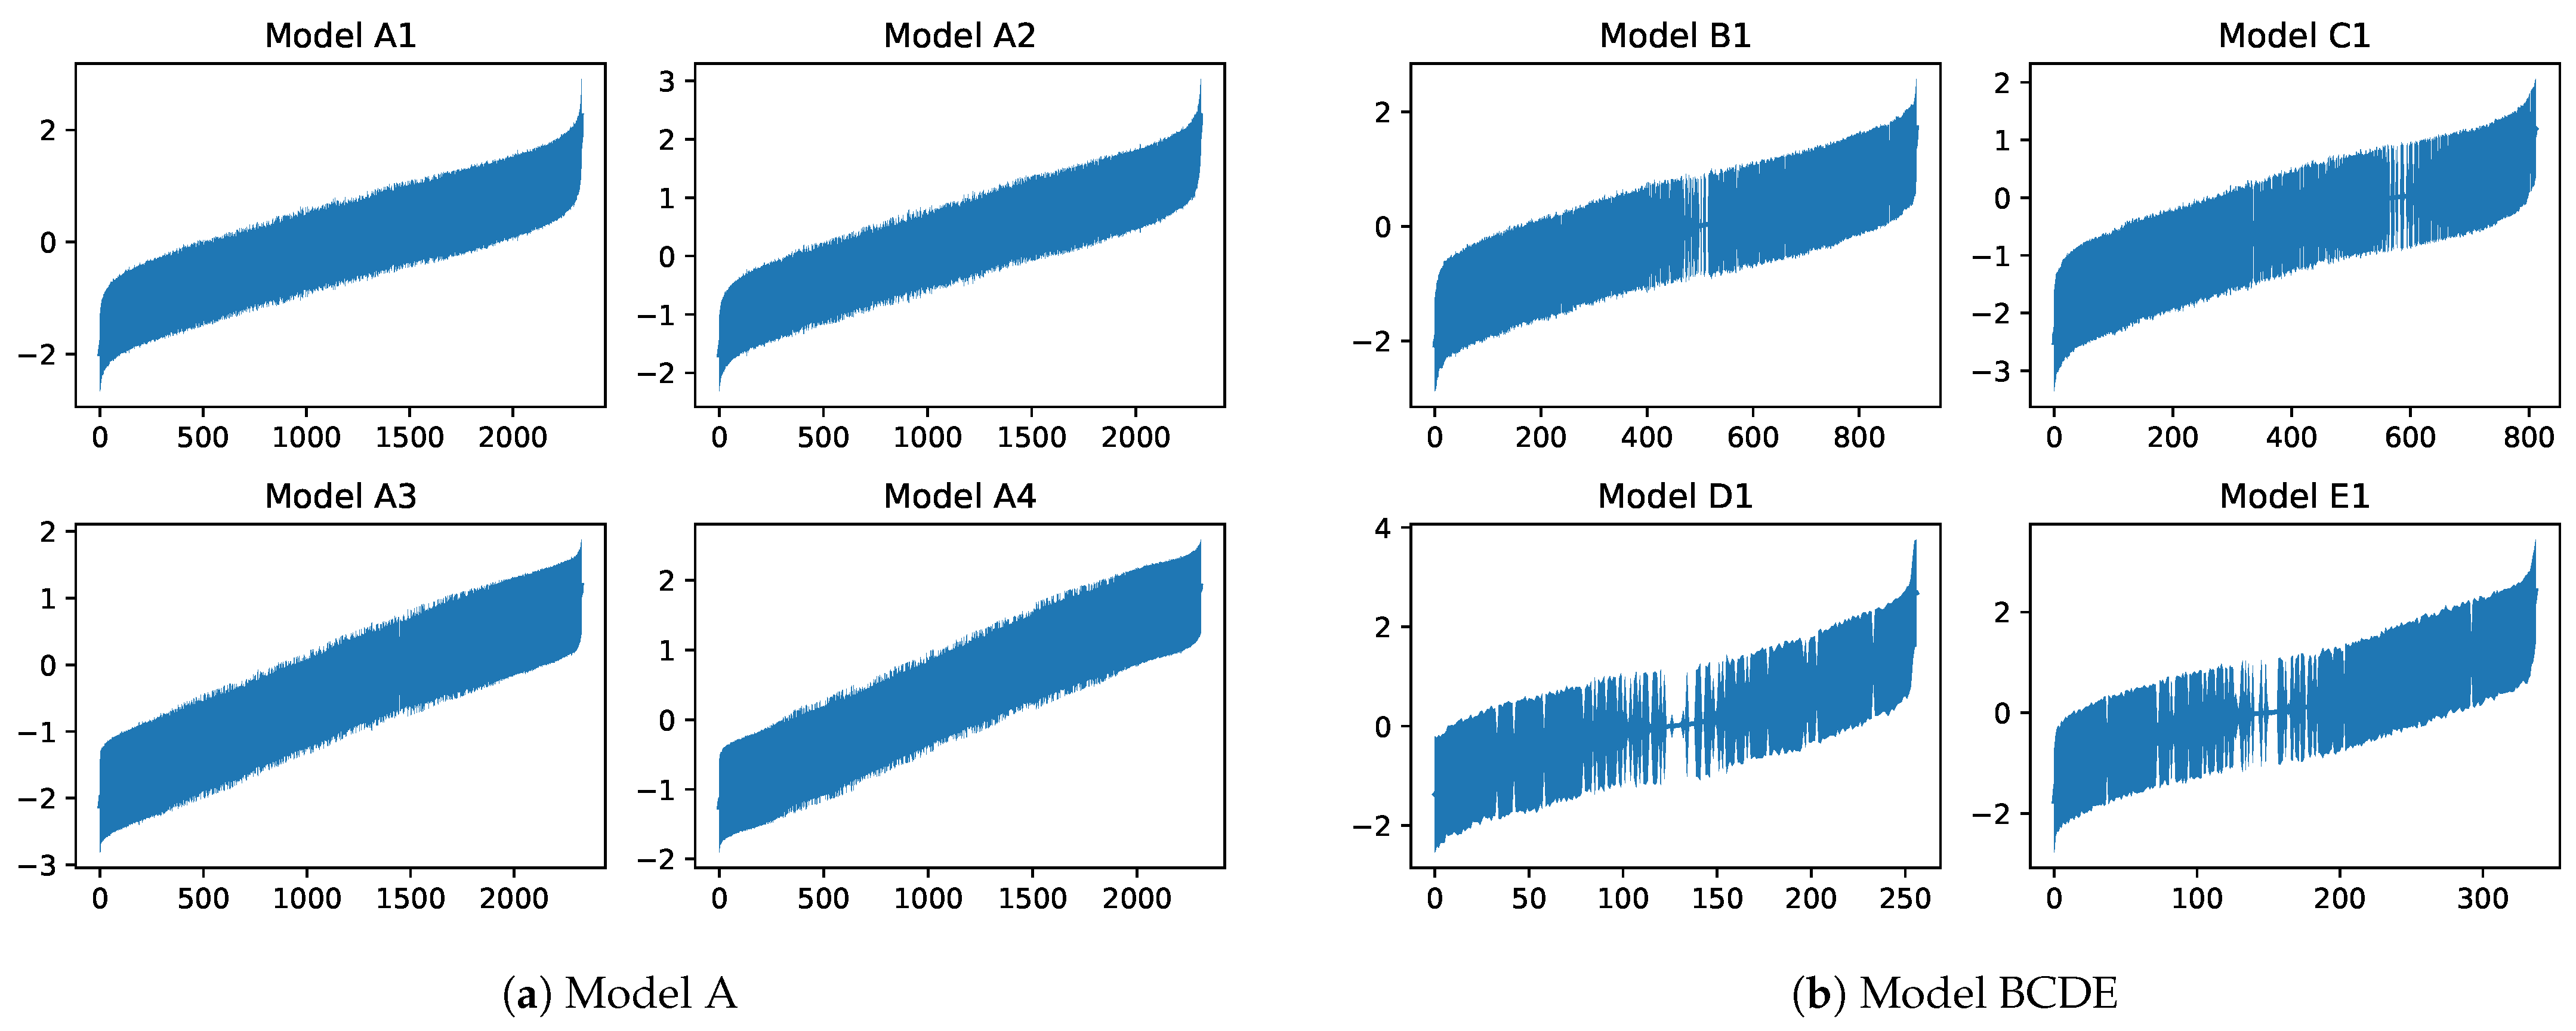
| Model A1 | Model A2 | Model A3 | Model A4 | |
|---|---|---|---|---|
| WAIC | 11,370.0 | 11,488.4 | 14,773.1 | 14,944.7 |
| (a) | ||||
|---|---|---|---|---|
| Model B1 | Model B2 | Model B3 | Model B4 | |
| WAIC | ||||
| (b) | ||||
| Model C1 | Model C2 | Model C3 | Model C4 | |
| WAIC | ||||
| (c) | ||||
| Model D1 | Model D2 | Model D3 | Model D4 | |
| WAIC | ||||
| (d) | ||||
| Model E1 | Model E2 | Model E3 | Model E4 | |
| WAIC | ||||
Disclaimer/Publisher’s Note: The statements, opinions and data contained in all publications are solely those of the individual author(s) and contributor(s) and not of MDPI and/or the editor(s). MDPI and/or the editor(s) disclaim responsibility for any injury to people or property resulting from any ideas, methods, instructions or products referred to in the content. |
© 2025 by the authors. Published by MDPI on behalf of the University Association of Education and Psychology. Licensee MDPI, Basel, Switzerland. This article is an open access article distributed under the terms and conditions of the Creative Commons Attribution (CC BY) license (https://creativecommons.org/licenses/by/4.0/).
Share and Cite
Nakakita, M.; Oya, S.; Kubota, N.; Toyabe, T.; Nakatsuma, T. Relationships Between Self-Esteem and Personal Attributes, Income, Consumption, and Assets: Japanese Panel Study. Eur. J. Investig. Health Psychol. Educ. 2025, 15, 78. https://doi.org/10.3390/ejihpe15050078
Nakakita M, Oya S, Kubota N, Toyabe T, Nakatsuma T. Relationships Between Self-Esteem and Personal Attributes, Income, Consumption, and Assets: Japanese Panel Study. European Journal of Investigation in Health, Psychology and Education. 2025; 15(5):78. https://doi.org/10.3390/ejihpe15050078
Chicago/Turabian StyleNakakita, Makoto, Sakae Oya, Naoki Kubota, Tomoki Toyabe, and Teruo Nakatsuma. 2025. "Relationships Between Self-Esteem and Personal Attributes, Income, Consumption, and Assets: Japanese Panel Study" European Journal of Investigation in Health, Psychology and Education 15, no. 5: 78. https://doi.org/10.3390/ejihpe15050078
APA StyleNakakita, M., Oya, S., Kubota, N., Toyabe, T., & Nakatsuma, T. (2025). Relationships Between Self-Esteem and Personal Attributes, Income, Consumption, and Assets: Japanese Panel Study. European Journal of Investigation in Health, Psychology and Education, 15(5), 78. https://doi.org/10.3390/ejihpe15050078