3. Results
3.1. Preliminary Analyses
3.1.1. Associations between Study Variables
Table 2 reports descriptive statistics and correlation coefficients for PWB, PD, physical activity (PA), and dimensions of affect. Correlations are in line with H1, H2, and H3.
Regarding predictor variables (PA, positive and negative affect), higher physical activity (PA) and higher positive affect were associated with higher levels of all three PWB domains (satisfaction with life, physical health, and avoiding drugs and narcotics). Higher negative affect was associated with lower levels of all three PWB domains (see
Table 2). Contrastingly, higher physical activity (PA) and positive affect were associated with lower levels of all four PD domains (somatization, anxiety and insomnia, depression, and social dysfunction). Higher negative affect was associated with higher levels of all four PD domains (
p < 0.01). Finally, negative associations emerged between PWB and PD domains.
3.1.2. Predicting PWB and PD from Physical Activity (PA) and Dimensions of Affect
Three hierarchical regression analyses were conducted to evaluate the influence of predictor variables (PA, positive affect, negative affect) on three domains of PWB (satisfaction with life, physical health, and avoiding drugs and narcotics). Results are displayed in
Table 3 and are generally concordant with H4. PA predicted all PWB domains. Life satisfaction was predicted by negative and by positive affect. The latter also predicted the PWB domain avoiding drugs and narcotics. Interestingly, dimensions of affect were significant predictors of physical health when entered into the regression separately alongside PA but not when jointly included.
Four hierarchical regression analyses were conducted to evaluate the influence of predictor variables (PA, positive affect, negative affect) on four domains of psychological dysfunctioning (somatization, anxiety and insomnia, social dysfunction, depression). Physical activity, positive affect, and negative affect were significant predictors of the three first-mentioned domains of PD, whereas only positive and negative affect predicted depression (cf.
Table 3). These results were concordant with H5.
3.2. Measurement Models
Several authors [
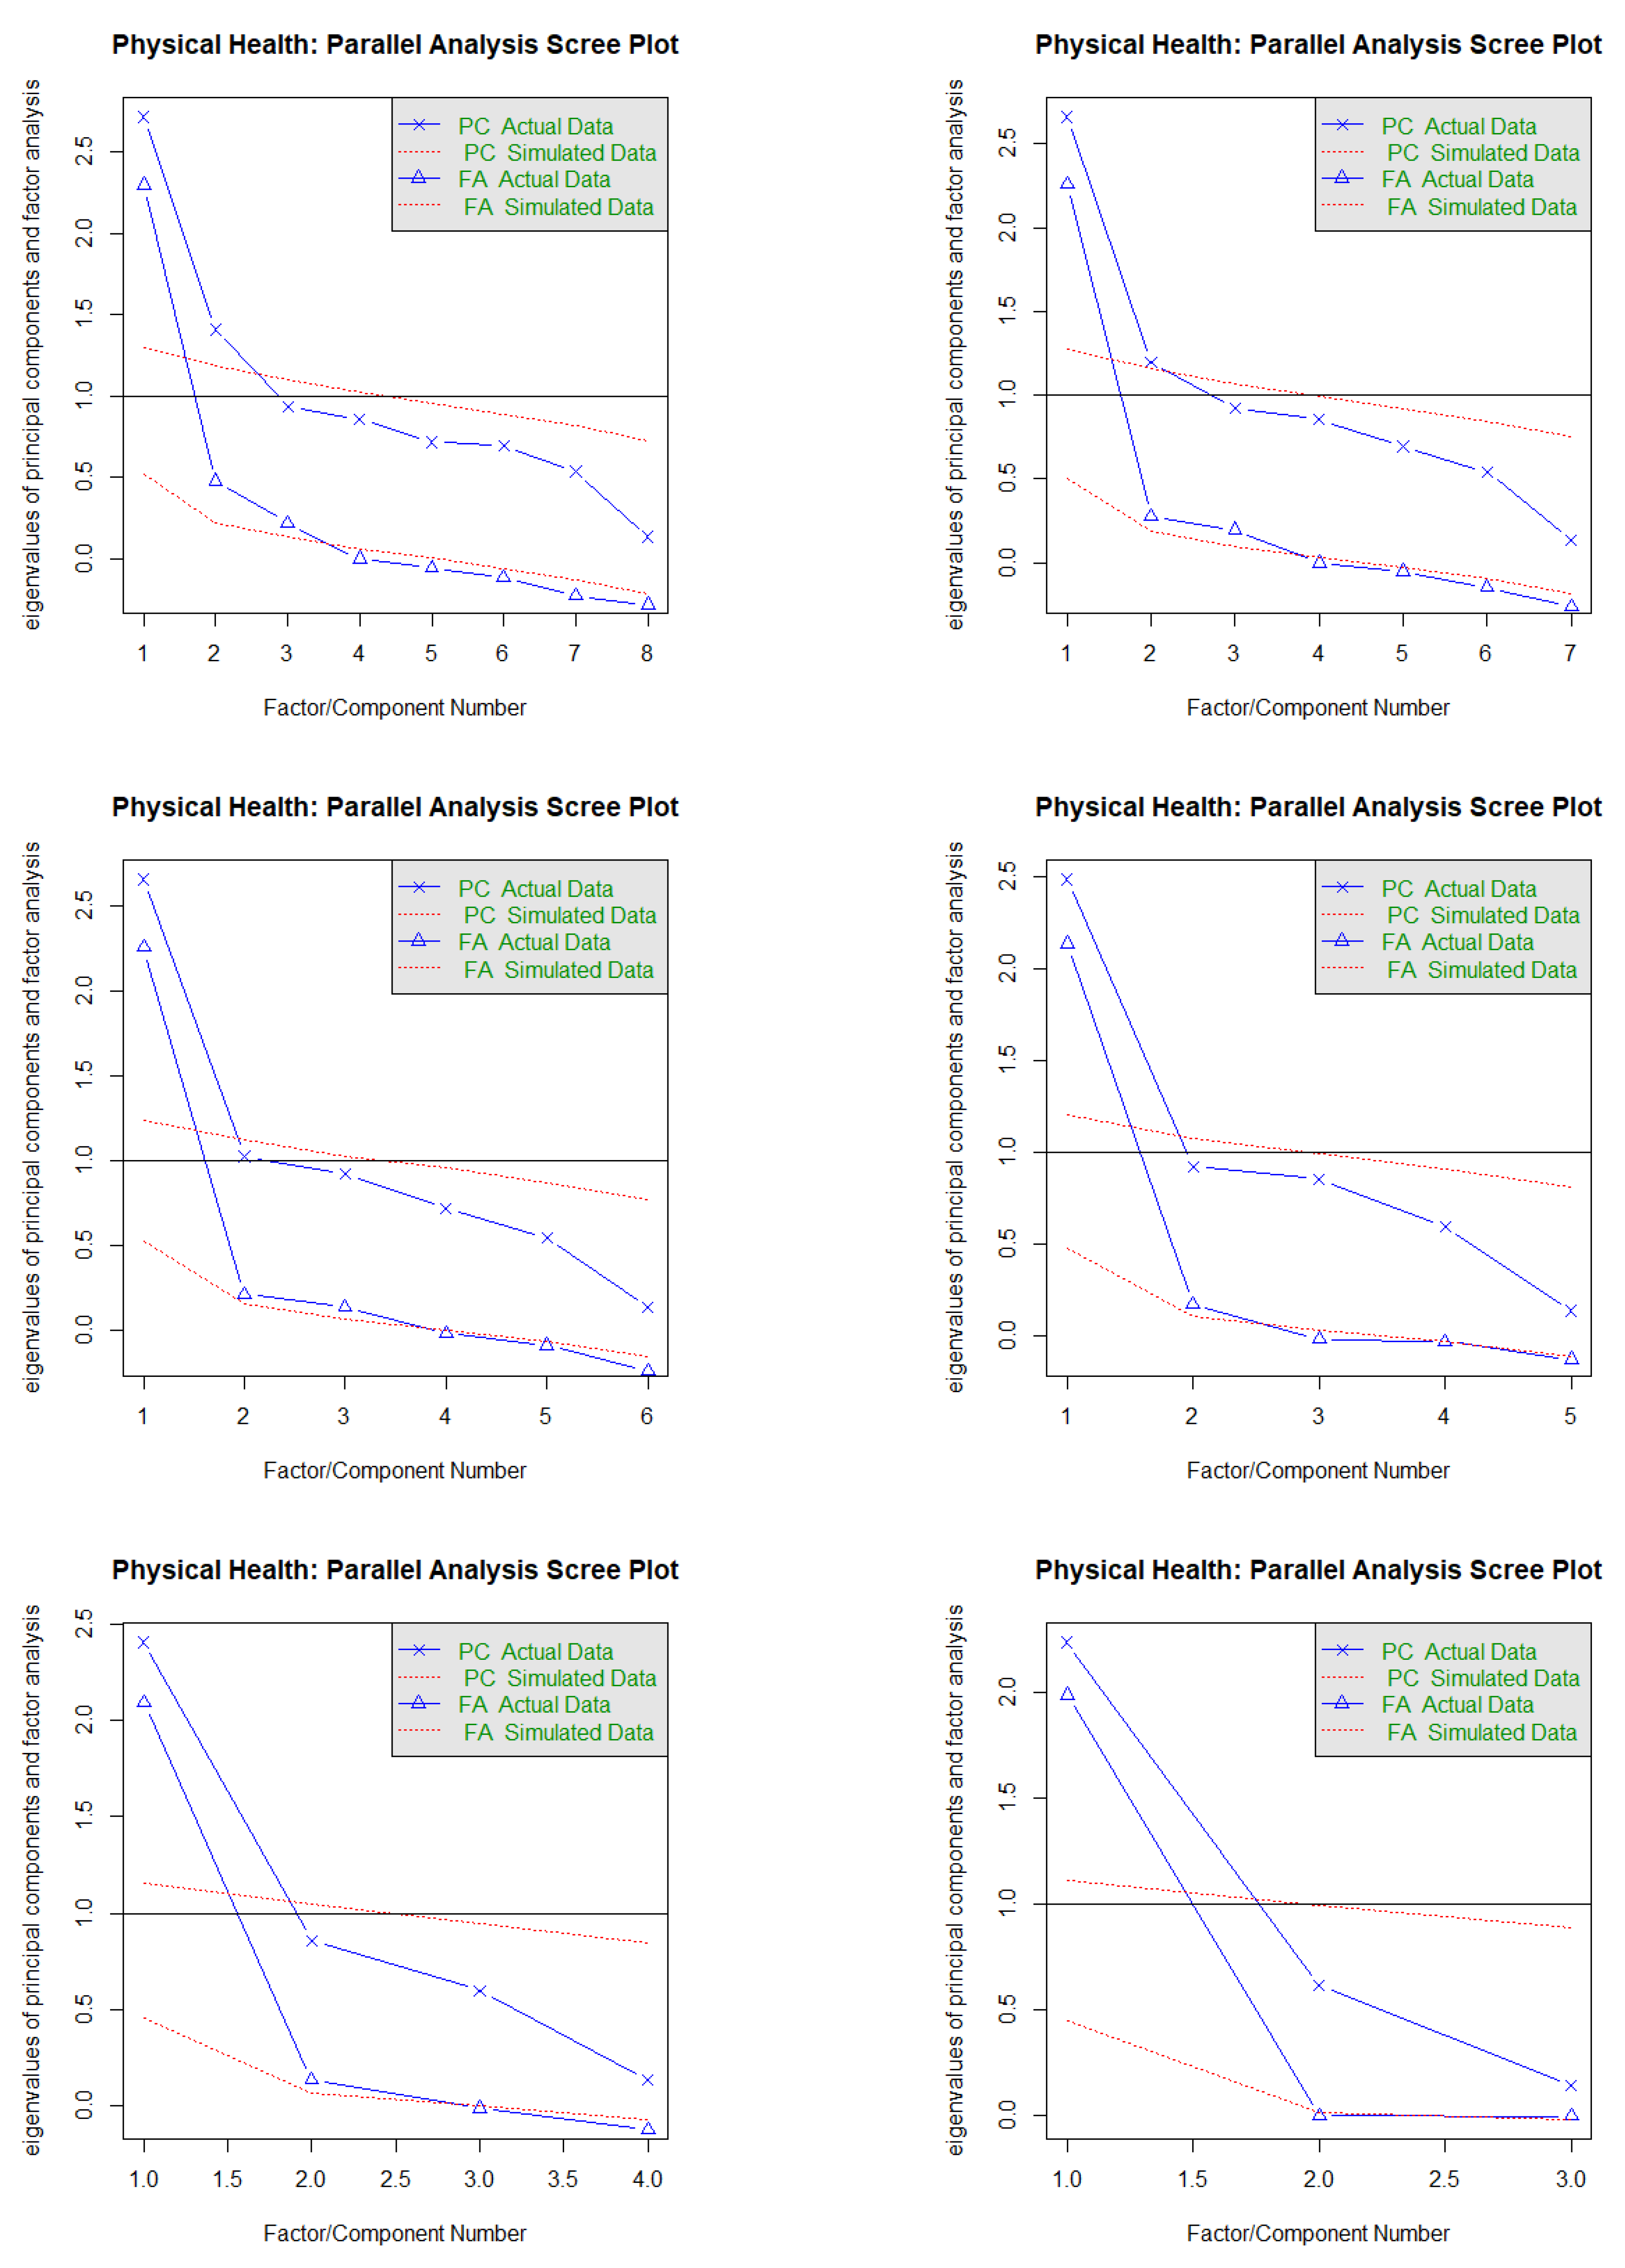
60,
61] suggested conducting a confirmatory factor analysis (CFA) to examine whether the measurement models provide an acceptable fit to the data. Once an acceptable measurement model is developed, the structural model can be examined [
60]; an acceptable model should reach cut-off values close to 0.95 for the Comparative Fit Index (CFI), Normed Fit Index (NFI), Goodness-of-Fit Index (GFI), Incremental Fit Index (IFI), and Tucker-Lewis Index (TLI), in combination with cut-off values close to 0.08 for standardized root mean squared residual (SRMR) and root mean squared error of approximation (RMSEA) to evaluate model fit.
One of the statistical presuppositions necessary for the existence of a mediator relationship between variables is that the regression of the predictor variable on the mediator variable emerges as significant. As PA is the only predictor variable of the mediators in our models, Column 1 in
Table 2 corroborates this.
The measurement model resulted in a good fit to the data (cf.
Table 4). The loadings of the measured variables on the latent variables of PWB and PD and positive and negative affect were statistically significant at the 0.001 level. This implied that PWB, PD, positive affect, and negative affect appeared to have been adequately measured by their respective indicators. Furthermore, correlations between variables were statistically significant (cf.
Table 4).
3.3. Structural Models
It was assumed at the outset of the study that PWB and PD would be the outcome variables, that physical activity (PA) would be the predictor variable, and that positive and negative affect would be potential mediator variables. We conducted SEM analyses to test a causal model between the predictor (and mediators) variables and two groups of dependent variables. Maximum likelihood was used as the estimation method.
3.4. Direct and Indirect Effects of PA on PWB, with Dimensions of Affect as Mediators
With the above considerations in mind, the PWB structural model was configured, with PA as the independent variable with direct and indirect paths to PWB, and with positive and negative affect as mediating variables. The latent variable of physical activity (PA) was established as the predictor variable, using as indicators its four items. Satisfaction with life (SWLS), physical health (PH), and avoiding drugs and narcotics (AND) were specified as indicators of the psychological well-being (PWB) outcome latent variable. Joviality (J), self-assurance (SA), and attentiveness (A) were treated as indicators of a latent mediator variable that we labeled as positive affect. Fear (F), guilt (G), hostility (H), and sadness (S) were treated as indicators of a latent mediator variable that we labeled as negative affect.
The model yielded a good fit to the data (cf.
Figure 1 panel A). Although the χ
2-value was statistically significant, the other indices were close to the recommended range. The paths from physical activity to PWB, positive affect, and negative affect were statistically significant, as were the paths from positive and negative affect to PWB. Additionally, physical activity had a significant indirect effect on PWB via positive affect and also via negative affect (cf.
Figure 1 panel A).
In summary, taken in isolation, greater levels of physical activity (PA) predict higher levels of psychological well-being (PWB). However, the dynamic becomes more complex when positive affect and negative affect are taken into account. It appears that the effect of physical activity (PA) on psychological well-being (PWB) is partially mediated by positive affect. Specifically, higher levels of physical activity (PA) were associated with higher levels of positive affect, which in turn were associated with greater levels of psychological well-being (PWB). Negative affect seems to likewise partially mediate the association between physical activity (PA) and psychological well-being (PWB), albeit in the opposite direction.
3.5. Direct and Indirect Effects of PA on PD, with Dimensions of Affect as Mediators
The same analytic procedures were used for the model predicting PD. The latent variable of physical activity (PA) as well as positive and negative affect were estimated the same way as in the model predicting PWB. The current model differed from that model in that it had psychological dysfunction as the outcome latent variable (specified via the indicators somatization (S), anxiety and insomnia (A), depression (D), and social dysfunction (SD).
As with the model for PWB, the model fit indices were good. Although the χ
2-value was statistically significant, the other indices were close to the recommended range. The paths from physical activity to PD, positive affect, and negative affect were statistically significant, as were the paths from positive and negative affect to PD. Additionally, physical activity had a significant indirect effect on PD via positive affect and also via negative affect (cf.
Figure 1 panel B).
In summary, taken in isolation, greater levels of physical activity (PA) predicted lower levels of psychological dysfunction (PD). However, the dynamic became more complex when negative affect and positive affect were taken into account. In this latter case, it appears that the effect of physical activity (PA) on psychological dysfunction (PD) was partially mediated by their positive affect indicators. Specifically, higher levels of physical activity (PA) were associated with higher levels of positive affect, which in turn were associated with lower levels of psychological dysfunction (PD). Again, negative affect appeared as another different mediator in the relationship between physical activity (PA) and psychological dysfunctioning (PD), albeit in opposite direction.
Taken together, the results from both models aligned with H6. Positive and negative affect emerged as significant (partial) mediators in the relationship between physical activity and PWB, as well as the relationship between physical activity and PD. Accordingly, change in affect might be one mechanism underlying the association between physical activity and (un)favorable psychological functioning.
4. Discussion
The findings at hand indicate that, among a sample of young Iranian adults, physical activity (PA) and dimensions of affect were associated with favorable (PWB) and unfavorable (PD) psychological functioning. Furthermore, PA and dimensions of affect were independent and significant predictors of indicators of PWB (i.e., life satisfaction, physical health, avoiding drugs and narcotics) and indicators of psychological dysfunction (PD) (i.e., somatic symptoms, anxiety and insomnia, social dysfunction, and depression). Most importantly, the results of SEM analyses showed that positive and negative affect play a mediating role between physical activity and PWB and PD. This indicates that change in affect might in part explain the frequently observed association between physical activity and (un)favorable psychological functioning, also in young adults from a non-western cultural background.
Six hypotheses were formulated and are discussed in the following. As expected in H1, higher PA was associated with higher PWB and lower PD among young Iranian adults, confirming what past research found regarding other samples [
1,
2,
3,
12,
15,
30,
62,
63]. Consequently, we believe that interventions to promote PA in Iran and elsewhere would likely have a positive impact on indicators of PWB and reduce PD. Furthermore, the results suggest that higher PA scores appeared to impact both positive and negative psychosocial dimensions. Since both are not necessarily co-occurring (cf.
Table 2), higher PA levels appeared to be associated with a “double” psychological benefit.
As expected in H2, higher scores of positive affect were associated with higher PWB and lower PD for the Iranian sample, consistent with previous findings for other samples [
17,
37,
41,
64,
65]. More specifically, we confirmed that the previous finding of a relationship between positive affect and higher PWB or lower PD also applies in early adulthood in a non-Western context. Similarly, and confirming our third hypothesis, similar to other studies [
41,
66,
67,
68,
69,
70], higher scores of negative affect were associated with lower PWB and higher PD.
To explain the results of H2 and H3, the present data do not provide any deeper insight into underlying psychological or physiological mechanisms, though previous studies showed that dimensions of affect might be an outcome of regular PA [
39,
71,
72] or might result in PA [
41,
73,
74,
75]. Based on prior research, we anticipated that positive affect and negative affect would be relevant to PA and PWB/PD and are worth investigating. Yet, ultimately, experimental studies are necessary to assess causality.
In general agreement with our fourth hypothesis, PWB indicators (life satisfaction, physical health, and avoiding drugs) were independently predicted by high PA, high positive affect, and low negative affect. The results were rather clear-cut (see
Table 3). However, some variations emerged per indicator, e.g., the relative contribution of negative and positive affect did not reach statistical significance for physical health, although
p values were below 0.10 and only rose above 0.05 when entering both dimensions of affect jointly into the equation. As per direct health consequences, it could be that PA alone plays a more important role in physical health than affect (or a reverse causal link inflates such a connection). Similarly, PA was the strongest predictor for avoiding drugs/narcotics, and the relative contribution of positive affect did not reach significance. Yet, per the cultural setting, this could differ in contexts with less restrictive laws on substance use. Negative affect emerged as the strongest predictor for life satisfaction. The latter resonates with the idea of a negativity bias regarding life satisfaction [
76]: negative affect seemingly often does more harm to life satisfaction than positive affect does to enhance it.
In our fifth hypothesis, we expected that PD indicators (somatic symptoms, anxiety and insomnia, social dysfunction, and depression) would be predicted independently by lower PA, poorer positive affect, and higher negative affect. The results were rather clear-cut (see
Table 3). Specifically, PA in combination with dimensions of affect explained 55%, 58%, 55%, and 59% of the variance in models of somatic symptoms, anxiety/insomnia, social dysfunction, and depression, respectively. However, physical activity was no longer a significant predictor of depression when also considering dimensions of affect. Given their high ß coefficients, we interpreted that, for this subdimension of PD, a full mediation via dimensions of affect are viable. Negative affect was the strongest predictor on all subdimensions, except for social dysfunction, where positive affect was the strongest predictor. Our results are generally consistent with research that found connections between affect and somatic symptoms [
77,
78,
79,
80], depression [
81,
82,
83,
84,
85], anxiety [
86], and social dysfunction [
38,
87]. Our results also indicate that affect predicts such outcomes above and beyond PA, at least for Iranian young adults.
The above-mentioned regression results generally supported H4 and H5. The measurement model showed that the specific subdimensions of PWB and PD could indeed be grouped into those higher order constructs (cf.
Table 4). Yet, the regression results highlight that some variability does exist concerning the relative contribution of PA, positive affect, and negative affect to the specific PWB and PD subdimensions. Although beyond the scope of the current study, further exploring this and the mediating potential of affect per subdimension could be an avenue for future research.
We found support for our sixth hypothesis, that affect would mediate the relationship between physical activity and favorable and unfavorable psychological functions. Namely, PA was related to positive and negative affect in the structural equation models. PA directly predicted PWB and PD and indirectly predicted PWB and PD via positive and negative affect.
Results of the present study, informed by a health psychology framework, provide support for one apparent dynamic underlying the PWB and PD phenomenon. In isolation, it appears that Iranian adults with higher levels of PA tend to exhibit greater levels of PWB and lesser levels of PD. Presumably, higher levels of physical activity may increasingly sensitize Iranian young adults to the need to modify how they experience psychological functioning in the inside/outside world. However, this isolated effect appears to belie a more complex dynamic. Using the present data, we were able to account for the additional factors of positive and negative affect. Results were consistent with the premise that greater levels of physical activity lead to a stronger positive affect (and lower negative affect), which in turn produces higher levels of PWB and lower levels of PD. As such, it would appear that efforts to link dimensions of affect to PA and enhance levels of positive affect (and decrease levels of negative affect) during PA could be an effective means toward boosting psychological functioning. Additionally, positive affect (and the absence of negative affect) likely reinforces the desire to engage in PA, thus making positive affect an important key in promoting and sustaining health behaviors and outlooks.
Despite the novelty of findings, several limitations warrant against the overgeneralization of results. First, we relied entirely on self-report data. More objective measures of PA could yield different results. Second, the present pattern of results might be due to further latent, unassessed dimensions, which could have biased two or more variables in the same direction. This holds particularly true for anthropometric data (height; weight; BMI). Third, no objective physiological data were collected; such data might have allowed us to illuminate the underlying neurophysiological processes linking physical activity, dimensions of affect, and PWB (or PD). Fourth, the data do not provide insights into possible work-related, stress-related, or motivational issues underlying current PWB, PD, PA, and dimensions of affect. Though highly speculative, one might assume that workload, job insecurity, family strain, financial issues, academic stresses, or further, e.g., sociopolitical stressors, might have an impact on cognitive emotional processes involved in PWB and PD indicators and in PA. Thus, under certain circumstances, PA could be especially effective, producing positive affect and promoting positive psychological functioning, but the data did not include sufficient information to account for such circumstances. Fifth, given the close association of positive and negative affect with PD indicators, it is conceivable that PD indicators were an epiphenomenon of broader dimensions of affect. Sixth, a longitudinal or experimental study design would be needed to assess causality. Seventh, and relating to the previous point, the cross-sectional nature of the current study means that less distinction can be given to the conceptually important difference between trait- and state-related positive and negative affect. In a cross-sectional design, even a measurement that makes reference to affective states is simply a recollection of the participants overall estimation at the time of filling in the survey. Ideally, future research within longitudinal or experimental designs should assess affective states during or immediately after physical activity. Including additional affect-related items or introductory statements that make a reference to the trait-state distinction might also help. Eighth, and likewise relating to the study design,
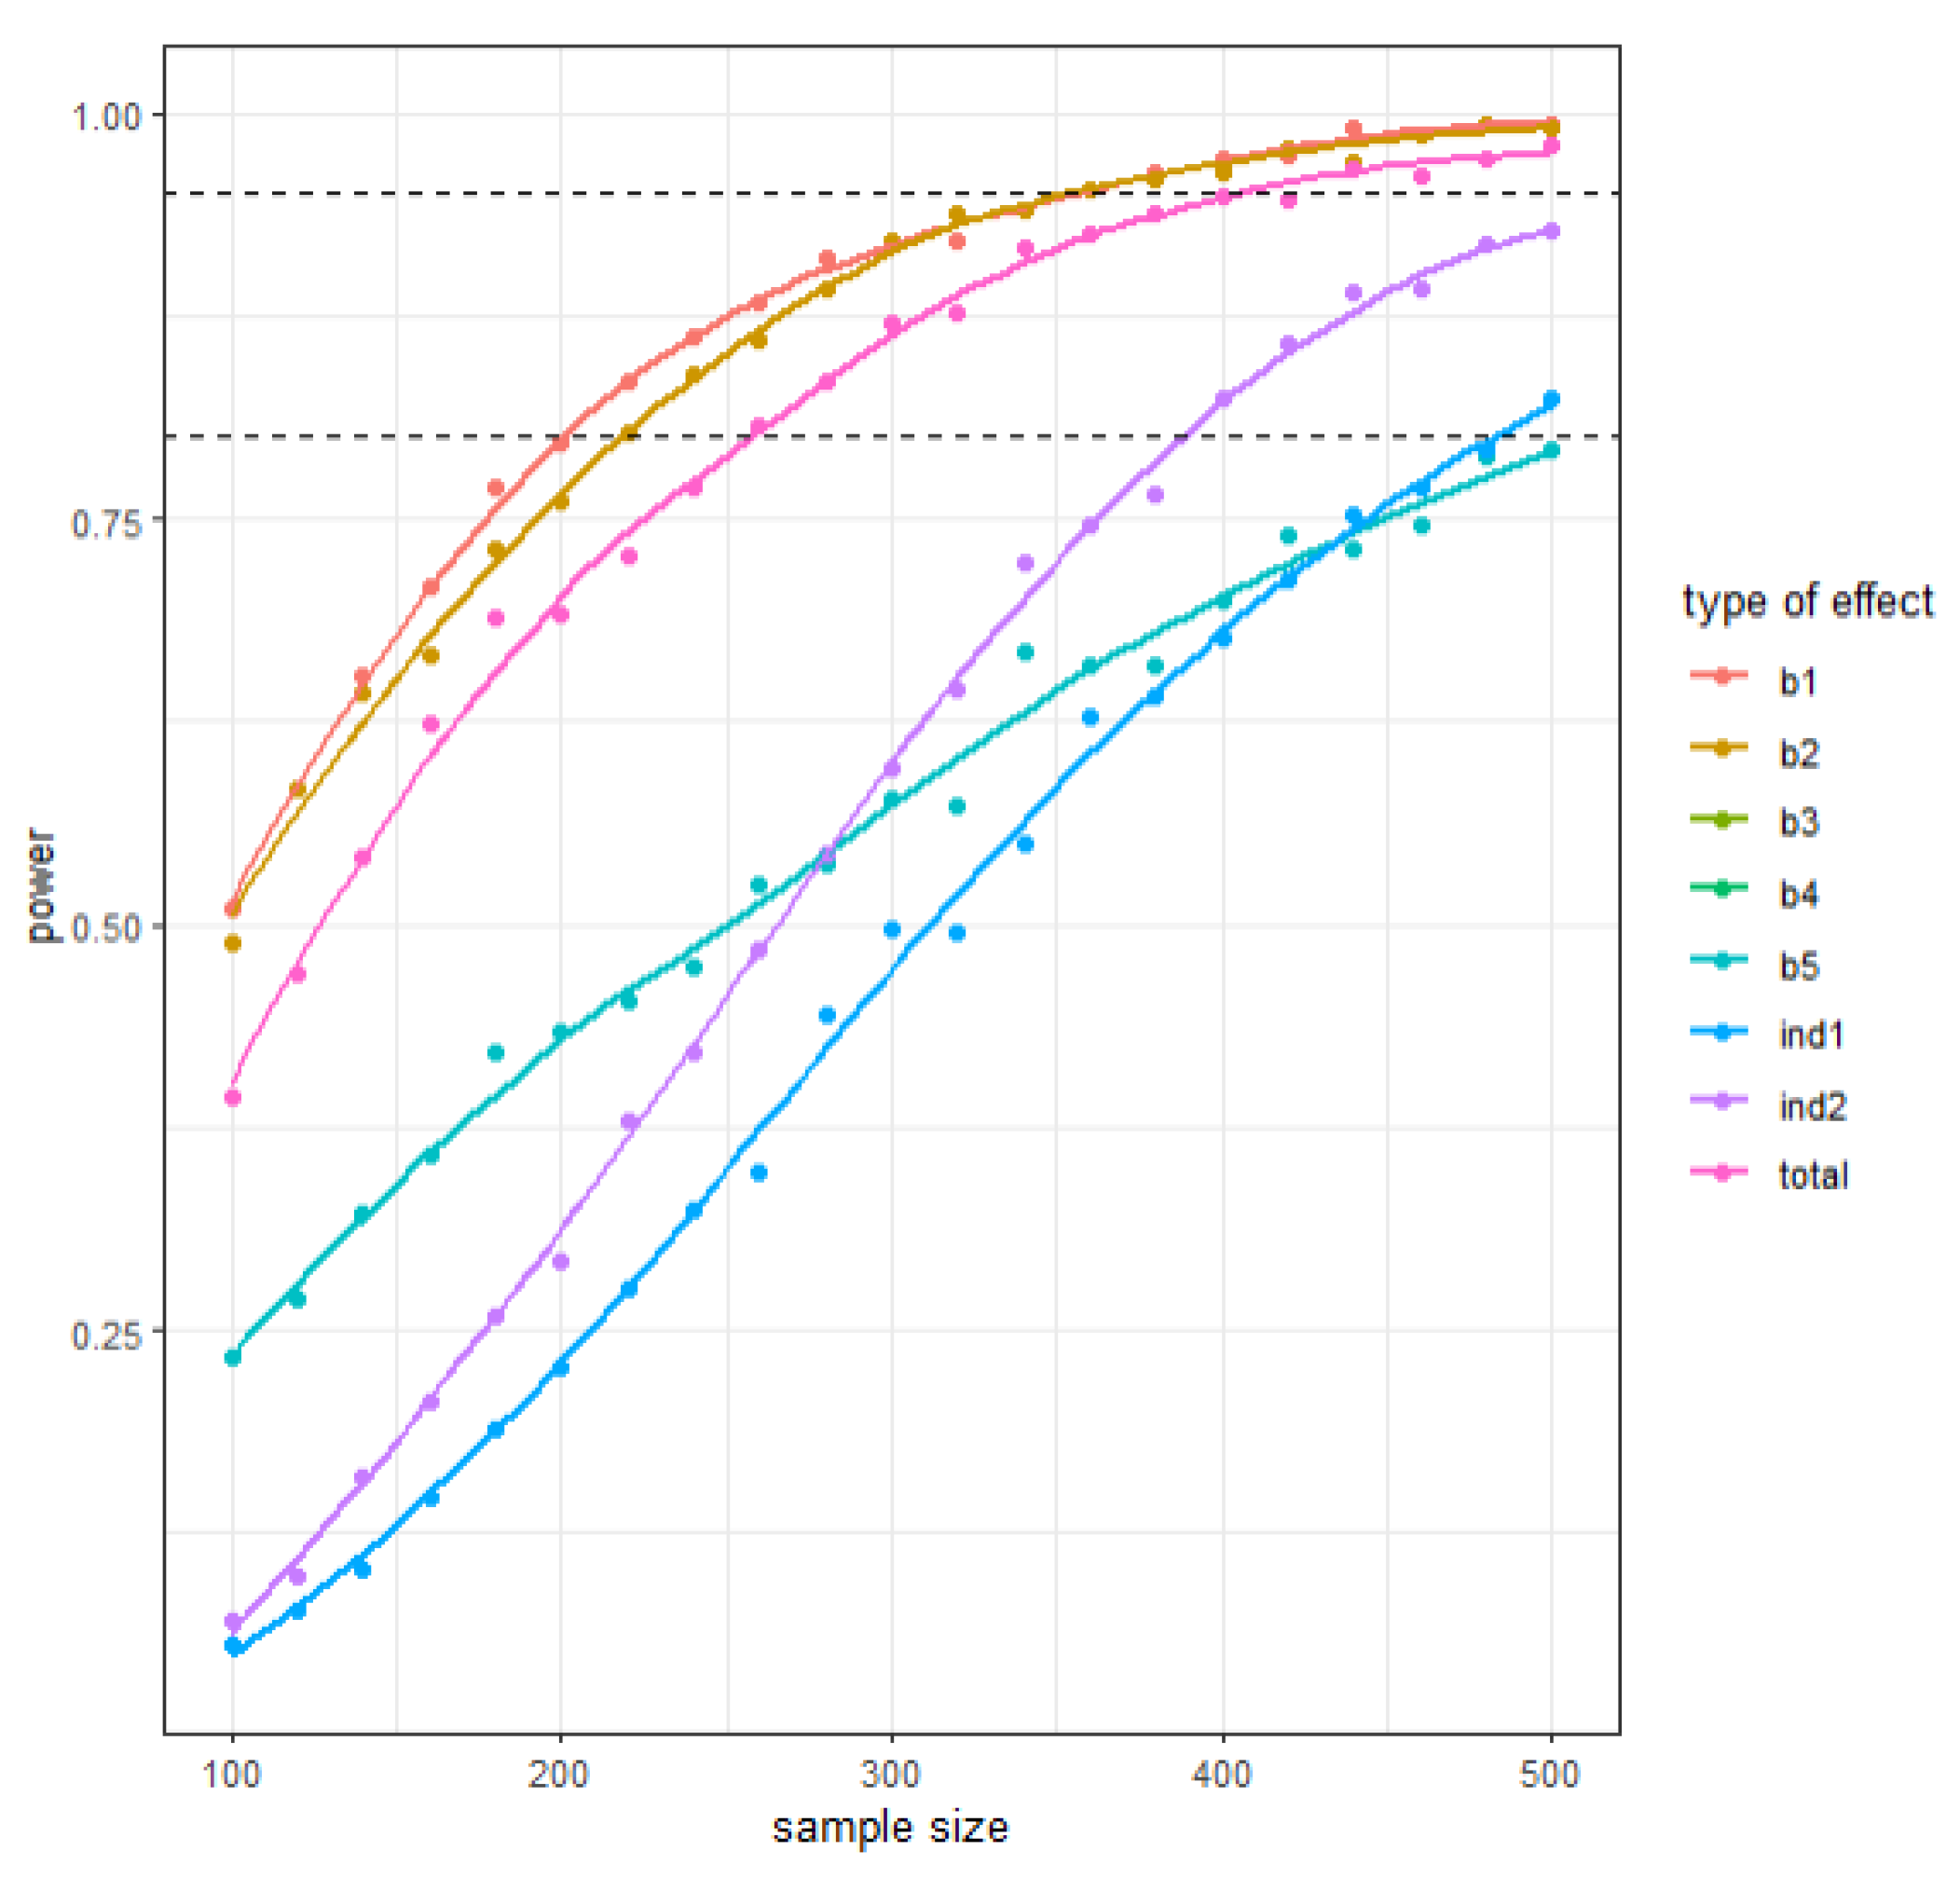
Appendix B highlights sample size-related limitations pertaining to statistical power. The method for conducting SEM power analyses described in [
50] might guide future research to help minimize such issues, and model characteristics emergent from the current study might supply future research with parameters for conducting a priori power analyses to gauge sample size requirements.


 ,
, 
