Article

Estimating the Methane Potential of Energy Crops: An Overview on Types of Data Sources and Their Limitations

Water and Environmental Engineering Group, University of Southampton, Southampton SO16 7QF, UK
*
Author to whom correspondence should be addressed.
Processes 2021, 9(9), 1565; https://doi.org/10.3390/pr9091565
Submission received: 25 July 2021 / Revised: 18 August 2021 / Accepted: 28 August 2021 / Published: 1 September 2021
(This article belongs to the Special Issue New Frontiers in Anaerobic Digestion (AD) Processes)

Abstract

:
As the anaerobic digestion of energy crops and crop residues becomes more widely applied for bioenergy production, planners and operators of biogas plants, and farmers who consider growing such crops, have a need for information on potential biogas and methane yields. A rich body of literature reports methane yields for a variety of such materials. These data have been obtained with different testing methods. This work elaborates an overview on the types of data source available and the methods that are commonly applied to determine the methane yield of an agricultural biomass, with a focus on European crops. Limitations regarding the transferability and generalisation of data are explored, and crop methane values presented across the literature are compared. Large variations were found for reported values, which can only partially be explained by the methods applied. Most notably, the intra-crop variation of methane yield (reported values for a single crop type) was higher than the inter-crop variation (variation between different crops). The pronounced differences in reported methane yields indicate that relying on results from individual assays of candidate materials is a high-risk approach for planning biogas operations, and the ranges of values such as those presented here are essential to provide a robust basis for estimation.

1. Introduction

Anaerobic digestion (AD) of organic materials is a proven technology to produce renewable energy in the form of biogas along with a useful soil conditioner and biofertiliser [1,2]. In agriculture, AD has traditionally been applied to treat cattle and other livestock slurries, but these are low-value substrates in terms of energy content [3,4]. To improve the energy yield, a frequently applied strategy is co-digestion, where manure is combined with energy-rich biomass such as food waste or other types of organic wastes, including crop residues or biomass grown for this purpose, i.e., energy crops [5,6,7]. As bioenergy production from crop-based materials and residues becomes more widespread, there is a need for information on potential biogas and methane yields of such biomass types. The information is required as a basis for the selection of crop materials to be grown and digested, in whole or part; as a reference when estimating potential energy production; and as benchmark to evaluate performance of biogas facilities [8].
Many sources of information are now available on the methane potentials of various crop materials. These include scientific journal papers, agricultural textbooks and reference works, and more recently online databases. For individual crop types, the published values have been compiled in review articles. Some address methane yields reported for lignocellulosic crops [9,10,11,12]. Others focus on a selection of the most widely grown agricultural crops across Europe [13,14,15], on some frequently digested energy crops [16,17,18], or on single biomass types such as grass silage [19]. These have established a robust knowledge base about average methane yields reported in the literature. However, there is still a lack of a comprehensive overview on the nature of works informing about methane potentials, along with an assessment of the variations in methane yields reported. Some of the quoted yields have been determined using repeatable laboratory-based tests; others come from data collected from full-scale digesters, and some are calculated values based on the elemental composition or the content of protein, fat, and carbohydrates. Thus, the outcome may be a range of values for a given crop material, due both to the nature of the substrate being tested and to differences between methods of determining the methane yield.
This paper presents the results of a review of literature values for the methane yields of various crop materials, particularly those commonly grown in European conditions. The main aim is to support practitioners and researchers in adequately placing single values reported in the literature into context and to make them aware of the risks of too strongly relying on one single value found in a publication. This work captures the diversity of information and the range of methane yields that a practitioner or researcher is likely to encounter when searching for a reference methane value for a specific crop material of interest. To explain some potential sources of variation, the results are structured into sections based on the methodology used to obtain them. The paper is not intended as a full technical review of single methods or test protocols; the focus is on clarifying the main approaches used and on highlighting potential limitations regarding the usage of literature data.

2. Materials and Methods

This work reviews the characteristics of literature data published on methane yields of crop biomass and establishes an overview of the variety of values reported. A full systematic review of all existing data for a specific type of biomass is not within the scope of this work; the methodology is explorative in so far that literature is selected which is likely to inform practitioners and researchers who are looking for reference values to estimate the potential methane yield of a crop material. In line with this goal, the focus is on data that have been effective in informing others, and thus, only results that have been quoted more than once by other authors are included. The body of literature reviewed is the outcome of applying the snowball scheme to the review articles mentioned in Section 1; i.e., literature listed in review articles was taken as a starting point. The analysis focuses on original (primary) data, i.e., by default, data are taken from the original source. Many publications, when indicating methane yields, quote earlier works of the authors or reference data from papers by others. Such secondary sources are not included here; in each case, data were tracked back to the original source. In addition, only methane potentials of commonly used crop-based biomass are considered. This includes data from biomass pre-treated using methods regularly applied at full-scale installations, such as ensiling, but not data reported after experimental pre-treatments that are not yet in widespread use. Furthermore, the focus is on crops that are commonly cultivated under European conditions. The values presented include data published in the research literature but also from the technical press, conference presentations, and web-based databases.
Literature sources are structured according to the main methodology applied to study the methane yield from a biomass. For each case, the type of method by which the results were determined is presented, and the reported methane yield is given in accompanying tables. Many studies document the results from several repetitions, and in some cases, certain results are excluded by the researchers after critical reflection. In line with the goal of this study, the value taken from each publication is that communicated by the authors as representing the methane yield determined in their work; this typically is the average of several repetitions. Each such published result is taken as one data point for the dataset of this work. Then, the range of methane yields reported for crop materials is presented and discussed.
To the extent possible, the comparability of data is facilitated by referring to a common set of standard terms. When describing both the results of analyses and the methods used, different authors use different terminology. Tests on physicochemical characteristics are usually conducted according to standard methods such as those of the International Organisation for Standardisation (ISO) or national standards. Total solids (TS) content is the material left after water has been removed, usually by drying at 103–105 °C, and it is also widely referred to as dry matter (DM) (TS is used in this work). Volatile solids (VS) may also be referred to as organic dry matter (ODM), volatile dry matter (VDM), or loss on ignition (LOI): it corresponds to the material that ignites at temperatures up to 550 °C and is the fraction from which biogas is produced. VS may be expressed as a percentage of TS or of the original fresh matter (FM), which is sometimes referred to as wet weight (WW). Biogas or methane yields may be expressed in terms of VSadded or VSdestroyed. VSadded refers to the amount of substrate VS added to the digestion, not all of which may be converted into biogas. VSdestroyed is the amount of substrate VS that was degraded in producing the biogas, which is always less than or equal to the amount added. Some publications express biogas or methane yield in terms of TS or FM rather than VS, and sometimes, COD (chemical oxygen demand) is used (rarely employed in the case of crop biomass); where possible (i.e., where the relevant information is provided by authors), such values are converted to the VS basis in the following.
For all experimental methods employing AD, one important aspect for reporting purposes is the method used for gas collection and for the conversion of gas volumes to a standard temperature and pressure (STP). As illustrated in the next sections, the standard conditions used vary and are sometimes not stated, or no correction has been applied. This may have significant implications when comparing methane potentials, as 1 litre of methane at 1 standard atmosphere (101.325 kPa) and 0 °C equals 1.13 litres (L) at 1 atmosphere and 35 °C, which is a temperature frequently used in mesophilic AD processes. Wherever possible, in the following text, reported values have been converted to yields in terms of m3 CH4 kg−1 VSadded at STP of 0 °C and 101.325 kPa to facilitate direct comparison; where no information is given on the temperature and pressure conditions used, this is noted, and gas volumes are taken as reported.

3. Results

3.1. Overview on Types of Testing Methods Applied

Details of the types of methods used to determine methane yields of crops or crop residues are given in the following sections. These methods can be structured into several groups:
  • Biochemical methane potential (BMP) tests and other long-retention batch assays;
  • Short-retention batch tests;
  • Continuous/semi-continuous tests;
  • Theoretical calculations.
Most of the data reported in the literature originate from laboratory-scale experiments. Laboratory-based methods are of two main types: batch tests to determine the specific methane potential, and continuous trials, which are mostly applied to determine the specific methane production under a selected AD regime. Laboratory-based batch tests have several advantages when evaluating methane potentials. They facilitate the inclusion of control substances with a known methane yield so that the experimental setup can be validated. Multiple replicates can be used, which is seldom the case in large-scale determinations, and the tests can be operated under optimal conditions including the addition of nutrients that might otherwise be limiting. To determine methane potentials, the most widely used batch tests are BMP or other long-duration AD tests, with a retention time of 35 days or longer: this differentiation into BMP tests and other long-duration batch tests is only arbitrary in so far that it reflects that some tests are specified in the literature as being BMP assays, while others are reported more generally as being batch tests. Some authors have conducted short-retention batch tests to evaluate the methane yields of different crop materials (see Section 3.3). Others employed continuously or semi-continuously operated digesters (Section 3.4). Kinetic data from experimental studies are sometimes used in modelling to estimate potential values, as reviewed by Pererva et al. [20] and Raposo et al. [21]; these estimates may be presented with or without experimental values, but only experimental data are considered here.
In addition to experimental AD tests, some authors employed predictive methods based on biochemical composition of the biomass to determine the specific methane potential (Section 3.6). There also exists a set of literature that does not disclose which method was applied to determine the indicated methane yields (Section 3.7).

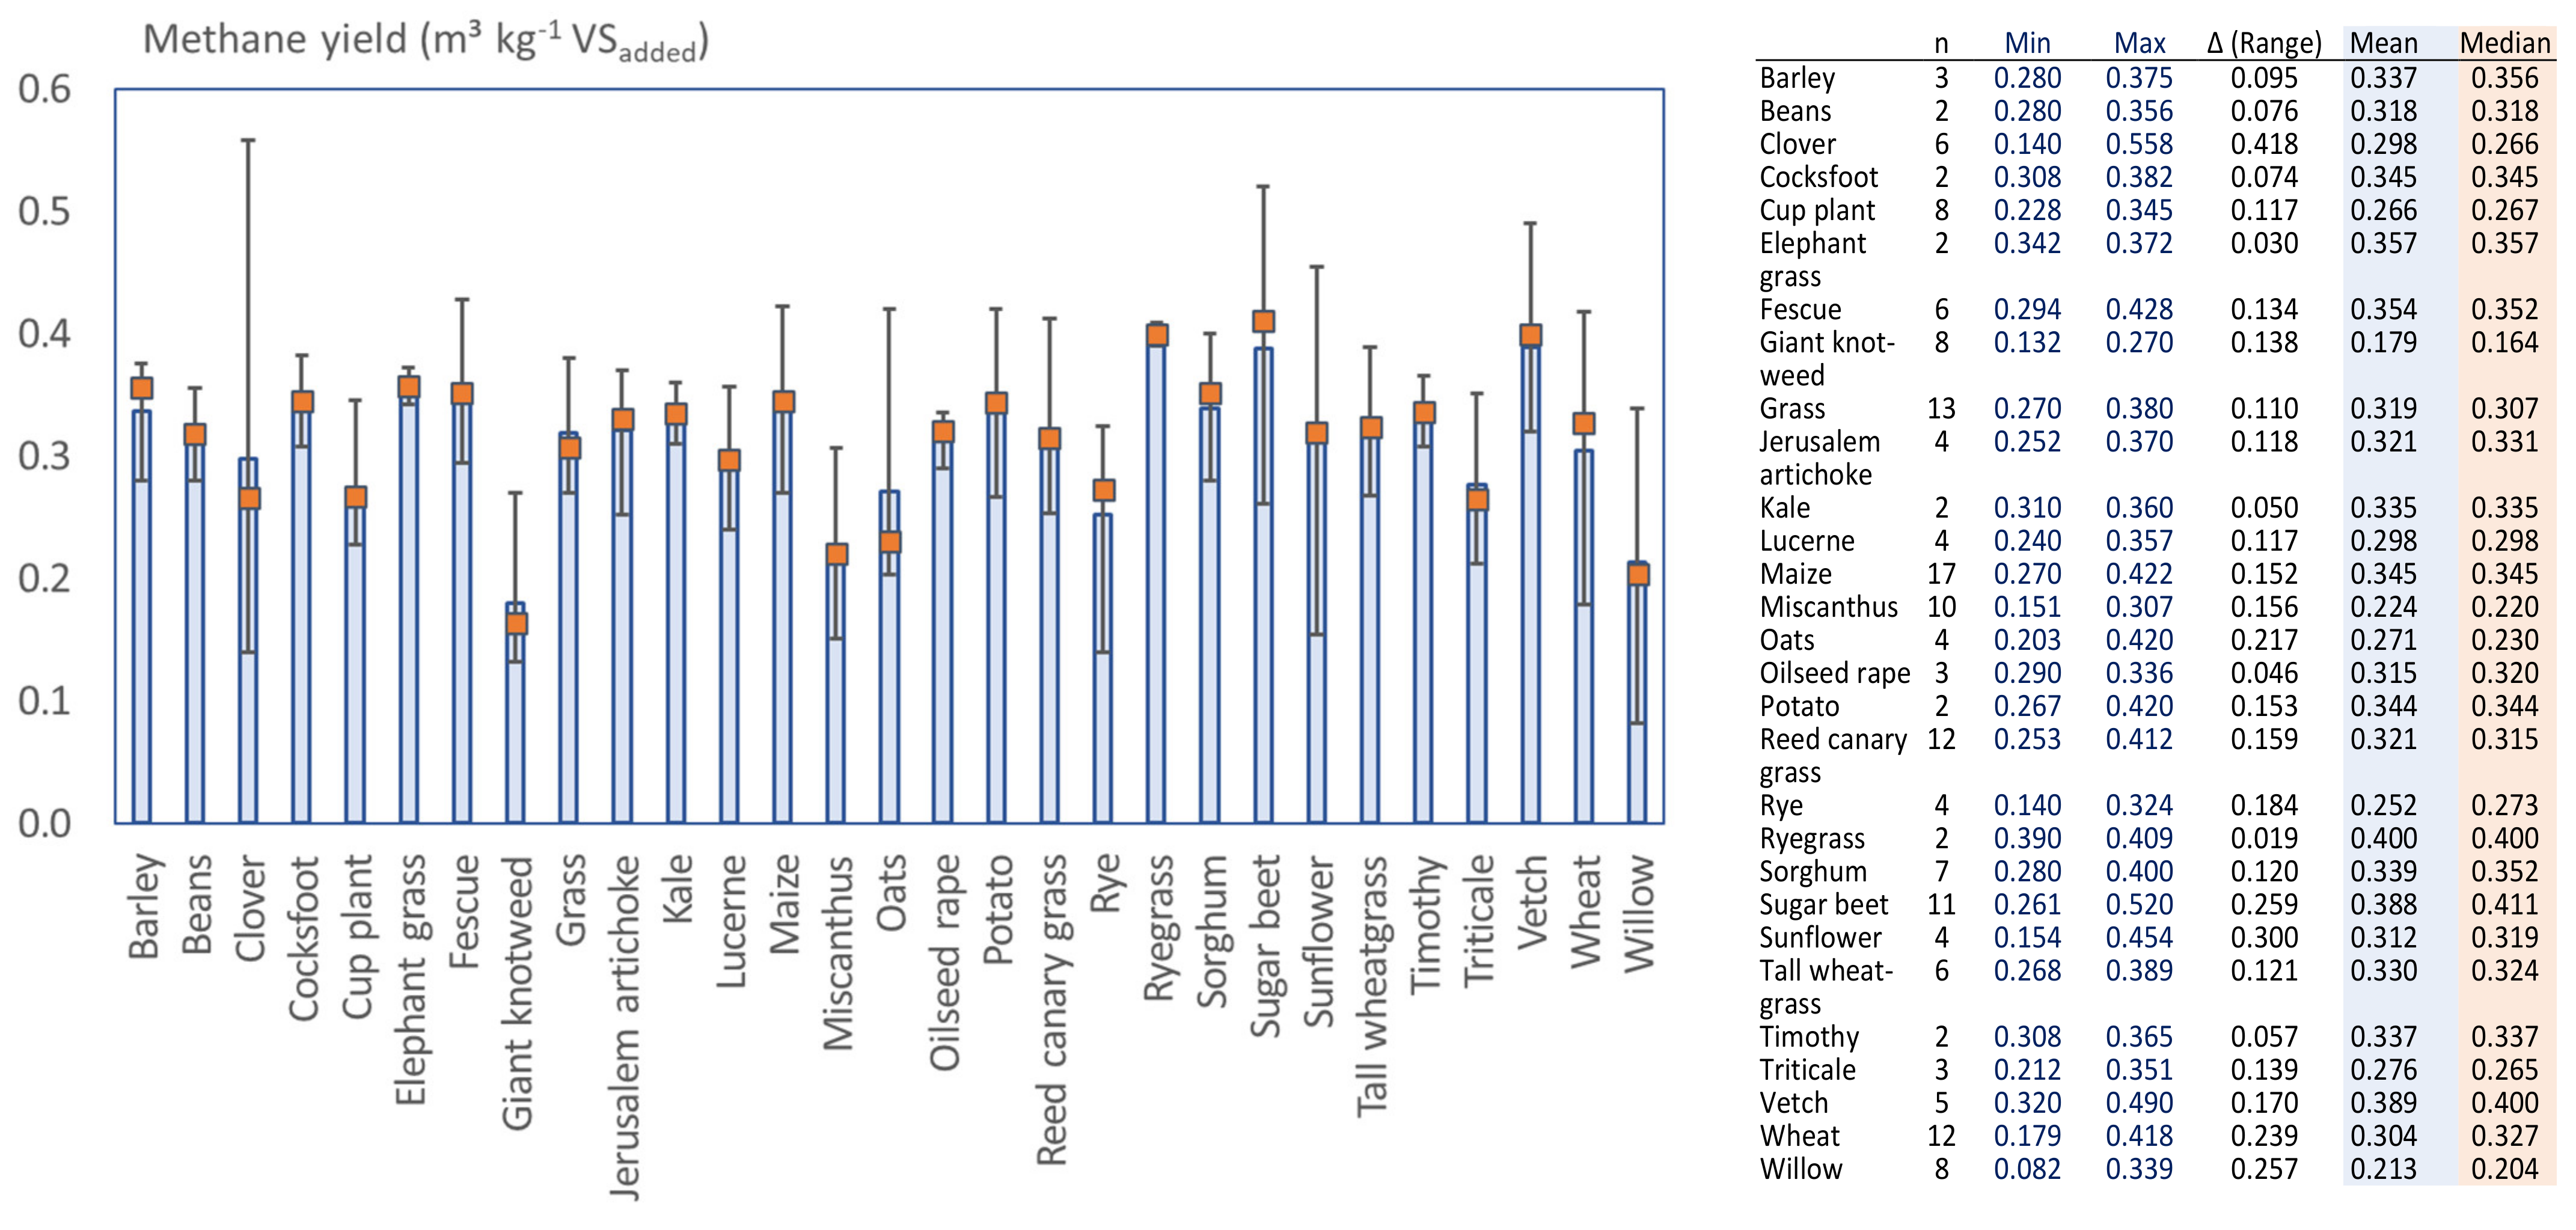
3.2. Methane Potentials Obtained in BMP and Long Retention Batch Tests

BMP tests are a form of extended batch test. The BMP of an organic material has been defined as the ultimate specific methane production under optimised digestion conditions for an indefinite degradation time [22,23,24], where optimised refers to the environmental conditions for microbial degradation rather than any pre-treatment of the substrate. This provides information on the energy potential of a biomass when used in AD [25,26] and thus serves as a decision basis for choosing a specific material for biogas production. Furthermore, the BMP value is often used as a benchmark to assess the efficiency of digester operation. Comprehensive reviews of factors affecting the performance of anaerobic batch tests can be found in Raposo et al. [15,21], and reviews of those affecting repeatability can be found in Mittweg et al. [27]. An inherent feature of well-conducted BMP tests is the establishment of an optimised digestion environment, in which the biochemical process will run without inhibition [28]. Different experimental protocols have been developed to determine BMP values [29,30,31], and some efforts at standardisation have been made (see below), but different regimes and set-ups continue to be used [30].
In practice, BMP assays are batch experiments in which a known amount of the test material is mixed with a sufficiently high quantity of inoculum that contains a mixed microbial population capable of carrying out the AD process [26]. The headspace of the test vessel is usually purged before sealing. While purging with N2 removes oxygen and generates anaerobic conditions, an N2/CO2 mix containing 20–40% CO2 is preferred in order to minimise pH changes due to loss of CO2 from the test matrix: this is especially important if the matrix is not heavily buffered and the headspace volume is much bigger than that of the test solution [24]. Then, the vessel is maintained at a constant temperature, which may be mesophilic or thermophilic, usually depending on the source of the inoculum and/or the process under consideration. The contents of the vessel may or may not be stirred or agitated. The quantity of biogas produced is monitored, and the biogas itself is released either continuously or on an intermittent basis. In this way, a kinetic curve for gas production against time can be determined. The biogas composition is generally analysed through gas chromatography (GC) or infrared analyser (IR) to determine the percentages of methane and carbon dioxide; alternatively, the CO2 fraction may be removed by reacting e.g., with sodium hydroxide to give methane only, in which case CO2 content can be determined by back titration. The BMP assay usually ends when biogas production ceases, e.g., when the cumulative biogas production curve flattens, or when biogas production from the test sample is the same as from an inoculum-only control. This can be as short as 50 days for substances such as cellulose [23] or may take 100 days or more for some crop-based materials due to their lignocellulosic content [32]. In a recent attempt to standardise BMP tests, it is recommended that the test is terminated when the daily net methane production during three consecutive days is less than 1% of the accumulated methane produced from the substrate already [24,31], although the duration of the test should also be taken into consideration for unexpected degradation patterns or inhibition effects [33]. The inoculum must necessarily be digested separately (under the same conditions) to obtain a control value (amount of methane produced by the inoculum only); this control value must be deducted from the results of the test vessels to obtain the yield attributed to the actual test substrate. When using this type of data, it is important to note whether it represents methane or biogas production, as the proportion of methane contained in the biogas varies with both the material digested and the point of time within the assay. Dividing the methane yield attributed to the test substrate by the amount of substrate added gives the specific methane yield. The specific methane yield of the test material may be expressed in units of m3 (STP) kg−1 VSadded or m3 (STP) kg−1 TSadded, or another unit, as appropriate.
The BMP results reported by different authors are given in Table A1 (Appendix A), and the variations are shown in Figure 1.
As noted, there is no single standard method for BMP determination. One of the earliest attempts to standardise the analysis was the approach put forward by Owen et al. [34]. Using 250 mL reagent bottles with a serum cap, the substrate and a broad-spectrum inoculum (e.g., from an anaerobic digester treating municipal wastewater biosolids) are added with a stock nutrient solution, and the test samples are maintained at a constant temperature; gas volumes are measured using a glass syringe in which the plunger is allowed to move horizontally until in equilibrium with atmospheric pressure. Jerger et al. [35] applied this procedure to sorghum in a 60-day incubation at 35 °C; biogas production and methane content were reported as adjusted to STP, but conditions were not stated. Gunaseelan [32] adopted the method to carry out tests on a range of crop materials in 135 mL bottles at 35 °C. Then, 500 mL test units (sealed serum bottles), maintained at 37 °C, were used by Zauner and Küntzel [36]; biogas was removed with calibrated glass syringes and volumes were converted to 0 °C and 101.29 kPa. It is not stated whether the syringes were left in place and allowed to equilibrate to ambient pressure as in Owen et al. [34], or pressure was allowed to rise in the system and then intermittently released.
In most systems, the generated biogas leaves the reactor, and its quantity is measured through gas counters, water displacement, or other methods (see below). Some systems accumulate biogas within the reactor; these employ sealed serum bottles where the biogas is occasionally released to determine the BMP of the studied substrate. The raised pressure alters the partitioning of gases between the liquid phase and the headspace and can potentially affect the degradation kinetics of digestion; careful management and reporting of both the pressure regime and the depressurisation stage is necessary to obtain reliable results. For winter rye, oilseed rape, and faba bean, Petersson et al. [37] adapted a method originally employed by Hansen et al. [38] for solid organic wastes, using sealed flasks with occasional pressure release. This method used 100 mL serum flasks that were placed in a shaking water bath at 42 °C for a 67-day period. Methane yield was calculated by taking samples of known volume with a pressure-lock syringe before and after pressure release and measuring methane concentrations by gas chromatography, thus determining the mass of methane present. Sealed 500 mL bottles with intermittent pressure release to an acidified water displacement column have been used by a number of researchers to study energy crops [39,40,41,42]. Wahid et al. [43] also used 500 mL pressurised bottles in 90-day assays on miscanthus, but it is unclear whether gas volumes were calculated from headspace pressures or gas was released to a gas bag. The method is not explicitly stated, and reference to a publication is made; however, two different methods are employed there. Jurado et al. [44] employed sealed 117 mL vials to measure methane potentials of miscanthus, wheat straw, and willow over 50 days; no details are given on how gas volumes were determined. Kakuk et al. [45] used sealed 160 mL bottles at 37 °C in a 45-day assay for willow; equipment and correction to STP are not clear.
Two attempts to standardise BMP testing were made in the German standards DIN 38414-8 [46] and VDI 4630 [47,48]; the development of these guidelines has been described elsewhere [26]. The DIN method (originally mainly applied in the wastewater sector) describes the use of eudiometer tubes for gas collection. VDI 4630 builds on DIN 38414-8 but addresses the use of small-scale digesters more generally, and it provides specific guidelines for the duration of the digestion. Batch experiments are continued until only a relatively small volume of gas (<1% of the cumulative total up to this point) is released each day. Scaled wet gas meters or precision rotor gas meters record gas production. The DIN and VDI specifications both specify the correction of biogas quantities to STP of 0 °C, 101.325 kPa, and dry gas, i.e., corrected for water vapour content. Linke et al. [49] determined gas yields according to DIN 38414-8 for various crop substrates in tests conducted at 35 °C; however, they reported only biogas yields without methane values, and thus, the findings are not included in this work. Analyses conducted according to VDI 4630 include those by Gallegos et al. [50], who used eudiometer devices at 38 °C for wheat straw, and by Amon et al. [51], who used 1-litre batch digesters operating at 38 °C to study a range of crops. Machmüller et al. [52] also employed 1-litre batch fermenters at 38 °C in a similar experimental set-up to analyse sunflower, sugar beet, maize, clover, and rye; biogas was monitored daily. Bauer et al. [53] conducted assays (maize, barley, sunflower, lucerne, sorghum, wheat) in accordance with the DIN 38414 and VDI 4630 methods but used eudiometer batch digesters of 250 mL capacity maintained at 37.5 °C, recording biogas volume on a daily basis with determination of the CH4 content. The VDI 4630 guideline was also employed in Denmark by Heidarzadeh Vazifehkhoran et al. [54] to test sugar beet (37 °C), but digester volumes are not given. Miscanthus was tested by Schmidt et al. [55] in 2-litre batch digesters at 37 °C according to the VDI 4630 method, but although statistical analysis was conducted, no numerical BMP values are quoted, and thus, no result is included here. This overview illustrates that a high diversity of equipment and procedures continues to be applied even when accounting for existing standardisations.
A further method derived from the DIN 38414 and VDI 4630 methods is the Hohenheim Biogas Yield Test (HBT), which uses bench-scale glass syringes (100 mL) as the digester vessels combined with gas collection (in the expanding syringe volume) [56]. Methane content is periodically determined with the aid of a miniaturised infrared analyser. As the HBT uses relatively small samples, it is possible to run large numbers of tests concurrently. Examples of its application to crop materials include maize by Mittweg et al. [27]; cup plant by Haag et al. [57]; cup plant, energy dock, giant knotweed, and tall wheatgrass by Mast et al. [58]; and maize and perennial energy crops by Ruf and Emmerling [59].
With the introduction of standardised procedures and guidelines prepared by the IWA task group for Anaerobic Biodegradation, Activity, and Inhibition (ABAI-Group) [24,31,60], it has become more common to operate the BMP test until gas production becomes negligible. Nevertheless, some works have continued to apply a fixed pre-defined digestion period. Chiumenti et al. [61] digested grass (38 °C) over a 40-day period; they equipped their 4-litre fermenters with bench-scale biogas meters (MilliGascounter, Ritter, Bochum, Germany) to continuously register the volume of produced biogas. Schmidt et al. [62] tested five perennial species (cup plant, giant knotweed, reed canary grass, tall wheatgrass, and virginia mallow) in 2-litre batch digesters at 37 °C with a test duration of 42 days.
Other protocols set the digestion times to reflect the point when gas production is negligible but do not record biogas generation rates during this period. A number of crop-related assays have been carried out in which biogas was collected in gas bags and then determined. Pouech et al. [63] operated 0.5-litre batch reactors at 40 °C; gas is said to have been collected in an ‘inspection hole’ (no further description given), stored in gas-tight bags, and then measured with a 100 mL syringe; however, it is not stated whether volumes were converted to STP. Methane potentials were measured in 0.5-litre bottles (300 mL working volume) at 37 °C in an orbital shaker water bath by Lehtomäki and Björnsson [64]; Lehtomäki et al. [65] in 2-litre glass bottles (1.5 L working volume) at 35 °C; and Seppälä et al. [66] in 1-litre glass bottles (750 mL working volume) at 35 °C over periods of 80 to 100 days, until gas production was negligible (although it is not clear how this criterion was ensured); in all cases, gas was collected in foil-lined gas bags. A similar 2-litre apparatus and protocol was used by Kaparaju et al. [67] and Lehtomäki et al. [68]. Kaparaju et al. [67] conducted experiments over 155 days on a range of crop residues. Lehtomäki et al. [68] examined crops harvested at different growth stages with the duration of the tests varying between 107 and 189 days. Parawira et al. [69] conducted assays at 37 °C in 0.5-litre flasks (working volume 300 mL) maintained in a shaking water bath. The tests ran for 50 days, being terminated when there was no significant gas production over a 2-week period; gas composition was determined by gas chromatography. Specific methane yields are expressed in terms of VS destroyed rather than added, but the percentage of degradation achieved in the test is not given. Apart from Pouech et al. [63], none of the above papers using gas bags for collection states how gas volumes were measured, but according to Lehtomäki [70], values were obtained by height difference in a water displacement column and are quoted at ambient pressure and room temperature (20–22 °C) without correction to STP or dry biogas.
Garcia et al. [71] tested a range of crop materials in 0.5 L digesters at 37 °C (45 days, checked for final daily production rate); gas volumes were determined by a water displacement method, but no information is given on any volume corrections. Measurement of biogas production in liquid displacement cylinders containing a barrier solution of 75% saturated sodium chloride at pH 2 was reported by Cornell et al. [72] for maize (37 °C, 44 days) and Rincón et al. [73,74] for wheat (35 °C, 96 days and 37 °C, 79 days). In each case, 1.5 litre stirred tank reactors maintained at constant temperature in a water bath were employed, and gas composition was measured each time the cylinders were refilled with the barrier solution, at maximum intervals of five days when gas production rates were low. Cornell et al. [72] does not indicate whether gas volumes are expressed at STP. It should be noted that the use of this type of barrier solution reduces but does not prevent CO2 losses [75], and therefore, this method is more suitable for tests of rather short duration or where only methane yields are to be reported.
The availability of proprietary systems from various suppliers has been making BMP tests more popular in the last five years, because such solutions offer ready-to-use equipment with pre-defined specifications. Pererva et al. [20] lists several types of systems available (including YieldMaster, Nautilus BMP, Anaero Technology, AMPTS II). Most users have digested wastes, but some have studied crop-based materials. The BMP of miscanthus species harvested at different growth stages was evaluated by Peng et al. [76] using AMPTS II (Bioprocess Control, Sweden) with flow cell gas measurement in a trial ending when daily gas production was <1% of the cumulative total. Virkajärvi et al. [77] used AMPTS II for BMPs of grass and grass with clover, but the test duration is not reported. The same system was used by Nges et al. [78] and Li et al. [79] to assess the methane potential of miscanthus (50-day period), and miscanthus was further tested by Thomas et al. [80] (48 days).
A number of BMP publications are not considered in this work for methodological reasons. As an example, Pohl et al. [81] and Heeg et al. [82] carried out BMP assays on wheat straw in 2-litre gas fermenters with separate gas holders, but no detailed description of the gas measurement method is provided; and the results presented are based on modelling so are not included here. Rocha-Meneses et al. [83] used pressurised 575 mL serum bottles at 36 °C to determine the BMP of barley straw, but the pressure release regime is unclear, and as the reported values are based on a numerical model, they are not included here. Sealed 309 mL bottles at 36 °C were used by Ohlsson et al. [84] in a 94-day BMP assay for willow, with gas measurement on five occasions, but the pressure release regime is not specified, and values are available on a TS basis only, so they are omitted here. While such studies may satisfy the specific research interests of the authors, the transferability of findings is reduced by omission of the supporting data.

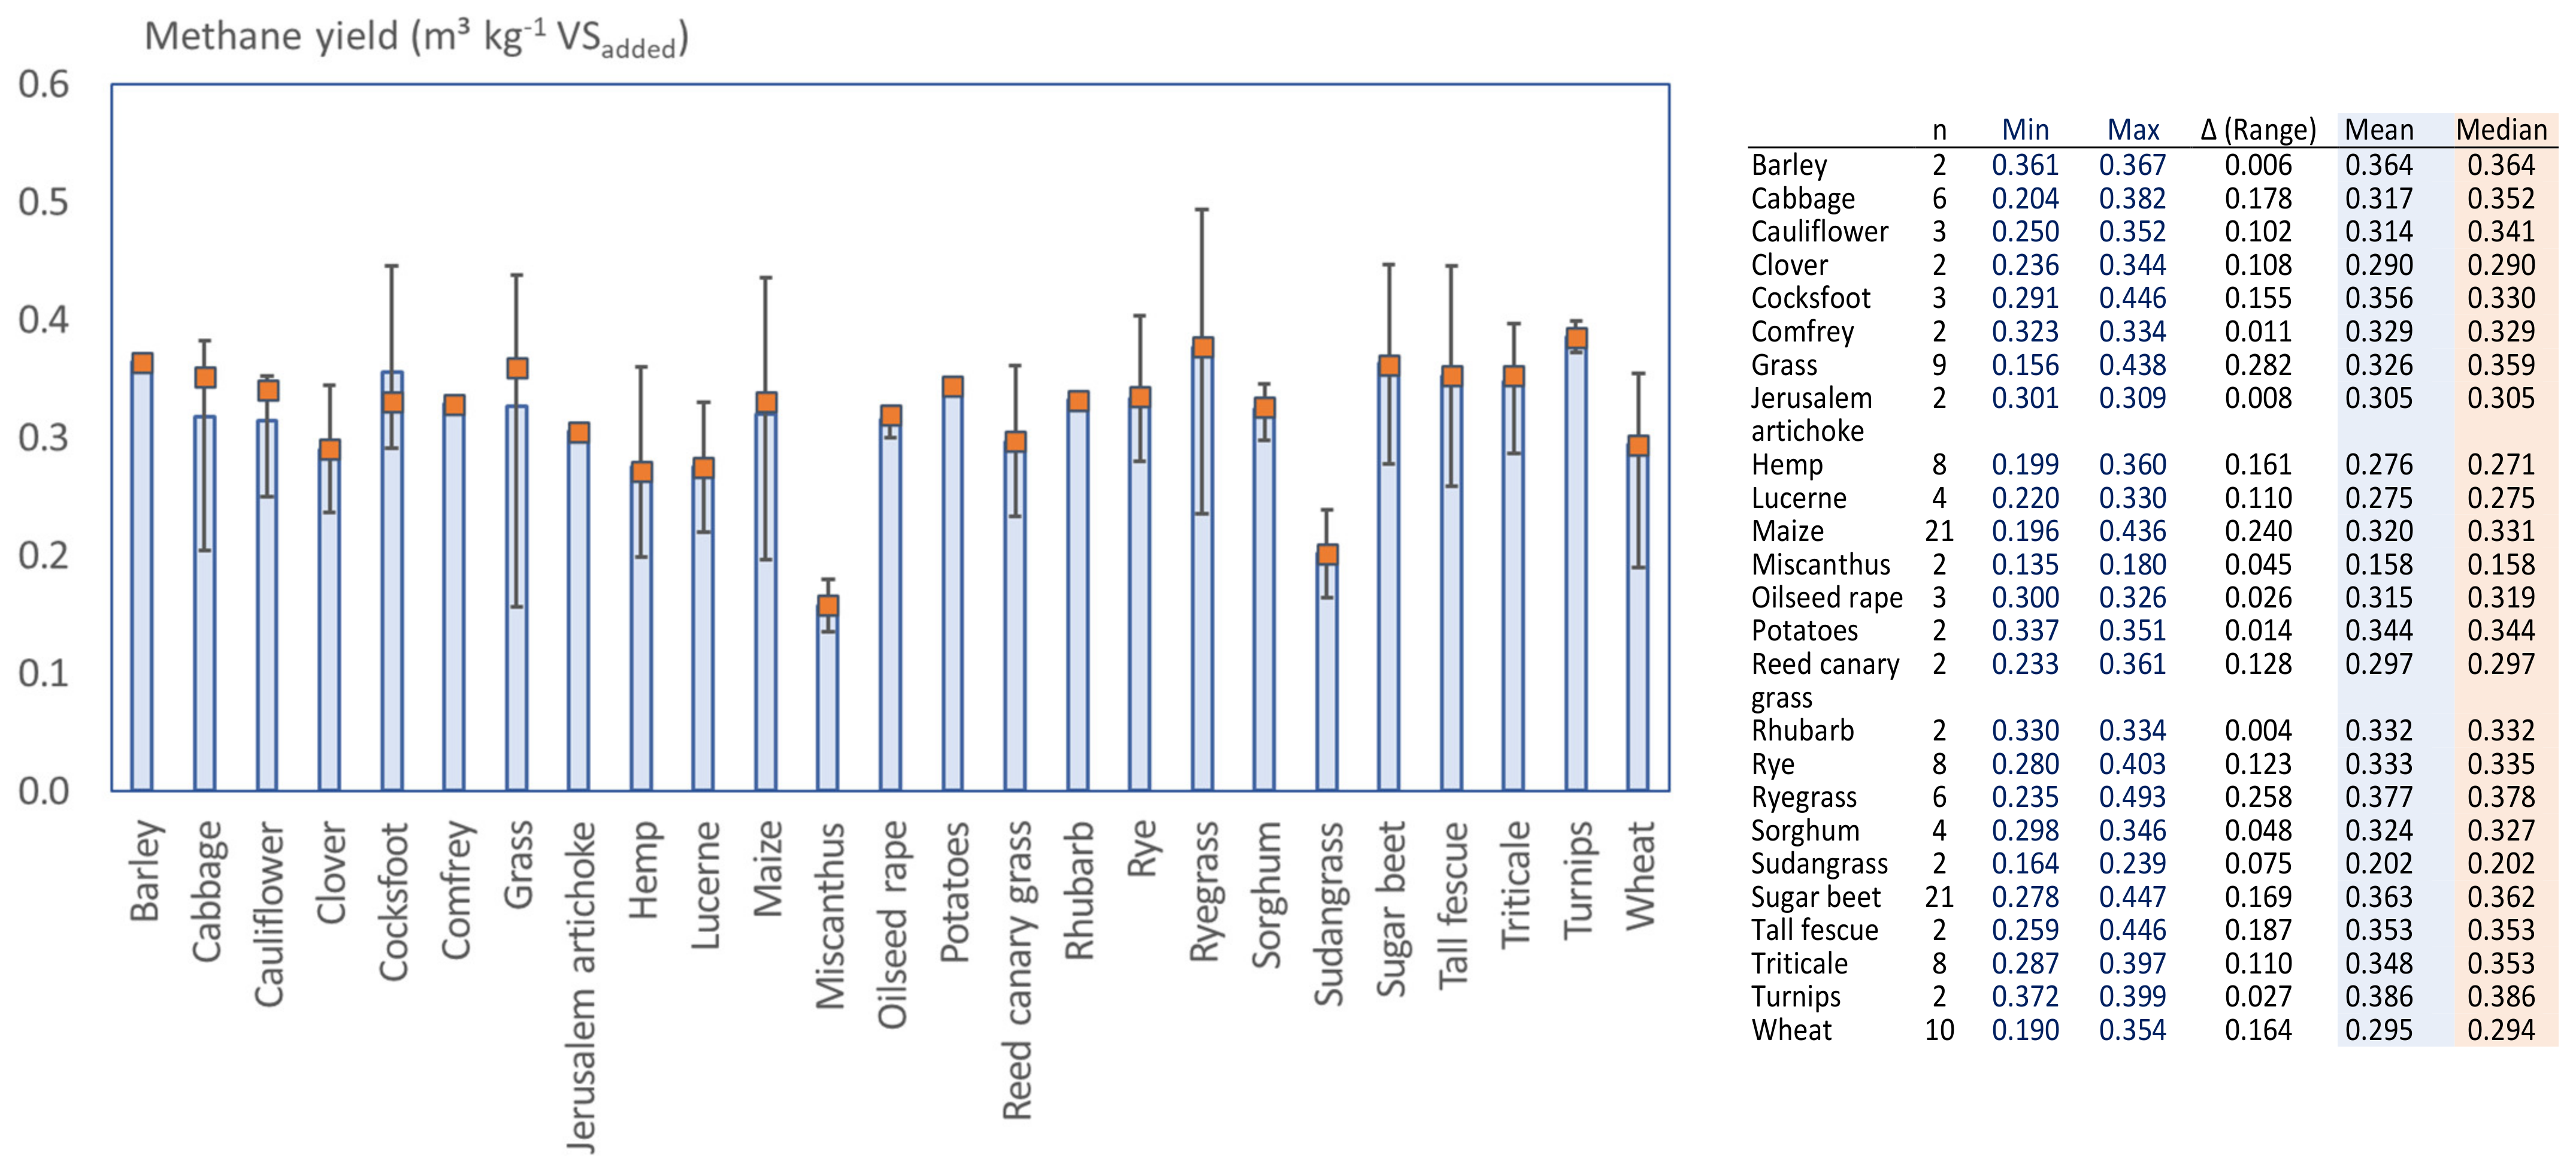
3.3. Methane Production Obtained from Short Retention Batch Tests

Values for methane yields have been obtained from other batch tests, which are sometimes carried out in larger-scale reactors but with gas production often measured over shorter periods. These methods may produce lower biogas or methane yields than a BMP assay, as complete digestion may not be achieved within the test period, and therefore, the full potential of the material may not be realised. On the other hand, these tests monitor the readily biodegradable components of the material, and it can be argued that the shorter duration more closely resembles the digestion time in continuous operation under standard practice. Therefore, the data may draw the attention of readers interested in methane yields obtainable in practice. The current study only includes publications where the methane yield of a specific substrate was explicitly explored and excludes, for example, research that focused on co-generation mixtures to enhance digester performance. In some cases, the equipment employed usually serves to investigate the performance of a specific reactor type (including leach-bed reactors or two-stage systems) rather than the methane potential of substrates. The review illustrates that the documentation of equipment and procedures used in many cases is even more deficient than for BMP studies.
In some cases, the methods are well-documented, but methane yields are not clear. Linke and Schelle [85] used a range of batch reactors (in accordance with the guidelines in VDI 4630) with working capacities of 1–66 kg, operated at 35 °C to digest hemp and grass. Gas production was measured with scaled wet gas meters or precision rotor gas meters, but biogas values only are reported, without methane yields, and therefore, these results are not considered here. Heiermann et al. [86,87] and Heiermann and Plöchl [88] adopted the method described by Linke and Schelle [85] for various crops (barley, rye, triticale, fodder beet, grass, hemp, ley crop, lucerne, maize), with digestion conducted at 35 °C over a period of 28 or 29 days, at a working capacity of 1.4 kg, with reactor vessels connected to scaled wet gas meters for measuring biogas production (results presented only in graphs). The methane content of biogas is reported as having been determined three and four times respectively during the digestion period. This approach may lead to errors, as gas composition may change significantly during the period. It is also difficult to read precise values from graphs. In addition, neither of the papers by Heiermann et al. [86,87] state whether the reported gas volumes were adjusted to STP. These results are not considered here.
The failure to convert gas volumes to STP, or to report whether such conversion has been carried out and what conditions were used, is a frequent problem in the analysis of literature data. This applies to studies conducted around 40 years ago, but it is a persistent issue also in more recent publications. Early studies that have been frequently cited are those by Badger et al. [89] (kale, maize, oats, sugar beet tops, and wheat straw) and Zubr [90] (cauliflower, oilseed rape, rhubarb, sugar beet, etc.). Badger et al. operated batch reactors (800 mL in 1-litre bottles) at 37 °C; the volume of biogas produced was measured using displacement of CO2-saturated water. Methane yields were obtained after varying digestion times (17–36 days) depending on the amount of gas produced each day. Quoted gas production values are not adjusted for STP conditions. Zubr’s experiments were carried out using equipment consisting of a 3-litre batch fermentation reactor, a 30-litre PVC gas collector, and a central water reservoir; fermentation was at 35 °C for durations varying from 27 to 36 days, but it is not indicated whether the quoted gas yields are adjusted to STP conditions.
Among the studies published in the last 15 years, a relatively broad range of procedures and equipment types have been used, and it is not always possible to assess the accuracy of reported values. Svensson et al. [91] examined ensiled sugar beet tops and wheat straw in batch reactors at 35 °C; the tests on sugar beet tops were conducted in a single stage batch reactor (20 days), while those on wheat straw were in a leach-bed reactor. The method of gas collection is not given, and it is also not stated whether quoted gas yields are adjusted to STP conditions. Gas collection columns were used by Nizami and Murphy [92] during investigations of the potential of ryegrass for methane production, in reactors with a working volume of 1.5 litres operated at 38 °C for 26 days; it is not stated if the measured gas volumes are corrected to STP. Raposo et al. [93] used glass vessels with a 5-litre working volume (35 °C) to digest maize over 20 days; gas volume was determined by water displacement and values corrected for STP, although the conditions are not stated. The combination of short retention time and substrate processing may account for the low values recorded. Yan et al. [94] investigated the biomethane production of various leafy vegetables over a 25-day test period in pressurised mesophilic (37 °C) 500 mL reactors; gas volumes were corrected, but the STP conditions used are not stated. Tilvikiene et al. [95] worked at a larger scale, employing 20-litre batch digesters at 38 °C, equipped with drum-type flow meters to determine gas production; the duration of the test and the conditions applied for volume correction are not stated.
In some cases, equipment and procedures are well described, but the applied digestion temperature is not clear. Kaiser et al. [96] examined a range of crop materials in 2-litre batch reactors, each with an individual small-scale gas counter (Milligascounter), in climatic test cabinets; methane yields are reported at STP, but the operating temperature of the reactors is not given. Overall, mesophilic tests are more common than thermophilic in both batch and continuous/semi-continuous experiments. Mesophilic tests with clear documentation include those by Mähnert et al. [97], who adopted the method described by Linke and Schelle [85] to digest grass (cocksfoot, among others), in 2-litre reactors at 35 °C; the volume of biogas produced was measured using calibrated wet gas meters and reported as cumulative yield after 28 days. Methane content was determined periodically. A similar method was used by Herrmann et al. [98,99,100] to measure methane production of various crop feedstocks in 2-litre reactors at 35 °C, reporting cumulative methane yield over 30 days corrected to STP. Kreuger et al. used 500 mL flasks incubated in a mesophilic water bath [101] to test hemp, maize, and sugar beet, and Gissén et al. [102] used them to test grass, hemp, maize, sugar beet, and triticale. Thermophilic tests were carried out by Bruni et al. [103] in batch assays with a total volume of 2140 mL at 55 °C on a range of maize varieties harvested at various times. Kreuger et al. [104] used 500 mL flasks, with an active volume of 300–350 mL, to conduct assays on hemp; flasks were incubated at 50°C in a shaker water bath and terminated after 32 or 34 days.
Since the introduction of proprietary systems on the market, such solutions have also been widely employed in the last 5 years for short-duration batch tests. Spence et al. [7] examined substrates, including grass and triticale, at 38 °C for 20 days using a proprietary system with automated normalisation to STP (Anaero Technology, Cambridge, UK). Tests on the effect of harvest date and cutting length for grass and whole-crop rye and wheat were carried out by Prade et al. [105] using the AMPTS II system, with values reported as dry gas at STP after 30 days of digestion. Allen et al. [106] also employed AMPTS II for various substrates; the test duration is not explicitly stated but appears to have been 30 days. Nges et al. [107] tested wheat straw (AMPTS II, 30-day batch test). Kolbl et al. [108] used AMPTS II modified to accommodate 5-litre vessels for a range of materials including triticale and maize over a 34-day test period. Zhao et al. [109] used the WAL-BMP-Test system 3150 (WAL, Germany) to measure the methane potential of maize stover over a 21-day test period.
The reported results from these batch tests are given in Table A2 (Appendix A) and shown in Figure 2.
Fairly large variations can be seen for the individual crops. Some of this variation is probably because some of the tests used ground/milled feedstock. As a tendency, average methane values reported from short-duration batch tests are lower compared to BMP results, which is in line with the expectation of more complete digestion in BMP trials. However, the differences are not always high. For the relatively rapidly digesting maize, the average value in short-duration batch testing is 0.32 m3 CH4 kg VSadded, which is reasonably close to the 0.35 m3 CH4 kg VSadded obtained as an average value in the BMP assays. Similarly, ryegrass reaches on average 0.38 m3 CH4 kg VSadded in the short-duration testing compared to 0.40 m3 CH4 kg VSadded in the BMP experiments. For grass, a slightly higher average methane yield is found in the short-duration trials (0.33 CH4 kg VSadded, while it was 0.32 CH4 kg VSadded in the BMP testing). This contradicts the expectation that a shorter digestion produces less methane. This set of data further highlights the high variations among reported results and the limitations in the comparability and transferability of reported data.

3.4. Methane Production from Continuous/Semi-Continuous Digestion Processes

Experiments that more closely resemble industrial-scale processes can be conducted in continuously or semi-continuously fed laboratory-scale reactors. These are generally stirred or mixed in some way and maintained at constant temperature, and they are fed a measured amount of feedstock on a regular basis (usually daily), with digestate being removed in order to maintain the quantity of material within the digester. Biogas production may be measured by collection above a barrier solution or in gas-impermeable bags, with periodic recording of the volume collected, or by continuous monitoring via gas flow meters. The methane content of the biogas is generally determined through compositional analysis of samples taken at defined intervals.
Such experiments typically run for at least three hydraulic retention times to allow the establishment of steady-state conditions or to reveal any adverse operational symptoms. Thus, biogas production takes place in conditions similar to those in full-scale digesters. In a continuous or semi-continuous trial, the organic loading rate (OLR) in terms of kg VSadded m−3 digester day−1 is usually higher than the equivalent loading calculated over the duration of a BMP test; the average retention time is often less than the duration of a full BMP test; and in a completely mixed reactor, a proportion of the feedstock is removed after a very short period. For these reasons, the specific gas yield on a VS-added basis is expected to be lower than in a BMP test on the same material. Daily biogas production usually shows some fluctuation. This may be for a number of reasons, such as the heterogeneous nature of the feedstock, acclimation of the inoculum, and slight changes in operating parameters, e.g., feeding time. An average gas production rate can be determined over a period of time after the digestion trial has reached steady state.
A growing body of literature documents results from laboratory trials conducted in continuously or semi-continuously fed reactors, but the picture is less complete compared to batch testing when considering only those experiments where no process inhibition was observed and where a specific type of crop was individually tested. This criterion excludes many of the published works. As one example, in addition to carrying out BMP tests, Wahid et al. [42] attempted thermophilic (55 °C) mono-digestion of lucerne in a 15-litre working volume continuously stirred tank reactor (CSTR) over a 70-day experimental period, but they were unable to establish stable operation; therefore, results are not included here.
A relatively broad diversity exists among the scales and types of systems used. Most works employ CSTR, but other systems are also used. Similarly to the observations made above on short-retention batch tests and many BMP tests, the quality of reported values cannot always be assessed with precision because essential information is not documented in the publications.
For some published methane production results, expression on a VS basis is not possible. Stewart et al. [110] operated 20-litre CSTR digesters at 35 °C, with a retention time of 20 days, using kale, maize, oats, grass, wheat, and barley straw, among others. Biogas yields were determined daily by collection in 60-litre PVC gas collection bags from where the gas was vacuum-pumped through a gas meter; no information is given on whether the reported values are adjusted to STP. Methane yields are available on a TS basis only, and thus, the results are not considered here.
In many cases, the method for gas measurement is not clear, or information on conversion to STP is deficient. Scherer et al. [111] ran four laboratory-scale digesters at 37 °C, 45 °C, 60 °C, and 65 °C, fed with fodder beet silage; however, the method of gas collection is not given. Nges and Björnsson [112] operated two 4-litre CSTR digesters at 38 °C on sugar beet with biogas collected in gas-impermeable bags, but the method of volume measurement and any corrections to STP are not reported. Zhu et al. [113] conducted a two-stage process (1-litre CSTR followed by 5-litre CSTR) looking at H2 and CH4 production from homogenised potatoes; the volume of gas produced in each stage was determined using a water displacement technique, but it is not stated whether gas yields are expressed in terms of STP. Haag et al. [57] employed 20-litre horizontal digesters at 40 °C to determine the biomethane potential of cup plant; gas volumes and composition were measured automatically, but no details are reported of any corrections applied, and the duration of the experiments is not given. Lehtomäki and Björnsson [64] operated two-stage digesters (10 m3 leach-bed hydrolytic reactor plus 2.6 m3 leachate recirculating methanogenic reactor) under mesophilic conditions; gas volumes were measured using gas flow metres, but it is not stated whether the reported values were converted to STP. Nizami and Murphy [92] operated a two-stage CSTR system at 37 °C consisting of two digesters of 312-litre volume with 160 litres of gas headspace to examine the effects of varying loading rate on the digestion of grass; it is not reported if gas yields are corrected for STP or water vapour content. Semi-continuous digestion of maize stover at 37 °C was tested in wet (5-litre CSTR) and dry (packed-bed) fermentation conditions by Kakuk et al. [114], with gas volumes measured by mass flow controllers, but details of STP corrections are not reported.
Veluchamy et al. [115] used a mesophilic (35 °C) plug flow digester with a 50-litre working volume working in fill-and-draw mode for the semi-continuous digestion of maize silage at a range of OLR. Hydraulic retention times ranged from 13 to 25 days, but the digester only operated at each OLR for 30 days. Gas volumes were measured using a multi-chamber rotor meter; whether values were corrected in any way is not stated.
Rincón et al. [116] ran eight CSTR reactors with working volumes of 4 litres at 35 °C, using winter wheat collected at medium milk harvest stage; digesters were fed at loading rates of 2, 3, 4, and 5 g VS L−1 day−1. Gas production was measured using tipping-bucket gas counters with continuous data logging. Calibration was checked weekly by collecting the gas in an impermeable bag; gas volumes were corrected to dry biogas at STP as described in Walker et al. [75]. Wheat straw digestion was tested by Pohl et al. [81,117] and Heeg et al. [82] in two-stage systems consisting of an upflow anaerobic solid-state (UASS) reactor with a working volume of 39 litres and a 30-litre anaerobic filter under mesophilic (37 °C), thermophilic (55 °C), and hyperthermophilic (60 °C) conditions. Biogas volumes were measured by flow meter (Ritter, Germany) and normalised to STP and 0% humidity. Nges et al. [107] carried out semi-continuous digestion of wheat straw under various regimes of nutrient addition and digestate recycling in 15-litre CSTRs at 37 °C, with OLRs of 2–4 g VS L−1 day−1 and a fixed SRT of 30 days. Gas volumes were measured using a real-time monitoring system with built-in correction to STP (Bio-process Control AB, Lund, Sweden).
Values reported for various crops are documented in Table A3 (Appendix A). Relatively high variations are found across literature sources. For many crops shown in Table A3, including grass, ryegrass, wheat, and sugar beet, the methane yields are reasonably close to those found in BMP testing (Section 3.2), which illustrates the effectiveness of such processing, if operated in an optimised way and without inhibition occurring.

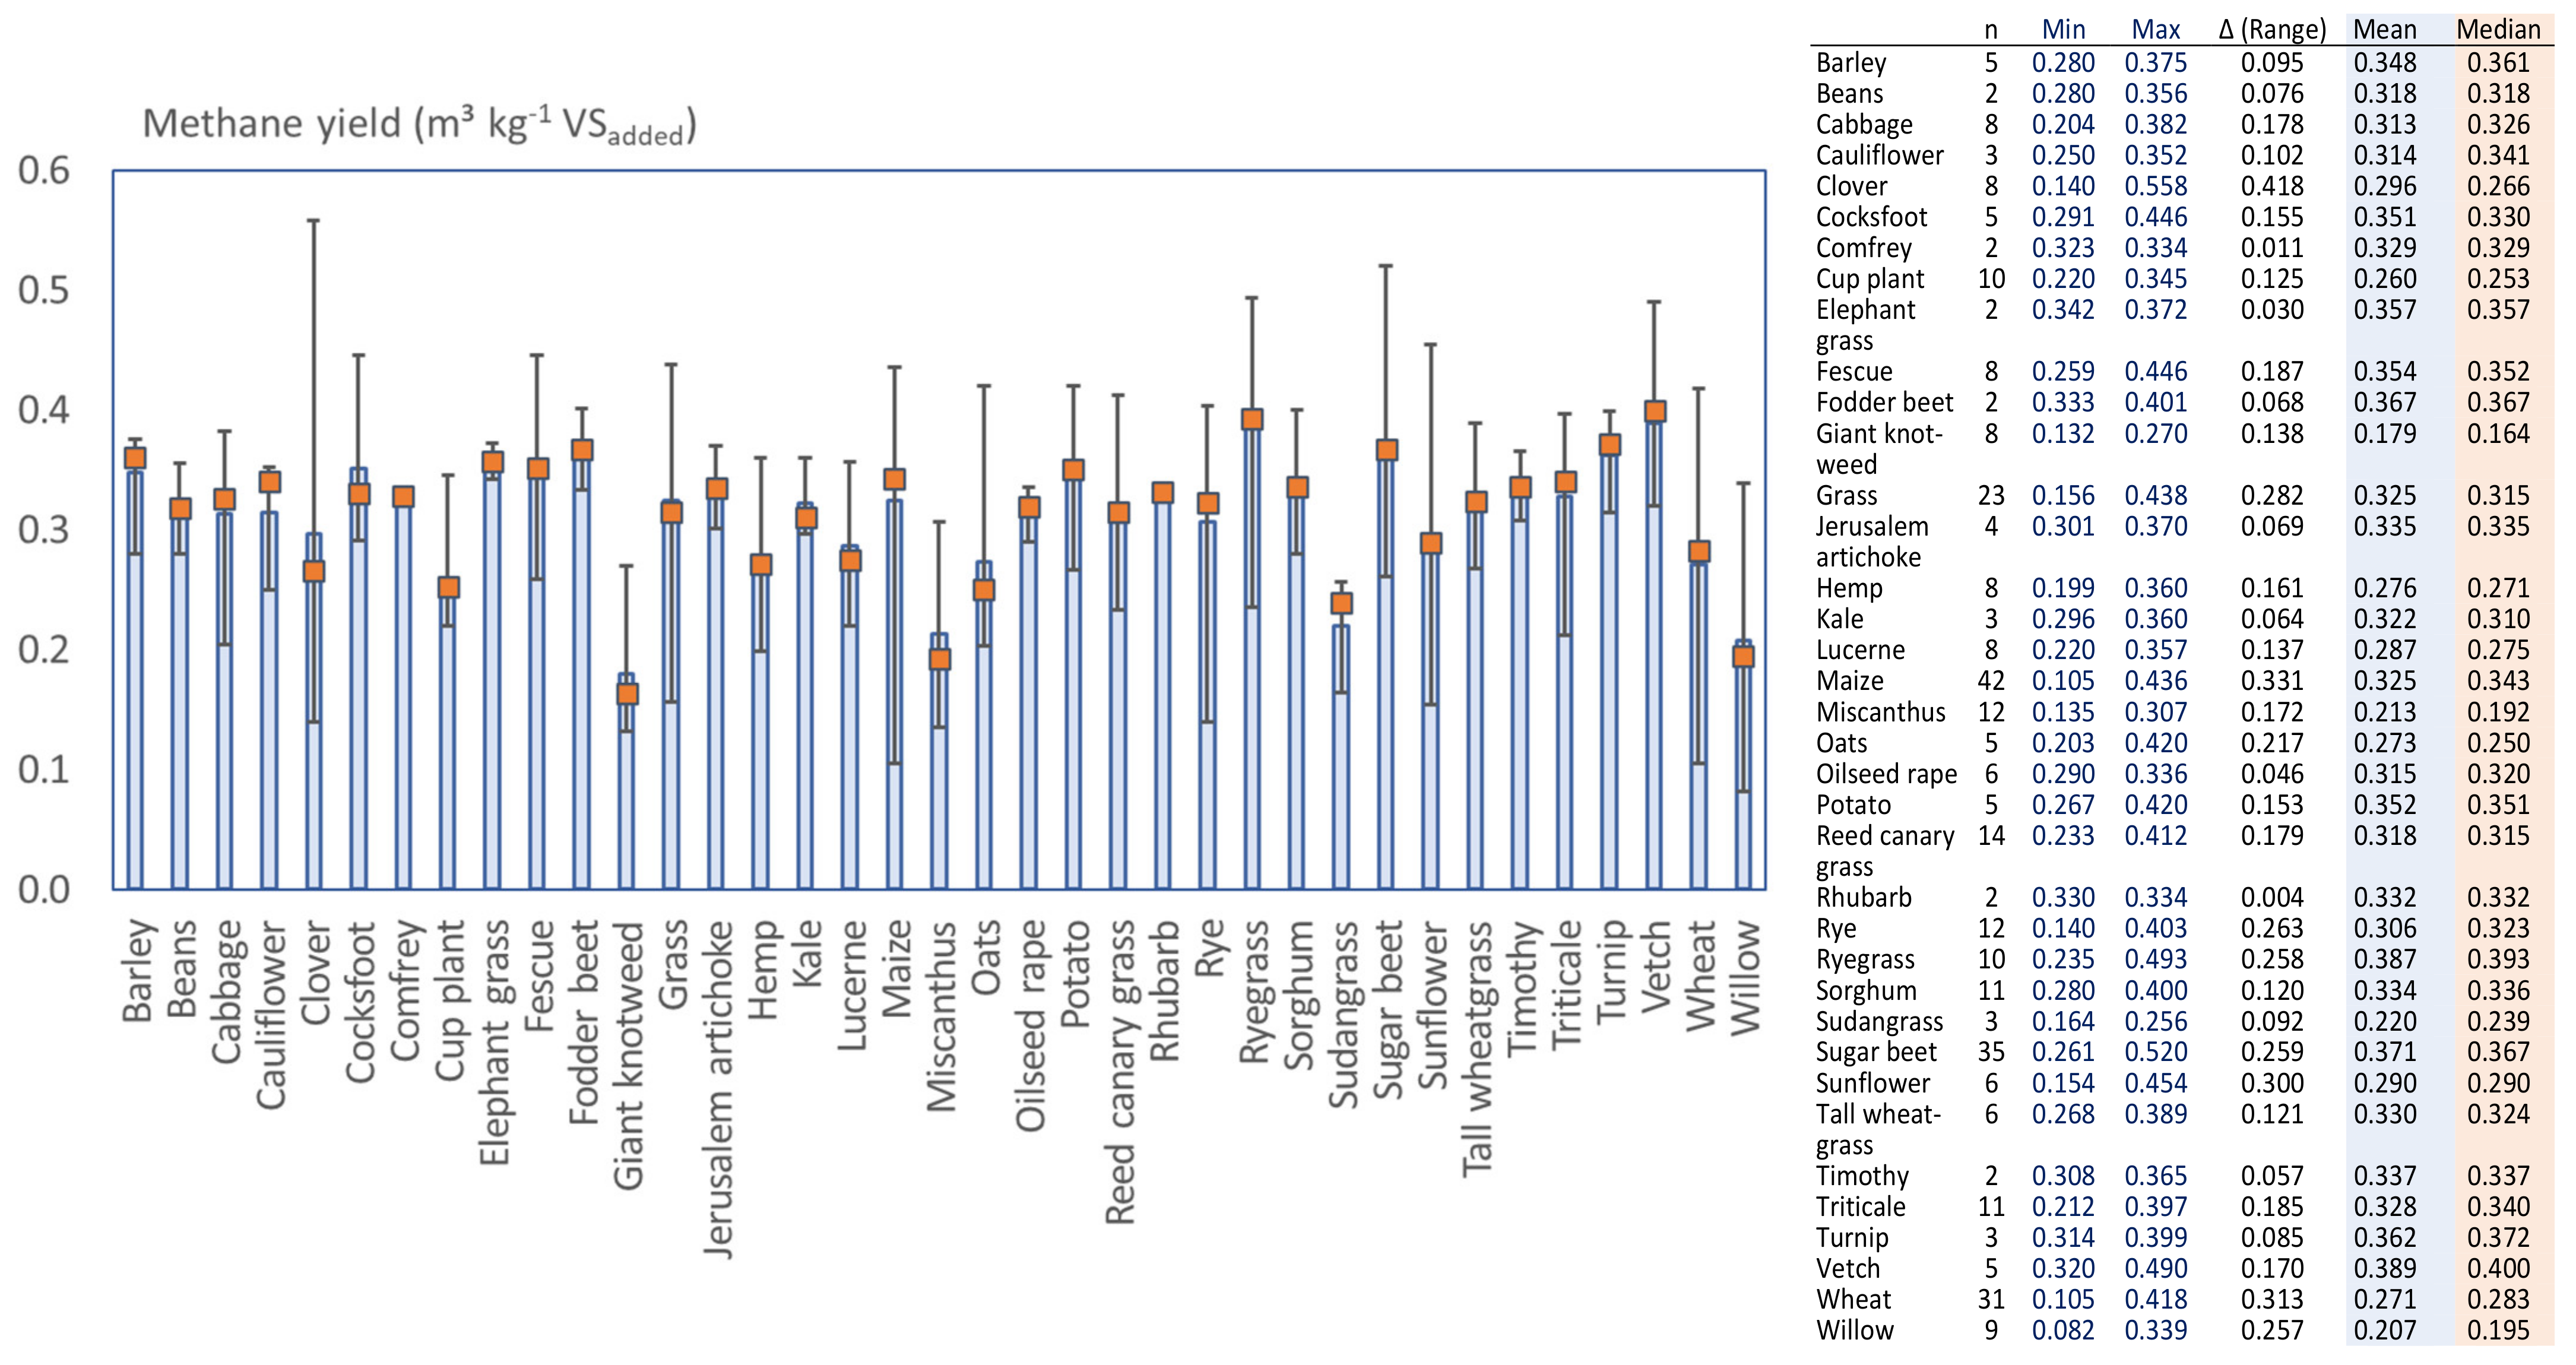
3.5. Variations of the Reported Methane Potential for Various Crops

Experimental results reported for the specific methane yields of different crops are summarised in Figure 3 and Figure 4. Literature data from the experimental tests described above (batch and semi-continuous/continuous assays) are considered in both figures. Figure 3 contains all values for each crop, including all growth stages and crop parts. Figure 4 shows the values for various crops where these have been divided into crop parts or other specifications, e.g., straw, whole crop, or ensiled.
As can be seen in Figure 3, the range of values is particularly large for clover, grass, maize, oats, rye, ryegrass, sugar beet, sunflower, wheat, and willow, but high variations are also found for other crops. The average specific methane values for the individual crops range between 0.18 (giant knotweed) and 0.39 (ryegrass, vetch) CH4 kg−1 VSadded. However, for many of the single crops, the range of reported values is much wider than this inter-crop variation. Therefore, the difference between reported values for a single crop (intra-crop variation) is frequently greater than the difference between crops (inter-crop variation). Thus, when relying on single publications, the interpretation of the methane yield risks being misleading, because the identified value might be particularly high or low.
Disaggregating the data according to plant components (Figure 4) removes a part of the intra-crop variation, in particular for maize, oats, sugar beet, and wheat, but not all of it. Evidently, it can be advantageous to know as many details as possible about the biomass treated, but relying on literature data still bears the risk of being confronted with a value that is particularly high or low. Figure 4 shows a selection of crops only, as disaggregated data are not available for all the crops included in Figure 3.

3.6. Methane Production Based on Elemental/Biochemical Composition

Another method by which methane potential can be determined is through knowledge of the elemental composition of the feedstock material, which is followed by application of an equation such as that given by Symons and Buswell [118] and Buswell and Hatfield [119].
CcHhOoNnSs + 1/4(4c − h − 2o + 3n + 2s)H2O → 1/8(4c − h + 2o + 3n + 2s)CO2 +1/8(4c + h − 2o − 3n − 2s)CH4 +
nNH3 + sH2S
The Buswell equation has been used to calculate the maximal potential methane production of defined organic chemicals, such as different sugars and alcohols. However, this equation is not readily adapted for complex substances containing refractory components, as, for example, lignocellulosic materials. The methane yield calculated from the Buswell equation is a theoretical maximum and thus should be always higher than values measured in a biochemical assay. When applied to defined organic chemicals, such as sugars and alcohols, reasonably good agreement between experimental and theoretical values can be obtained. However, for complex substances containing refractory components (e.g., lignocellulosic materials), the results of the Buswell equation need to be adjusted; this can be done based on fibre content (estimated or measured) or ruminal digestibility as demonstrated by Czepuck et al. [120].
Alternatively, the potential biogas and methane yield can be calculated based on the biochemical composition of the material in terms of its carbohydrate, protein, and fat content, and an assumed or calculated yield for each of these constituents. This has now become a frequently-used method to estimate the methane potential of biomass. For accurate results, the carbohydrate component should refer to readily available storage materials such as starch, rather than to cellulosic material embedded in lignin, which may be less degradable. An example of this approach is found in Linke et al. [121], which gives results for a range of cereal whole crop substrates based on calculated values from protein (taken as 0.7 L biogas g TS−1), fat (1.2 L biogas g TS−1), and carbohydrate (0.8 L biogas g TS−1) with predicted percentage of CH4 in the biogas. Then, the values for biogas and methane yield are predicted from the measured composition of the substrates including total solids, ash content, fibre, fat, and protein as given in DLG (German Agricultural Society) [122].
A similar method is adopted as the basis for the database maintained by LfL (Bavarian State Institute for Agriculture) [123], where calculated methane potential values for a range of substrates are available, based on the content of protein (taken as 700 L biogas kg TS−1), fat (1250 L biogas kg TS−1), and carbohydrate (790 L biogas kg TS−1) and on the substrate digestibility taken from animal fodder value tables. Values are given for biogas yield and methane composition, and these have been used to calculate the methane values given in Table A4 (Appendix B).
Hundreds of papers are available where this approach has been used. Methods and their applications have been reviewed [124]. Combining experimental testing and calculation of methane potential from proximate analysis is also common [106]. It is not within the scope of this work to review the results calculated with this approach across the literature, as the focus here is on experimental determination of methane yields. Table A4 lists some results to provide examples.

3.7. Results Published without Methods

A number of values for the methane yield of various crops have appeared without details of the methods used to determine them. Examples can be found in different media, for example in conference presentations [125], in handbooks for practitioners [126], in books [127], on web sites [128], and also in journal publications [129]. The existence of methane values provided without indicating the method by which these were determined might reflect one of the key challenges elaborated in this work—namely, the high variability of methane yields reported in the literature along with strongly differing methods applied, which make the data difficult to interpret. A detailed review of the publications that do not report the methods used is not within the scope of this work. However, some values are listed as examples in Table A5 (Appendix C). Those data tend to be close to average values found in experimental works as reported in earlier sections of this publication. This might indicate that they have been compiled by considering the data published across various works. However, a lack of transparency must be critically mentioned.

4. Discussion

4.1. Issues Potentially Affecting the Precision of Methane Potential Reported in Literature

The BMP test provides the most reproducible approach for the determination of ultimate methane potential. Its main advantage is the possibility to process the biomass under environmentally optimised conditions; for this to be fulfilled, careful attention is required to ensure adequate procedures and conditions, including a sufficiently high inoculum-to-substrate ratio [Koch et al. 2020]. The BMP test can only give a valid result for the ultimate biochemical methane potential of a substrate when no inhibition and no loss of biogas occurs.
Several specific points can be highlighted from the observations made. For some experimental set-ups, long processing times applied to determine the BMP of slowly degrading biomass can be assumed to have influenced precision of results, e.g., the methods where a barrier solution was involved [72,73] (see Section 3.2). This approach can lead to a loss of both CO2 and CH4, but more CO2 because of its greater solubility [75]. In short-duration tests where substrate is rapidly degraded, this may not strongly affect the BMP result, but at longer digestion times, the impact could be significant; and the method is unsuitable where values and production kinetics for biogas rather than methane are required. However, one advantage is that the level of the barrier solution can be logged automatically at short intervals, giving a more detailed picture of gas production kinetics.
Some methods involve an extra step to determine gas volumes after storing the biogas in gas bags. However, the equipment and procedures used are not always clearly stated, hindering any attempt to evaluate the results. Gas collection bags are not completely impermeable or leak-proof. Different qualities exist (foil-lined gas collection bags are now standard), and the rate of diffusion from a bag will also vary for different gases (unpublished experimental data, University of Southampton). Other systems involve pressurised conditions as biogas accumulates in the test system, but the exact pressure regime and its management is often unclear. Depending on the method used to release pressure and in particular the time allowed for equilibration of headspace and liquid phase, pressurisation can affect the quantity of dissolved gases [24], altering the relative proportion of CH4 and CO2 due to the higher solubility of the latter. This may affect the pH and carbonate equilibrium of the digestion process and thus influence its outcome and kinetics. Manometric measurement can also be a source of error due to leakage as well as volume and pressure errors [130]. Especially when working at relatively small scale, gas storage over differing time periods and the use of apparatus to extract and quantify volumes can all introduce potential risks and variations due to technical or managerial challenges. These will affect both the BMP value and the gas production kinetics.
As noted above, many publications do not specify whether gas volumes are corrected to STP or, if corrected, do not give the actual temperatures and pressures used. In particular, reference temperatures can vary significantly between standards, and higher values will give larger volumes. It is also not always clear whether the measured biogas yields were corrected for water vapour content, i.e., expressed as dry gas. In some cases, the selected duration of the test is not concisely explained; sometimes, no information is provided, and sometimes, a weak criterion such as “negligible gas production” is given with insufficient detail for replication.
An increasing number of studies are now using proprietary systems, i.e., test arrangements that are available as complete systems on the market. This specifies the equipment used and the general procedures but does not necessarily improve the accuracy of testing and precision of the reported results. Proprietary systems usually automatically correct gas volumes to dry gas and STP, but this automatised feature increases the likelihood that the relevant information is not included in publications. One particularly challenging point regarding proprietary systems is that they generally use relatively small sample volumes, and thus, a high level of pre-processing is needed to ensure homogeneity. Regardless of the system used, the knowledge and skills of the users are critical to improve the quality of reported results [60].
The extent to which the variations among methane potentials reported in the literature can be attributed to the differences in methods applied cannot conclusively be quantified based on reviewing the published data. A wide range of other potential errors can affect the accuracy of the BMP assay and make comparison of results from different tests problematic. These include inadequately homogenised samples (substrate), poor choice of inoculum-to-substrate ratio, lack of buffering or nutrient deficiency in the substrate–inoculum mix, and incorrect or inadequately defined methods for monitoring and calculating biogas/methane production [23,75,131]. Furthermore, the number of repetitions conducted is likely to impact the precision of findings. The composition of crop biomass also varies significantly depending on the stage of growth in which the crop was harvested [132,133], the conditions under which it was grown (soil type, climatic conditions, year-on-year variations in weather) [134,135], and on post-harvest storage conditions [136]; in turn, these factors affect the energy potential. To produce reliable and meaningful data, it is essential to understand the limitations of BMP tests and the complex requirements for their adequate application.

4.2. Limitations Regarding Literature Data from Experiments Other Than BMP Tests

Short-duration batch tests will primarily show the gas yield obtained from readily degradable components, while other components may require longer digestion times. Therefore, with a view to estimating the ultimate methane potential of a specific crop, this type of data is less useful compared to BMP test results. Especially for slowly degradable biomass, data from this type of tests must be interpreted with care, and any pre-treatment such as grinding may also have a significant impact on the result.
As with BMP tests, some of the variation in reported methane yields is likely to originate from the differences in the methods applied to determine these, but quantification of this impact and assessment of the main factors driving it was not feasible based on the published data. However, one recurring issue across the literature reviewed is that not all values are expressed as dry gas at STP, while in some cases, it is unclear whether or not any correction has taken place.
Compared to batch tests, trials that apply continuous/semi-continuous digestion processes are closer to conditions in full-scale digesters, but they have their own limitations. A number of process parameters can influence methane production in continuous or semi-continuous digestion. For example, specific biogas production tends to be lower when intermediate products (e.g., VFA) accumulate in the digester, or when the digesters are run at very high OLR or very short retention times [65,137,138]. A simple kinetic model for indicating the effect of OLR on biogas yield for crops was derived by Mähnert and Linke [139] and applied to maize, rye, and beet silage with success, although results were provided only graphically.
It should be noted that this work only included data where no inhibition was observed during testing. Many experiments with continuous processes are designed to study potential inhibitions. As such, it is relatively challenging to identify works that inform about the methane potential of a biomass rather than its kinetic performance. Ensuring optimum environmental conditions in continuously/semi-continuously operated digesters is more demanding than running BMP tests, and minor process inhibition might not necessarily be noticed. Nevertheless, data from continuously operated digesters are also useful because they demonstrate the actual methane production under current practice in digestion technology and operating protocols. Extended studies under steady-state conditions, normally defined as operation for a minimum of three hydraulic retention times (HRT), can benefit from biomass acclimatisation to the feedstock, and well-designed studies with replicate digesters running at different OLR, HRT, and/or nutrient supplementation strategies are labour-intensive but can provide detailed insights into optimal conditions and performance.

4.3. Transparency of Published Data

This review has identified frequent deficiencies regarding the full documentation of experimental equipment and procedures applied. Such deficiencies reduce the usefulness and comparability of data. Results published without methods are particularly difficult to evaluate. On the other hand, there is the need of practitioners for reference values. As such, data published without methods might be attempts to provide practitioners with the best possible overall estimates as distilled by experts in the field to help them navigate through the jungle of existing data. Listing methane values without indicating the method used was more common some two decades ago, but this practice seems to be reducing now, which is a positive change regarding the transparency of data reported.

4.4. Alternatives to Relying on Literature Data

Well-conducted experiments can clarify the properties that a specific substrate displays during AD, but they are time-consuming and require a skilled work force and appropriate equipment. A viable alternative to relying on published methane yields or to conducting experimental AD testing is the estimation of the methane potential based on the chemical composition of the biomass (see Section 3.6). This requires a detailed knowledge of the biomass composition and thus involves some laboratory analyses. This method is also applied to complement experimental AD testing and allow evaluation of the efficacity of the AD process [140].
Experimental testing and theoretical calculations based on the chemical composition of the material both require the practical availability of the specific biomass of interest, and the results will apply to that specific substrate. However, in many cases, practitioners and researchers interested in a specific crop material will not have a sample available; for example, at the planning stage, a crop sample grown under relevant conditions might not be within reach, or the interest in the methane yield has arisen in a situation after a particular substrate has been consumed. The difficulty of obtaining representative homogeneous samples of crop biomass at the scale required for analysis can also be relevant. Thus, published literature remains an important source, and awareness about the limitations of reported data is an essential element to support sound decision making.

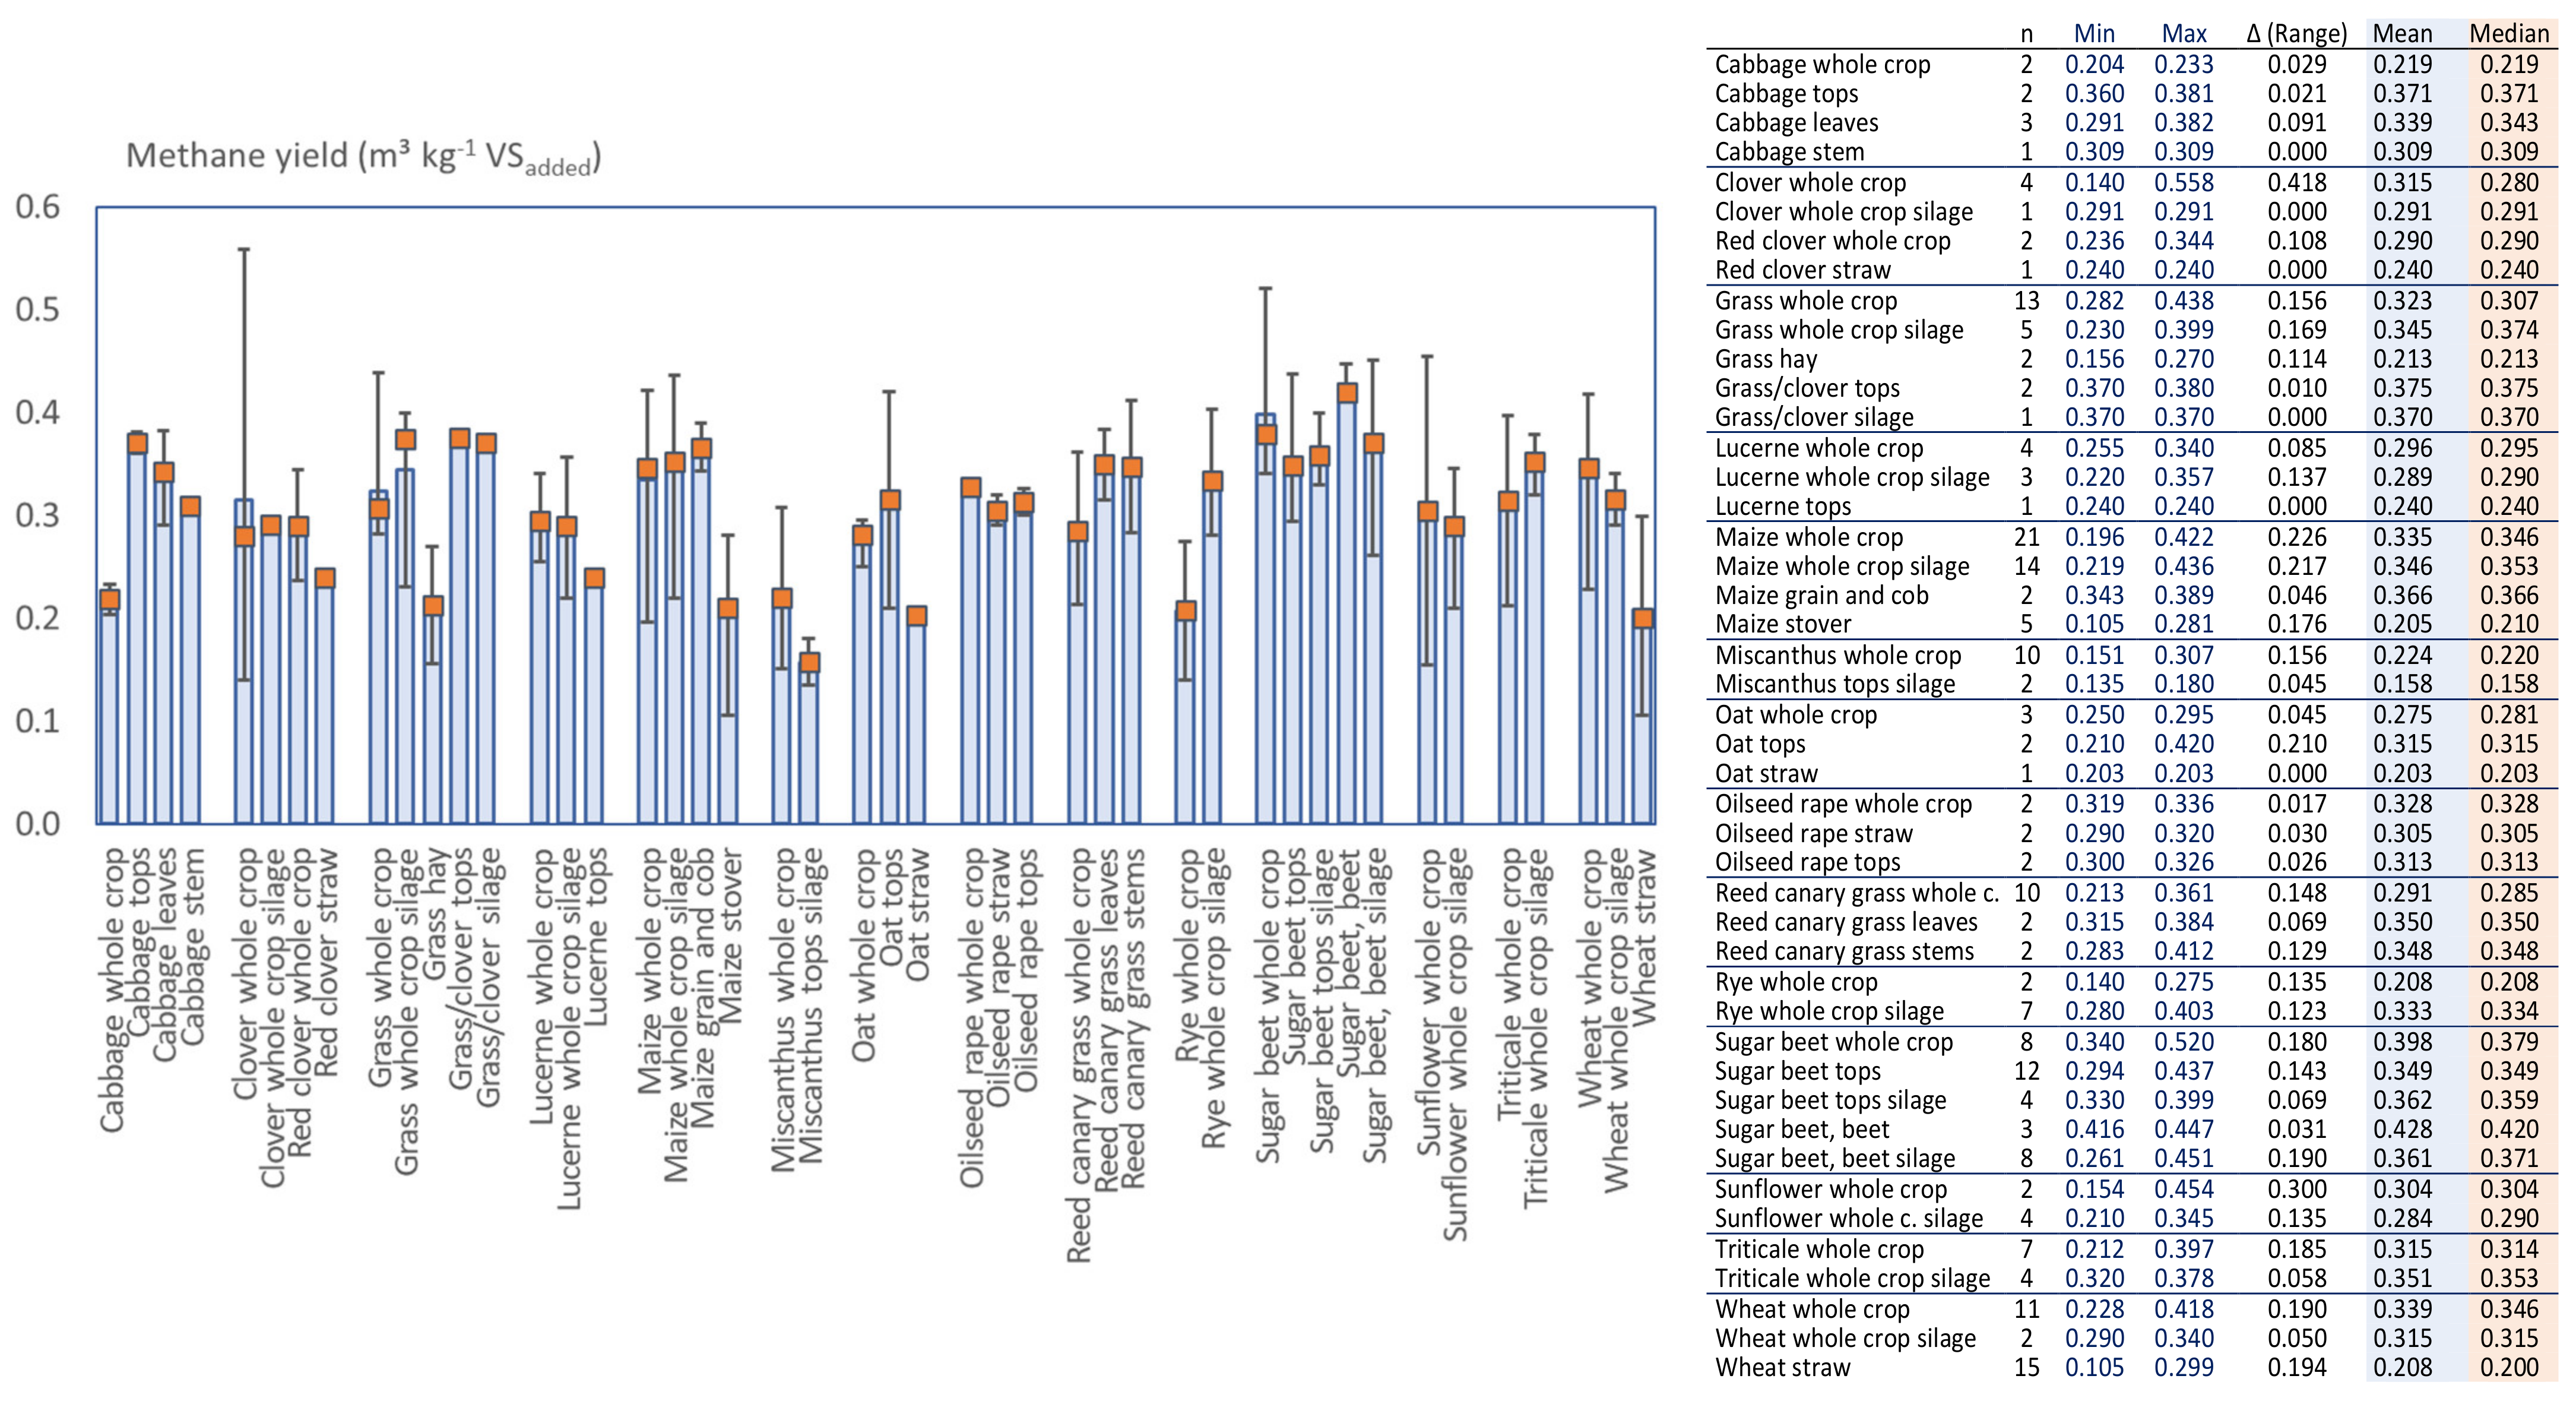
4.5. Which Crop Material Has the Highest Methane Potential?

A question often asked is, which crop material has the highest methane potential in anaerobic digestion? It can be seen from the above results that published data from methane potential assays do not necessarily provide a simple answer. The differences in reported values result both from the test protocols used and from the nature of the material tested, which also depends on the growth stage at which it was harvested and the method of storage, as discussed elsewhere [73,87].
It is important to know what the methane value is to be used for and to take the method of deriving the value into consideration. For example, BMP test results for a specific biomass may give the maximum methane potential, which is a value unlikely to be achieved in continuous laboratory trials or full-scale operation.
In addition to the specific energetic content of the biomass harvested, the biomass yield per hectare must be considered [62,74,141]. Thus, the actual methane yield in m3 CH4 ha−1 will be affected by climate, soil type, crop rotation regime [142,143], and many other agronomic conditions, which also lead to changes in the biomass yield in tonnes VS ha−1 [51,96,127]. Therefore, the ‘best’ crop to grow or crop residue to utilise for AD, in terms of maximising methane production per hectare per year, is likely to be one with the highest biomass yield under the particular geographic conditions rather than necessarily having a high specific methane yield during digestion.

5. Conclusions

Predicting specific methane yields for crop-based biomass is a difficult process. Selecting from published values can lead to considerable differences in the predicted outcome. Therefore, great caution is due when relying on literature data for estimates of the potential methane yield of a specific crop type in order to decide on its economic viability as an AD feedstock. Results from the literature indicate that variation between different crops is less than that within reported values for a single crop.
A wide range of techniques have been used to derive the reported values, and the results may be highly dependent both on the nature of the test and on the quality of its execution. Many publications display deficiencies in adequately documenting the equipment and procedures used, and too often, it is not clear whether reported gas volumes are expressed at STP. The casual reader looking for a methane value for a crop type might not analyse the documentation of the method applied in detail, and thus, deficiencies or low transparency might not trigger critical reflections on the usefulness of the published value. The test methods have partially been standardised, and the German VDI and DIN systems, along with the guidelines elaborated by the IWA ABAI Group, now offer a strong basis for comparability of results. Nevertheless, this does not resolve the challenge of a high variation among the published results, and therefore, this paper seeks to draw attention to the importance of assessing these aspects in the peer review process.
Where the biomass is available for analyses, theoretical calculations based on biochemical composition can provide quite accurate predictions of methane yields, and values obtained in this way appear to be compatible with those derived from experimental anaerobic digestion assays. The biochemical approach requires less practical testing compared to AD experiments; however, it still involves a substantial laboratory analytical procedure and does not avoid the issue of spatial and temporal variations in biomass properties.
Where the AD of crop-based materials is being considered as part of an integrated farming system, it may be better to consider the average biomass yield per hectare rather than the methane potential per unit of biomass, especially as relatively robust data on the former are often locally available. Whatever value is adopted for the potential methane yield and whatever the method used to predict or determine it, it must also be remembered that these are indicative values only and the methane yield actually generated in any full-scale continuous or semi-continuous process will be subject to many other factors including retention times, operating conditions, and co-digestion materials.

Author Contributions

Conceptualisation, Y.Z., S.K.-B., A.M.S. and S.H.; methodology, Y.Z., S.K.-B., A.M.S. and S.H.; formal analysis, S.K.-B. and A.M.S.; investigation, Y.Z., S.K.-B., A.M.S. and S.H.; data curation, Y.Z., S.K.-B. and A.M.S.; writing—original draft preparation, Y.Z., S.K.-B., A.M.S. and S.H.; writing—review and editing, Y.Z., S.K.-B., A.M.S. and S.H.; visualisation, S.K.-B. and A.M.S.; supervision, S.H.; project administration, A.M.S. All authors have read and agreed to the published version of the manuscript.

Funding

This work was partly carried out under the ESRC funded project RELU RES-229-25-002, and also builds on the EU project CROPGEN—Renewable Energy from Crops and Agrowastes, FP6 Grant no. 502824.

Institutional Review Board Statement

Not applicable.

Informed Consent Statement

Not applicable.

Data Availability Statement

No new data were created in this study; this is a review of published literature data, and the data used are documented in this article. Data sharing is not applicable to this article.

Acknowledgments

The authors would like to thank Charles Banks for his insightful comments during conceptualizing and conducting this study.

Conflicts of Interest

The authors declare no conflict of interest. The funders had no role in the design of the study; in the collection, analyses, or interpretation of data; in the writing of the manuscript, or in the decision to publish the results.

Appendix A. Literature Data from Different Types of Assays

Table A1 lists the data discussed in Section 3.2 (BMP tests) and Table A2 lists those examined in Section 3.3 (short-duration batch test). The data from semi-continuous and continuous tests are reported in Table A3 (discussed in Section 3.4). In Table A3, note that the data for Stewart et al. [110] are given in terms of TSadded, as there was not enough information given to convert them to VSadded.
Table A1. Methane values derived from BMP and long retention batch tests.
ReferenceCropsCrop PartsMethane Yield (m3 kg−1 VSadded)Comments
Amon et al. [51]MaizeWhole crop0.359–0.422Range of varieties
MaizeWhole crop0.343–0.407Range of harvest times
WheatWhole crop0.228–0.343Range of harvest times
RyeWhole crop0.140–0.275Range of harvest times
SunflowersWhole crop0.154–0.454Range of harvest times
TriticaleWhole crop0.212–0.265Range of harvest times
Bauer et al. [53]BarleyWhole crop0.375Silage
LucerneWhole crop0.357Silage
MaizeWhole crop0.345Silage
SorghumWhole crop0.362Silage
SunflowerWhole crop0.345Silage
WheatStraw0.276
Chiumenti et al. [61]GrassWhole crop0.308–0.340
Cornell et al. [72]MaizeWhole crop0.33Ensiled
Feng et al. [41]FescueWhole crop0.294–0.310Ensiled
Gallegos et al. [50]WheatStraw0.179–0.244Ensiled and chopped
Garcia et al. [71]BarleyWhole crop0.280
MaizeWhole crop0.289
MilletWhole crop0.253
SorghumWhole crop0.313
TriticaleWhole crop0.351
Gunaseelan [32]CabbageStems0.309
Leaves0.291
CarrotLeaves0.241
Petiole0.309
Elephant grassLamina0.372
Sheath0.342
Garden beetLeaves0.231
PeaPods (seeds removed)0.390
PotatoPeels0.267
SudangrassWhole crop0.256
Turnip Leaves0.314
Haag et al. [57]Cup plantWhole crop0.228–0.261Several varieties, dried and ground
Heidarzadeh Vazifehkhoran et al. [54]Sugar beetBeet0.337–0.420Silage in open silos
Beet0.411–0.451Silage in closed silos
Jerger et al. [35]SorghumTops0.28–0.40Range of cultivars
Jurado et al. [44]MiscanthusWhole crop0.249Milled
WheatStraw0.200Milled
WillowWoody component0.082Milled
Kakuk et al. [45]WillowLeaves0.187–0.339Green (< 1 year), various harvest dates and species
Stems0.149–0.252
Stems0.195–0.212Woody (> year)
Kandel et al. [40]FescueWhole crop0.401–0.428Various harvest dates
Kandel et al. [39]Reed canary grassLeaf0.315–0.384Various harvest patterns
Reed canary grassStem0.283–0.412Various harvest patterns
Kaparaju et al. [67]CloverWhole crop0.14–0.21
Grass hayWhole crop0.27
OatsWhole crop0.25
Lehtomäki and Björnsson [64]Grass/cloverWhole crop0.37Silage
Sugar beetLeaves and beets0.45
WillowWhole crop0.29
Lehtomäki et al. [65]Giant knotweedTops0.17–0.27Range of harvest dates
Grass/clover mixTops0.37–0.38
Jerusalem artichokeTops0.36–0.37
LupineWhole crop0.3
Marrow kaleTops0.31–0.36
NettleTops0.31–0.32
OatTops0.21–0.42
Oilseed rapeStraw0.32
Red cloverStraw0.24
Reed canary grassWhole crop0.28–0.34
Sugar beet 0.34–0.43
Vetch–oat mixtureTops0.32–0.49
Whole crop0.4–0.41
Lehtomäki et al. [68]GrassWhole crop0.306
OatStraw0.203
Sugar beetTops0.353
Li et al. [79]MiscanthusWhole crop0.182Particle sizes 20 and 30 mm
Machmüller et al. [52]CloverWhole crop0.291Silage
MaizeGrain and cob0.343
Whole crop0.338Silage
RyeWhole crop0.324Silage
Sugar beetBeet0.261Silage
SunflowerWhole crop0.293Silage
Mast et al. [58]Cup plantWhole crop0.232–0.275Various dates, dried and milled
Giant knotweedWhole crop0.146–0.158Various dates, dried and milled
Energy dockWhole crop0.187–0.297Various dates, dried and milled
Tall wheatgrassWhole crop0.311–0.376Various dates, dried and milled
Mittweg et al. [27]MaizeWhole crop0.346–0.362
Cobs0.389
Nges et al. [78]MiscanthusWhole crop0.151–0.238Particle sizes 0.5–20 mm
Parawira et al. [69]PotatoTuber waste(0.42)Value for VS degraded
Sugar beetLeaves(0.52)Value for VS degraded
Peng et al. [76] MiscanthusWhole crop0.172–0.267Range of types and growth stages
Petersson et al. [37]Faba beanStraw(0.28) calculatedReported: 18.9 g (100g DM)−1
Oilseed rapeStraw(0.29)18.8 g (100g DM)−1
Winter ryeStraw(0.27)18.2 g (100g DM)−1
Pouech et al. [63]BarleyWhole crop0.356
CloverWhole crop0.350–0.558Range of harvest times
Forage sorghumWhole crop0.295
Grain sorghumWhole crop0.372
LucerneWhole crop0.340
MaizeWhole crop0.397
Oilseed rapeWhole crop0.336
RyegrassWhole crop0.390–0.409Fresh and ensiled samples
Sweet sorghumWhole crop0.352
WheatWhole crop0.384–0.418Range of harvest times
Rincón et al. [73]Wheat Whole crop0.311–0.360Various harvest dates
Rincón et al. [74]WheatWhole crop0.346–0.361Spring and winter planting
Ruf and Emmerling [59]Cup plantWhole crop0.236–0.2822 years, poorly drained, dried
Giant knotweedWhole crop0.189–0.2222 years, poorly drained, dried
Jerusalem artichokeWhole crop0.252–0.3012 years, poorly drained, dried
MaizeWhole crop0.282–0.3472 years, poorly drained, dried
Reed canary grassWhole crop0.277–0.2902 years, poorly drained, dried
Tall wheatgrassWhole crop0.268–0.3022 years, poorly drained, dried
Schmidt et al. [62]Cup plantWhole crop0.272–0.345Three sites, range of harvest dates
Giant knotweedWhole crop0.132–0.147Three sites, range of harvest dates
Reed canary grassWhole crop0.315–0.355Two sites, range of harvest dates
Tall wheatgrassWhole crop0.336–0.389Two sites, range of harvest dates
Virginia mallowWhole crop0.213–0.315Three sites, range of harvest dates
Seppälä et al. [66]CocksfootWhole crop0.308–0.382Range of sites and harvest dates
FescueWhole crop0.296–0.394Range of sites and harvest dates
TimothyWhole crop0.308–0.365Range of sites and harvest dates
Reed Canary GrassWhole crop0.253–0.351Range of sites and harvest dates
Thomas et al. [80]MiscanthusWhole crop0.166–0.202Various species
Virkajärvi et al. [77]GrassWhole crop0.302–0.307Various fertiliser strategies
Grass/clover mixWhole crop0.285–0.292Various fertiliser strategies
Wahid et al. [42]LucerneWhole crop0.255
Wahid et al. [43]MiscanthusWhole crop0.302–0.307Various harvest times
Zauner and Küntzel [36]Horse beanTops0.356
LucerneTops0.240
MaizeWhole crop0.270–0.298Various growth stages
Mixed grassWhole crop0.298–0.315Various fermentation periods
Sugar beetTops0.294
VetchTops0.323
Table A2. Methane values derived from short duration batch tests.
ReferenceCropsCrop PartsMethane Yield (m3 kg−1 VSadded)Comments
Allen et al. [106]Energy beetWhole crop0.375
Fodder beetWhole crop0.333
GrassWhole crop0.368
Whole crop0.374–0.399Silage, various harvests
Whole crop0.156Hay
MaizeWhole crop0.354Fresh
0.394Ensiled
Oilseed rapeWhole crop0.319
PotatoesWhole crop0.337–0.351Various species
Spring barleyWhole crop0.361
Spring wheatWhole crop0.340
Sugar beetWhole crop0.344
TriticaleWhole crop0.314
TurnipsWhole crop0.399
Winter barleyWhole crop0.367
Winter oatsWhole crop0.281
Winter wheatWhole crop0.354
Badger et al. [89]KaleTops0.296(Methane values calculated from biogas and indicated percentage of methane)
MaizeTops0.342
OatsWhole crop0.295
Sugar beetTops0.297
WheatStraw0.255
Bruni et al. [103]MaizeWhole crop0.313–0.401Range of varieties and harvest dates
Gissen et al. [102]HempWhole crop0.260–0.292Various fertiliser strategies
MaizeWhole crop0.327–0.382Various fertiliser strategies
Sugar beetRoot0.416–0.420Various fertiliser strategies
Tops0.362–0.367Various fertiliser strategies
TriticaleWhole crop0.397
Herrmann et al. [98]MaizeWhole crop0.331–0.378All crops as silage; range of silage periods
SorghumWhole crop0.317–0.346
Forage ryeWhole crop0.293–0.346
TriticaleWhole crop0.340–0.365
Herrmann et al. [99]MaizeWhole crop0.323–0.362All crops as silage; range of chopping length and silage periods
SorghumWhole crop0.298–0.336
Forage ryeWhole crop0.334–0.403
TriticaleWhole crop0.320–0.378
Winter ryeWhole crop0.321–0.336
Herrmann et al. [100]Sugar beetWhole crop0.350–0.399Silage
SunflowersWhole crop0.210–0.286Silage
Winter wheatWhole crop0.269–0.328Silage
Kaiser et al. [96]GrassWhole crop0.282–0.438Fresh
HempTops0.250–0.360Ensiled, various cuts
LucerneWhole crop0.260–0.330
MaizeWhole crop0.219–0.436Silage
MiscanthusTops0.135–0.180Ensiled
Red cloverWhole crop0.236–0.344Fresh and ensiled
RyegrassWhole crop0.220–0.290
0.235–0.395

Fresh and ensiled
SudangrassTops0.164–0.239Fresh and ensiled
Sugar beetBeet0.278–0.328Silage
Tops0.335–0.395
Kakuk et al. [114]MaizeStover0.210–0.281Various particles sizes and loadings
Kolbl et al. [108]Forage turnipWhole crop0.372Milled
MaizeWhole crop0.236Ensiled
TriticaleWhole crop0.287Chopped
Kreuger et al. [104]HempWhole crop0.199–0.270Range of harvest dates
Kreuger et al. [101]HempWhole crop0.301Fresh frozen
Whole crop0.272Ensiled
MaizeWhole crop0.363Fresh frozen
Whole crop0.367Ensiled
Sugar beetBeet0.447Low-sugar variety, fresh frozen
Beet0.405Low-sugar variety, ensiled
Tops0.437Low-sugar variety, fresh frozen
Tops0.367Low-sugar variety, ensiled
Mähnert et al. [97]CocksfootWhole crop0.33Fresh and ensiled
Meadow foxtailWhole crop0.31Fresh
RyegrassWhole crop0.36Fresh and ensiled
Nges et al. [107]WheatStraw0.297Dried and ground
Nizami and Murphy [92]RyegrassWhole crop0.483–0.493Fresh
Prade et al. [105]GrassWhole crop0.230–0.330Ensiled, range of harvest dates
RyeWhole crop0.280–0.350Ensiled, range of harvest dates
WheatWhole crop0.290–0.340Ensiled, range of harvest dates
Raposo et al. [93]MaizeWhole crop0.196–0.233Range of inoculum–substrate ratios
Spence et al. [7]GrassWhole crop0.359
RyegrassWhole crop0.294
TriticaleWhole crop0.380
WheatWhole crop0.283
Svensson et al. [91]Sugar beetTops0.33Ensiled
WheatStraw0.19
Tilvikiene et al. [95] CocksfootWhole crop0.291–0.446Various fertiliser and harvest times
Reed canary grassWhole crop0.233–0.361Various fertiliser and harvest times
Tall fescueWhole crop0.259–0.446Various fertiliser and harvest times
Yan et al. [94]BroccoliWhole crop
CabbageWhole crop0.204Ground
CauliflowerWhole crop0.250Ground
LeekWhole crop0.183Ground
Purple cabbageWhole crop0.233Ground
Zhao et al. [109]MaizeStover0.250Dried and ground
Zubr [90]CauliflowerLeaves0.341–0.352
ComfreyTops0.323–0.334
Jerusalem artichokeTops0.301–0.309
Oilseed rapeTops0.300–0.326Fresh and ensiled
RhubarbTops0.330–0.334
Sugar beetTops0.316–0.345
White cabbageTops0.360–0.381
Leaves0.343–0.382
Table A3. Methane values derived from continuous/semi-continuous experiments.
ReferenceCropsCrop PartsMethane Yield (m3 kg−1 VSadded)Comments
Haag et al. [57]Cup plantWhole crop0.220–0.244Various varieties, ensiled
Heeg et al. [82]WheatStraw0.105–0.173Two-phase, meso- and thermophilic
Kakuk et al. [114]MaizeStover0.105–0.177Wet and dry digestion
Lehtomäki and Björnsson [64]GrassWhole crop0.39Silage
Sugar beetBeets and tops0.38
WillowShoots0.16Chopped
Nges and Björnsson [112]Sugar beetRoots and tops0.343–0.383Various loading rates
Nges et al. [107]WheatStraw0.250-0.299Dried and ground, different loading
Nizami and Murphy [92]RyegrassWhole crop0.363–0.451Range of loading rates
Pohl et al. [81]WheatStraw0.127–0.180Two-phase, meso- and thermophilic
Pohl et al. [117]WheatStraw0.144–0.207Two-phase, meso- and thermophilic
Rincón et al. [116]Winter wheatWhole crop0.334Ensiled
Scherer et al. [111]Fodder beetBeet0.401
Veluchamy et al. [115]MaizeWhole crop0.360–0.410Ensiled
Zhu et al. [113]PotatoTubers0.387
The following values are not included further because they are not available (cannot be derived) on a VS basis.
Methane yield (m3 kg−1 TSadded)
Stewart et al. [110]GrassWhole crop0.217–0.292
Grass/clover mixWhole crop0.278
KaleTops0.179–0.304Fresh and ensiled
LucerneWhole crop0.248–0.390
MaizeTops0.231
OatsWhole crop0.227–0.257
WheatStraw0.245
BarleyStraw0.128–0.162Chopped and ground
PotatoTuber waste0.350–0.410

Appedix B. Calculated Methane Yields

Table A4 shows the data discussed in Section 3.6 (calculated methane yields based on the composition of the biomass).
Table A4. Examples of calculated methane values.
ReferenceCropsCrop PartsMethane Yield (m3 kg−1 VSadded)Comments
Linke et al. [121]BarleyWhole crop0.420
Fodder beetLeaves0.430
Beet0.411
Forage ryeWhole crop0.431
GrassWhole crop0.433
HempWhole crop0.409
LucerneWhole crop0.432
MaizeWhole crop0.422
RyeGrain0.419
Straw0.409
LfL [123]BarleyStraw0.196
BeansWhole crop0.277Green
Whole crop0.286Silage
Clover grassWhole crop0.284–0.325Various harvest dates
GrassWhole crop0.296–0.333Various harvest dates; Wet silage
Whole crop0.296–0.340Various harvest dates; Wilted silage
Grass hayWhole crop0.250–0.307Various harvest dates
LucerneWhole crop0.265–0.308Various harvest dates
MaizeWhole crop0.287–0.328Various harvest dates
Meadow grassWhole crop0.290–0.322Various harvest dates
MustardWhole crop0.358–0.368Various harvest dates
OatStraw0.197
Grain0.322
Oilseed rapeWhole crop0.341–0.356Various harvest dates; Green
Whole crop0.361–0.376Various harvest dates; Silage
Oilseed rapeStraw0.129
Seed0.504
Pasture grassWhole crop0.307–0.322Various harvest dates
Red cloverWhole crop0.278–0.316Various harvest dates
RyeStraw0.179
Grain0.365
Whole crop0.261Silage
RyegrassWhole crop0.287–0.320Various harvest dates
SainfoinWhole crop0.267–0.292Various harvest dates
Sugar beetTops0.321–0.331Various harvest dates
WheatStraw0.187
Grain0.370
Whole crop0.262Silage

Appendix C. Methane Values Reported without Methods

Table A5 lists examples of values published without providing information about the method how these were derived. Note that the methane yields for Koettner [125] were given per fresh material in the publication; using the indicated VS contents of the substrates, the methane yields per VS were calculated for inclusion in Table A5.
Table A5. Examples of methane values reported without methods.
ReferenceCropsCrop PartsMethane Yield (m3 kg−1 VSadded)Comments
Koettner [125]Milled grain 0.37
Grass 0.32Silage
Maize 0.32Silage
Meadow grass 0.32
Rape seed cake 0.46
Vegetable residues 0.38
KTBL [126,128]Fodder beetBeet0.364–0.496
Tops0.312Silage
HempWhole crop0.143
MaizeWhole crop0.304
Rape seed cake 0.439
RyeWhole crop0.313–0.319Fresh and ensiled
Sugar beetBeet0.357
Tops0.312Silage
WheatGrain0.33
Straw0.138
Weiland [129]BarleyWhole crop0.36Silage
CloverWhole crop0.35Silage
Fodder beetBeet and leaf0.456Silage
KaleWhole crop0.255Silage
LucerneWhole crop0.41Silage
MaizeWhole crop0.41Silage
Oilseed rapeWhole crop0.34Silage
PotatoTubers0.276Silage
RyegrassWhole crop0.41Silage
WheatWhole crop0.39Silage

References

  1. Anukam, A.; Mohammadi, A.; Naqvi, M.; Granström, K. A review of the chemistry of anaerobic digestion: Methods of accelerating and optimizing process efficiency. Processes 2019, 7, 504. [Google Scholar] [CrossRef] [Green Version]
  2. Achinas, S.; Euverink, G.J.W. Rambling facets of manure-based biogas production in Europe: A briefing. Renew. Sustain. Energy Rev. 2020, 119, 109566. [Google Scholar] [CrossRef]
  3. Ma, G.; Ndegwa, P.; Harrison, J.H.; Chen, Y. Methane yields during anaerobic co-digestion of animal manure with other feedstocks: A meta-analysis. Sci. Total Environ. 2020, 728, 138224. [Google Scholar] [CrossRef]
  4. Jeung, J.H.; Chung, W.J.; Chang, S.W. Evaluation of anaerobic co-digestion to enhance the efficiency of livestock manure anaerobic digestion. Sustainability 2019, 11, 7170. [Google Scholar] [CrossRef] [Green Version]
  5. Karki, R.; Chuenchart, W.; Surendra, K.C.; Shrestha, S.; Raskin, L.; Sung, S.; Hashimoto, A.; Kumar Khanal, S. Anaerobic co-digestion: Current status and perspectives. Bioresour. Technol. 2021, 330, 125001. [Google Scholar] [CrossRef] [PubMed]
  6. Iglesias, R.; Muñoz, R.; Polanco, M.; Díaz, I.; Susmozas, A.; Moreno, A.D.; Guirado, M.; Carreras, N.; Ballesteros, M. Biogas from anaerobic digestion as an energy vector: Current upgrading development. Energies 2021, 14, 2742. [Google Scholar] [CrossRef]
  7. Spence, A.; Blanco Madrigal, E.; Patil, R.; Bajón Fernández, Y. Evaluation of anaerobic digestibility of energy crops and agricultural by-products. Bioresour. Technol. Rep. 2019, 5, 243–250. [Google Scholar] [CrossRef] [Green Version]
  8. Nwokolo, N.; Mukumba, P.; Obileke, K.; Enebe, M. Waste to energy: A focus on the impact of substrate type in biogas production. Processes 2020, 8, 1224. [Google Scholar] [CrossRef]
  9. Frigon, J.C.; Guiot, S.R. Biomethane production from starch and lignocellulosic crops: A comparative review. Biofuels Bioprod. Biorefin. 2010, 4, 447–458. [Google Scholar] [CrossRef] [Green Version]
  10. Gunaseelan, V.N. Anaerobic digestion of biomass for methane production: A review. Biomass Bioenergy 1997, 13, 83–114. [Google Scholar] [CrossRef]
  11. Martínez-Gutiérrez, E. Biogas production from different lignocellulosic biomass sources: Advances and perspectives. 3 Biotech 2018, 8, 233. [Google Scholar] [CrossRef]
  12. Dar, R.A.; Parmar, M.; Dar, E.A.; Sani, R.K.; Phutela, U.G. Biomethanation of agricultural residues: Potential, limitations and possible solutions. Renew. Sustain. Energy Rev. 2021, 135, 110217. [Google Scholar] [CrossRef]
  13. Lesteur, M.; Bellon-Maurel, B.; Gonzalez, C.; Latrille, E.; Roger, J.M.; Junqua, G.; Steyera, J.P. Alternative methods for determining anaerobic biodegradability: A review. Process Biochem. 2010, 45, 431–440. [Google Scholar] [CrossRef]
  14. Murphy, J.; Braun, R.; Weiland, P.; Wellinger, A. Biogas from Crop Digestion. IEA Bioenergy: Cork, Ireland, 2011. [Google Scholar]
  15. Raposo, F.; De la Rubia, M.A.; Fernández-Cegrí, V.; Borja, R. Anaerobic digestion of solid organic substrates in batch mode: An overview relating to methane yields and experimental procedures. Renew. Sustain. Energy Rev. 2012, 16, 861–877. [Google Scholar] [CrossRef]
  16. Kulichkova, G.I.; Ivanova, T.S.; Koettner, M.; Volodko, O.I.; Spivak, S.I.; Tsygankov, S.P.; Blume, Y.B. Plant feedstocks and their biogas production potentials. Open Agric. J. 2020, 14, 219–234. [Google Scholar] [CrossRef]
  17. Weiland, P. Biogas production: Current state and perspectives. Appl. Microbiol. Biotechnol. 2010, 85, 849–860. [Google Scholar] [CrossRef] [PubMed]
  18. Ward, A.J.; Hobbs, P.J.; Holliman, P.J.; Jones, D.L. Optimisation of the anaerobic digestion of agricultural resources. Bioresour. Technol. 2008, 99, 7928–7940. [Google Scholar] [CrossRef]
  19. Nizami, A.-S.; Murphy, J.D. What type of digester configurations should be employed to produce biomethane from grass silage? Renew. Sustain. Energy Rev. 2010, 14, 1558–1568. [Google Scholar] [CrossRef]
  20. Pererva, Y.; Miller, C.D.; Sims, R.C. Existing empirical kinetic models in biochemical methane potential (BMP) testing, their selection and numerical solution. Water 2020, 12, 1831. [Google Scholar] [CrossRef]
  21. Raposo, F.; Borja, R.; Ibelli-Bianco, C. Predictive regression models for biochemical methane potential tests of biomass samples: Pitfalls and challenges of laboratory measurements. Renew. Sustain. Energy Rev. 2020, 127, 109890. [Google Scholar] [CrossRef]
  22. Angelidaki, I.; Sanders, W. Assessment of the anaerobic biodegradability of macropollutants. Rev. Environ. Sci. Biotechnol. 2004, 3, 117–129. [Google Scholar] [CrossRef]
  23. Angelidaki, I.; Alves, M.; Bolzonella, D.; Borzacconi, L.; Campos, J.L.; Guwy, A.J.; Kalyuzhnyi, S.; Jenicek, P.; van Lier, J.B. Defining the biomethane potential (BMP) of solid organic wastes and energy crops: A proposed protocol for batch assays. Water Sci. Technol. 2009, 59, 927–934. [Google Scholar] [CrossRef] [Green Version]
  24. Holliger, C.; Alves, M.; Andrade, D.; Angelidaki, I.; Astals, S.; Baier, U.; Bougrier, C.; Buffière, P.; Carballa, M.; De Wilde, V.; et al. Towards a standardization of biomethane potential tests. Water Sci. Technol. 2016, 74, 2515–2522. [Google Scholar] [CrossRef] [PubMed]
  25. Esposito, G.; Frunzo, L.; Liotta, F.; Panico, A.; Pirozzi, F. Bio-methane potential tests to measure the biogas production from the digestion and co-digestion of complex organic substrates. Open Environ. Eng. J. 2012, 5, 1–8. [Google Scholar] [CrossRef]
  26. Weinrich, S.; Schäfer, F.; Bochmann, G.; Liebetrau, J. Value of Batch Tests for Biogas Potential Analysis. In Method Comparison and Challenges of Substrate and Efficiency Evaluation of Biogas Plants; IEA Bioenergy Task 37; University College Cork: Cork, Ireland, 2018; ISBN 978-1-910154-49-6. [Google Scholar]
  27. Mittweg, G.; Oechsner, H.; Hahn, V.; Lemmer, A.; Reinhardt-Hanisch, A. Repeatability of a laboratory batch method to determine the specific biogas and methane yields. Eng. Life Sci. 2012, 12, 270–278. [Google Scholar] [CrossRef]
  28. Koch, K.; Hafner, S.D.; Weinrich, S.; Astals, S.; Holliger, C. Power and limitations of biochemical methane potential (BMP) tests. Front. Energy Res. 2020, 8, 63. [Google Scholar] [CrossRef]
  29. Amodeo, C.; Hafner, S.D.; Teixeira Franco, R.; Benbelkacem, H.; Moretti, P.; Bayard, R.; Buffière, P. How different are manometric, gravimetric, and automated volumetric BMP results? Water 2020, 12, 1839. [Google Scholar] [CrossRef]
  30. Filer, J.; Ding, H.H.; Chang, S. Biochemical methane potential (BMP) assay method for anaerobic digestion research. Water 2019, 11, 921. [Google Scholar] [CrossRef] [Green Version]
  31. Holliger, C.; Astals, S.; Fruteau de Laclos, H.; Hafner, S.D.; Koch, K.; Weinrich, S. Towards a standardization of biomethane potential tests: A commentary. Water Sci. Technol. 2021, 83, 247–250. [Google Scholar] [CrossRef]
  32. Gunaseelan, V.N. Biochemical methane potential of fruits and vegetable solid waste feedstocks. Biomass Bioenergy 2004, 26, 389–399. [Google Scholar] [CrossRef]
  33. Zhang, Y.; Kusch-Brandt, S.; Heaven, S.; Banks, C.J. Effect of pasteurisation on methane yield from food waste and other substrates in anaerobic digestion. Processes 2020, 8, 1351. [Google Scholar] [CrossRef]
  34. Owen, W.F.; Stuckey, D.C.; Healy, J.B.; Young, L.Y.; Mc Carty, P.L. Bioassay for monitoring biochemical methane potential and anaerobic toxicity. Water Res. 1979, 13, 485–492. [Google Scholar] [CrossRef]
  35. Jerger, D.E.; Chynoweth, D.P.; Isaacson, H.R. Anaerobic digestion of sorghum biomass. Biomass 1987, 14, 99–113. [Google Scholar] [CrossRef]
  36. Zauner, E.; Küntzel, U. Methane production from ensiled plant material. Biomass 1986, 10, 207–223. [Google Scholar] [CrossRef]
  37. Petersson, A.; Thomsen, M.H.; Hauggaard-Nielsen, H.; Thomsen, A.-B. Potential bioethanol and biogas production using lignocellulosic biomass from winter rye, oilseed rape and faba bean. Biomass Bioenergy 2007, 31, 812–819. [Google Scholar] [CrossRef] [Green Version]
  38. Hansen, T.L.; Schmidt, J.E.; Angelidaki, I.; Marca, E.; la Cour Jansen, J.; Mosbæk, H.; Christensen, T.H. Method for determination of methane potentials of solid organic waste. Waste Manag. 2004, 24, 393–400. [Google Scholar] [CrossRef]
  39. Kandel, T.P.; Sutaryo, S.; Møller, H.B.; Jørgensen, U.; Lærke, P.E. Chemical composition and methane yield of reed canary grass as influenced by harvesting time and harvest frequency. Bioresour. Technol. 2013, 130, 659–666. [Google Scholar] [CrossRef]
  40. Kandel, T.P.; Ward, A.J.; Elsgaard, L.; Møller, H.B.; Lærke, P.E. Methane yield from anaerobic digestion of festulolium and tall fescue cultivated on a fen peatland under different harvest managements. Acta Agric. Scand. Sect. B—Soil Plant Sci. 2017, 67, 670–677. [Google Scholar] [CrossRef]
  41. Feng, L.; Kristensen, E.F.; Moset, V.; Ward, A.J.; Møller, H.B. Ensiling of tall fescue for biogas production: Effect of storage time, additives and mechanical pretreatment. Energy Sustain. Dev. 2018, 47, 143–148. [Google Scholar] [CrossRef]
  42. Wahid, R.; Feng, L.; Cong, W.-F.; Ward, A.J.; Møller, H.B.; Eriksen, J. Anaerobic mono-digestion of lucerne, grass and forbs—Influence of species and cutting frequency. Biomass Bioenergy 2018, 109, 199–208. [Google Scholar] [CrossRef]
  43. Wahid, R.; Nielsen, S.F.; Hernandez, V.M.; Ward, A.J.; Gislum, R.; Jørgensen, U.; Møller, H.B. Methane production potential from Miscanthus sp.: Effect of harvesting time, genotypes and plant fractions. Biosyst. Eng. 2015, 133, 71–80. [Google Scholar] [CrossRef]
  44. Jurado, E.; Gavala, H.N.; Skiadas, I.V. Enhancement of methane yield from wheat straw, miscanthus and willow using aqueous ammonia soaking. Environ. Technol. 2013, 34, 2069–2075. [Google Scholar] [CrossRef]
  45. Kakuk, B.; Bagi, Z.; Rákhely, G.; Maróti, G.; Dudits, D.; Kovács, K.L. Methane production from green and woody biomass using short rotation willow genotypes for bioenergy generation. Bioresour. Technol. 2021, 333, 125223. [Google Scholar] [CrossRef]
  46. German Standard Methods for the Examination of Water, Waste Water and Sludge; Sludge and Sediments (Group S); DIN 38414-8; Determination of the Amenability to Anaerobic Digestion (S 8); Deutsches Institut Fuer Normung e.V.: Berlin, Germany, 1985.
  47. Fermentation of Organic Materials. Characterisation of the Substrates, Sampling, Collection of Material Data, Fermentation Tests; VDI 4630; VDI-Handbuch Energietechnik, Issue 2006; VDI: Duesseldorf, Germany, 2006.
  48. Fermentation of Organic Materials. Characterisation of the Substrate, Sampling, Collection of Material Data, Fermentation Tests; VDI 4630 (updated 2016); VDI-Handbuch Energietechnik, Issue 2016; VDI: Duesseldorf, Germany, 2016.
  49. Linke, B.; Heiermann, M.; Grundmann, P.; Hertwig, P. Grundlagen, Verfahren und Potenzial der Biogasgewinnung im Land Brandenburg. In Biogas in der Landwirtschaft—Leitfaden für Landwirte und Investoren im Land Brandenburg, 2nd ed.; Heiermann, M., Plöchl, M., Eds.; Ministerium für Landwirtschaft Umweltschutz und Raumordnung des Landes Brandenburg: Potsdam, Germany, 2003; pp. 10–23. [Google Scholar]
  50. Gallegos, D.; Wedwitschka, H.; Moeller, L.; Zehnsdorf, A.; Stinner, W. Effect of particle size reduction and ensiling fermentation on biogas formation and silage quality of wheat straw. Bioresour. Technol. 2017, 245, 216–224. [Google Scholar] [CrossRef] [PubMed]
  51. Amon, T.; Amon, B.; Kryvoruchko, V.; Machmüller, A.; Hopfner-Sixt, K.; Bodiroza, V.; Hrbek, R.; Friedel, J.; Pötsch, E.; Wagentristl, H.; et al. Methane production through anaerobic digestion of various energy crops grown in sustainable crop rotations. Bioresour. Technol. 2007, 98, 3204–3212. [Google Scholar] [CrossRef]
  52. Machmüller, A.; Hrbek, R.; Kryvoruchko, V.; Amon, T. Biogas Production from Energy Crops produced on Sustainable Crop Rotations. In Proceedings of the 15th European Biomass Conference, Berlin, Germany, 7–11 May 2007. [Google Scholar]
  53. Bauer, A.; Leonhartsberger, C.; Bösch, P.; Amon, B.; Friedl, A.; Amon, T. Analysis of methane yields from energy crops and agricultural by-products and estimation of energy potential from sustainable crop rotation systems in EU-27. Clean Technol. Environ. Policy 2010, 12, 153–161. [Google Scholar] [CrossRef]
  54. Heidarzadeh Vazifehkhoran, A.; Triolo, J.M.; Larsen, S.U.; Stefanek, K.; Sommer, S.G. Assessment of the variability of biogas production from sugar beet silage as affected by movement and loss of the produced alcohols and organic acids. Energies 2016, 9, 368. [Google Scholar] [CrossRef] [Green Version]
  55. Schmidt, A.; Lemaigre, S.; Ruf, T.; Delfosse, P.; Emmerling, C. Miscanthus as biogas feedstock: Influence of harvest time and stand age on the biochemical methane potential (BMP) of two different growing seasons. Biomass Convers. Biorefinery 2018, 8, 245–254. [Google Scholar] [CrossRef]
  56. Helffrich, D.; Oechsner, H. Hohenheim biogas yield test—Comparing various laboratory methods on biomass fermentation. Landtechnik 2003, 58, 148–149. [Google Scholar]
  57. Haag, N.L.; Nägele, H.J.; Reiss, K.; Biertümpfel, A.; Oechsner, H. Methane formation potential of cup plant (Silphium perfoliatum). Biomass Bioenergy 2015, 75, 126–133. [Google Scholar] [CrossRef]
  58. Mast, B.; Lemmer, A.; Oechsner, H.; Reinhardt-Hanisch, A.; Claupein, W.; Graeff-Hönninger, S. Methane yield potential of novel perennial biogas crops influenced by harvest date. Ind. Crops Prod. 2014, 58, 194–203. [Google Scholar] [CrossRef]
  59. Ruf, T.; Emmerling, C. Site-adapted production of bioenergy feedstocks on poorly drained cropland through the cultivation of perennial crops. A feasibility study on biomass yield and biochemical methane potential. Biomass Bioenergy 2018, 119, 429–435. [Google Scholar] [CrossRef]
  60. Hafner, S.D.; de Laclos, H.F.; Koch, K.; Holliger, C. Improving inter-laboratory reproducibility in measurement of biochemical methane potential (BMP). Water 2020, 12, 1752. [Google Scholar] [CrossRef]
  61. Chiumenti, A.; Boscaro, D.; Da Borso, F.; Sartori, L.; Pezzuolo, A. Biogas from fresh spring and summer grass: Effect of the harvesting period. Energies 2018, 11, 1466. [Google Scholar] [CrossRef] [Green Version]
  62. Schmidt, A.; Lemaigre, S.; Delfosse, P.; von Francken-Welz, H.; Emmerling, C. Biochemical methane potential (BMP) of six perennial energy crops cultivated at three different locations in W-Germany. Biomass Convers. Biorefin. 2018, 8, 873–888. [Google Scholar] [CrossRef]
  63. Pouech, P.; Fruteau, H.; Bewa, H. Agricultural crops for biogas production on anaerobic digestion plants. In Biomass for Energy and Industry, Proceeding of the International Conference, Würzburg, Germany, 8–11 June 1998; C.A.R.M.E.N.: Straubing, Germany, 1998; pp. 163–165. [Google Scholar]
  64. Lehtomäki, A.; Björnsson, L. Two-stage anaerobic digestion of energy crops: Methane production, nitrogen mineralisation and heavy metal mobilisation. Environ. Technol. 2006, 27, 209–218. [Google Scholar] [CrossRef]
  65. Lehtomäki, A.; Huttunena, S.; Rintala, J. Laboratory investigations on co-digestion of energy crops and crop residues with cow manure for methane production: Effect of crop to manure ratio. Resour. Conserv. Recycl. 2007, 51, 591–609. [Google Scholar] [CrossRef]
  66. Seppälä, M.; Paavola, T.; Lehtomäki, A.; Rintala, J. Biogas production from boreal herbaceous grasses—Specific methane yield and methane yield per hectare. Bioresour. Technol. 2009, 100, 2952–2958. [Google Scholar] [CrossRef]
  67. Kaparaju, P.; Luostarinen, S.; Kalmari, E.; Kalmari, J.; Rintala, J. Co-digestion of energy crops and industrial confectionery by-products with cow manure: Batch-scale and farm-scale evaluation. Water Sci. Technol. 2002, 45, 275–280. [Google Scholar] [CrossRef]
  68. Lehtomäki, A.; Viinikainen, T.; Rintala, J. Screening boreal energy crops and crop residues for methane biofuel production. Biomass Bioenergy 2008, 32, 541–550. [Google Scholar] [CrossRef]
  69. Parawira, W.; Murto, M.; Zvauya, R.; Mattiasson, B. Anaerobic batch digestion of solid potato waste alone and in combination with sugar beet leaves. Renew. Energy 2004, 29, 1811–1823. [Google Scholar] [CrossRef]
  70. Lehtomäki, A.; Department of Biological and Environmental Science, University of Jyväskylä, Jyväskylä, Finland. Personal Communication, November 2011.
  71. Garcia, N.H.; Mattioli, A.; Gil, A.; Frison, N.; Battista, F.; Bolzonella, D. Evaluation of the methane potential of different agricultural and food processing substrates for improved biogas production in rural areas. Renew. Sustain. Energy Rev. 2019, 112, 1–10. [Google Scholar] [CrossRef]
  72. Cornell, M.; Heaven, S.; Banks, C. Impact of the addition of maize on the anaerobic digestion of cattle slurry. In Proceedings of the 5th IWA International Symposium on Anaerobic Digestion of Solid Wastes and Energy Crops, Hammamet, Tunisia, 25–28 May 2008. [Google Scholar]
  73. Rincón, B.; Banks, C.J.; Heaven, S. Biochemical methane potential of winter wheat (Triticum aestivum L.): Influence of growth stage and storage practice. Bioresour. Technol. 2010, 101, 8179–8184. [Google Scholar] [CrossRef] [Green Version]
  74. Rincón, B.; Heaven, S.; Salter, A.M.; Banks, C.J. Anaerobic digestion of spring and winter wheat: Comparison of net energy yields. J. Environ. Sci. Health Part A 2016, 51, 1084–1089. [Google Scholar] [CrossRef] [Green Version]
  75. Walker, M.; Zhang, Y.; Heaven, S.; Banks, C. Potential errors in the quantitative evaluation of biogas production in anaerobic digestion processes. Bioresour. Technol. 2009, 100, 6339–6346. [Google Scholar] [CrossRef] [Green Version]
  76. Peng, X.; Li, C.; Liu, J.; Yi, Z.; Han, Y. Changes in composition, cellulose degradability and biochemical methane potential of Miscanthus species during the growing season. Bioresour. Technol. 2017, 235, 389–395. [Google Scholar] [CrossRef]
  77. Virkajärvi, P.; Hyrkäs, M.; Kykkänen, S.; Pyykkönen, V.; Laakso, J.; Kekkonen, P.; Ervasti, S.; Luostarinen, S. Effect of digestate application, N fertilisation and forage species on biomass and biogas production. Sustainable meat and milk production from grasslands 2018. In Proceedings of the 27th General Meeting of the European Grassland Federation, Cork, Ireland, 17–21 June 2018; pp. 688–690. [Google Scholar]
  78. Nges, I.A.; Li, C.; Wang, B.; Xiao, L.; Yi, Z.; Liu, J. Physio-chemical pretreatments for improved methane potential of Miscanthus lutarioriparius. Fuel 2016, 166, 29–35. [Google Scholar] [CrossRef]
  79. Li, C.; Liu, G.; Nges, I.A.; Liu, J. Enhanced biomethane production from miscanthus lutarioriparius using steam explosion pretreatment. Fuel 2016, 179, 267–273. [Google Scholar] [CrossRef]
  80. Thomas, H.L.; Arnoult, S.; Brancourt-Hulmel, M.; Carrère, H. Methane production variability according to miscanthus genotype and alkaline pretreatments at high solid content. BioEnergy Res. 2019, 12, 325–337. [Google Scholar] [CrossRef]
  81. Pohl, M.; Mumme, J.; Heeg, K.; Nettmann, E. Thermo-and mesophilic anaerobic digestion of wheat straw by the upflow anaerobic solid-state (UASS) process. Bioresour. Technol. 2012, 124, 321–327. [Google Scholar] [CrossRef] [PubMed]
  82. Heeg, K.; Pohl, M.; Sontag, M.; Mumme, J.; Klocke, M.; Nettmann, E. Microbial communities involved in biogas production from wheat straw as the sole substrate within a two-phase solid-state anaerobic digestion. Syst. Appl. Microbiol. 2014, 37, 590–600. [Google Scholar] [CrossRef]
  83. Rocha-Meneses, L.; Raud, M.; Orupõld, K.; Kikas, T. Potential of bioethanol production waste for methane recovery. Energy 2019, 173, 133–139. [Google Scholar] [CrossRef]
  84. Ohlsson, J.A.; Harman-Ware, A.E.; Sandgren, M.; Schnürer, A. Biomass recalcitrance in willow under two biological conversion paradigms: Enzymatic hydrolysis and anaerobic digestion. BioEnergy Res. 2020, 13, 260–270. [Google Scholar] [CrossRef] [Green Version]
  85. Linke, B.; Schelle, H. Solid state anaerobic digestion of organic wastes. In Proceedings of the Conference Agricultural Engineering into the Third Millenium, AgEng2000, Coventry, UK, 2–7 July 2000. [Google Scholar]
  86. Heiermann, M.; Plöchl, M.; Linke, B.; Schelle, H. Biogas production in agriculture by co-fermentation of energy crops. Asp. Appl. Biol. 2001, 65, 65–70. [Google Scholar]
  87. Heiermann, M.; Plöchl, M.; Linke, B.; Schelle, H. Preliminary evaluation of some cereals as energy crops for biogas production. In Proceedings of the World Renewable Energy Congress VII (WREC), Cologne, Germany, 29 June–5 July 2002. [Google Scholar]
  88. Heiermann, M.; Plöchl, M. Crops—A big potential for biogas production. In Proceedings of the World Renewable Energy Congress VIII, Denver, CO, USA, 28 August–3 September 2004. [Google Scholar]
  89. Badger, D.M.; Bogue, M.J.; Stewart, D.J. Biogas production from crops and organic wastes 1: Results of batch digestions. N. Z. J. Sci. 1979, 22, 11–20. [Google Scholar]
  90. Zubr, J. Methanogenic fermentation of fresh and ensiled plant materials. Biomass 1986, 11, 159–171. [Google Scholar] [CrossRef]
  91. Svensson, L.M.; Christensson, K.; Björnsson, L. Biogas production from crop residues on a farm-scale level: Is it economically feasible under conditions in Sweden. Bioprocess Biosyst. Eng. 2005, 28, 139–148. [Google Scholar] [CrossRef]
  92. Nizami, A.-S.; Murphy, J.D. Optimizing the operation of a two-phase anaerobic digestion system digesting grass silage. Environ. Sci. Technol. 2011, 45, 7561–7569. [Google Scholar] [CrossRef] [PubMed]
  93. Raposo, F.; Banks, C.J.; Siegert, I.; Heaven, S.; Borja, R. Influence of inoculum to substrate ratio on the biochemical methane potential of maize in batch tests. Process Biochem. 2006, 41, 1444–1450. [Google Scholar] [CrossRef]
  94. Yan, H.; Zhao, C.; Zhang, J.; Zhang, R.; Xue, C.; Liu, G.; Chen, C. Study on biomethane production and biodegradability of different leafy vegetables in anaerobic digestion. AMB Express 2017, 7, 27. [Google Scholar] [CrossRef] [PubMed] [Green Version]
  95. Tilvikiene, V.; Kadziuliene, Z.; Dabkevicius, Z.; Venslauskas, K.; Navickas, K. Feasibility of tall fescue, cocksfoot and reed canary grass for anaerobic digestion: Analysis of productivity and energy potential. Ind. Crops Prod. 2016, 84, 87–96. [Google Scholar] [CrossRef]
  96. Kaiser, F.; Diepolder, M.; Eder, J.; Hartmann, S.; Prestele, H.; Gerlach, R.; Ziehfreund, G.; Gronauer, A. Ertragspotenziale verschiedener nachwachsender Rohstoffe in landwirtschaftlichen Biogasanlagen. In Biogas in Bayern; Bayerische Landesanstalt für Landwirtschaft: Freising, Germany, 2004; pp. 43–56. [Google Scholar]
  97. Mähnert, P.; Heiermann, M.; Linke, B. Batch- and semi-continuous biogas production from different grass species. Agric. Eng. Int. CIGR Ej. 2005, 7, 1–11. [Google Scholar]
  98. Herrmann, C.; Heiermann, M.; Idler, C. Effects of ensiling, silage additives and storage period on methane formation of biogas crops. Bioresour. Technol. 2011, 102, 5153–5161. [Google Scholar] [CrossRef]
  99. Herrmann, C.; Heiermann, M.; Idler, C.; Prochnow, A. Particle size reduction during harvesting of crop feedstock for biogas production I: Effects on ensiling process and methane yields. Bioenergy Res. 2012, 5, 926–936. [Google Scholar] [CrossRef]
  100. Herrmann, C.; Idle, C.; Heiermann, M. Biogas crops grown in energy crop rotations: Linking chemical composition and methane production characteristics. Bioresour. Technol. 2016, 206, 23–35. [Google Scholar] [CrossRef] [Green Version]
  101. Kreuger, E.; Nges, I.A.; Björnsson, L. Ensiling of crops for biogas production: Effects on methane yield and total solids determination. Biotechnol. Biofuels 2011, 4, 44. [Google Scholar] [CrossRef] [Green Version]
  102. Gissén, C.; Prade, T.; Kreuger, E.; Nges, I.A.; Rosenqvist, H.; Svensson, S.E.; Lantz, M.; Mattsson, J.E.; Börjesson, P.; Björnsson, L. Comparing energy crops for biogas production—Yields, energy input and costs in cultivation using digestate and mineral fertilisation. Biomass Bioenergy 2014, 64, 199–210. [Google Scholar] [CrossRef]
  103. Bruni, E.; Jensen, A.P.; Pedersen, E.S.; Angelidaki, I. Anaerobic digestion of maize focusing on variety, harvest time and pre-treatment. Appl. Energy 2010, 87, 2212–2217. [Google Scholar] [CrossRef]
  104. Kreuger, E.; Prade, T.; Escobar, F.; Svensson, S.-E.; Englund, J.-E.; Björnsson, L. Anaerobic digestion of industrial hemp—Effect of harvest time on methane energy yield per hectare. Biomass Bioenergy 2011, 35, 893–900. [Google Scholar] [CrossRef]
  105. Prade, T.; Svensson, S.E.; Hörndahl, T.; Kreuger, E. Impact of harvest date and cutting length of grass ley and whole-crop cereals on methane yield and economic viability as feedstock for biogas vehicle fuel production. Bioenergy Res. 2019, 12, 137–149. [Google Scholar] [CrossRef] [Green Version]
  106. Allen, E.; Wall, D.M.; Herrmann, C.; Murphy, J.D. A detailed assessment of resource of biomethane from first, second and third generation substrates. Renew. Energy 2016, 87, 656–665. [Google Scholar] [CrossRef]
  107. Nges, I.A.; Wang, B.; Cui, Z.; Liu, J. Digestate liquor recycle in minimal nutrients-supplemented anaerobic digestion of wheat straw. Biochem. Eng. J. 2015, 94, 106–114. [Google Scholar] [CrossRef]
  108. Kolbl, S.; Paloczi, A.; Panjan, J.; Stres, B. Addressing case specific biogas plant tasks: Industry oriented methane yields derived from 5 L Automatic Methane Potential Test Systems in batch or semi-continuous tests using realistic inocula, substrate particle sizes and organic loading. Bioresour. Technol. 2014, 153, 180–188. [Google Scholar] [CrossRef]
  109. Zhao, X.; Luo, K.; Zhang, Y.; Zheng, Z.; Cai, Y.; Wen, B.; Cui, Z.; Wang, X. Improving the methane yield of maize straw: Focus on the effects of pretreatment with fungi and their secreted enzymes combined with sodium hydroxide. Bioresour. Technol. 2018, 250, 204–213. [Google Scholar] [CrossRef]
  110. Stewart, D.J.; Bogue, M.J.; Badger, D.M. Biogas production from crops and organic wastes 2: Results from continuous digestion tests. N. Z. J. Sci. 1984, 27, 285–294. [Google Scholar]
  111. Scherer, P.A.; Dobler, S.; Rohardt, S.; Loock, R.; Büttner, B.; Nöldeke, P.; Brettschuh, A. Continuous biogas production from fodder beet silage as sole substrate. Water Sci. Technol. 2003, 48, 229–233. [Google Scholar] [CrossRef]
  112. Nges, I.A.; Björnsson, L. High methane yields and stable operation during anaerobic digestion of nutrient-supplemented energy crop mixtures. Biomass Bioenergy 2012, 47, 62–70. [Google Scholar] [CrossRef]
  113. Zhu, H.; Stadnyk, A.; Béland, M.; Seto, P. Co-production of hydrogen and methane from potato waste using a two-stage anaerobic digestion process. Bioresour. Technol. 2008, 99, 5078–5084. [Google Scholar] [CrossRef] [PubMed]
  114. Kakuk, B.; Kovács, K.L.; Szuhaj, M.; Rákhely, G.; Bagi, Z. Adaptation of continuous biogas reactors operating under wet fermentation conditions to dry conditions with corn stover as substrate. Anaerobe 2017, 46, 78–85. [Google Scholar] [CrossRef] [PubMed] [Green Version]
  115. Veluchamy, C.; Gilroyed, B.H.; Kalamdhad, A.S. Process performance and biogas production optimizing of mesophilic plug flow anaerobic digestion of corn silage. Fuel 2019, 253, 1097–1103. [Google Scholar] [CrossRef]
  116. Rincón, B.; Heaven, S.; Banks, C.J.; Zhang, Y. Anaerobic digestion of whole-crop winter wheat silage for renewable energy production. Energy Fuels 2012, 26, 2357–2364. [Google Scholar] [CrossRef] [Green Version]
  117. Pohl, M.; Heeg, K.; Mumme, J. Anaerobic digestion of wheat straw—Performance of continuous solid-state digestion. Bioresour. Technol. 2013, 146, 408–415. [Google Scholar] [CrossRef] [PubMed]
  118. Symons, G.E.; Buswell, A.M. The methane fermentation of carbohydrates. J. Am. Chem. Soc. 1933, 55, 2028–2036. [Google Scholar] [CrossRef]
  119. Buswell, A.M.; Hatfield, W.D. Anaerobic Fermentation—Bulletin 32; State of Illinois Department of Registration and Education: Urbana, IL, USA, 1936. [Google Scholar]
  120. Czepuck, K.; Oechsner, H.; Schumacher, B.; Lemmer, A. Hohenheim biogas yield test. Landtechnik 2006, 61, 82–83. [Google Scholar]
  121. Linke, B.; Baganz, K.; Schlauderer, R. Nutzung von Feldfrüchten zur Biogasgewinnung. Agaratechnische Forsch. 1999, 5, 81–90. [Google Scholar]
  122. DLG (Ed.) Futterwerttabellen—Wiederkäuer; DLG-Verlag: Frankfurt, Germany, 1997. [Google Scholar]
  123. LfL (Bayerische Landesanstalt für Landwirtschaft). Biogasausbeuten Verschiedener Substrate (Database). Available online: https://www.lfl.bayern.de/iba/energie/049711/ (accessed on 6 June 2021).
  124. Rodrigues, R.P.; Rodrigues, D.P.; Klepacz-Smolka, A.; Martins, R.C.; Quina, M.J. Comparative analysis of methods and models for predicting biochemical methane potential of various organic substrates. Sci. Total Environ. 2019, 649, 1599–1608. [Google Scholar] [CrossRef] [PubMed]
  125. Koettner, M. The role of biogas in German farm business development. In Proceedings of the Bioexell European Biogas Conference—Biogas in Society, Enniskillen, UK, 21–23 October 2004. [Google Scholar]
  126. KTBL (Ed.) Betriebsplanung Landwirtschaft 2008/09; KTBL: Darmstadt, Germany, 2009. [Google Scholar]
  127. Karpenstein-Machan, M. Energiepflanzenbau für Biogasanlagenbetreiber; DLG Verlag: Frankfurt, Germany, 2005. [Google Scholar]
  128. KTBL (Ed.) Wirtschaftlichkeitsrechner Biogas. Available online: https://daten.ktbl.de/biogas/ (accessed on 6 June 2021).
  129. Weiland, P. Production and energetic use of biogas from energy crops and wastes in Germany. Appl. Biochem. Biotechnol. 2003, 109, 263–274. [Google Scholar] [CrossRef]
  130. Hafner, S.D.; Astals, S. Systematic error in manometric measurement of biochemical methane potential: Sources and solutions. Waste Manag. 2019, 91, 147–155. [Google Scholar] [CrossRef]
  131. Müller, W.-R.; Frommert, I.; Jörg, R. Standardized methods for anaerobic biodegradability testing. Rev. Environ. Sci. Biotechnol. 2004, 3, 141–158. [Google Scholar] [CrossRef]
  132. Stolarski, M.J.; Snieg, M.; Krzyżaniak, M.; Tworkowski, J.; Szczukowski, S.; Graban, L.; Lajszner, W. Short rotation coppices, grasses and other herbaceous crops: Biomass properties versus 26 genotypes and harvest time. Ind. Crops Prod. 2018, 119, 22–32. [Google Scholar] [CrossRef]
  133. White, P.M.; Viator, R.P.; Webber, C.L. Temporal and varietal variation in sugarcane post-harvest residue biomass yields and chemical composition. Ind. Crops Prod. 2020, 154, 112616. [Google Scholar] [CrossRef]
  134. Butkute, B.; Lemežienė, N.; Kanapeckas, J.; Navickas, K.; Dabkevičius, Z.; Venslauskas, K. Cocksfoot, tall fescue and reed canary grass: Dry matter yield, chemical composition and biomass convertibility to methane. Biomass Bioenergy 2014, 66, 1–11. [Google Scholar] [CrossRef]
  135. Ierna, A.; Sortino, O.; Mauromicale, G. Biomass, seed and energy yield of Cynara cardunculus L. as affected by environment and season. Agronomy 2020, 10, 1548. [Google Scholar] [CrossRef]
  136. Bochmann, G.; Montgomery, L.F.R. Storage and pre-treatment of substrates for biogas production. In The Biogas Handbook; Woodhead Publishing Series in Energy; Wellinger, A., Murphy, J., Baxter, D., Eds.; Woodhead Publishing: Oxford, UK, 2013; pp. 85–103. [Google Scholar] [CrossRef] [Green Version]
  137. Alvarez, R.; Lidén, G. Semi-continuous co-digestion of solid slaughterhouse waste, manure, and fruit and vegetable waste. Renew. Energy 2008, 33, 726–734. [Google Scholar] [CrossRef]
  138. Demirel, B.; Scherer, P. Bio-methanization of energy crops through mono-digestion for continuous production of renewable biogas. Renew. Energy 2009, 34, 2940–2945. [Google Scholar] [CrossRef]
  139. Mähnert, P.; Linke, B. Kinetic study of biogas production from energy crops and animal waste slurry: Effect of organic loading rate and reactor size. Environ. Technol. 2009, 30, 93–99. [Google Scholar] [CrossRef]
  140. Pizarro-Loaiza, C.A.; Torres-Lozada, P.; Illa, J.; Palatsi, J.; Bonmatí, A. Effect of harvesting age and size reduction in the performance of anaerobic digestion of Pennisetum grass. Processes 2020, 8, 1414. [Google Scholar] [CrossRef]
  141. Brauer-Siebrecht, W.; Jacobs, A.; Christen, O.; Götze, P.; Koch, H.-J.; Rücknagel, J.; Märländer, B. Silage maize and sugar beet for biogas production in rotations and continuous cultivation: Dry matter and estimated methane yield. Agronomy 2016, 6, 2. [Google Scholar] [CrossRef] [Green Version]
  142. Wannasek, L.; Ortner, M.; Kaul, H.-P.; Amon, B.; Amon, T. Double-cropping systems based on rye, maize and sorghum: Impact of variety and harvesting time on biomass and biogas yield. Eur. J. Agron. 2019, 110, 125934. [Google Scholar] [CrossRef]
  143. Graß, R.; Malec, S.; Wachendorf, M. Biomass performance and competition effects in an established temperate agroforestry system of willow and grassland—Results of the 2nd rotation. Agronomy 2020, 10, 1819. [Google Scholar] [CrossRef]
Figure 1. BMP yields of crops (left side: graphical presentation, the shaded columns show the average of reported values, the orange squares indicate the median, and the lines indicate the range; right side: tabular presentation, n is the number of data points).
Processes 09 01565 g001
Figure 2. Methane yields from various crops obtained in short-retention batch tests (left side: graphical presentation, the shaded columns show the average of reported values, the orange squares indicate the median, and the lines indicate the range; right side: tabular presentation, n is the number of data points).
Processes 09 01565 g002
Figure 3. Methane yields obtained in experimental (batch and semi-continuous/continuous) tests (left side: graphical presentation, the shaded columns show the average of reported values, the orange squares indicate the median, and the lines indicate the range; right side: tabular presentation, n is the number of data points).
Processes 09 01565 g003
Figure 4. Methane yields separated into various crop parts or other specifications (left side: graphical presentation, the shaded columns show the average of reported values, the orange squares indicate the median, and the lines indicate the range; right side: tabular presentation, n is the number of data points).
Processes 09 01565 g004
Publisher’s Note: MDPI stays neutral with regard to jurisdictional claims in published maps and institutional affiliations.

