Article

Decomposition and Nutrient Releasing of Biochar Compound Materials in Soil with Different Textures

1
Department of Biological Science & Technology, I Shou University, Kaohsiung 84001, Taiwan
2
Department of Soil and Water Conservation, National Pingtung University of Science and Technology, Pingtung 91201, Taiwan
*
Author to whom correspondence should be addressed.
Processes 2021, 9(9), 1521; https://doi.org/10.3390/pr9091521
Submission received: 27 July 2021 / Revised: 24 August 2021 / Accepted: 24 August 2021 / Published: 27 August 2021
(This article belongs to the Section Environmental and Green Processes)

Abstract

:
Combining biochar with chemical fertilizers or compost not only improves the shortcomings of biochar’s lack of fertility, but also extends the benefits of the compost. The application of biochar composite materials will be a future agricultural management strategy. In this study bagasse compost was mixed with wood biochar (w/w) at rates of 0% (B), 25% (BC), 50% (BC3), and 100% (no biochar, C) to produce four types of particle biochar compound materials (pBCM). These materials were applied to two types of soil (sandy soil and clayey soil) for a 180-day incubation to determine the decomposition rate and the nutrient release efficiency of the pBCMs. The results showed that C treatment had the highest decomposition rate in both types of soil. Overall, the materials decomposed faster in the sandy soil than in the clayey soil. Plants were grown over two 30-day crop periods. The plant yields of treatments C and BC3 were the highest in the first period and respectively decreased and increased in the second period. The experiment results revealed that in the biochar–compost compounds, compost increased the use efficiency of nitrogen and phosphorus in the soil, and biochar increased the nutrient use efficiency in the second period. These compound materials had greater capacity for long-term supply of nutrients in soil than did single-component ones.

1. Introduction

Land degradation has been recognized as a serious global problem. The Intergovernmental Panel on Climate Change (IPCC) [1] reported that interactions between land degradation and climate change form a vicious cycle. The overuse of chemical fertilizer has resulted in hardened soil, decreased fertility, low soil quality, increased used of pesticides and herbicides, polluted air and water, and also produces greenhouse gasses. It also contains salt as well as other acidic materials, which are some of the most critical characteristics of chemical fertilizer and are expected to damage the soil in the long run. The excessive use of chemical fertilizers results in the degradation of land quality, soil acidification, and poor soil aggregate structures, thereby reducing crop productivity [2]. Numerous studies have reported that organic fertilizers can effectively improve land quality, soil structure, and tilth, and increase organic matter [3,4], microbial activity, and diversity in the soil [5,6,7,8]. Long-term use of organic fertilizers can mitigate soil deterioration. However, because of the rapid decomposition of organic fertilizers, farmers must regularly reapply organic fertilizers, which may incur additional costs and economic burdens.
In the past decade, biochar has been widely proposed as a material for soil improvement [5,7,8]. Biochar, a solid material containing abundant carbon, is created through pyrolysis of biomass in a low-oxygen environment [9]. Adding biochar to soil improves the physical properties of the soil, including increased soil aggregation, enhanced soil water retention, and increased soil corrosion resistance, and helps retain soil nutrients [5,7,8,10]. Jindo et al. (2020) [11] demonstrated that some biochars contains abundant potassium (K). Therefore, adding biochar to soil can satisfy crop K requirements and increase crop yield [5]. Moreover, biochar retains soil organic matter due to its porous structure and can effectively reduce greenhouse gas emissions (e.g., CO2 and N2O) [6].
Adding biochar to compost or chemical fertilizers can substantially increase soil fertility, enhance soil physical properties, sustain soil quality, and improve crop productivity [5,9,12,13,14,15]. Additionally, mixing biochar in fertilizers prevents the rapid decomposition of fertilizers or compost, enabling the fertilizer or compost to serve as a long-term supply of nutrients for crops [16,17,18,19]. Li et al. (2014) [20] proposed that when biochar is added to organic or chemical fertilizers, the functional groups on the biochar surface can bind with ammonium and nitrate ions. This phenomenon increases the nitrogen (N) use efficiency (NUE) of the crops, which in turn increases crop yield.
At present, most studies have only mixed biochar and fertilizers into the soil. Few studies have researched the effectiveness of granular compound materials or explored the decomposition rate and nutrient releasing mechanisms of biochar fertilizers. Therefore, soil improvements using biochar amendment alone can have inconsistent effects on crop yields and may even lead to N deficiency in soil in the short term [6,7]. Therefore, joint application of compost and biochar in agricultural soil can prevent biochar from absorbing soil nutrients during the initial application stage, avoiding soil N deficiency, providing crops with a long-term supply of nutrients, and maintaining soil fertility. Use of biochars for organic/inorganic compound fertilizer can be an option to achieve high productivity and low carbon intensity along with reducing nitrogen fertilizer use in Chinese rice agriculture [20]. Enhanced plant growth in the biochar + compost treated soil has largely been attributed to improved nutrient availability and uptake compared to biochar alone [21,22,23]. Furthermore, slow-release fertilizers created by mixing biochar and compost particles can enhance the effectiveness of organic fertilizers. However, studies have yet to determine optimal proportions for mixing biochar and compost [20].
Based on the concept of circular agriculture and sustainable environment, reuse/recycle of agricultural wastes to be a useful fertilizers to replace of chemical fertilizers might be a feasible agricultural management practice in the future. This study supposes that application of the biochar–compost composites could not only improve the soil quality but also facilitate the fertilizer use efficiency for crops. This study mixes wood biochar made using reused agriculture wastes into different proportions of bagasse compost to create innovative organic fertilizers through granulation. The biochar compound materials were subsequently applied to two common types of agricultural soil (sandy soil and clay soil) in Taiwan to evaluate the nutrient releasing efficiency in our study.

2. Materials and Methods

2.1. Biochar Source and Preparation

Waste woods including Taiwan Acadia (Acacia confuse Merr.), Casuarina (Casuarina equisetifolia Forst.), and Leucaena (Leucaena glauca (L.) Benth.), were used to make biochar in this study. These three kinds of wood are the most abundant ones in the coastal areas in Taiwan, and produce a lot of waste wood every year. Wood biochar was prepared by subjecting the waste wood materials to pyrolysis by using an open furnace (Fire Box S-119, Airburners Inc., Palm City, FL, USA). The carbonization temperature was over 700 °C. After production, the biochar was ground to a fine powder, then filtered (2 mm) for subsequent analysis and the production of particle biochar compound materials (pBCMs). The pBCMs were produced by mixing the biochar and compost in a granulator (Young & Dear, YD300, Taiwan), forming composite granules (about 1 cm in length and 0.8 cm in diameter).

2.2. Soil Collection for the Experiment

Sandy soil and clay soil were collected from fallow agricultural lands in southern Taiwan. The soil collected was mainly surface soil (0–15 cm) which was thern placed in plastic bags. The collected sandy soil was classified as Udorthent [24], the parent material of which is freshly accumulated calcareous clay slate. The collected clay soil was classified as Paleudult. The collected soil was air dried, ground, and filtered using a 10-mesh filter (2 mm) and stored in plastic jars for subsequent property analysis and use in the incubation experiment. The analytical results are presented in Table 1.
The pH values of the soil samples and the biochars were determined in a mixture with deionized water (1:2.5 w/v for soils; 1:20 w/v for biochars), using a Horiba F-74 BW meter [25]. Soil particle size distribution was determined with the pipette method [26]. The exchangeable K was extracted with 1 mol L−1 NH4OAc (1:10 w/v for the soils; 1:20 w/v for the biochars) [27] and was determined by the atomic absorption spectrometry method (Z-2300, Hitachi, Japan). Organic carbon content was determined by the wet oxidation method [28]. Available phosphorous was determined by the Bray P-1 extract test [28]. Inorganic N was extracted with 2 M KCl (1:10 w/v), and the concentrations of NH4+-N and NO3-N were determined by steam distillation, using MgO and Devarda’s alloy [29]. Total C was determined by dry combustion method and total N was measured using the Kjeldahl procedure [30].

2.3. Calcium Carbonate Analysis

Calcium carbonate (CaCO3) analysis was performed using the method proposed by Leoppert et al. (1984) [31]. First, 5 g of studied soils, biochar, compost, and compound materials were weighed and filtered with a 10-mesh filter (2 mm). The soil was subsequently placed in a beaker, 50 mL of 1 N HCl solution was added, and continuously shaken to react for 1 hr. The solution was then filtered, and phenolphthalein indicator was added. Finally, the solution was subjected to titration using standardized 0.1 N NaOH titration until the titration end point was reached.

2.4. Compost Source

This study employed bagasse compost produced by Taiwan Sugar Corporation. The compost properties are listed as follows: total N (1.5%), organic matter (55%), total phosphoric oxide (0.9%), and total K oxide (1.5%); the pH was 7.4.

2.5. Biochar Compound Material Preparation

Four granular materials were prepared: (1) BC3, composed of biochar and compost at a 1:3 ratio (w/w; moisture 15%); (2) BC, composed of biochar and compost at a 1:1 ratio (w/w; moisture 20%); (3) B, biochar-only (moisture 25%); and (4) C, compost-only (moisture 10%). Granulation equipment was used (Young & Dear 300, Taiwan). In the granulation process, deionized water was added as a binder. The properties of the granular material are listed in Table 2.

2.6. Indoor Incubation Experiment for Evaluating Nutrient Releasing and Decomposition of pBCMs

A 6-inch (15 cm) plastic incubation pot was used for the pot experiment. The inner diameter and depth of the plot were 16 and 17 cm, respectively. Each pot was filled with 2 kg of soil. In the incubation experiment, the amount of pBCMs applied was based on the recommended amount of N fertilizer for Chinese cabbages (Brassica rapa chinensis) (300 kg ha−1) in Taiwan. The materials were packaged using tea bags and placed in the soil at a depth of approximately 15 cm. Soil moisture samplers (Rhizon SMS, Eijkelkamp, Netherlands) were buried in the incubation pots to extract soil solution on days 1, 3, 7, 30, 60, 120, and 180 to measure inorganic N, available P, and exchangeable K for evaluating nutrient release. The pots were weighed daily and supplemented with water at the field capacity of the soil. On the soil solution extraction days, the pBCMs inside the tea bags were dried in an oven at 50 °C for 4 h and then weighed to calculate the decomposition rate. Each process was performed in three replicates.

2.7. The Pot Experiment for Crop Production

The cabbage species selected for the pot experiment was the Chinese white cabbage (Brassica chinensis Linn.). The amount of pBCM applied was based on the recommended standard amount of N fertilizer for Chinese cabbages, which was 25 g (w/w) of C, 195 g of B, 45 g of BC, and 32 g of BC3, respectively, incorporated in the soil (2 kg) in the pots. The crops were cultivated for two consecutive crop periods (each crop period was 28 days); no additional fertilizer was provided between the two periods. The pBCMs were evenly spread and mixed with 5 cm of the surface soil. The Chinese cabbages were harvested monthly. Each pot was used to cultivate three Chinese cabbages, and samples were placed according to the randomized complete block design. After harvesting, the cabbage leaves were dried, weighed, and the crop yield was calculated.

2.8. Calculation and Statistical Analysis of the Nutrient Utility Rate

Nutrient utility rate represents the total biomass or economic yield generated per unit of nutrients absorbed by the plant. Moll et al. (1982) [32] proposed using NUE to calculate plant nutrient utility rate. For NUE, the equation is as follows: NUE (%) = yield of plant/N measured in each pot. The total N contents were determined for the amended soils before crop planting and after the 1st crop harvest for NUE calculation. NUE, also known as fertilizer absorption rate or fertilizer recovery efficiency, refers to the percentage of N in the fertilizer absorbed by the plant. Phosphorus (P) use efficiency (PUE) refers to the phosphorus concentration which was multiplied by grain yield and aboveground biomass yield to calculate the P absorbed by the grain and aboveground biomass [33]. The equation is as follows: PUE (kg/kg) = yield of plant/amount of P absorbed from the soil [32]. Randomized complete block design was used, and GLM procedures in the SAS software were used to perform two-way analysis of variance. The mean values of each treatment group were compared using Duncan’s new multiple range test. The significance level was set at p < 0.05.

3. Results and Discussion

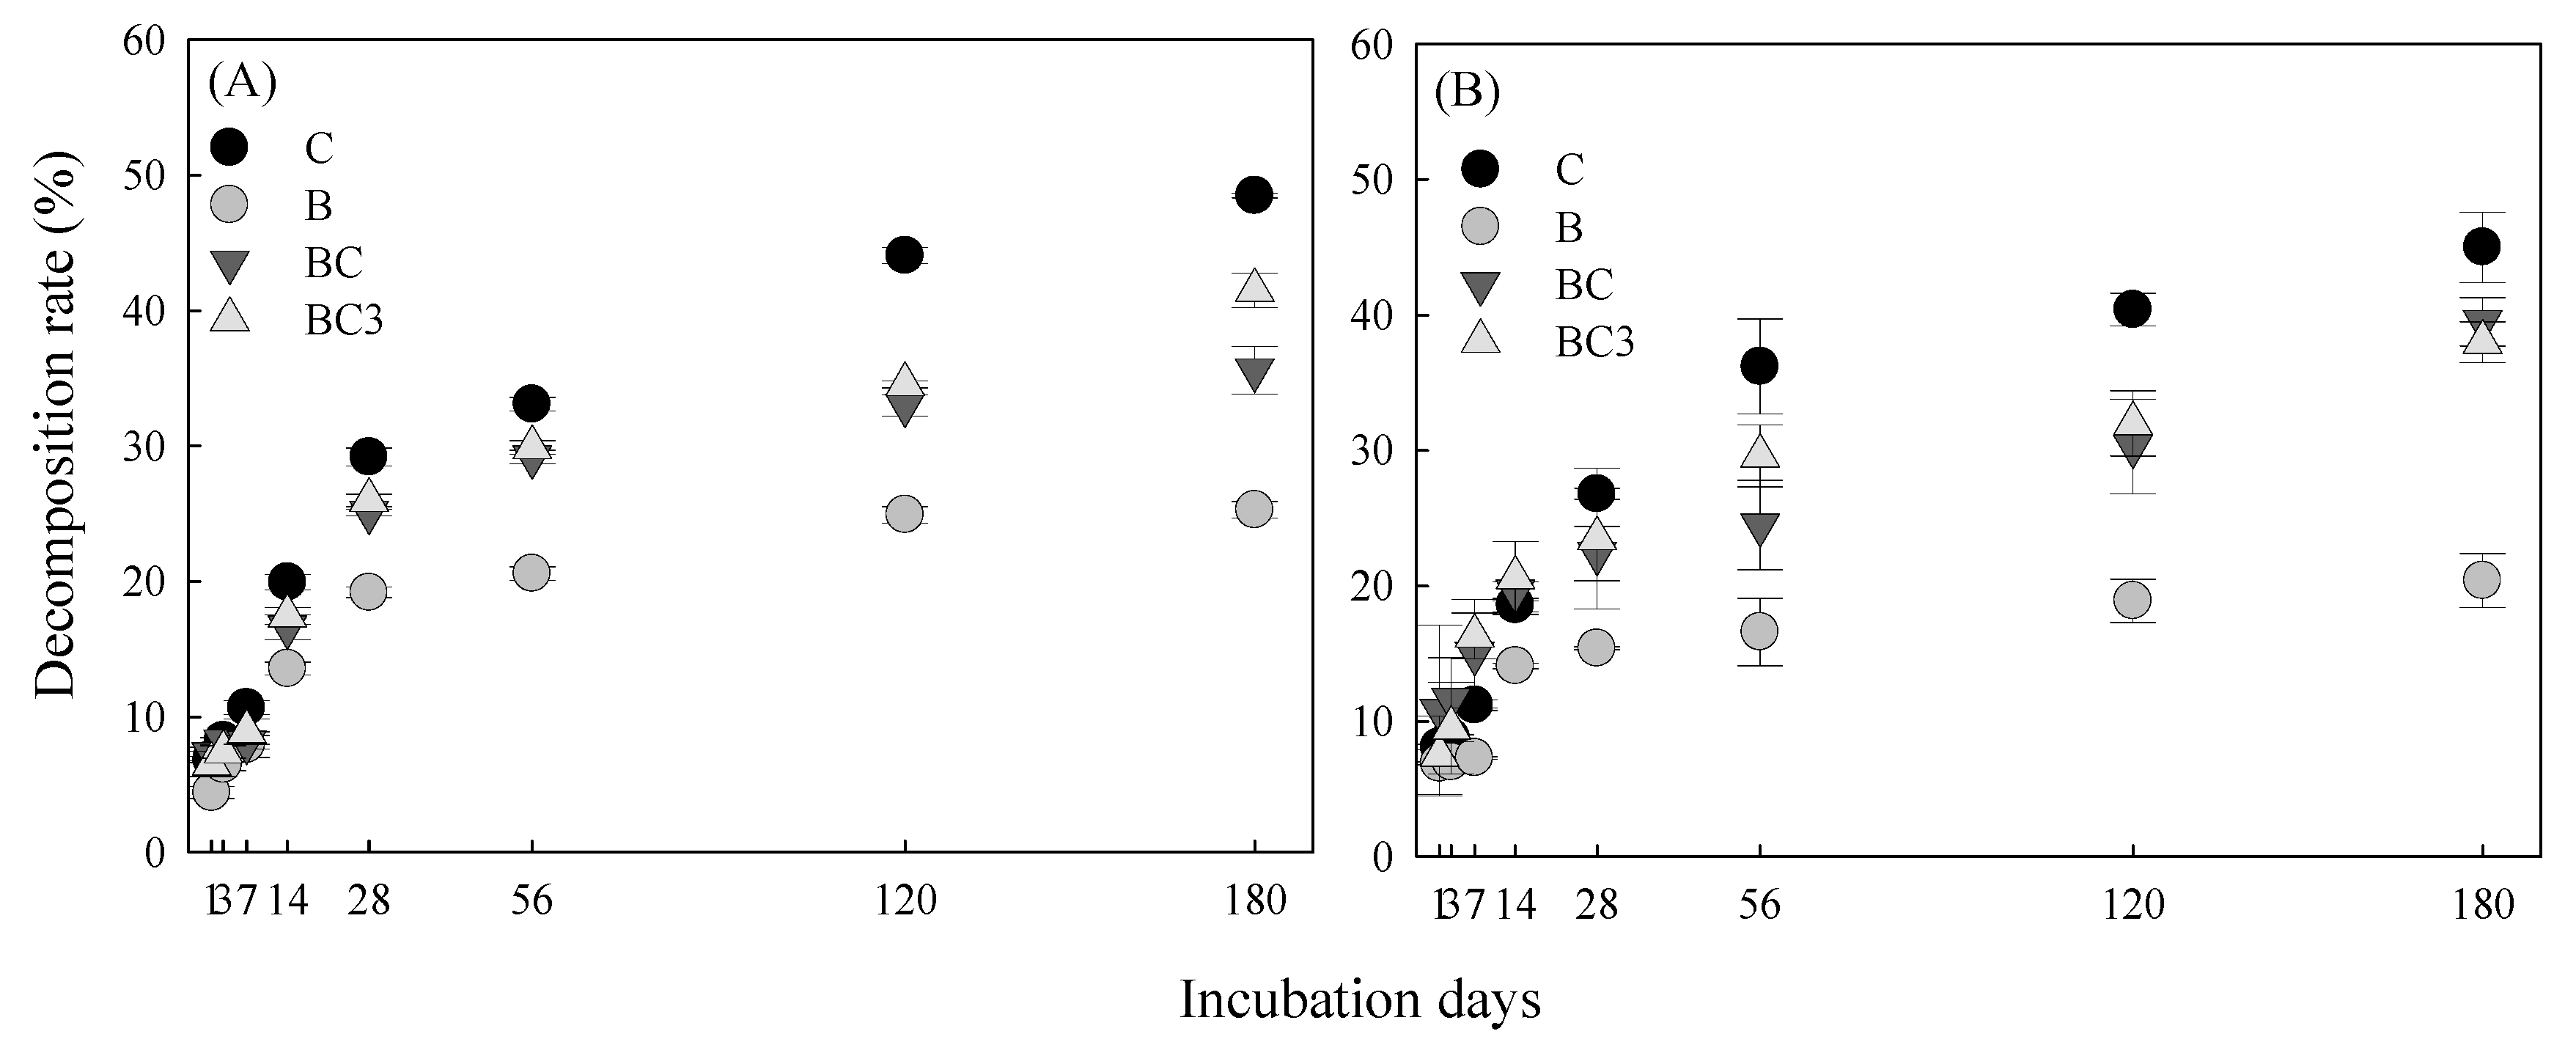
3.1. Decomposition Rate of pBCMs in Soil

The decomposition results of the pBCMs after 180 days of incubation are presented in Figure 1. In the sandy soil, treatment C had the highest decomposition rate (48%), followed by treatments BC (41%) and BC3 (35%). Treatment B had the lowest decomposition rate (25%). The decomposition trends for the clay soil were similar to those in the sandy soil; the decomposition rate was the highest in treatment C (45%) and lowest in treatment B (19%). We inferred that treatment B had the lowest decomposition rate because the biochar-only treatment contained less labile organic carbon (determined by wet oxidative method)—which can be used by micro-organisms—relative to the other treatments [34,35]. The decomposition rate results indicated that in the compound materials, adding biochar effectively reduced the decomposition rate, enabled the slow-release of nutrients, and extended the manuring effect of the compound material [16]. Figure 1 revealed that the materials had a lower decomposition rate in the sandy soil than in the clay soil. We inferred that this effect was because sandy soil has more macropores (≥50 μm) than does clay soil; thus, sandy soil has greater aeration and a higher decomposition rate.

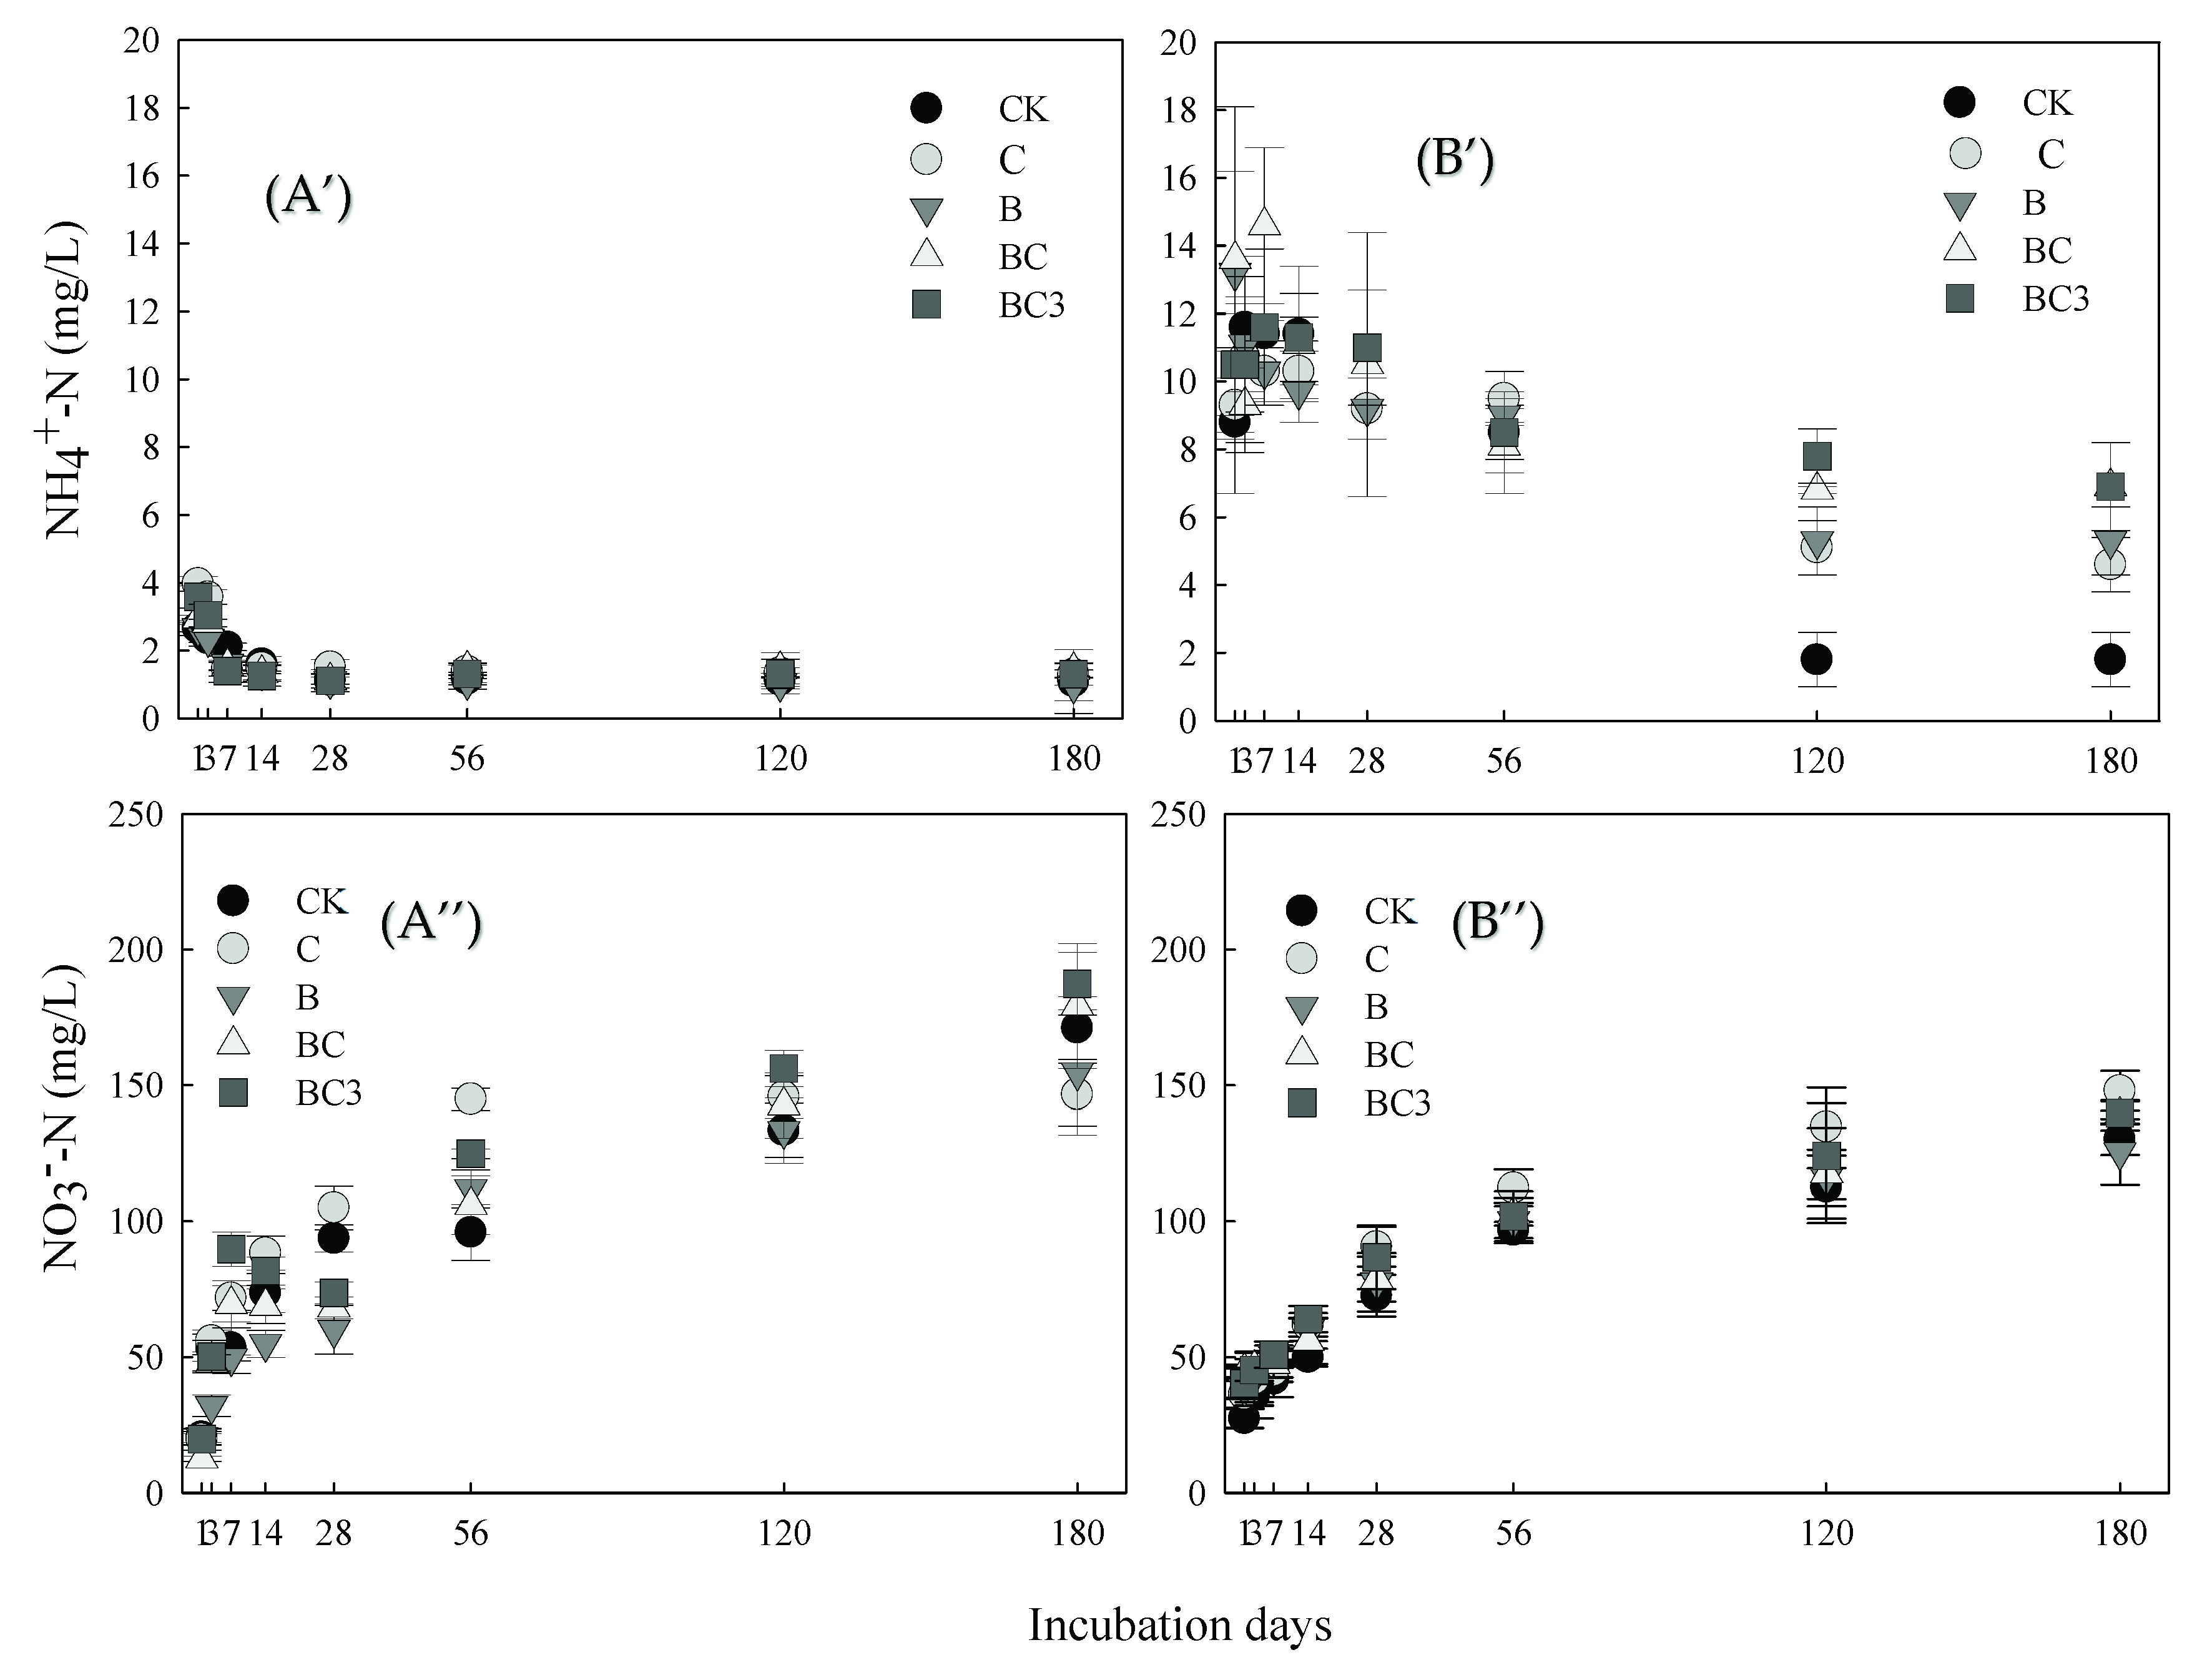
3.2. Effect of pBCMs on Inorganic N in Soil

Soil inorganic N includes ammonium N (NH4+–N) and nitrate N (NO3–N), both of which are directly available to crops. Figure 2 revealed that the NH4+–N content in soil solutions were relatively low in the sandy soil and significantly reduced to lower than 10 mg L−1 in the clayed soil. Additionally, the NO3-N content significantly increased with incubation time (Figure 2). This result is caused by the nitrification effect in the soil, which significantly reduced the pH values of the two types of soil as presented in Table 3 [36]. After incubation, the soil solutions produced using treatments C and BC3 contained the highest NO3–N contents for both types of soil (not statistically significant (p < 0.05) in the clayey soil), with 125–145 mg/L in the sandy soil and 108–118 mg L−1 in the clay soil. The soil N release for each compound material is presented in Figure 2. After incubation, the soil solution of treatments BC and BC3 in the clay soil had the highest NH4+–N contents (6–8 mg L−1), whereas those of other treatments were significantly lower (p < 0.05). The pBCMs thus had a buffering effect on the nitrification effect of NH4+–N in clay soil [37].

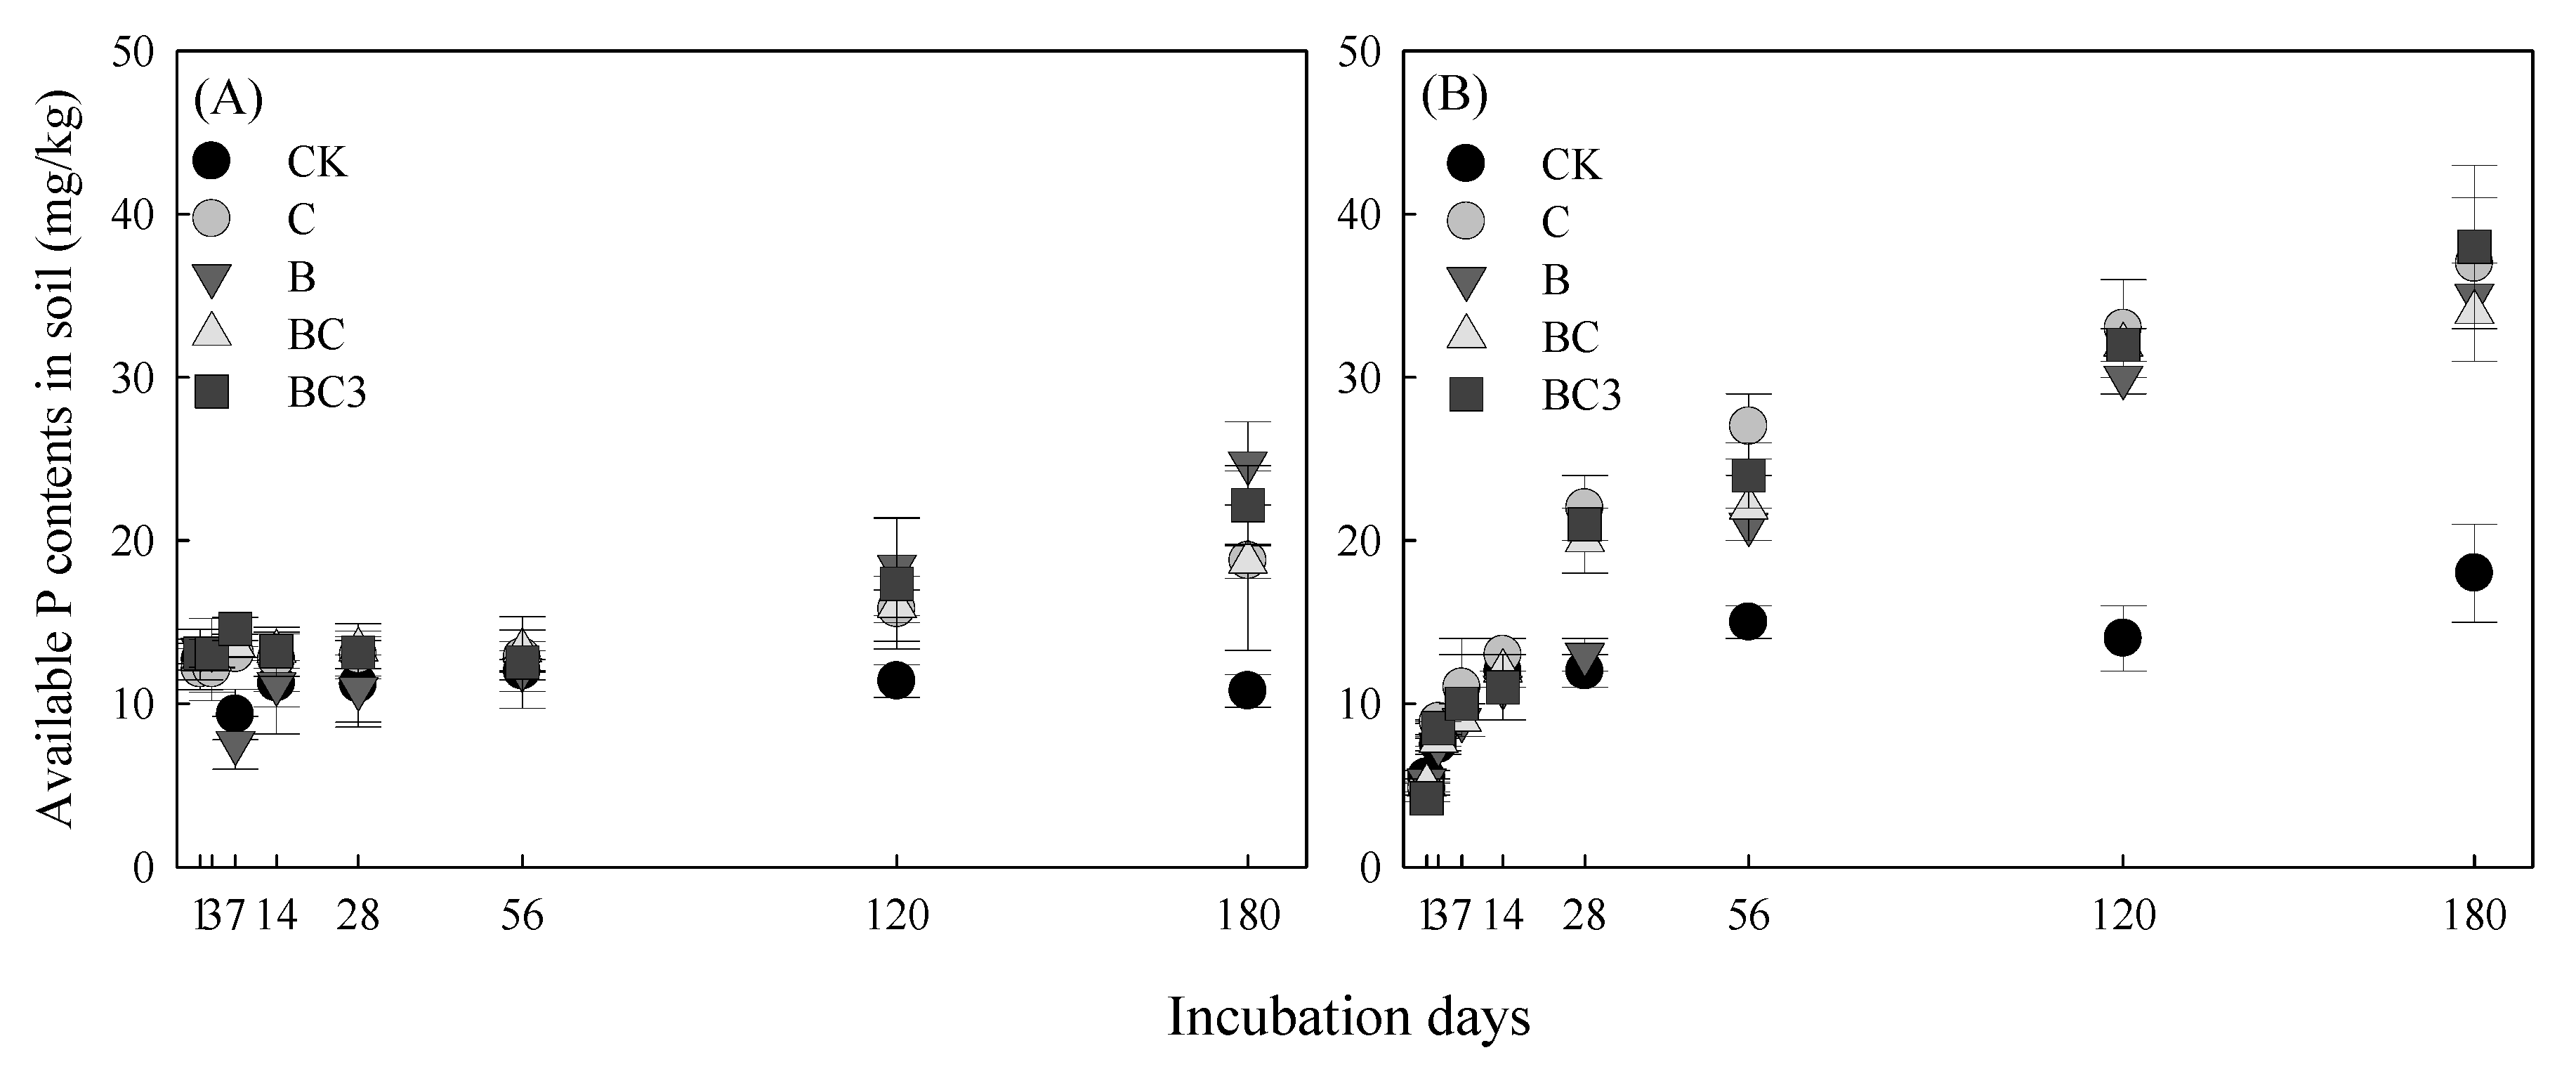
3.3. Effect of pBCMs on Available P in Soil

P is a critical element for plant growth. Plants typically experience P deficiencies due to low P use efficiency (<15%) in soil, particularly in calcareous soil or highly-weathered soil containing abundant iron (Fe) and aluminum (Al). The specific adsorption of calcium (Ca), Fe, and Al on P reduces P availability for plants [38], contributing to low P use efficiency. Agricultural soil in southern Taiwan is primarily calcareous soil (clay slate alluvial soils) or soil containing abundant Fe and Al (highly-weathered red soils). Clay slate alluvial soil with calcareous properties accounts for over 50% of the agriculture soil in southern Taiwan. Utisoils, which are rich Fe and Al, account for approximately 10% of Taiwan’s agriculture soil. Therefore, the application and management of P fertilizer in these two types of soils is critical for plant growth.
An analysis of the soil solution for each treated soil (Table 4) revealed that P contents were only detected in the soil solutions of sandy soil groups; P contents in clay soil solutions were not detected. This is primarily because the clay soil used was highly-weathered tropical soil, which contained abundant Fe and Al oxides (Table 1). The soil colloids are mostly positively charged, and the specific adsorption of Fe oxides on P resulted in the fixation of P on the surface of the Fe and Al oxides [39]. Gérard (2016) [40] reported that P attachment to clay soil is due to the large specific surface area of clay particles. Additionally, abundant Fe and Al oxides in the soil increase P attachment to clay soil, thereby further reducing P availability [41]. Morales et al. (2013) [42] reported that after adding biochar to degraded tropical soil, the soluble P released by the biochar was first absorbed by Fe and Al oxides in the soil.
Table 4 revealed that in the incubated sandy soil, the P contents in the soil solutions of treatments C, BC, and BC3 significantly increased. This result suggested that the compost in the compound materials directly supplied or supplemented P in the soil solution. By comparison, after 180 days of incubation, sandy soil treated with pBCMs had a greater available P content (Figure 3). We inferred that this result was because the biochar preferentially binds to Ca in the soil, leaving less Ca for P to attached to, and thus increasing the available P content in the soil [43,44]. The results revealed that in the sandy soil, except for the control groups, every treatment required at least 120 days of incubation before attaining an available P content greater than 15 mg kg−1 (medium level of available P content) [45]. However, the soil solution of treatments C, BC, and BC3 had P contents greater than 15 mg L−1 by day 28.
In clay soil, P was absorbed at the soil particle surface. A medium level of available P content (15 mg kg−1) was achieved by treatments C, BC, and BC3 after 30 days of incubation [45]. These results indicated that the use of pBCMs increased the available P content in both types of soil. However, due to the specific adsorption of P by the metal oxide and hydroxide minerals in the clay soil [46], the soil may contain insufficient P during the initial treatment stage. Therefore, we recommend applying additional P compost in the initial stage of compound material treatment. Chintala et al. (2013) [47] and Morales et al. (2013) [42] reported that adding biochar to highly-weathered soil significantly decreased the P absorption by the soil, thereby increasing P availability.

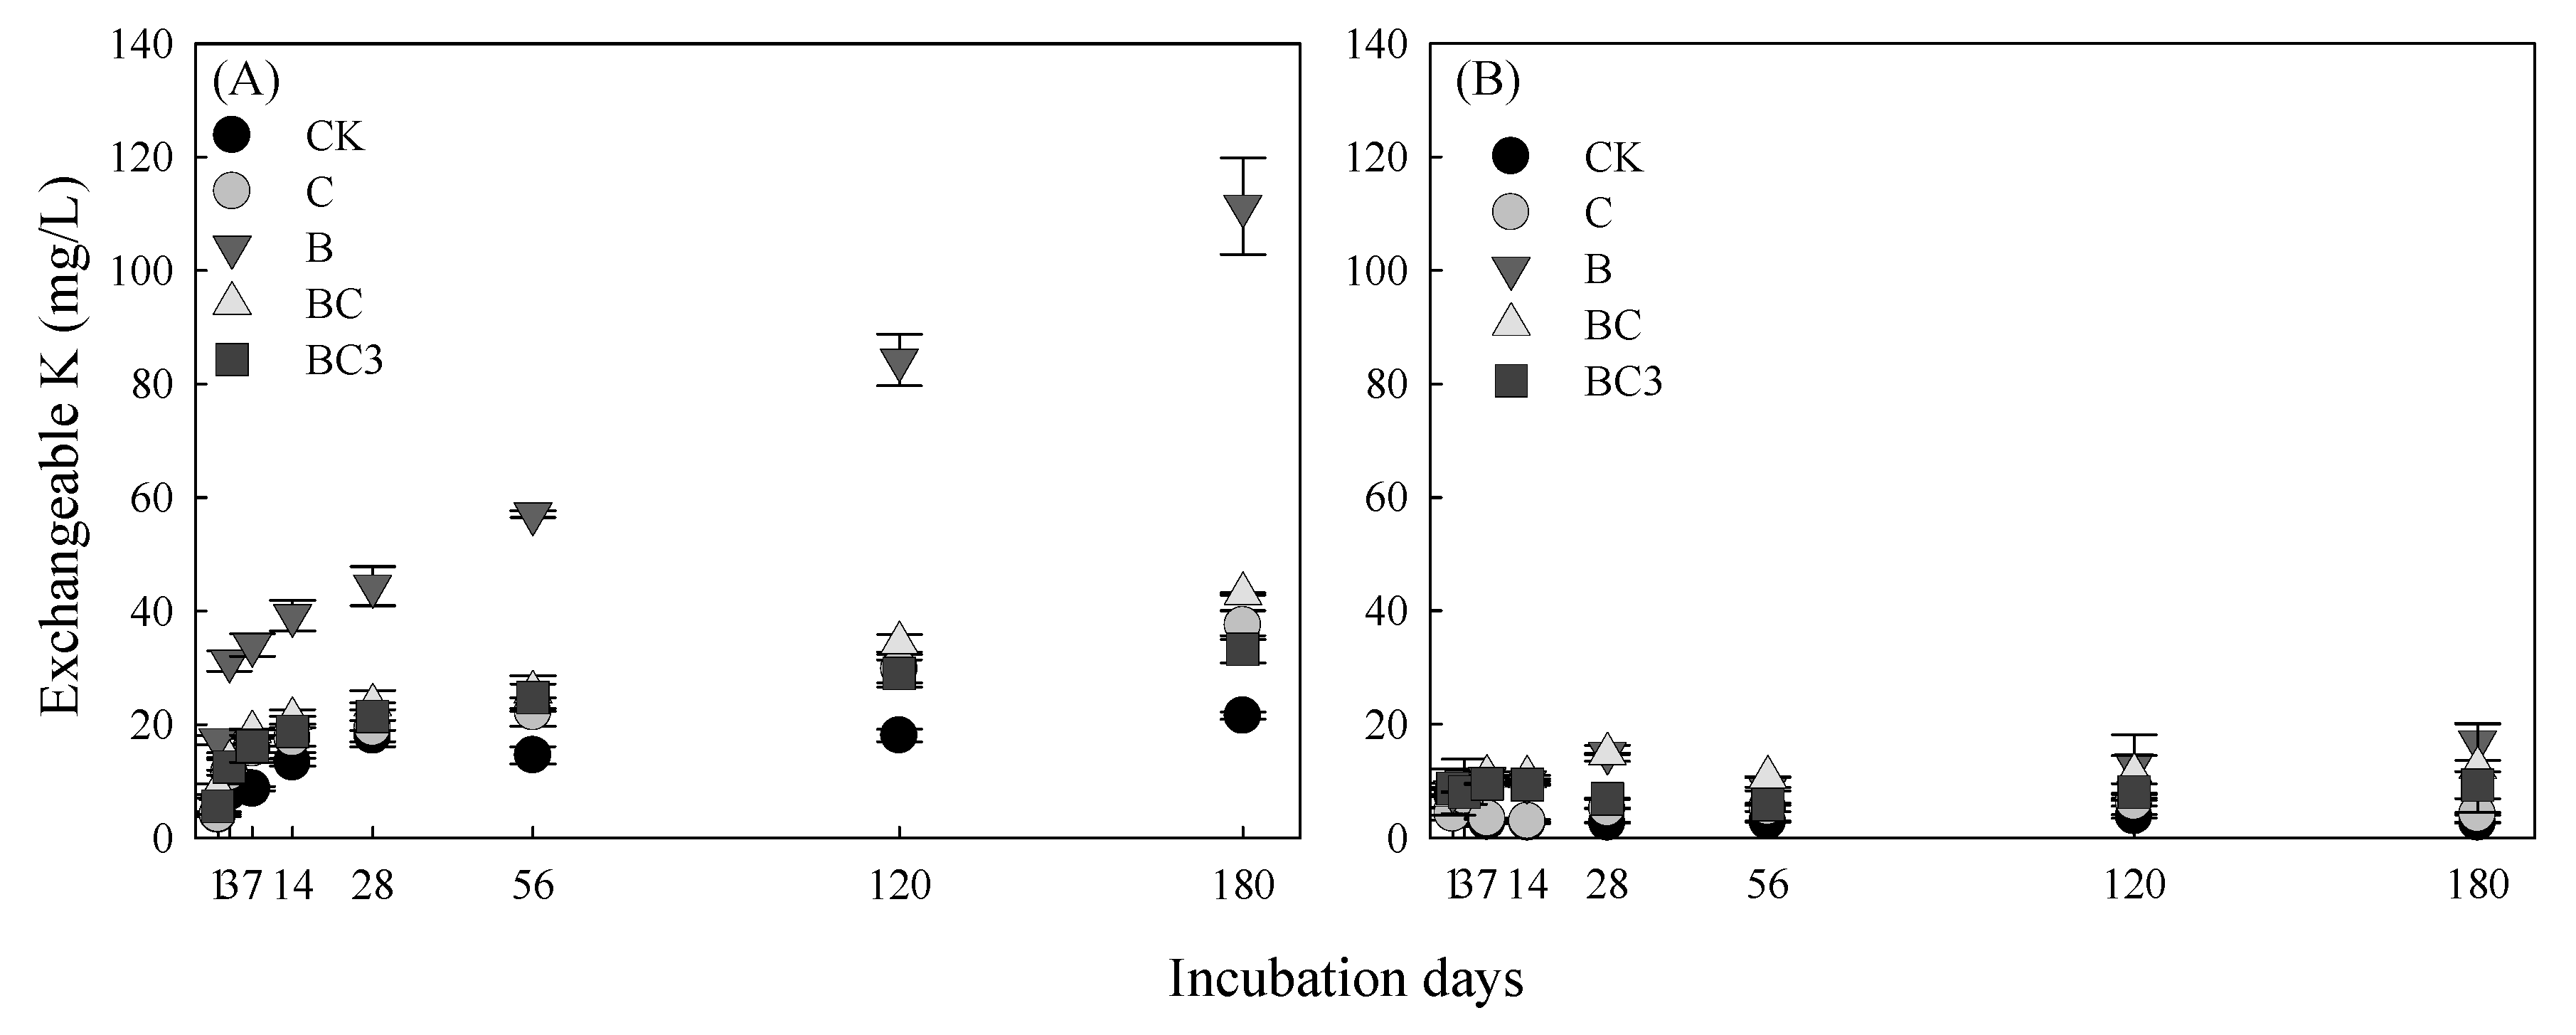
3.4. Effect of pBCMs on Exchangeable K Content

The results revealed that applying pBCMs significantly increased the amount of exchangeable K in soil [48,49]. Figure 4 indicated that the exchangeable K content of soil treated with compound materials significantly increased. However, the amount of exchangeable K released from the compound materials differed significantly between the sandy soil and the clay soil. The experiment results revealed that treatment B contributed to the greatest increase in exchangeable K content—330% higher than the control group at the initial treatment stage. This result is consistent with that of Oram et al. (2014) [50], which identified biochar as a major source of exchangeable K.

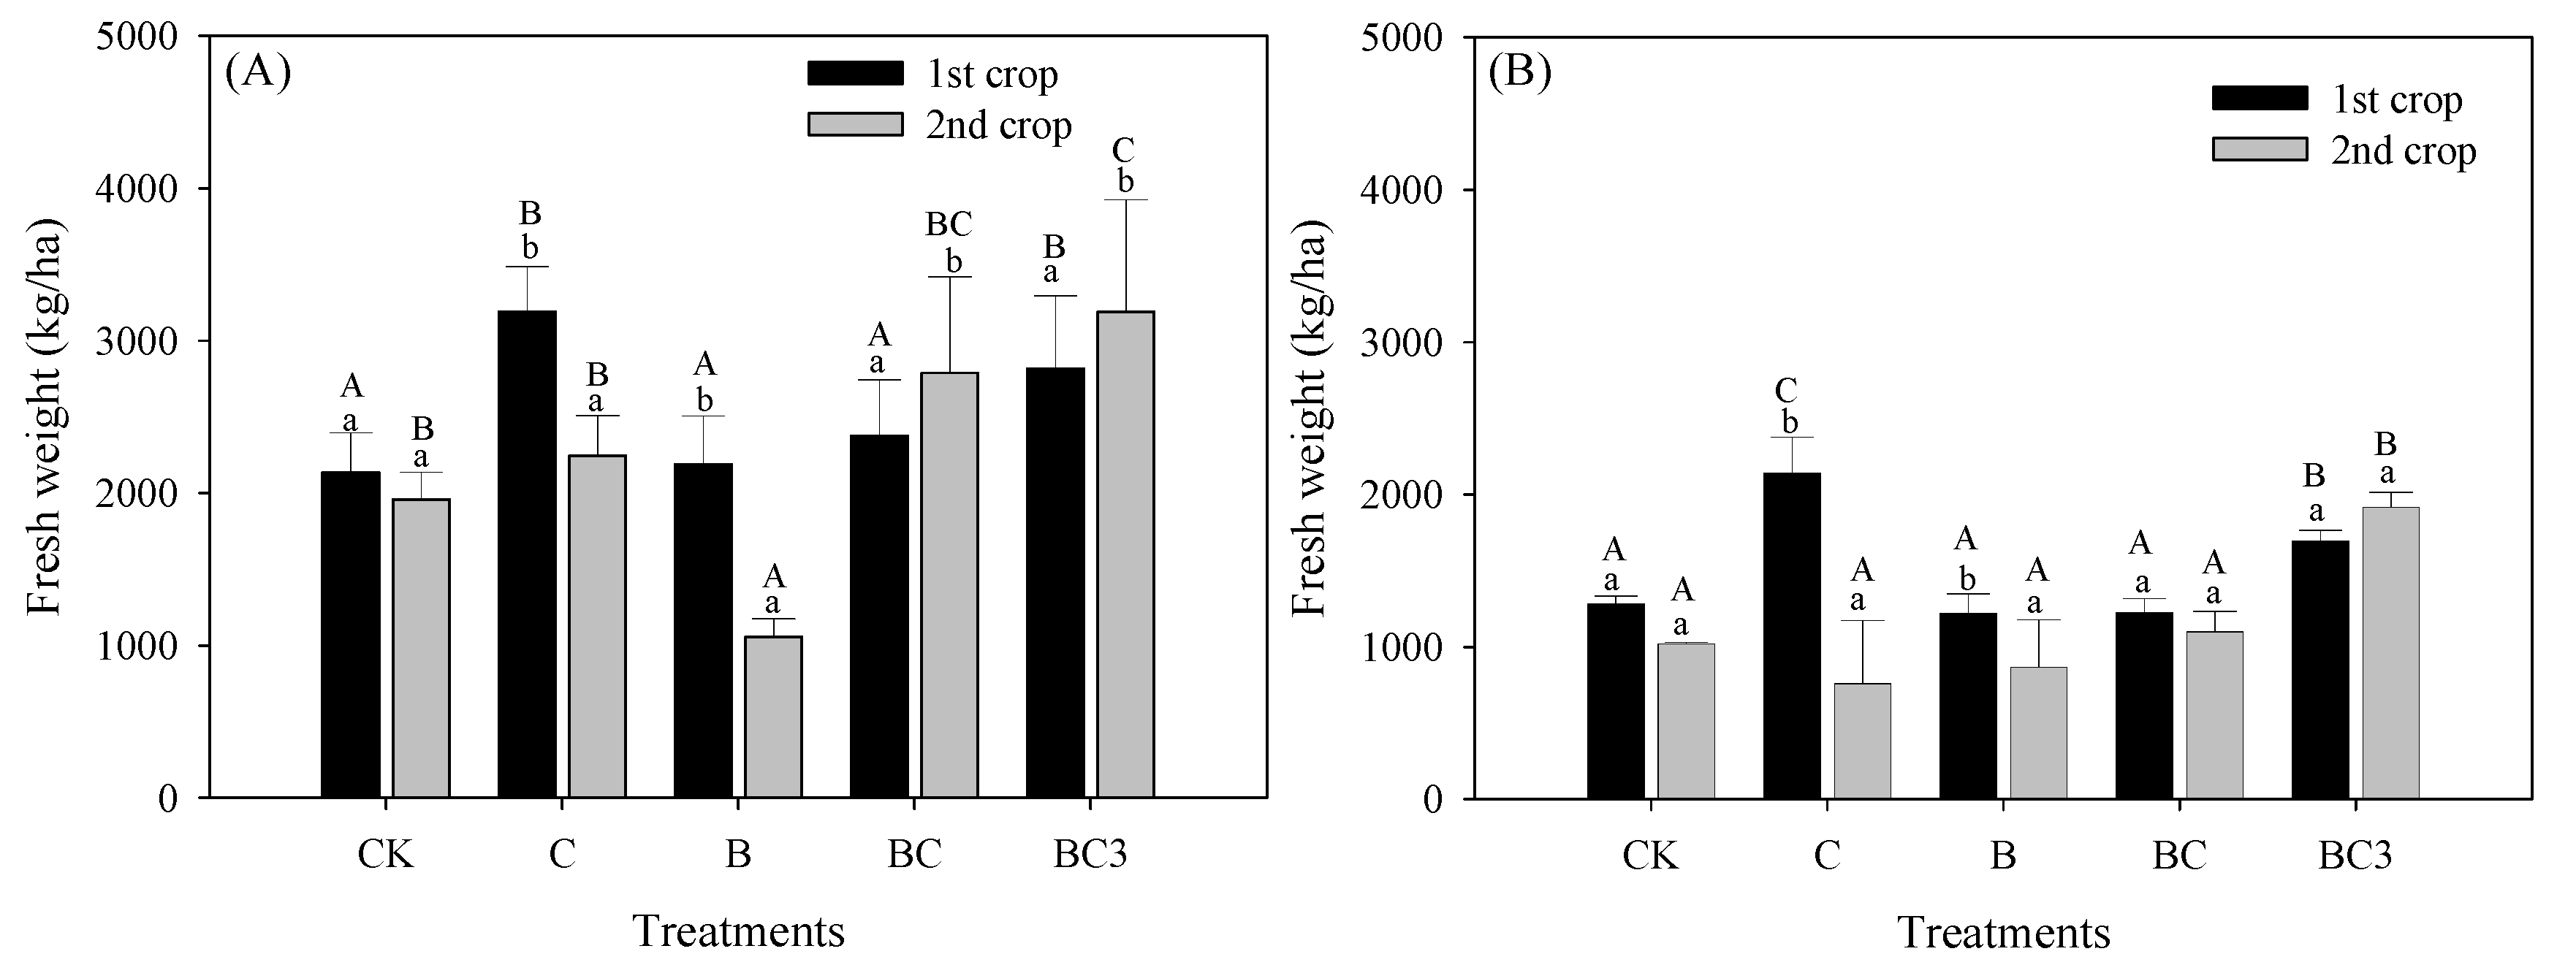
3.5. Effect of pBCMs on Crop Yield

In the pot experiment, Chinese white cabbages were planted for two consecutive crop periods. Each period lasted 30 days; no additional compound materials or compost were provided to the crops between the periods. The experiment aimed to evaluate the effects of pBCMs on the yield of Chinese white cabbages. The results revealed that for both types of soil, the crop yield outcomes of the first period was best for treatment C, followed by treatments BC3, BC, and B. The yield outcome of treatment CK was the least favorable. In the second period, treatment BC3 had the best yield outcome. Relative to the yield results in the first period, treatment BC3 had a 14–16% increase in yield in the sandy soil and an 8% increase in the clay soil. The yield of all treatment groups other than BC3 and BC decreased significantly in the second period. In particular, the yield of treatment C decreased by 30–64% (Figure 5).
Application of only biochar did not effectively increase crop yield; the crop yield of treatment B significantly decreased in the second period. However, groups treated with both compost and biochar (i.e., treatments BC and BC3) had significant yield increases in the second period. These results indicated that biochar–compost composites increase long-term crop yield, whereas compost alone is more effective in the short term [51]. Additionally, Figure 5 reveals that crop yield was lower in clay soil compared with sandy soil, implying a difference in the nutrients supplied by the compound materials in the two soils. The decomposition rate and nutrient release efficiency of the pBCMs were lower in the clay soil than in the sandy soil. Clay soil contains higher contents of clay particles and Fe and Al oxides. These clay particles contain silicate clay minerals that bind with K ions. Additionally, the specific adsorption of P by Fe and Al oxides reduced the available P in the soil, thereby preventing crops from obtaining nutrients.

3.6. Effect of pBCMs on Nutrient Use Efficiency

Table 5 reveals that the nutrient use efficiency of crops was greater in sandy soil than in clay soil. In sandy soil (with the exception of treatment B in the second crop period), the NUE for all treatment groups was higher than 10%. Compared with the control and single-material treatment (i.e., B and C), the NUE of crops that received pBCM treatment (i.e., BC and BC3) significantly increased by 1.5–3.1% in the second crop period. The NUE of crops in the clay soil all did not exceed 10%. In the first crop period, the NUEs of treatments C and BC3 were significantly higher than those of the other treatments. However, only crops that received treatment BC3 had an NUE increase in the second crop period; the others all had significant decreases. Zheng et al. (2017) [16] compared the effects of biochar, N fertilizer, and biochar–N fertilizer compound materials by performing a corn cultivation experiment. The results revealed that compared with biochar-only or N fertilizer–only cultivation methods, the combination of biochar and N fertilizer increased the yield of corn by at least 12%. Additionally, the use of biochar–N fertilizer compound materials significantly increased the NUE of the crops (43.1%).
Table 6 presents the PUE of the Chinese cabbages. The results indicate that the Chinese cabbages had higher PUE in sandy soil than in clay soil. In the sandy soil, PUE was significantly higher (>10 kg kg−1) during the first crop period in crops treated with a higher compost content (C and BC3). In the second crop period, the PUE of crops treated with biochar (B, BC, BC3) was significantly greater. In particular, the PUE of BC3 crops was 29 kg kg−1. According to the results, crops had higher PUE in sandy soil due to two mechanisms: (1) biochar improved the physical properties of the soil and increased crop absorption of P in the soil; or (2) the addition of biochar increased the P availability in soil. Because the amendments used were particle-sized (about 1 cm in length and 0.8 cm in diameter) and mixed with the top 5 cm of the soil during the pot experiment, biochar is unlikely to have caused significant changes in the physical properties of the soil. Therefore, the second mechanism is probably the primary cause of the increased PUE in the sandy soil [33].
Compared with the sandy soil, PUE in the clay soil was lower (<5 kg kg−1), primarily due to the specific adsorption of P by Fe and Al oxides in the clay soil, preventing plants from using P [38] and hindering crop yield. Table 6 indicates that the PUE of the control and the C treatment during the second crop period was significantly lower than that during the first period (<3 kg kg−1). However, the PUE of treatments containing biochar (B, BC, and BC3) did not decrease significantly in the second crop period, but instead remained at levels similar to those during the first crop period.

4. Conclusions

Biochar could significantly improve soil’s physical properties as well as chemical properties such as soil acidity and cation exchange capacity. However, biochar does not directly provide as much nutrient as compost on its own; therefore, it must be compounded with other materials to increase its utility as a fertilizer. The study results revealed that the pBCMs decomposed more slowly in soil than did pure compost. Based on our results, the evidence supports the conclusion that biochar increased available P in soils; however, more research is needed to confirm the mechanism by which this occurred.

Author Contributions

Conceptualization and methodology, S.-H.J.; sample analysis, Z.-H.X.; writing—original draft preparation, S.-H.J. and C.-S.L. All authors have read and agreed to the published version of the manuscript.

Funding

This research was funded by the Ministry of Science and Technology of the R.O.C. (Grant number MOST 109-2313-B-020-006-).

Institutional Review Board Statement

Not applicable.

Informed Consent Statement

Not applicable.

Data Availability Statement

We would like to exclude this statement.

Acknowledgments

The authors are also grateful to Jin-Horn Liu for providing the wood biochar.

Conflicts of Interest

The authors declare no conflict of interest.

References

  1. IPCC. Summary for Policymakers. In Climate Change and Land: An IPCC Special Report on Climate Change, Desertification, Land Degradation, Sustainable Land Management, Food Security, and Greenhouse Gas Fluxes in Terrestrial Ecosystems; Shukla, P.R., Skea, J., Buendia, E.C., Masson-Delmotte, V., Pörtner, H.-.O., Roberts, D.C., Zhai, P., Slade, R., Connors, S., van Diemen, R., Eds.; IPCC: Genève, Switzerland, 2019; in press. [Google Scholar]
  2. Massah, J.; Zadegan, B. Effect of Chemical Fertilizers on Soil Compaction and Degradation. Agric. Mech. Asia Afr. Lat. Am. 2016, 47, 44–50. [Google Scholar]
  3. Peltre, C.; Christensen, B.T.; Dragon, S.; Icard, C.; Kätterer, T.; Houot, S. RothC simulation of carbon accumulation in soil after repeated application of widely different organic amendments. Soil Biol. Biochem. 2012, 52, 46–60. [Google Scholar] [CrossRef]
  4. Nobile, C.M.; Bravin, M.N.; Becquer, T.; Paillat, J.M. Phosphorus sorption and availability in an andosol after a decade of organic or mineral fertilizer applications: Importance of pH and organic carbon modifications in soil as compared to phosphorus accumulation. Chemosphere 2020, 239, 124709. [Google Scholar] [CrossRef] [PubMed]
  5. Jien, S.H.; Wang, C.S. Effects of Biochar on Soil Properties and Erosion Potential in a Highly Weathered Soil. Catena 2013, 110, 225–233. [Google Scholar] [CrossRef] [Green Version]
  6. Jien, S.H.; Wang, C.C.; Lee, C.H.; Lee, T.Y. Stabilization of organic matter by biochar application in compost-amended soils with contrasting pH values and textures. Sustainability 2015, 10, 13317–13333. [Google Scholar] [CrossRef] [Green Version]
  7. Lee, C.H.; Wang, C.C.; Lin, H.H.; Lee, S.S.; Tsang, D.C.W.; Jien, S.H.; Ok, Y.S. In-situ biochar application conserves nutrients while simultaneously mitigating runoff and erosion of an Fe-oxide-enriched tropical soil. Sci. Total Environ. 2018, 619, 665–671. [Google Scholar] [CrossRef]
  8. Jien, S.H.; Kuo, Y.L.; Liao, C.S.; Wu, Y.T.; Igalavithana, A.D.; Tsang, D.C.W.; Ok, Y.S. Effects of field scale in situ biochar incorporation on soil environment in a tropical highly weathered soil. Environ. Pollut. 2021, 272, 116009. [Google Scholar] [CrossRef]
  9. Lehmann, J.; de Silva, J.P., Jr.; Steiner, C.; Nehl, S.T.; Zech, W.; Glaser, B. Nutrient ava ilab ilityand leaching in an archaeological Anthrosol anda Ferralsol of the central Amazon basin: Fertilizer, manure and charcoal amendments. Plant Soil 2003, 249, 343–357. [Google Scholar] [CrossRef]
  10. Hagemann, N.; Joseph, S.; Schmidt, H.P.; Kammann, C.I.; Harter, J.; Borch, T.; Robert, B.; ol Varga, Y.K.; Taherymoosavi, S.; Elliott, K.W.; et al. Organic coating on biochar explains its nutrient retention and stimulation of soil fertility. Nat. Commun. 2017, 8, 1089. [Google Scholar] [CrossRef]
  11. Jindo, K.; Audette, Y.; Higashikawa, F.S.; Silva, C.; Akashi, K.; Mastrolonardo, G.; Sánchez-Monedero, M.A.; Mondini, C. Role of biochar in promoting circular economy in the agriculture sector. Part 1: A review of the biochar roles in soil N, P and K cycles. Chem. Biol. Technol. Agric. 2020, 7, 12. [Google Scholar] [CrossRef]
  12. Novak, J.; Lima, I.; Xing, B.; Gaskin, J.; Steiner, C.; Das, K.C.; Ahmedna, M.; Rehrah, D.; Watts, D.W.; Busscher, W.J.; et al. Characterization of Designer Biochar Produced at Different Temperatures and Their Effects on a Loamy Sand. Ann. Environ. Sci. 2009, 3, 195–206. [Google Scholar]
  13. Kallenbach, C.; Grandy, S. Controls over soil microbial biomass responses to carbon amendments in agricultural systems: A meta-analysis. Agric. Ecosyst. Environ. 2011, 144, 241–252. [Google Scholar] [CrossRef]
  14. Olad, A.; Zebhi, H.; Salari, D.; Mirmohseni, A.; Tabar, A.R. Slow-release NPK fertilizer encapsulated by carboxymethyl cellulose-based nanocomposite with the function of water retention in soil. Mater. Sci. Eng. C 2018, 90, 333–340. [Google Scholar] [CrossRef]
  15. Kubheka, B.; Laing, M.D.; Yobo, K.W. Combinations of a biofertilizer with micro-dosed chemical fertilizers increased yield of maize in a high acid saturated soil. Rhizosphere 2020, 13, 100189. [Google Scholar] [CrossRef]
  16. Zheng, J.; Han, J.; Liu, Z.; Xia, W.; Zhang, X.; Li, L.; Liu, X.; Bian, R.; Cheng, K.; Zheng, J.; et al. Biochar compound fertilizer increases nitrogen productivity and economic benefits but decreases carbon emission of maize production. Agric. Ecosyst. Environ. 2017, 241, 70–78. [Google Scholar] [CrossRef]
  17. Qian, L.; Chen, L.; Joseph, S.D.; Cheng, K.; Li, L.Q.; Zheng, J.W.; Zheng, X.H.; Zheng, J.F.; Yu, X.Y.; Wang, J.F. Biochar compound fertilizer as an option to reach high productivity but low carbon intensity in rice agriculture of China. Carbon Manag. 2014, 5, 145–154. [Google Scholar] [CrossRef]
  18. Schulz1, H.; Glaser, B. Effects of biochar compared to organic and inorganic fertilizers on soil quality and plant growth in a greenhouse experiment. J. Plant Nutr. Soil Sci. 2012, 175, 410–422. [Google Scholar] [CrossRef]
  19. Rahmaniana, N.; Naderia, S.; Supukb, E.; Abbasc, R.; Hassanpourc, A. Urea Finishing Process: Prilling versus Granulation. Proc. Eng. 2015, 102, 174–181. [Google Scholar] [CrossRef]
  20. Li, J.; Zhang, Y.; Wu, J.; Shu, Y.; Zhou, P.; Deng, Q. High-yielding Cultural Techniques of Super Hybrid Rice YLY 900 Yielded 15.40 t/hm2 on a 6.84 hm2 Scale. China Rice 2014, 20, 1–4. [Google Scholar] [CrossRef]
  21. Agegnehu, G.; Nelson, P.N.; Bird, M.I. Crop yield, plant nutrient uptake and soil physicochemical properties under organic soil amendments and nitrogen fertilization on Nitisols. Soil Tillage Res. 2016, 160, 1–13. [Google Scholar] [CrossRef]
  22. Agegnehu, G.; Srivastava, A.K.; Bird, M.I. The role of biochar and biochar-compost in improving soil quality and crop performance: A review. Appl. Soil Ecol. 2017, 119, 156–170. [Google Scholar] [CrossRef]
  23. Ali, S.; Rizwan, M.; Qayyum, M.F.; Ok, Y.S.; Ibrahim, M.; Riaz, M.; Arif, M.S.; Hafeez, F.; Al-Wabel, M.; Shahzad, A.N. Biochar soil amendment on alleviation of drought and salt stress in plants: A critical review. Environ. Sci. Pollut. Res. 2017, 24, 12700–12712. [Google Scholar] [CrossRef] [PubMed]
  24. Soil Survey Staff. Keys to Soil Taxonomy, 12th ed; USDA-Natural Resources Conservation Service: Washington, DC, USA, 2014.
  25. McLean, E. Soil pH and lime requirement. In Methods of Soil Analysis. Part 2. Chemical and Microbiological Properties; American Society of Agronomy, Inc.: Madison, WI, USA, 1982; p. 199. [Google Scholar]
  26. Gee, G.W.; Bauder, J.W.; Klute, A. Particle-size analysis. In Methods of soil Analysis. Part 1. Physical and Mineralogical Methods; American Society of Agronomy, Inc.: Madison, WI, USA, 1986; p. 383. [Google Scholar]
  27. Sumner, M.E.; Miller, W.P. Cation Exchange Capacity and exchange Coefficients. In Methods of Soil Analysis: Soil Science Society of America Book Series 5 Part 3—Chemical Methods; American Society of Agronomy, Inc.: Madison, WI, USA, 1996. [Google Scholar]
  28. Nelson, D.W.; Sommers, L.E.; Sparks, D.; Page, A.; Helmke, P.; Loeppert, R.; Soltanpour, P.; Tabatabai, M.; Johnston, C.; Sumner, M. Total Carbon, Organic Carbon, and Organic Matter. In Methods of Soil Analysis: Soil Science Society of America Book Series 5 Part 3—Chemical Methods; American Society of Agronomy, Inc.: Madison, WI, USA, 1996; p. 961. [Google Scholar]
  29. Bray, R.H.; Kurtz, L. Determination of total, organic, and available forms of phosphorus in soils. Soil Sci. 1945, 59, 39–46. [Google Scholar] [CrossRef]
  30. Bremner, J.M.; Mulvaney, C.S. Nitrogen-Total. In Methods of Soil Analysis. Part 2. Chemical and Microbiological Properties; American Society of Agronomy, Inc.: Madison, WI, USA, 1982. [Google Scholar]
  31. Leoppert, R.H.; Hallmark, C.T.; Koshy, M.M. Routine Procedure for Rapid Determination of Soil Carbonates. Soil Sci. Soc. Am. J. 1984, 48, 1030–1033. [Google Scholar] [CrossRef]
  32. Moll, R.H.; Kamprath, E.J.; Jackson, W.A. Analysis and interpretation of factors which contribute to efficiency of nitrogen utilization. Agron. J. 1982, 74, 562–564. [Google Scholar] [CrossRef]
  33. Bationo, K.A.; Anand Kumar, K. Phosphorus use efficiency as related to sources of P fertilizers, rainfall, soil, crop management, and genotypes in the West African semi-arid tropics. In Food Security in Nutrient-Stressed Environments: Exploiting Plants’ Genetic Capabilities. Developments in Plant and Soil Sciences; Springer: Dordrecht, The Netherlands, 2002; p. 145. [Google Scholar]
  34. Bruun, S.; Thomsen, I.K.; Christensen, B.T.; Jensen, L.S. In search of stable soil organic carbon fractions: A comparison of methods applied to soils labelled with 14C for 40 days or 40 years. Eur. J. Soil Sci. 2008, 59, 247–256. [Google Scholar] [CrossRef]
  35. Nguyen, B.; Lehmann, J.; Hockaday, W.C.; Joseph, S.; Masiello, C.A. Temperature sensitivity of black carbon decomposition and oxidation. Environ. Sci. Technol. 2010, 44, 3324–3331. [Google Scholar] [CrossRef]
  36. Curtin, D.; Campbell, C.A.; Jalil, A. Effects of acidity on mineralization: pH-dependence of organic matter mineralization in weakly acidic soils. Soil Biol. Biochem. 1998, 30, 57–64. [Google Scholar] [CrossRef]
  37. Li, S.; Wang, S.; Shangguan, Z. Combined biochar and nitrogen fertilization at appropriate rates could balance the leaching and availability of soil inorganic nitrogen. Agric. Ecosyst. Environ. 2019, 276, 21–23. [Google Scholar] [CrossRef]
  38. Gyaneshwar, P.; Kumar, G.N.; Parekh, L.J.; Poole, P.S. Role of soil microorganisms in improving P nutrition of plants. Plant Soil 2002, 245, 83–93. [Google Scholar] [CrossRef]
  39. Baldotto, M.A.; Velloso, A.C.X. Eletroquímica de solos modais e de sua matéria orgânicaem ambientes tropicais. Rev. Ceres 2014, 61, 1012–1021. [Google Scholar] [CrossRef] [Green Version]
  40. Gérard, F. Clay minerals, iron/aluminum oxides, and their contribution to phosphate sorption in soils—A myth revisited. Geoderma 2016, 262, 213–226. [Google Scholar] [CrossRef]
  41. Alovisi, A.M.T.; Cassol, C.J.; Nascimento, S.J.; Soares, N.B.; de Silva, I.R., Jr.; de Silva, R.S.; de Silva, J.A.M. Soil factors affecting phosphorus adsorption in soils of the Cerrado, Brazil. Geoderma Reg. 2020, 22, e00298. [Google Scholar] [CrossRef]
  42. Morales, M.M.; Comerford, N.; Guerrini, I.A.; Falcão, N.P.S.; Reeves, J.B. Sorption and desorption of phosphate on biochar and biochar–soil mixtures. Soil Use Manag. 2013, 29, 306–314. [Google Scholar] [CrossRef]
  43. Vaccari, F.P.; Maienza, A.; Miglietta, F.; Baronti, S.; Lonardo, S.D.; Giagnoni, L.; Lagomarsino, A.; Pozzi, A.; Pusceddu, E.; Ranieri, R.; et al. Biochar stimulates plant growth but not fruit yield of processing tomato in a fertile soil. Agric. Ecosyst. Environ. 2015, 207, 163–170. [Google Scholar] [CrossRef]
  44. Manolikaki, I.I.; Mangolis, A.; Diamadopoulos, E. The impact of biochars prepared from agricultural residues on phosphorus release and availability in two fertile soils. J. Environ. Manag. 2016, 181, 536–543. [Google Scholar] [CrossRef] [PubMed]
  45. Lo, C.S. Taiwan Crop Fertilization Handbook; Chinese Fertilizer Association: Taichung, Taiwan, 2015. [Google Scholar]
  46. Dominguez, E.L.; Uttran, A.; Loh, S.K.; Manero, M.H.; Upperton, R.; Tanimu, M.I.; Bachmann, R.T. Characterisation of industrially produced oil palm kernel shell biochar and its potential as slow-release nitrogen-phosphate fertilizer and carbon sink. Mater. Today Proc. 2020, 31, 221–227. [Google Scholar] [CrossRef]
  47. Chintala, R.; Mollinedo, J.; Schumacher, T.E.; Malo, D.D.; Julson, J.L. Effect of biochar on chemical properties of acidic soil. Arch. Agron. Soil Sci. 2014, 60, 393–404. [Google Scholar] [CrossRef]
  48. Liu, Y.; Lua, H.; Yang, S.; Wang, Y. Impacts of biochar addition on rice yield and soil properties in a cold water logged paddy for two crop seasons. Field Crop. Res. 2016, 191, 161–167. [Google Scholar] [CrossRef]
  49. Dong, X.; Li, G.; Lin, Q.; Zhao, X. Quantity and quality changes of biochar aged for 5 years in soil under field conditions. Catena 2017, 159, 136–143. [Google Scholar] [CrossRef]
  50. Orama, N.J.; van de Voorde, T.F.J.; Ouwehanda, G.J.; Bezemer, T.M.; Mommer, L.; Jefferya, S.; Van Groenigena, J.W. Soil amendment with biochar increases the competitive ability of legumes via increased potassium availability. Agric. Ecosyst. Environ. 2014, 191, 92–98. [Google Scholar] [CrossRef] [Green Version]
  51. Zhang, Q.; Song, Y.; Wu, Z.; Yan, X.; Gunina, A.; Kuzyakov, Y.; Xiong, Z. Effects of six-year biochar amendment on soil aggregation, crop growth, and nitrogen and phosphorus use efficiencies in a rice-wheat rotation. J. Clean. Prod. 2020, 242, 118435. [Google Scholar] [CrossRef]
Figure 1. Dynamic changes in the material decomposition rate (A) sandy soil (B) clay soil.
Processes 09 01521 g001
Figure 2. Dynamic changes in contents of NH4+-N and NO3–N in soil solution during the experiment period (A’,A”) sandy soil (B’,B”) clay soil.
Processes 09 01521 g002
Figure 3. Dynamic changes to the available P content during the experiment period (A) sandy soil (B) clay soil.
Processes 09 01521 g003
Figure 4. Dynamic changes in the exchangeable K content during the experiment (A) sandy soil (B) clay soil.
Processes 09 01521 g004
Figure 5. Effect of biochar compound materials on crop yield during the experiment (A) sandy soil (B) clay soil. Lowercase letters represent comparisons between the same treatment during different crop periods (p < 0.05); Uppercase letters represent comparisons between different treatments during the same crop period (p < 0.05).
Processes 09 01521 g005
Table 1. Basic properties of the experiment soil.
ItemsLoamy SandClay Loam
Sand (%)8032
Silt (%)1435
Clay (%)6.033
pH6.9 ± 0.15.3 ± 0.1
Organic carbon (%)0.99 ± 1.390.82 ± 0.12
Total N (mg/kg)642 ± 2351004 ± 277
Total P (mg/kg)424 ± 101212 ± 80
NH4+-N(mg/kg)106 ± 1622 ± 2.1
NO3-N (mg/kg)181 ± 9267 ± 4.3
Av. P (mg/kg)13 ± 5.114 ± 1.6
Exc. K (mg/kg)59 ± 3.2105 ± 6.9
CaCO3 (%)3.0 ± 0.3ND
Fed (%)1.18 ± 0.275.12 ± 0.66
Ald (%)0.09 ± 0.020.62 ± 0.17
ND: not determined. Av. P: available phosphorous; Exc. K: exchangeable potassium; Fed: free iron oxides; Ald: free aluminum oxides.
Table 2. Properties of the particle amendments in this study.
PropertiesBCBCBC3
pH10.0 ± 0.16.9 ± 0.18.3 ± 0.17.0 ± 0.1
Organic carbon (%)2.25 ± 0.928.9 ± 6.624.8 ± 1.328.5 ± 2.2
Total carbon (%)80 ± 0.141 ± 0.151 ± 0.164 ± 0.1
Total N (mg/kg)1537 ± 23212,041 ± 2886661 ± 869412 ± 432
Total P (mg/kg)940 ± 412125 ± 2041113 ± 301738 ± 57
NH4+-N(mg/kg)58 ± 12211 ± 7.1132 ± 8.3194 ± 9.2
NO3--N (mg/kg)94 ± 19212 ± 5.5113 ± 7.2185 ± 9.1
Av. P (mg/kg)42 ± 6.0142 ± 4185 ± 8.092 ± 14
Ex. K (mg/kg)2008 ± 101892 ± 761538 ± 141025 ± 100
CaCO3 (%)14.4 ± 1.025.60 ± 0.379.47 ± 1.167.84 ± 0.22
B: biochar only; C: compost-only; BC: composed of biochar and compost by 1:1 (w/w); BC3: composed of biochar and compost by 1:3 (w/w); Av. P: available phosphorous; Exc. K: exchangeable potassium. Organic carbon was determined by wet oxidation method (Nelson and Sommers, 1982) [27].
Table 3. Soil pH comparison before and after incubation.
TreatmentsLoamy SandClay Loam
1 Day180 Day1 Day180 Day
CK7.6 ± 0.1 bB6.6 ± 0.1 aA4.3 ± 0.1 aA4.1 ± 0.1 aA
C7.3 ± 0.1 aA6.8 ± 0.1 aAB4.7 ± 0.1 aB4.2 ± 0.1 aA
B7.7 ± 0.1 bB7.3 ± 0.1 aB5.0 ± 0.1 aB4.6 ± 0.2 abA
BC7.3 ± 0.1 aA6.9 ± 0.1 aAB4.9 ± 0.1 aB4.6 ± 0.1 abA
BC37.3 ± 0.1 aA7.0 ± 0.1 aB4.8 ± 0.2 aB4.5 ± 0.1 abA
Lowercase letters represent comparisons between the same treatment at different days (p < 0.05); Uppercase letters represent comparisons between different treatments on the same day (p < 0.05).
Table 4. Dynamic changes in available P content in the experimental soil solutions.
Loamy Sand
TreatmentsAvailable P (mg/L)
137142856120180
CK18 ± 0.6 d13 ± 2.0 a12 ± 1.3 a9 ± 2.0 a7 ± 1.4 a15 ± 1.1 a16 ± 4.0 a18 ± 4.0 ab
B19 ± 2.0 d18 ± 0.9 c20 ± 1.1 c15 ± 3.0 b11 ± 2.3 b16 ± 2.0 ab15 ± 6.0 a14 ± 5.6 a
C6.2 ± 0.6 a15 ± 1.0 b15 ± 2.0 b15 ± 1.0 b14 ± 1.8 c19 ± 0.6 d22 ± 7.0 ab34 ± 9.0 d
BC9.5 ± 1.0 b14 ± 0.7 ab14 ± 0.9 ab16 ± 4.0 b19 ± 1.8 d17 ± 2.0 cd19 ± 1.0 ab21 ± 1.8 b
BC314 ± 2.0 c17 ± 2.0 c14 ± 0.7 ab17 ± 4.0 b20 ± 2.1 d17 ± 1.0 bc22 ± 2.0 b27 ± 3.9 c
Lowercase letters represent a comparison between different treatments at the same day (p < 0.05). The available P could not be determined in soil solution in clay loam soil during incubation period, and we therefore did not list the results.
Table 5. NUE of the crops (%).
TreatmentsLoamy Sand Clay Loam
1st2nd 1st2nd
CK11.3 ± 0.6 aA11.0 ± 0.6 aBCK6.1 ± 0.2 aA4.9 ± 0.1 bA
C17.5 ± 1.2 aC12.5 ± 0.8 aBC9.9 ± 0.7 aC3.9 ± 1.7 bA
B12.0 ± 1.4 bA5.9 ± 0.3 aAB5.8 ± 0.6 aA4.6 ± 0.7 aA
BC14.4 ± 1.0 aB15.9 ± 1.2 aCBC5.8 ± 0.4 aA5.3 ± 0.5 aA
BC316.4 ± 0.7 aC19.5 ± 1.8 bDBC38.0 ± 0.2 aB9.1 ± 0.2 bB
Lowercase letters represent comparisons between the same treatment at different crop periods (p < 0.05); Uppercase letters represent comparisons between different treatments in the same crop period (p < 0.05).
Table 6. PUE of the crops (kg kg−1).
TreatmentsLoamy Sand Clay Loam
1st2nd 1st2nd
CK5.0 ± 1.3 bB5.9 ± 2.9 bACK4.9 ± 1.1 aA2.7 ± 1.2 bA
C11 ± 2.8 bC8.3 ± 3.1 bABC4.1 ± 0.8 aAB1.9 ± 0.9 bA
B3.6 ± 0.4 aAB9.6 ± 7.0 bABB2.5 ± 1.1 aB2.6 ± 0.5 aA
BC6.3 ± 1.7 aBC12 ± 4.4 bBBC3.4 ± 1.0 aB4.8 ± 1.4 abAB
BC311 ± 1.6 aD29 ± 11 bCBC34.1 ± 3.3 aAB5.0 ± 0.8 bB
Lowercase letters represent comparisons between the same treatment at different crop periods (p < 0.05); Uppercase letters represent comparisons between different treatments in the same crop period (p < 0.05).
Publisher’s Note: MDPI stays neutral with regard to jurisdictional claims in published maps and institutional affiliations.

