Article

Design and Performance Test of the Coffee Bean Classifier

1
Department of Agricultural Engineering, Faculty of Food Technology and Agroindustry, University of Mataram, Mataram 82115, Indonesia
2
Fresh Graduate of Department of Agricultural Engineering, Faculty of Food Technology and Agroindustry, University of Mataram, Mataram 82115, Indonesia
*
Author to whom correspondence should be addressed.
Processes 2021, 9(8), 1462; https://doi.org/10.3390/pr9081462
Submission received: 22 June 2021 / Revised: 17 August 2021 / Accepted: 19 August 2021 / Published: 21 August 2021
(This article belongs to the Topic Modern Technologies and Manufacturing Systems)

Abstract

:
Currently, some coffee production centers still perform classification manually, which requires a very long time, a lot of labor, and expensive operational costs. Therefore, the purpose of this research was to design and test the performance of a coffee bean classifier that can accelerate the process of classifying beans. The classifier used consisted of three main parts, namely the frame, the driving force, and sieves. The research parameters included classifier work capacity, power, specific energy, classification distribution and effectiveness, and efficiency. The results showed that the best operating conditions of the coffee bean classifier was a rotational speed of 91.07 rpm and a 16° sieve angle with a classifier working capacity of 38.27 kg/h: the distribution of the seeds retained in the first sieve was 56.77%, the second sieve was 28.12%, and the third sieve was 15.11%. The efficiency of using a classifier was found at a rotating speed of 91.07 rpm and a sieve angle of 16°. This classifier was simple in design, easy to operate, and can sort coffee beans into three classifications, namely small, medium, and large.

Graphical Abstract

1. Introduction

Coffee is a beverage that has a distinctive taste and aroma, so it is in demand by many people throughout the world [1,2]. Coffee contains many bioactive compounds such as caffeine, chromogenic acid, and diterpenoid alcohol, which are beneficial to health [3,4,5]. Additionally, coffee contains macronutrients such as carbohydrates, proteins, fats, and micronutrients, such as trigonelline and chromogenic acid, as a source of natural antioxidants [6,7,8].
Many factors determine the quality and price of coffee [9,10], one of which is the uniform size of the diameter of the beans [11,12]. Uniformity of size not only makes the product more attractive to consumers but can also improve the quality of subsequent processing [13,14]. The smallest seed size tends to burn excessively when roasting, while the largest tends to be undercooked which can affect the taste and aroma [15]. Therefore, before marketing, the coffee beans must be graded to determine the classification based on the size of the diameter of the seeds, and the broken, moldy, or germinated seeds must be separated [16,17].
In general, farmers, collectors, and retailers market coffee beans without classification because their time is limited for classification [18,19]. According to Vogt [20], the process of classification of coffee beans is still conducted manually in several coffee production centers, so it requires a very long time, a lot of labor, and expensive operational costs. The use of human labor for classification also has drawbacks, such as judgments that are subjective and inconsistent with the object being assessed [21,22]. Coffee beans with a high degree of diameter difference require a long classification process [23,24]. Adhikari et al. [25] also explained that coffee bean classifiers on the market were generally only used for the initial classification process, so that continued manual classification was still needed at the final stage of the classification process.
The coffee bean classifier, which has been widely circulating in the market today, is a type of sifter [26,27]. This classifier is equipped with a blower to blow air. Classification containers are round, rectangular, or triangular [28]. The mechanism of movement of the classifier can be divided into three types, namely stationary, rotating, and vibrating [29]. A stationary-type classifier is generally used to separate seeds with a diameter of 1.27–10.16 cm. The rotating type classifier has several sieves with different hole diameters. The vibrating-type classifier is mechanically driven from electrical energy to the frame, which then proceeds to the sieve section [30,31].
The effect of a well-working classifier is to produce a coffee bean size distribution that is close to the distribution obtained manually [32]. According to Chanpaka et al. [33], the effectiveness of classifiers tends to be lower at high capacities, so it is necessary to choose the rotation speed of the driving force, and the sifting angle, to produce high work capacity and uniform quality of results.
Several researchers have previously implemented a coffee bean classifier using the principle of vibration to classify coffee beans [34,35]. However, these classifiers are generally not ergonomic because the design does not fit the dimensions of the worker’s body size. Therefore, it is necessary to research the design and performance testing of the coffee bean classifier. The purpose of this research is to develop designs and test the performance of a coffee bean classifier that can accelerate the process of classifying beans. The results of this study are expected to be used as information and operational guidelines for coffee processing to obtain optimal quality coffee classification.

2. Materials and Methods

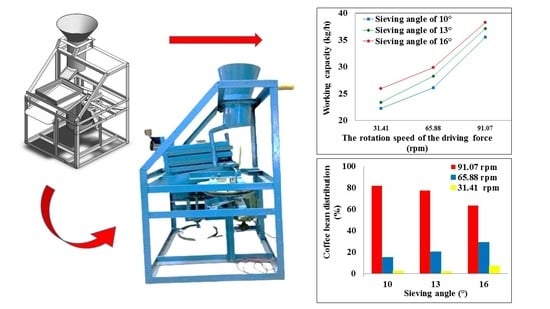
2.1. Material and Tools

The material used was dried Robusta coffee beans obtained from farmers in Tanjung, North Lombok Regency, West Nusa Tenggara Province, Indonesia. These skinless coffee beans have a moisture content between 12 and 15% and a diameter ranging from 4 to 8 mm. The equipment used was a modified flat-type coffee bean classifier (Figure 1), tachometer, and analytical scales.
Annotation:
  • Feed hopper
  • Frame
  • Output hopper
  • Classification chamber
  • Output
  • Electric motor drive
  • Pulley
  • V-belt
This classifier had three main parts, namely the frame, driving force, and sieves (Figure 1). The engine frame was made of angle iron with a size of 0.4 × 0.4 mm and a thickness of 0.04 mm. The frame had a height of 1300 mm, a length of 700 mm, a width of 290 mm, and a width of 700 mm below. The sieve units were rectangular with length, width, and thickness of each unit being 440, 290, and 30 mm, respectively. The sieve wall was made of 30 mm thick wood, and each corner was connected with a 30 mm aluminum plate. The first, second, and third sieve each had a diameter of 7.5, 6.5, and 5.5 mm, respectively.
The driving force to vibrate the sieves component was a 1 HP electric motor. The power transmission system from the driving force to the classification engine shaft used a pulley and V-belt system. The power transmission system from the pulley to the sieve shaft created vibration using a direct power transmission system.

2.2. Research Procedure

The study was conducted with two types of treatment variations, namely the rotational speed of the driving force and the sieve angle. The rotational speed of the driving force consists of 3 levels, namely 91.07, 65.88, and 31.41 rpm. Variations in the rotational speed of this driving power are generated by regulating the input power of the electric motor using a regulator. Meanwhile, the slope of the sieve angle consists of three levels, namely 10, 13, and 16°. The variation of the tilt angle was obtained by adjusting the position of the two ends of the sieve. Each treatment was repeated three times. For control, coffee beans were manually classified. The number of samples in each experiment was 3 kg. Each experiment was repeated 3 times. The diameter of the coffee beans measured was the average diameter in an upright position based on the influence of the earth’s gravity.

2.3. Research Parameters

The parameters measured included classifier work capacity, power, specific energy, classification distribution, classification effectiveness, and classifier efficiency. There are two types of engine working capacity, namely theoretical and actual. The theoretical capacity was calculated by the equation:
M c T = 60   V   ρ   n
where McT = classifier capacity of theoretic (kg/h), V = volume classification (m3), ρ = beans densities (kg/m3), n = rotational speed of the driving force (rpm).
The actual capacity was calculated by the equation:
M c A = W s t
where McA = classifier capacity of actual (kg/h), Ws = seeds weight (kg), and t = time (h).
Power was calculated by the equation:
P = 2 π ω n 60
where P = Power (W), ω = torque moment (Nm), n = rotational speed of the driving force (rpm).
Classification specific energy consumption was calculated by the equation:
GSEC = P M c A
where GSEC = Classification specific energy consumption (kJ/kg), P = Power (W), McA = classifier capacity of actual (kg/h).
The distribution of classification results was calculated by the equation:
D i s = G s M t × 100 %
where Dis = classification distribution (%), Gs = classification sieve (kg), Mt = total material (kg).
The effectiveness of classification was calculated by the equation:
  E f f = M c g M n g
where Eff = effectiveness (%), Mcg = classifier classification (kg), manual classification (kg).
The efficiency of the classifier was calculated by comparing theoretical capacity with actual capacity, or with the equation [36]:
η = M c T M c A
where η = classifier efficiency (%), McT = classifier capacity of theoretic (kg/h), McA = classifier capacity of actual (kg/h).

2.4. Data Analysis

The data were analyzed using regression equations to determine the relationship between the rotational speed of the driving force and the angle of sieves as independent variables on the working capacity of the classifier; power, specific energy, distribution of classification results, classification effectiveness, and efficiency as the dependent variables. The closeness of the relationship was indicated by the coefficient of determination (R2). A high R2 value means that there is a close relationship between the independent and dependent variables.

3. Results and Discussion

3.1. Classifier Working Capacity

The results showed that coffee beans that fell from the hopper to the filter were separated based on the diameter of the beans. With a sifting angle of 10°, and with the classifier working capacity at rotary speeds of 91.07, 65.88, and 31.41 rpm, the results of the actual capacity test were 35.51, 26.62, and 22.55 kg/h, respectively (Figure 2). For a sifting angle of 13°, the classifier working capacity at the rotational speeds of the driving force of 91.07, 65.88, and 31.41 rpm gave results of 37.22, 28.21, and 23.45 kg/h, respectively. As for the sifting angle of 16°, and the classifier working capacity at the rotational speeds of the driving force of 91.07, 65.88, and 31.41 rpm, the results were 38.27, 29.86, and 25.87 kg/h, respectively.
The linear regression equation of the relationship between the rotational speed of the driving force and the sifting angle of the classifier working capacity is shown in Table 1. The equation applies to the driving force rotation range between 31.41 to 91.07 rpm. Based on the consideration of the comfort level of the engine, the maximum driving force rotation that could be used was 91.07 rpm.
The classifier working capacity was largely determined by the rotational speed of the driving force and the sieve angle. The greater the sieve angle and rotational speed of the driving force, the higher the classifier working capacity (Figure 2). Conversely, the smaller the sieve angle and rotational speed of the driving force, the lower the classifier working capacity. This is thought to be due to the influence of the coffee bean slip style. A high slip force causes the seeds to slide down faster, so getting into the sieve hole is also faster. This data is in line with the results of the study by Mofolasayo et al. [37], which reported that engine capacity is determined by the rotational speed of the driving force and the sieve angle. However, according to Olukunle and Akinnuli [38], the use of sifting angles and higher rotational speed of the driving force does not mean that the classifier provides work capacity with the best quality of final product, but depends on the initial uniformity of the coffee beans to be graded.

3.2. Power

Power measurements are taken when there is a load, using a clamp meter. The actual power at the rotational speed of the driving force 31.41 rpm was an average of 15 Watts, while the rotational speed of the driving force of 65.88 and 91.07 rpm was 17 and 20 Watts, respectively. This data shows that the higher the rotational speed of the driving force, the greater the classifier power. The same data has been reported by Qian et al. [39]: that engine power at a rotational speed of 400 rpm has an average value of 87.5 Watts, while at a speed of 800 rpm the required power was 133.4 Watts.
Linear regression analysis obtained the equation of the relationship between the rotational speed of the driving force with power (y):
y = 6.48x + 15.267
R2 = 0.9559
The Equation (8) can only be applied to the rotational speed of the driving force between 31.41 and 91.07 rpm. It showed that the higher the rotational speed of the driving force, the greater the power needed. A large classifier working capacity requires a high rotational speed of the driving force as well. The use of electrical energy can be greater with the higher rotational speed of the driving force. To follow the requirements of the International Energy Agency by using less energy input but obtaining the same quality [40], it is necessary to redesign this classifier.

3.3. Specific Energy Consumption

Specific energy consumption (SEC) was the energy needed to do coffee bean classification which can be calculated by dividing the power needed for the classification process by the actual capacity of the classifier. Based on the calculation results obtained, the specific energy classification was 135 kJ/kg. The SEC shows the level of efficiency and effectiveness of classification energy use based on inputs and outputs, and its value is used to estimate energy consumption during the classification process.
Some researchers have also previously reported that SEC was a model of energy consumption from a certain perspective [41]. Because the SEC includes a mapping relationship between energy consumption during certain classification work processes, its value can not only compare energy efficiency differences from the same machining process and different processing parameters, but can also reflect energy intensity and productivity differences in different machining processes [42]. Therefore, even though some SEC models are not accurate enough and the relevant parameters are complex, the concept is easy to understand and calculate. Therefore, according to Ma et al. [43], the application is very general.

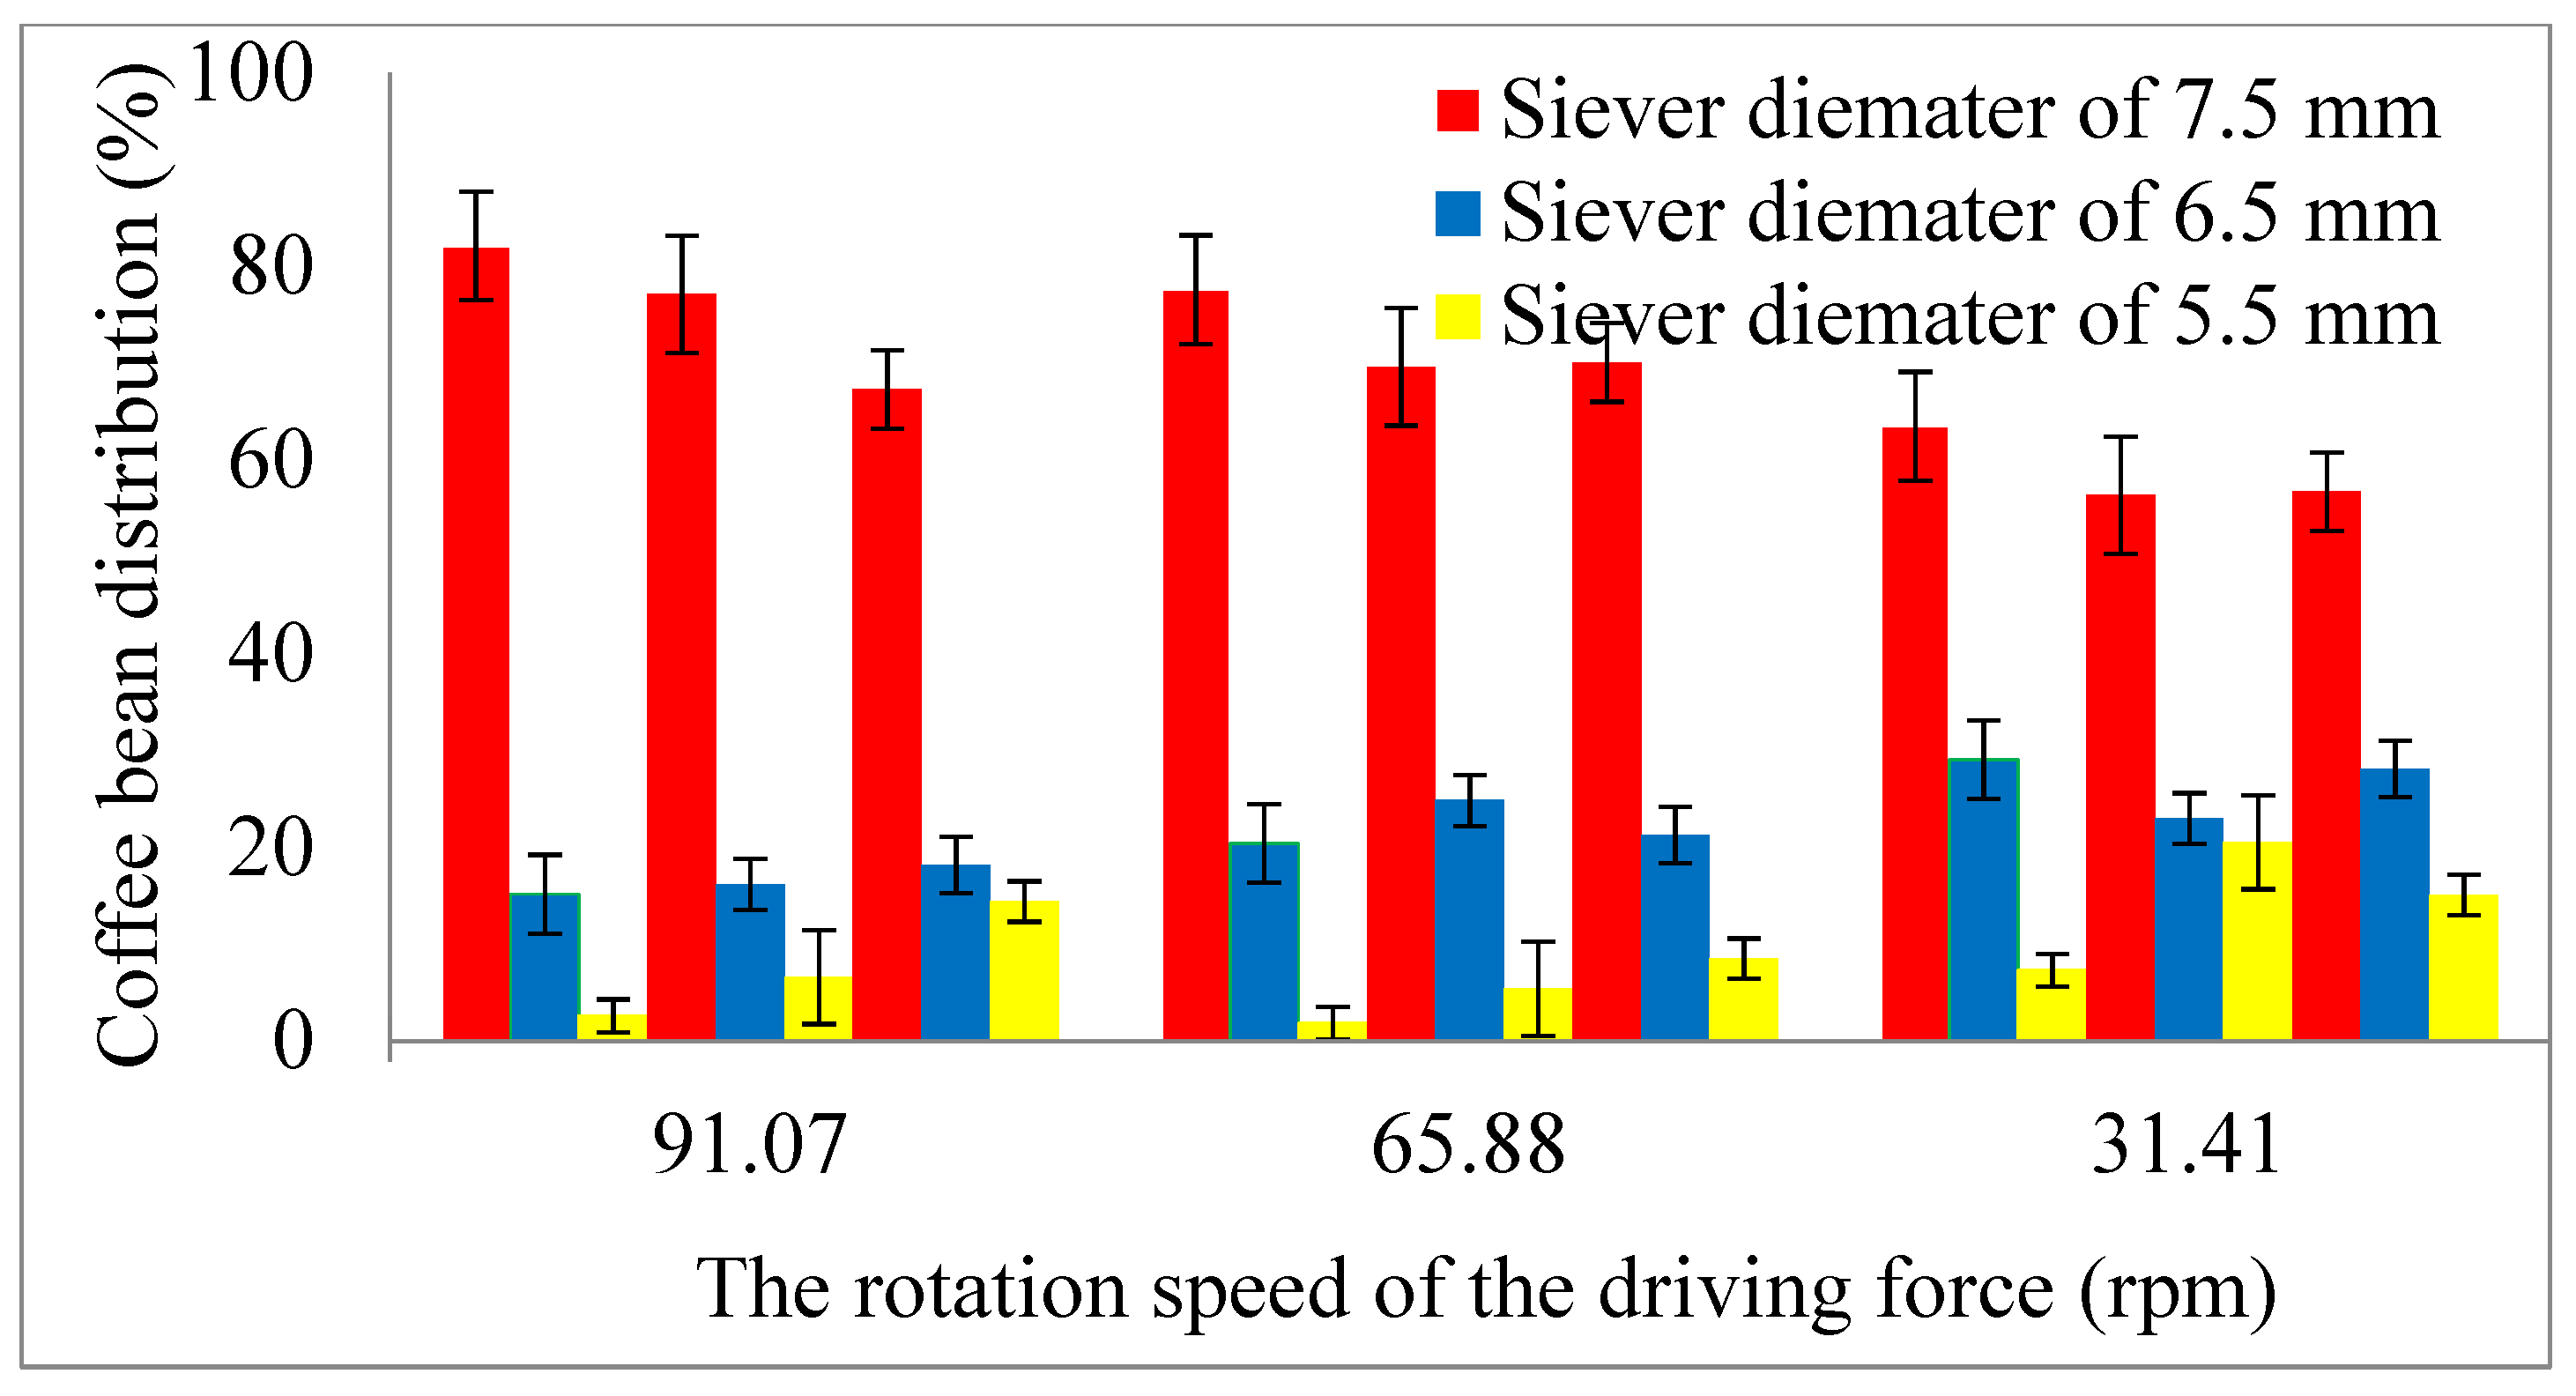
3.4. Distribution of Classification Results

The distribution of classification results in each sieve was a comparison between the classification results in each sieve and the total weight of the material being fed. The percentage of beans in each sifting was largely determined by the sieve angle and the rotational speed of the driving force (Figure 3). At the same sifting angle, the higher the rotational speed of the driving force, the fewer the number of beans retained. This happened because the coffee beans were slipping more easily into the sieve, so that the number of beans retained was also decreasing.
The observations show that at a sieve angle of 10° and a rotational speed of driving force of 31.41 rpm, the number of beans held in the first sieve was 82.14%, while at a rotational speed of driving force of 65.88 and 91.07 rpm, the number of beans retained was 77.65% and 63.54%, respectively. The same trend occurred at the sieve angle of 13° and 16° (Figure 3). This result is in line with the research report by Gunathilake et al. [21] that states that the best classifier working conditions are those that give the smallest seed size distribution deviation compared to the seed size distribution obtained from manually graded beans.

3.5. Classification Electivity

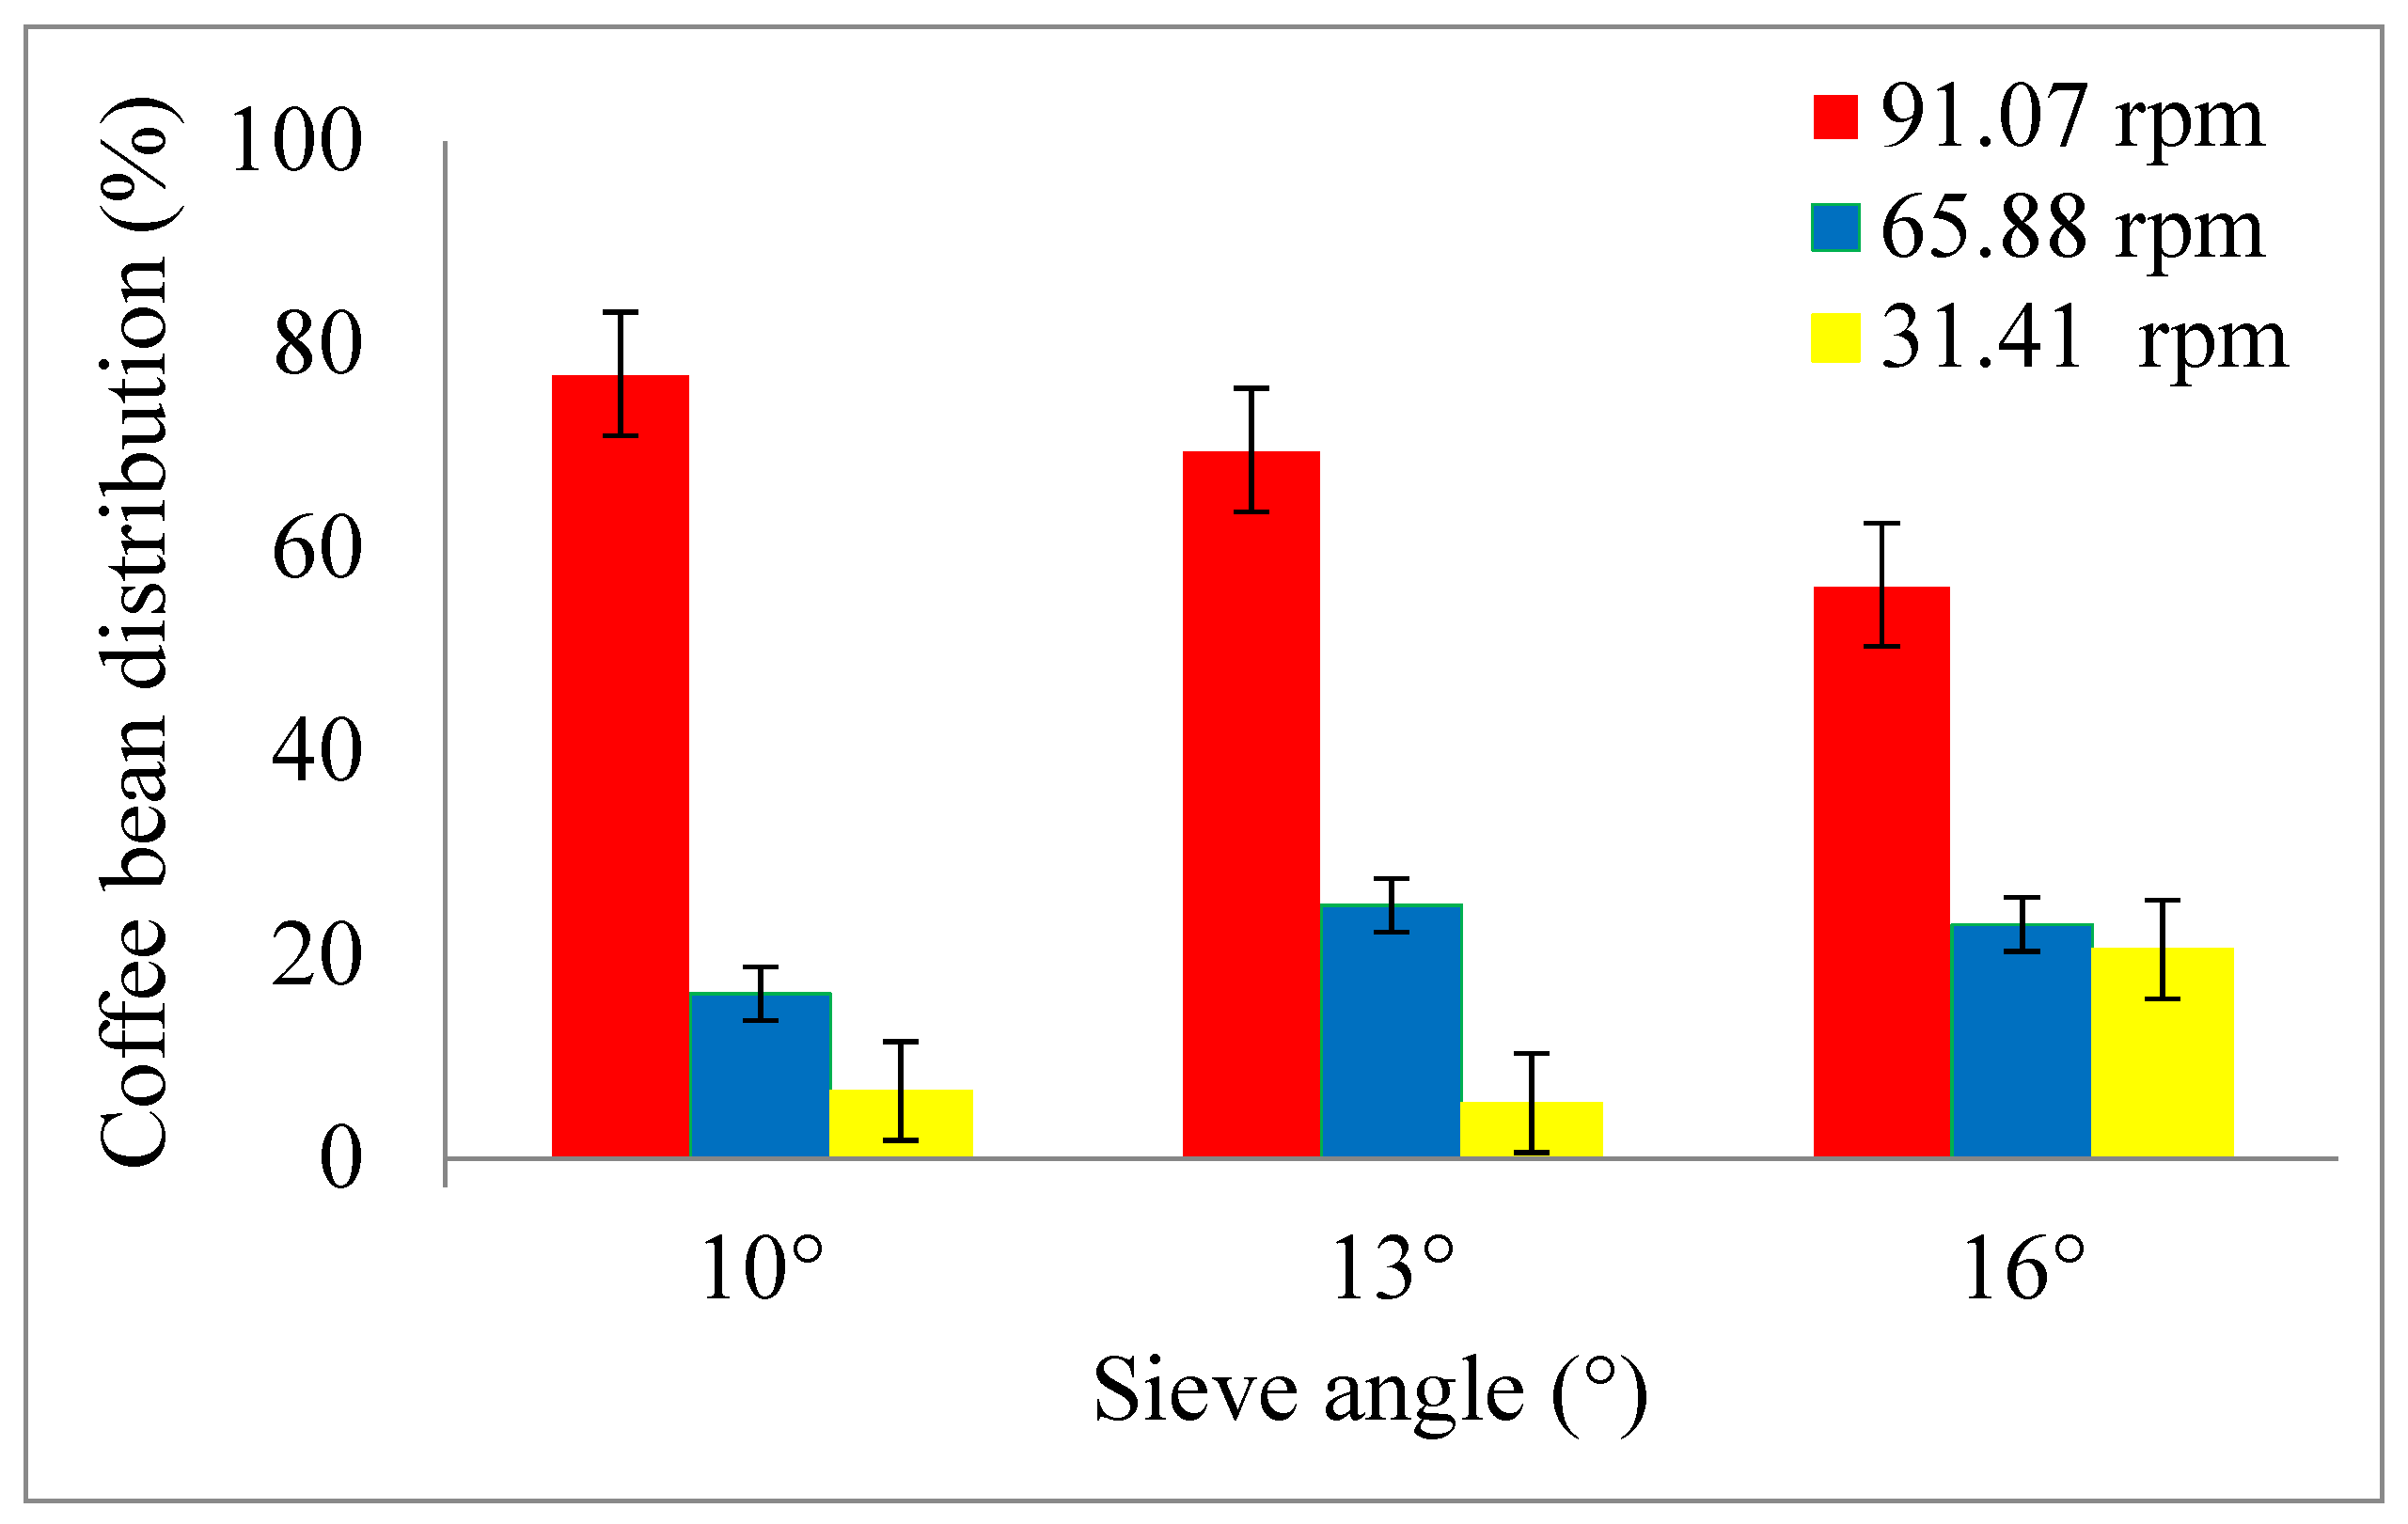
3.5.1. The First Sieve

The first sieve retained a collection of seeds with a diameter greater than 7.5 mm. The classification results show that the distribution of coffee beans retained in the first sieve, with a rotational speed of 91.07 rpm and a sifting angle of 10°, obtained 82.14% of coffee beans larger than 7.5 mm, whereas at the rotational speed of the driving force of 65.88 and 31.41 rpm, the percentages of coffee beans retained were 77.65% and 63.54%, respectively (Figure 4). This data shows that at the sifting angle of 10° and the rotational speed of the driving force of 91.07 rpm, the percentage of coffee beans that had a diameter smaller than the diameter of the 7.5 mm sieve hole was 17.86%. The higher the rotation speed of the driving force, the higher the percentage of the number of coffee beans with a diameter smaller than 7.5 mm. The same thing was also shown from the test results at the rotational speed of the driving force of 65.88 and 31.41 rpm: 15.21 and 2.65%, respectively.

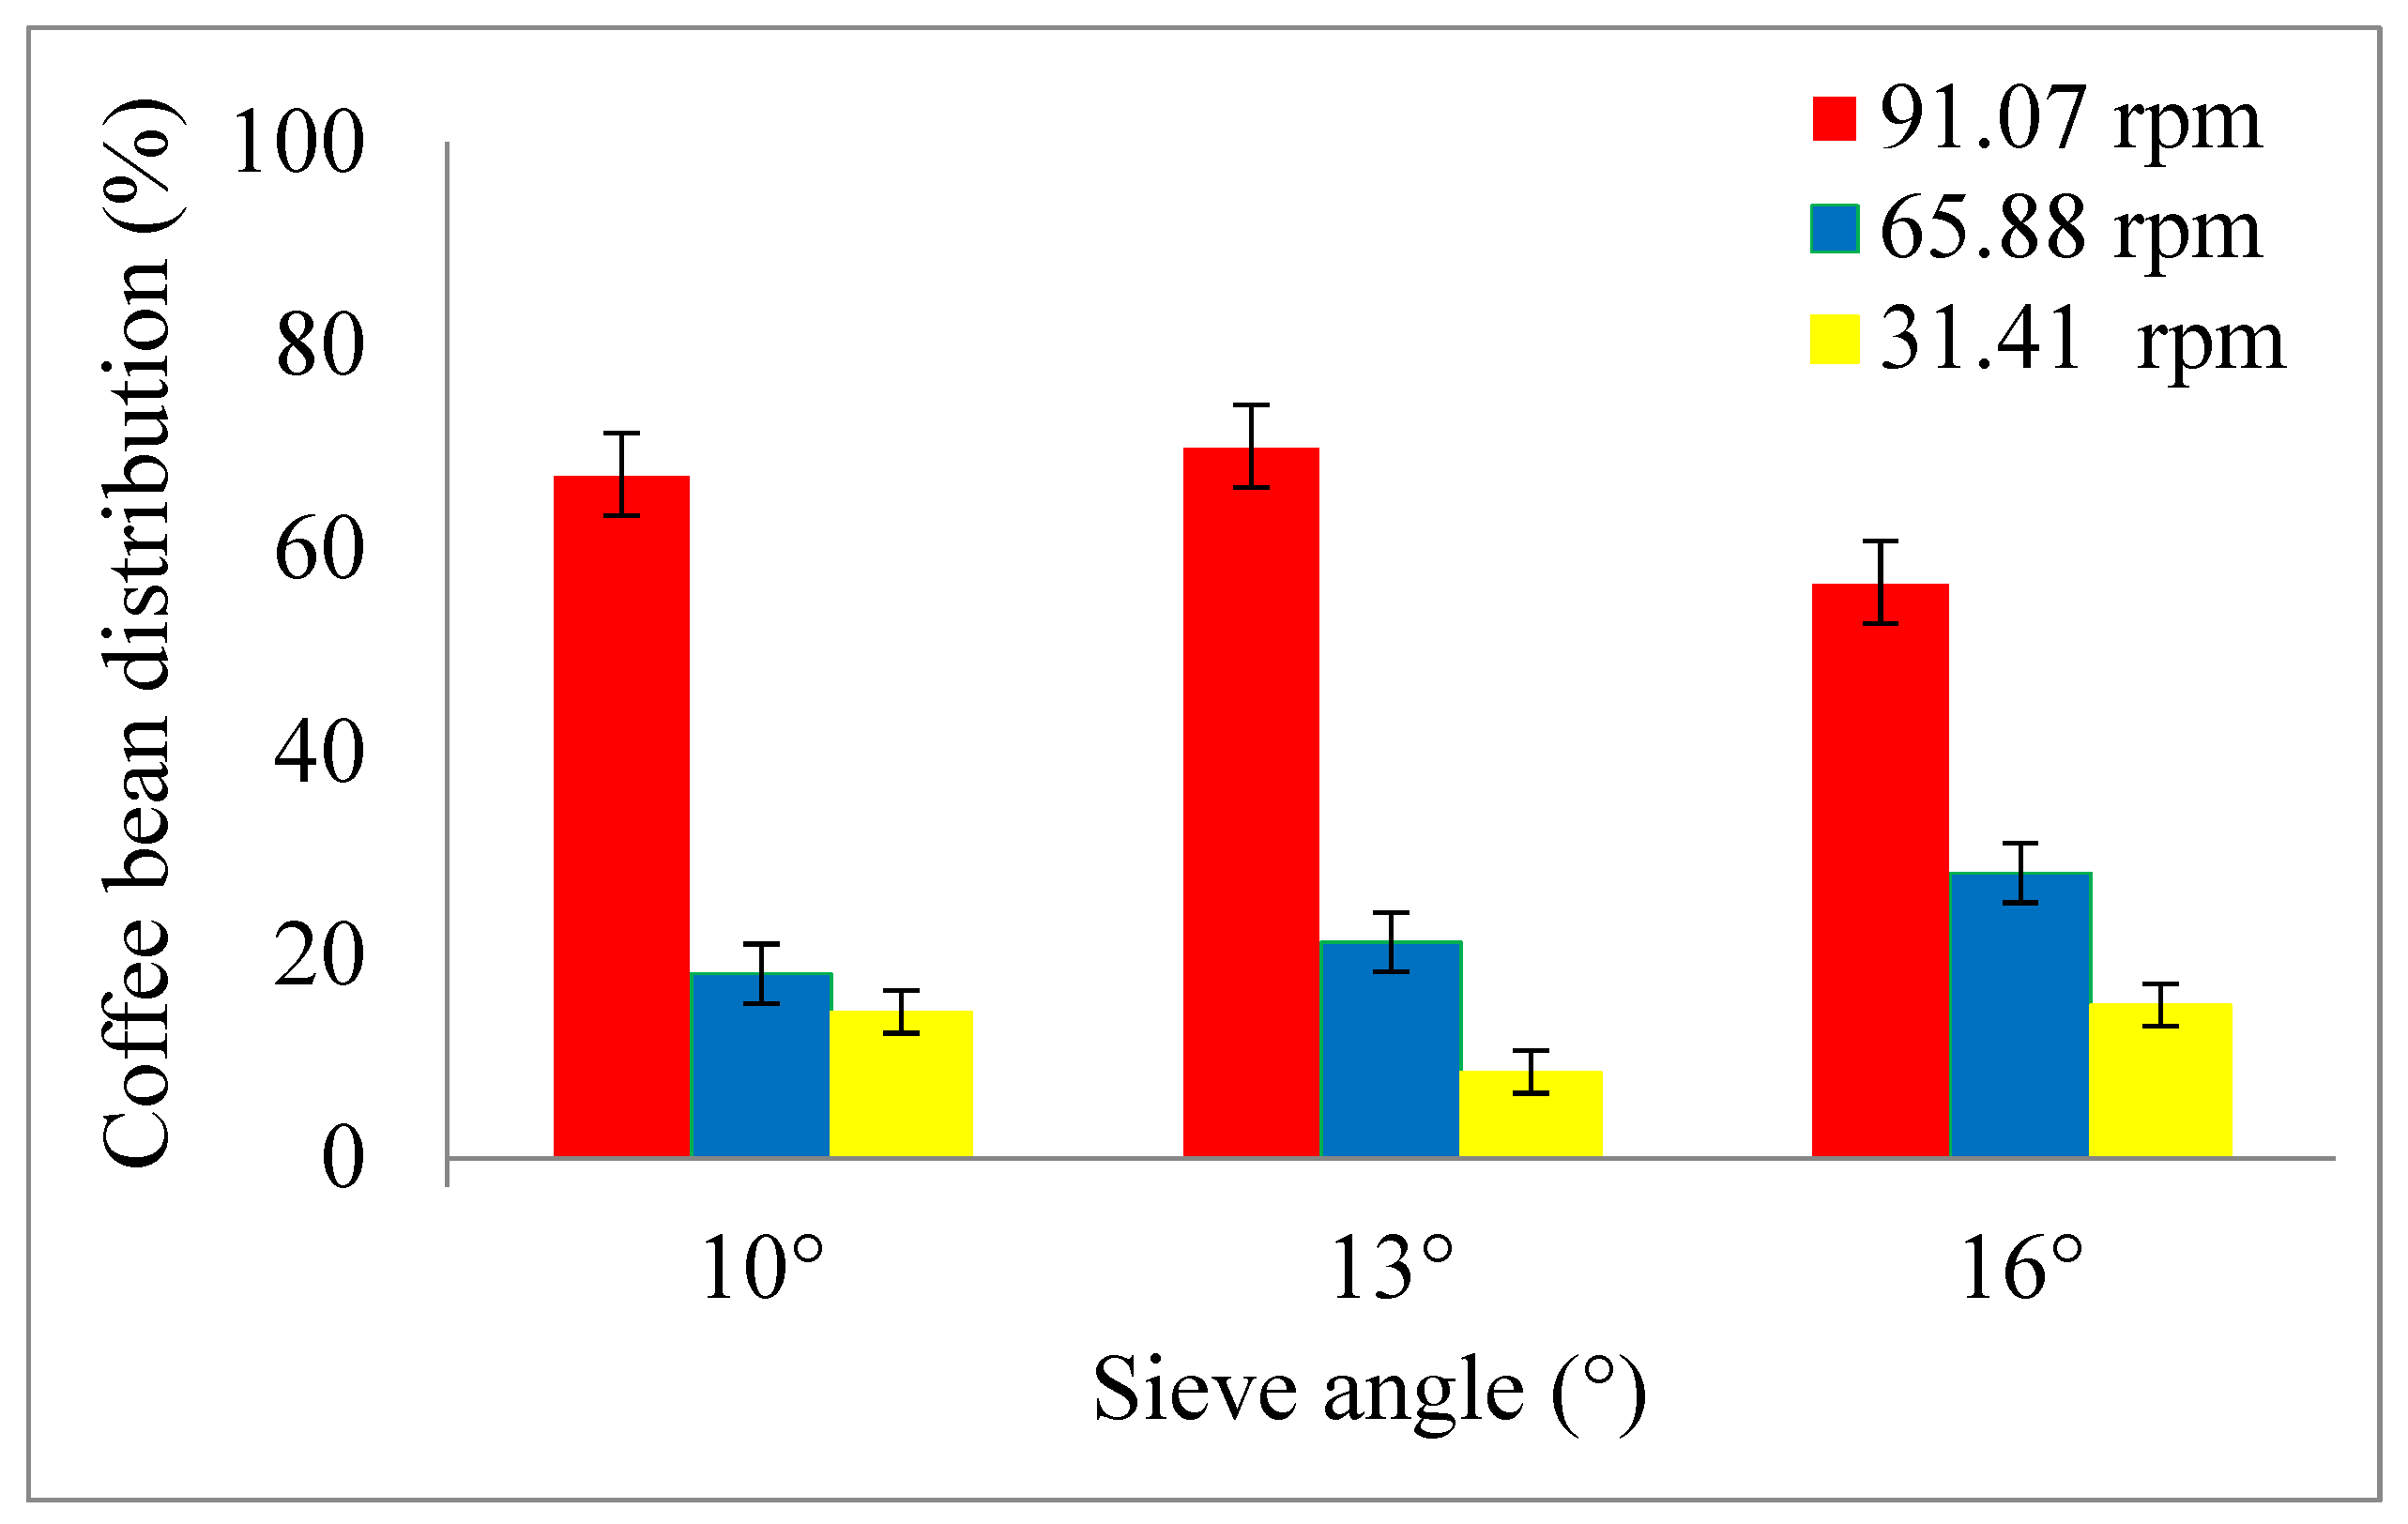
3.5.2. The Second Sieve

The second sieve retained a collection of beans with a diameter smaller than 7.5 and greater than 6.5 mm. The classification results show that the distribution of coffee beans retained in the second sieve at the rotation speed of the driving force of 91.07 rpm and a sieve angle of 10° was 77.14%, while at the rotation speed of the driving force of 65.88 and 31.41 rpm, it was 16.21% and 6.65%, respectively (Figure 5). This data shows that at a sieve angle of 10° and a rotation speed of the driving force of 91.07 rpm, there were 22.86% of coffee beans with a diameter between 6.5 and 7.5 mm. The faster the rotation of the driving force, the higher the percentage of coffee beans with a diameter smaller than 6.5 mm. The same thing was also obtained from the test results on the rotation speed of the driving force of 65.88 and 31.41 rpm: 16.21% and 6.65%, respectively.

3.5.3. The Third Sieve

The third sieve retained a collection of beans with a diameter smaller than 5.5 mm. The classification results show that the distribution of coffee beans held in the third sieve at the rotation speed of the driving force of 91.07 rpm and a sieve angle of 10° was 67.34%, while at the rotation speed of the driving force of 65.88 and 31.41 rpm, it was 18.21% and 14.45%, respectively (Figure 6). This data shows that at a sieve angle of 10° and a rotation speed of the driving force of 91.07 rpm, as much as 32.66% of coffee beans had a smaller bean diameter than the sieve hole diameter of 5.5 mm. The faster the rotation speed of the driving force, the higher the percentage of coffee beans with a bean diameter smaller than 5.5 mm. Some previous research results also show the same trend data, as reported by Gunathilake et al. [21]: the rotational speed of 15 rpm and the sieve angle of 3° to the horizontal axis of the cylinder produces the highest performance of 93.46%.

3.5.4. The Efficiency of Classification

The efficiency of classification was calculated by comparing the actual capacity of the engine with the theoretical capacity of the engine. The actual capacity of the classifier was the ability of the classifier to do classification within a certain time interval. Based on the calculation of the actual capacity of 16.5 kg/h and the theoretical capacity value of 18 kg/h, the efficiency of the classifier was 91.67%. This value indicates that the efficiency of the classifier was already high, but still needs to be improved. To increase the efficiency of classification, the rotational speed of the driving force needs to be increased based on the Indonesian National Standard (INS).
The energy efficiency was the ratio between performance and energy input. The energy efficiency has a specific application definition for each different condition, but the definition most commonly used is a thermodynamic perspective that uses the ratio of product output to total energy input [44]. Due to the complexity of the function of classifier tools, according to Zhou et al. [41], the definition of energy efficiency is not clear so far and there is an amount of energy efficiency evaluation indicators that can be used for various classifier tools.

4. Conclusions

The working capacity of a classifier was largely determined by the rotational speed of the driving force and the sieve angle. The greater the rotational speed of the driving force and the greater the sieve angle, the higher the working capacity of the engine. The best classification operating conditions was found at the rotational speed of the driving force of 91.07 rpm and a sieve angle of 16°, with a produced classifier working capacity of 38.27 kg/h. The distribution of beans held in the first, second, and third sieve was 56.77, 28.12, and 15.11%, respectively. Efficiency using the classifier was found at the rotational speed of the driving force of 91.07 rpm and a sieve angle of 16°; it was 91.67%. To produce high engine working capacity, a high-speed driving force was also needed. The power generated by the driving force increases with the increased rotation of the driving force. This classifier could feasibly be applied to improve the process of classifying coffee beans.

Author Contributions

Conceptualization, A. (Ansar). and S.; methodology, M.; software, R.H.P.; validation, S.A.M.; formal analysis, A. (Abdurrahim); investigation, R.H.P.; resources, A. (Abdurrahim); data curation, A. (Ansar); writing—original draft preparation, A. (Ansar); writing—review and editing, S.; visualization, M.; supervision, S.A.M.; project administration, R.H.P.; funding acquisition, A. (Ansar). All authors have read and agreed to the published version of the manuscript.

Funding

This research received no external funding.

Institutional Review Board Statement

Not applicable.

Informed Consent Statement

Not applicable.

Data Availability Statement

Data is contained within the article.

Acknowledgments

The authors gratefully acknowledge the Faculty of Food Technology and Agroindustry, University of Mataram for all supporting facilities in this research.

Conflicts of Interest

The authors declare no conflict of interest.

References

  1. Monteiro, P.I.; Santos, J.S.; Brizola, V.A.; Deolindo, C.P.; Koot, A.; Boerrigter-Eenling, R.; van Ruth, S.; Georgouli, K.; Koidis, A.; Granato, D. Comparison between proton transfer reaction mass spectrometry and near infrared spectroscopy for the authentication of Brazilian coffee: A preliminary chemometric study. Food Control 2019, 91, 276–283. [Google Scholar] [CrossRef]
  2. Grgic, J.; Grgic, I.; Pickering, C.; Schoenfeld, B.J.; Bishop, D.J.; Pedisic, Z. Wake up and smell the coffee: Caffeine supplementation and exercise performance-an umbrella review of 21 published meta-analyses. Br. J. Sports Med. 2020, 54, 681–688. [Google Scholar] [CrossRef]
  3. Gokcen, B.B.; Sanlier, N. Coffee consumption and disease correlations. Crit. Rev. Food Sci. Nutr. 2019, 59, 336–348. [Google Scholar] [CrossRef]
  4. Gu, J.; Pei, W.; Tang, S.; Yan, F.; Peng, Z.; Huang, C.; Yang, J.; Yong, Q. Procuring biologically active galactomannans from spent coffee ground (SCG) by autohydrolysis and enzymatic hydrolysis. Int. J. Biol. Macromol. 2020, 149, 572–580. [Google Scholar] [CrossRef]
  5. Rodriguez, L.J.; Fabbri, S.; Orrego, C.E.; Owsianiak, M. Comparative life cycle assessment of coffee jar lids made from biocomposites containing poly(lactic acid) and banana fiber. J. Environ. Manag. 2020, 266, 110493. [Google Scholar] [CrossRef]
  6. Sanlier, N.; Atik, A.; Atik, I. Consumption of green coffee and the risk of chronic diseases. Crit. Rev. Food Sci. Nutr. 2019, 59, 2573–2585. [Google Scholar] [CrossRef]
  7. Krol, K.; Gantner, M.; Tatarak, A.; Hallmann, E. The content of polyphenols in coffee beans as roasting, origin and storage effect. Eur. Food Res. Technol. 2020, 246, 33–39. [Google Scholar] [CrossRef] [Green Version]
  8. Geeraert, L.; Berecha, G.; Honnay, O.; Aerts, R. Organoleptic quality of Ethiopian Arabica coffee deteriorates with increasing intensity of coffee forest management. J. Environ. Manag. 2019, 231, 282–288. [Google Scholar] [CrossRef]
  9. Kim, M.S.; Min, H.G.; Koo, N.; Park, J.; Lee, S.H.; Bak, G.I.; Kim, J.G. The effectiveness of spent coffee grounds and its biochar on the amelioration of heavy metals-contaminated water and soil using chemical and biological assessments. J. Environ. Manag. 2014, 146, 124–130. [Google Scholar] [CrossRef]
  10. Rossmann, M.; Matos, A.T.; Abreu, E.C.; Silva, F.F.; Borges, A.C. Effect of influent aeration on removal of organic matter from coffee processing wastewater in constructed wetlands. J. Environ. Manag. 2013, 128, 912–919. [Google Scholar] [CrossRef]
  11. Subedi, R.N. Comparative analysis of dry and wet processing of coffee with respect to quality and cost in Kavre District, Nepal: A case of Panchkhal Village. Int. Res. J. Appl. Basic Sci. 2011, 2, 181–193. [Google Scholar]
  12. Takahashi, R.; Todo, Y. The impact of a shade coffee certification program on forest conservation: A case study from a wild coffee forest in Ethiopia. J. Environ. Manag. 2013, 130, 48–54. [Google Scholar] [CrossRef] [Green Version]
  13. Odzakovic, B.; Dzinic, N.; Kukric, Z.; Grujic, S. Effect of roasting degree on the antioxidant activity of different Arabica coffee quality classes. Acta Sci. Pol. Technol. Aliment. 2016, 15, 409–417. [Google Scholar] [CrossRef] [Green Version]
  14. Ibarra-Taquez, H.N.; GilPavas, E.; Blatchley, E.R.; Gomez-Garcia, M.A.; Dobrosz-Gomez, I. Integrated electrocoagulation-electrooxidation process for the treatment of soluble coffee effluent: Optimization of COD degradation and operation time analysis. J. Environ. Manag. 2017, 200, 530–538. [Google Scholar] [CrossRef] [PubMed]
  15. Giraudo, A.; Grassi, S.; Savorani, F.; Gavoci, G.; Casiraghi, E.; Geobaldo, F. Determination of the geographical origin of green coffee beans using NIR spectroscopy and multivariate data analysis. Food Control 2019, 99, 137–145. [Google Scholar] [CrossRef] [Green Version]
  16. Cheng, B.; Furtado, A.; Smyth, H.E.; Henry, R.J. Influence of genotype and environment on coffee quality. Trends Food Sci. Technol. 2016, 57, 20–30. [Google Scholar] [CrossRef] [Green Version]
  17. Alara, O.R.; Abdurahman, N.H.; Ukaegbu, C.I. Extraction of phenolic compounds: A review. Curr. Res. Food Sci. 2021, 4, 200–214. [Google Scholar] [CrossRef]
  18. Yuksel, A.N.; Barut, K.T.O.; Bayram, M. The effects of roasting, milling, brewing and storage processes on the physicochemical properties of Turkish coffee. LWT Food Sci. Technol. 2020, 131, 109711. [Google Scholar] [CrossRef]
  19. Artavia, G.; Cortés-Herrera, C.; Granados-Chinchilla, F. Total and resistant starch from foodstuff for animal and human consumption in Costa Rica. Curr. Res. Food Sci. 2020, 3, 275–283. [Google Scholar] [CrossRef]
  20. Vogt, M.B. Developing stronger association between market value of coffee and functional biodiversity. J. Environ. Manag. 2020, 269, 110777. [Google Scholar] [CrossRef] [PubMed]
  21. Gunathilake, D.C.; Wasala, W.B.; Palipane, K.B. Design, development and evaluation of a size grading machine for onion. Procedia Food Sci. 2016, 6, 103–107. [Google Scholar] [CrossRef] [Green Version]
  22. Zhu, L.; Spachos, P.; Pensini, E.; Plataniotis, K.N. Deep learning and machine vision for food processing: A survey. Curr. Res. Food Sci. 2021, 4, 233–249. [Google Scholar] [CrossRef]
  23. Badmos, S.; Fu, M.; Granato, D.; Kuhnert, N. Classification of Brazilian roasted coffees from different geographical origins and farming practices based on chlorogenic acid profiles. Food Res. Int. 2020, 134, 109218. [Google Scholar] [CrossRef]
  24. Hernandez-Aguilera, J.N.; Gomez, M.I.; Rodewald, A.D.; Rueda, X.; Anunu, C.; Bennett, R.; van Es, H.M. Quality as a driver of sustainable agricultural value chains: The case of the relationship coffee model. Bus. Strategy Environ. 2018, 27, 179–198. [Google Scholar] [CrossRef]
  25. Adhikari, J.; Chambers, E.; Koppel, K. Impact of consumption temperature on sensory properties of hot brewed coffee. Food Res. Int. 2019, 115, 95–104. [Google Scholar] [CrossRef] [PubMed]
  26. Feria-Morales, A.M. Examining the case of green coffee to illustrate the limitations of grading systems/expert tasters in sensory evaluation for quality control. Food Qual. Prefer. 2002, 13, 355–367. [Google Scholar] [CrossRef]
  27. Arboleda, E.R. Comparing Performances of Data Mining Algorithms for Classification of Green Coffee Beans. Int. J. Eng. Adv. Technol. 2019, 8, 1563–1567. [Google Scholar]
  28. Srisang, N.; Chanpaka, W.; Chungcharoen, T. The performance of size grading machine of robusta green coffee bean using oscillating sieve with swing along width direction. In IOP Conference Series: Earth and Environmental Science; IOP Publishing: Bristol, UK, 2019. [Google Scholar]
  29. Widyotomo, S. Optimation of a table conveyor type grading machine to increase the performance of green coffee manual sortation. Coffee Cocoa Res. J. 2006, 22. [Google Scholar] [CrossRef]
  30. Ola, D.; Manescu, M.; Cristea, L.; Budde, J.; Hoffmann, T. Software application in machine vision investigation of agricultural seeds quality. Appl. Mech. Mater. 2013, 436, 463–473. [Google Scholar] [CrossRef]
  31. Portugal-Zambrano, C.E.; Gutiérrez-Cáceres, J.C.; Ramirez-Ticona, J.; Beltran-Castañón, C.A. Computer vision grading system for physical quality evaluation of green coffee beans. In Proceedings of the 2016 XLII Latin American Computing Conference (CLEI), Valparaiso, Chile, 10–14 October 2016. [Google Scholar]
  32. Chanpaka, W.; Srisang, N.; Dangwilailux, P.; Chungcharoen, T. The Increase of efficiency in robusta green coffee bean size sorting machine by Response Surface Methodology. In Journal of Physics: Conference Series; IOP Publishing: Bristol, UK, 2020. [Google Scholar]
  33. Li, L.; Hu, R.; Li, L.; Yuan, Z.; Sun, S.; Jiang, X.; Gu, R.; Wang, J. Physical character-based grading of maize seeds. Seed Sci. Technol. 2019, 47, 281–299. [Google Scholar] [CrossRef]
  34. Chau, M.Q.; Nguyen, V.T. Effects of frequency and mass of eccentric balls on picking force of the coffee fruit for the as-fabricated harvesting machines. Int. J. Adv. Sci. Eng. Inf. Technol. 2019, 9, 1039–1045. [Google Scholar] [CrossRef] [Green Version]
  35. Kumar, V.; Rajak, D.; Kumar, R.; Kumar, V.; Sharma, P.D. Design and development of low-cost makhana grading and roasting machine. Int. J. Food Eng. 2014, 10, 357–366. [Google Scholar] [CrossRef]
  36. Ansar, S.; Abdullah, S.H.; Safitri, E. Physical and chemical properties of mixture fuels (MF) between palm sap (arenga pinnata merr) bioethanol and premium. ACS Omega 2020, 75, 1–9. [Google Scholar]
  37. Mofolasayo, A.; Adewumi, B.; Ajisegiri, E.; Agboola, A. Review of the aerodynamics and particle dynamics for coffee separation. LAUTECH J. Eng. Technol. 2018, 12, 16–20. [Google Scholar]
  38. Olukunle, O.J.; Akinnuli, B.O. Investigating some engineering properties of coffee seeds and beans. J. Emerg. Trends Eng. Appl. Sci. 2012, 3, 743–747. [Google Scholar]
  39. Qian, J.; Li, J.; Sun, F.; Xiong, J.; Zhang, F.; Lin, X. An analytical model to optimize rotation speed and travel speed of friction stir welding for defect-free joints. Scr. Mater. 2013, 68, 175–178. [Google Scholar] [CrossRef]
  40. Konstantinos, S.; Peter, B. Energy efficient manufacturing from machine tools to manufacturing system. Procedia CIRP 2013, 7, 634–639. [Google Scholar]
  41. Zhou, L.; Li, J.; Li, F.; Meng, Q.; Li, J.; Xu, X. Energy consumption model and energy efficiency of machine tools: A comprehensive literature review. J. Clean. Prod. 2016, 112, 3721–3734. [Google Scholar] [CrossRef]
  42. Li, L.; Yan, J.H.; Xing, Z.W. Energy requirements evaluation of milling machines based on thermal equilibrium and empirical modeling. J. Clean. Prod. 2013, 52, 113–121. [Google Scholar] [CrossRef]
  43. Ma, J.; Ge, X.; Chang, S.I.; Lei, S. Assessment of cutting energy consumption and energy efficiency in machining of 4140 steel. Int. J. Adv. Manuf. Technol. 2014, 74, 1701–1708. [Google Scholar] [CrossRef]
  44. Quadriguasi, J.; Walther, G.; Bloemhof, J.; van Nunen, J.E.; Spengler, J. A methodology for assessing eco-efficiency in logistics networks. Eur. J. Oper. Res. 2009, 193, 670–682. [Google Scholar]
Figure 1. Design layout (A) and (B) beans coffee classifier.
Processes 09 01462 g001
Figure 2. Relationship between the sifting angle and the rotational speed of the driving force on the classifier working capacity.
Processes 09 01462 g002
Figure 3. Distribution of retained coffee beans in each sieve unit.
Processes 09 01462 g003
Figure 4. Distribution of coffee beans that pass through the first sieve.
Processes 09 01462 g004
Figure 5. Distribution of coffee beans that pass through the second sieve.
Processes 09 01462 g005
Figure 6. Distribution of coffee beans that pass the third sieve.
Processes 09 01462 g006
Table 1. The linear regression equation of the relationship between the rotational speed of the driving force and the sieve angle of the classifier working capacity.
No.Sieve AngleLinear Regression Equationthe Coefficient of
Determination (R2)
110°y = 6.6235x + 14.6930.9432
213°y = 6.8885x + 15.7830.9721
316°y = 6.1985x + 18.9390.9593
Notes: y = classifier capacity (kg/h) and x = the rotation speed of the driving force (rpm).
Publisher’s Note: MDPI stays neutral with regard to jurisdictional claims in published maps and institutional affiliations.

