Article

Optimum Design of N Continuous Stirred-Tank Bioreactors in Series for Fermentation Processes Based on Simultaneous Substrate and Product Inhibition

by
Ibrahim M. Abu Reesh
Department of Chemical Engineering, College of Engineering, Qatar University, Doha P.O. Box 2713, Qatar
Processes 2021, 9(8), 1419; https://doi.org/10.3390/pr9081419
Submission received: 14 June 2021 / Revised: 12 August 2021 / Accepted: 13 August 2021 / Published: 16 August 2021
(This article belongs to the Special Issue Modelling and Optimal Design of Complex Biological Systems)

Abstract

:
Optimization of the continuous fermentation process is important for increasing efficiency and decreasing cost, especially for complicated biochemical processes described by substrate and product inhibition. The optimum design (minimum volume) of CSTRs in series assuming substrate and product inhibition was determined in this study. The effect of operating parameters on the optimum design was investigated. The optimum substrate concentration in the feed to the first reactor was determined for N reactors in series. The nonlinear, constrained optimization problem was solved using the MATLAB function “fmincon”. It was found that the optimum design is more beneficial at high substrate conversion and at a medium level of feed substrate concentration. The best number of reactors is two to three for optimum arrangements and two for equal-size arrangements. The presence of biomass in the feed to the first reactor reduces the reactor volume, while the presence of product in the feed slightly increases the required total volume. The percentage reduction in the total volume using the optimum design compared to equal-volume design (R%) was determined as a function of substrate conversion and substrate concentration in the feed to the first reactor. The obtained R% values agree with experimental data available in the literature for ethanol fermentation.

1. Introduction

In recent years, many studies have used simultaneous substrate and product inhibition kinetics to describe the dependence of microbial specific growth rate on substrate and product concentration. Many fermentation processes, such as ethanol fermentation, have been described by this kinetics. Nguyen et al. [1] used substrate and product inhibition kinetics to describe continuous vacuum fermentation of glucose to ethanol with separation. Substrate and product inhibition were also reported for ethanol fermentation by yeast [2,3] and bacteria [4]. Zhang et al. [5] studied the effect of substrate and product concentration level in batch ethanol fermentation of glucose using yeast. Inhibition is critical for glucose concentration above 169 g/L and ethanol concentration of 53 g/L. Other mathematical models were developed to describe alcohol production from different substrates such as glucose using yeast [6] and from glycerol [7]; these models describe the inhibition effect on the fermentation process. In addition, Zentou et al. [6] developed a mathematical model to describe inhibition of byproduct from batch alcohol yeast fermentation. Sunarno et al. [7] developed a mathematical model for ethanol production from glycerol. The model is based on Monod kinetics with inhibition terms. Lactic acid fermentation is another process that can be described by substrate and product inhibition kinetics. A kinetics model was developed for lactic acid fermentation from sago starch using Lactococcus IO-1 [8]. Modeling of lactic acid production that considers the effect of substrate and product concentration was proposed for glucose [9] and kodo millet bran residue hydrolysate as substrate [10]. Moeller et al. [11] studied the citric acid production process concerning growth temperature, pH and substrate and product inhibition. High concentrations of citric acid and glucose reduced citric acid production. Succinic acid fermentation is another process that can be described by substrate and product inhibition kinetics. Kinetic models were developed for the production of succinic acid by Actinobacillus succinogenes using glucose [12,13] and glycerol [14] as substrates. The models take into account the effect of substrate and product concentrations on the fermentation process. Van Niel et al. [15] analyzed the substrate and product inhibition kinetics of hydrogen production using thermophilic bacteria grown on sucrose. Chen et al. [16] analyzed various inhibitory factors for hydrogen production by dark fermentation. Inhibitor types and concentrations were determined. Finally, for enzymatic reactions, Lopez et al. [17] proposed various kinetic models for hydrolysis of sucrose by invertase. Mukesh et al. [18] studied modeling of lipase-catalyzed transesterification of substituted ethanol with ethyl acetate reactions. The reversible reaction is modeled mathematically with a substrate product inhibition model.
Most of the above kinetic equations used in the literature include substrate limitation, substrate inhibition and product inhibition terms. At low substrate concentration, increasing the substrate concentration increases the specific growth rate, while at high substrate concentration, the cell growth rate is reduced due to substrate inhibition. In addition to that, the accumulation of the product reduces the specific growth rate. At the critical product concentration (Pm), cells do not grow. The degree of substrate inhibition depends on the inhibition constant (Ki). The degree of product inhibition depends on the critical concentration of the product (Pm). A high Pm value means that cells can tolerate a high concentration of product in the reactor. If the cells are subjected to both substrate and product inhibition, cell growth will be reduced significantly, which will have a negative effect on the substrate conversion and product formation, and ultimately a larger reactor volume will be needed. CSTRs in series are commonly used in the food industry and in the biological treatment of wastewater (e.g., activated sludge basins that are cascade-connected). This arrangement of reactors offers a number of advantages for the degradation of organic wastewater such as increased stability for the treatment plant and reduced effect of substrate and product inhibition. When using CSTR bioreactors in series, there is a potential to use different controlled nutrient conditions along the reactor cascade, and high efficiency can be achieved with multistage bioreactors (approach plug flow reactor) for kinetic equations with order above zero [19].
The most important fermentation process that can be described by substrate and product inhibition kinetics is ethanol production. This process gained interest in recent years because of environmental and economic reasons as a renewable source of energy with high octane number. The price of ethanol should be low to compete with gasoline. One approach to reduce the cost of ethanol is to optimize the fermentation process, in other words, to select the reactor configuration that gives the lowest volume or residence time needed to achieve a certain degree of substrate conversion. Selection of the reactor type is very important to reduce inhibition. For example, using a single CSTR is favorable in the case of substrate inhibition. Using a cascade of bioreactors in series is not recommended for substrate inhibition [20]. The reactors-in-series configuration is more favorable than one mixed reactor in case of product inhibition [20]. In the ethanol industry, mixed reactors in series are widely used to reduce the product (ethanol) inhibition effect. This system can be improved by using cell recycling where membrane filtration can be used to separate part of the biomass and send it to the reactor for more conversion. Another improvement can be achieved by using multistage bioreactors that reduce the inhibitory effect of substrate and product and increase the productivity [21]. Ghose and Tyagi [2] showed that the volume required to achieve the same ethanol productivity is 58% less for two equal-size fermenters in series compared to one reactor. Using experimental data, Wall and Hill [22] confirmed the optimal design predictions for substrate (sugar), biomass and the product (ethanol) for each of the three unequal-size bioreactors in series used. Kalogeris et al. [23] successfully used two CSTRs in series for biodegradation of the highly toxic chemical 1,3-DCP (200 mg/L); 68% substrate removal was achieved.
Nishiwaki and Dunn [24] numerically studied the performance of two-stage bioreactors with cell separation after each stage for the production of ethanol using different kinetic equations. The two-stage CSTR model gives higher productivity compared to a single chemostat with recycling. They showed that the volume of the two-CSTR fermenter is 25% less than that of one chemostat. In another study, Nishiwaki and Dunn [25] showed that two-stage CSTRs with recycling in each reactor gives higher productivity than a two-stage fermenter with a single separator after the final stage. Harmand et al. [26] optimized two interconnected continuous stirred bioreactors in series with biomass recycling and input flow distribution among the reactors. The three types of kinetic models of Monod, Haldane and Aiba were used in the optimization study. All three kinetics satisfied the optimal solution hypothesis suggested by the authors. Bayrock and Ingledew [27] experimentally compared ethanol production by yeast in a batch reactor, a single CSTR and a multistage CSTR system (five equal-size reactors with the same total volume as a single CSTR). The highest ethanol productivity was achieved in multistage CSTRs, where the productivity was 4-fold higher as compared to single CSTR or batch reactor. High ethanol productivity in multistage CSTRs can be attributed to the following:
  • The cells generated in the first few reactors will continue to metabolize and produce ethanol in the latter reactors.
  • In multistage CSTRs, cells are exposed to suitable growth conditions in the first few reactors (low product concentration and high substrate concentration) compared to a single CSTR where high inhibitory product concentration and low substrate concentration are present.
  • In multistage CSTRs, inhibitory product concentration increases gradually from one reactor to the other, while in single CSTR, a high concentration of inhibitory product is present from the beginning (i.e., reactors in series reduces the effect of product inhibition). Recently, Wang et al. [21] experimentally evaluated two CSTRs in series with cell recycling after each reactor for the production of ethanol. This system was found to be effective in ethanol production because of the high cell concentration (cell recycling) and due to a certain degree of relief in substrate and ethanol inhibition.
Many fermentation processes are carried out in CSTRs in series that are usually equal in size. A number of investigators have studied the optimum design (not necessarily equal volume) of CSTRs in series with different cell growth and enzyme kinetics [20,22,28,29]. Previous studies reported the effect of either substrate or product inhibition on the optimum design of multistage bioreactors in series. The effect of simultaneous substrate and product inhibition on the optimum design of this system has been rarely reported in the literature. The objective of this work is to compare the performance of the optimum design of CSTRs in series based on substrate and product inhibition kinetics with equal-volume design; i.e., the objective is to determine the operating conditions at which the optimum design is more beneficial (smaller volume) compared to equal-volume reactors, which is the current practice in industry. The effects of biomass and product concentration in the feed to the first reactor and substrate conversion and concentration in the feed to the first reactor on the optimum design were determined.

2. Methodology

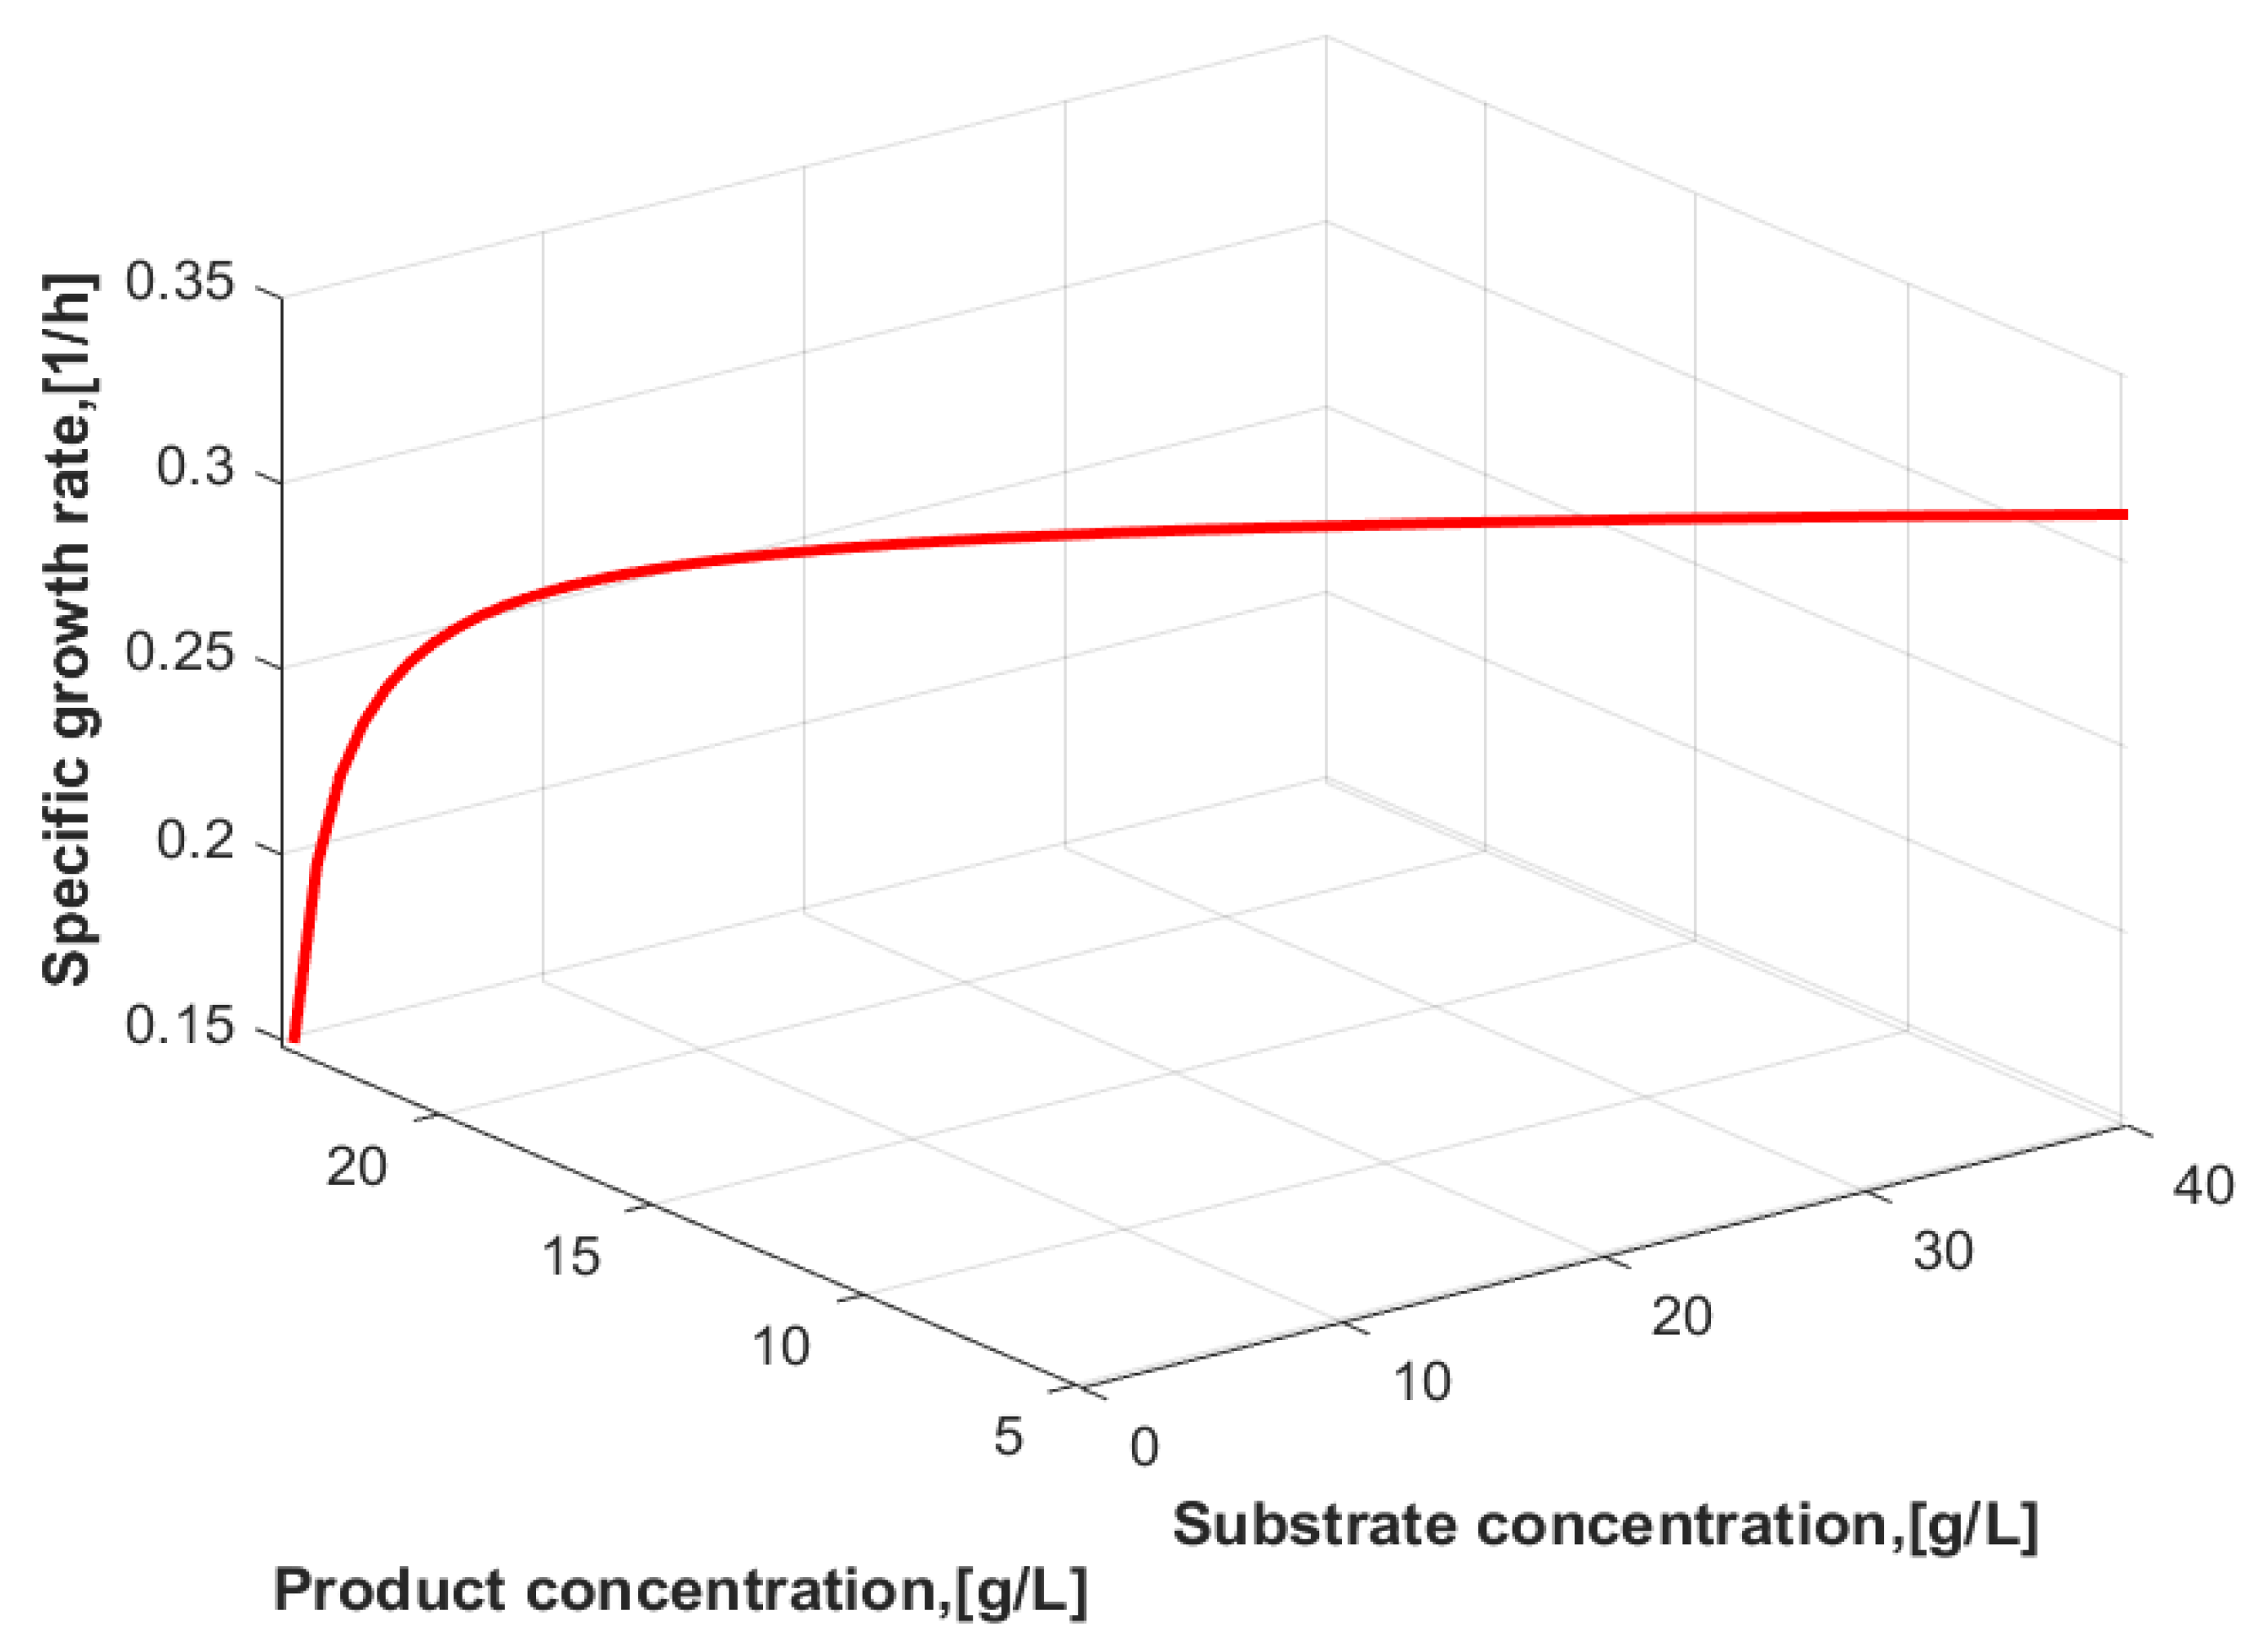
2.1. Kinetic Equation with Substrate and Product Inhibition

The following kinetic equation (Equation (1)) is used in this optimization study. The equation represents substrate limitation, substrate inhibition and linear product inhibition. Many fermentation processes have been described by this kinetics, such as the production of ethanol [1,2,3], lactic acid [8] and succinic acid [13]. Substrate and product inhibition slow the conversion of the substrate and increase the reactor volume required to achieve a certain substrate conversion or product formation.
      μ = μ m a x S K S + S + S 2 K i   1 P P m
where μ is the specific growth rate (h−1), μ m a x is the maximum specific growth rate (h−1), K S is the Monod constant (g/L), K i is the substrate inhibition constant (g/L), S is the substrate concentration (g/L), P is the product concentration (g/L), P m is the maximum product concentration (g/L) and X is the cell (biomass) concentration (g/L). The above kinetic model also describes the Monod equation ( K i = ∞, P m   = ∞), Haldane’s equation ( P m = ∞) and linear product inhibition. Figure 1 shows a 3D line plot of the specific growth rate (µ) as a function of the substrate and product concentrations. At low substrate concentration, there is no inhibition, while at high substrate or product concentration, the specific growth rate is reduced because of inhibition.

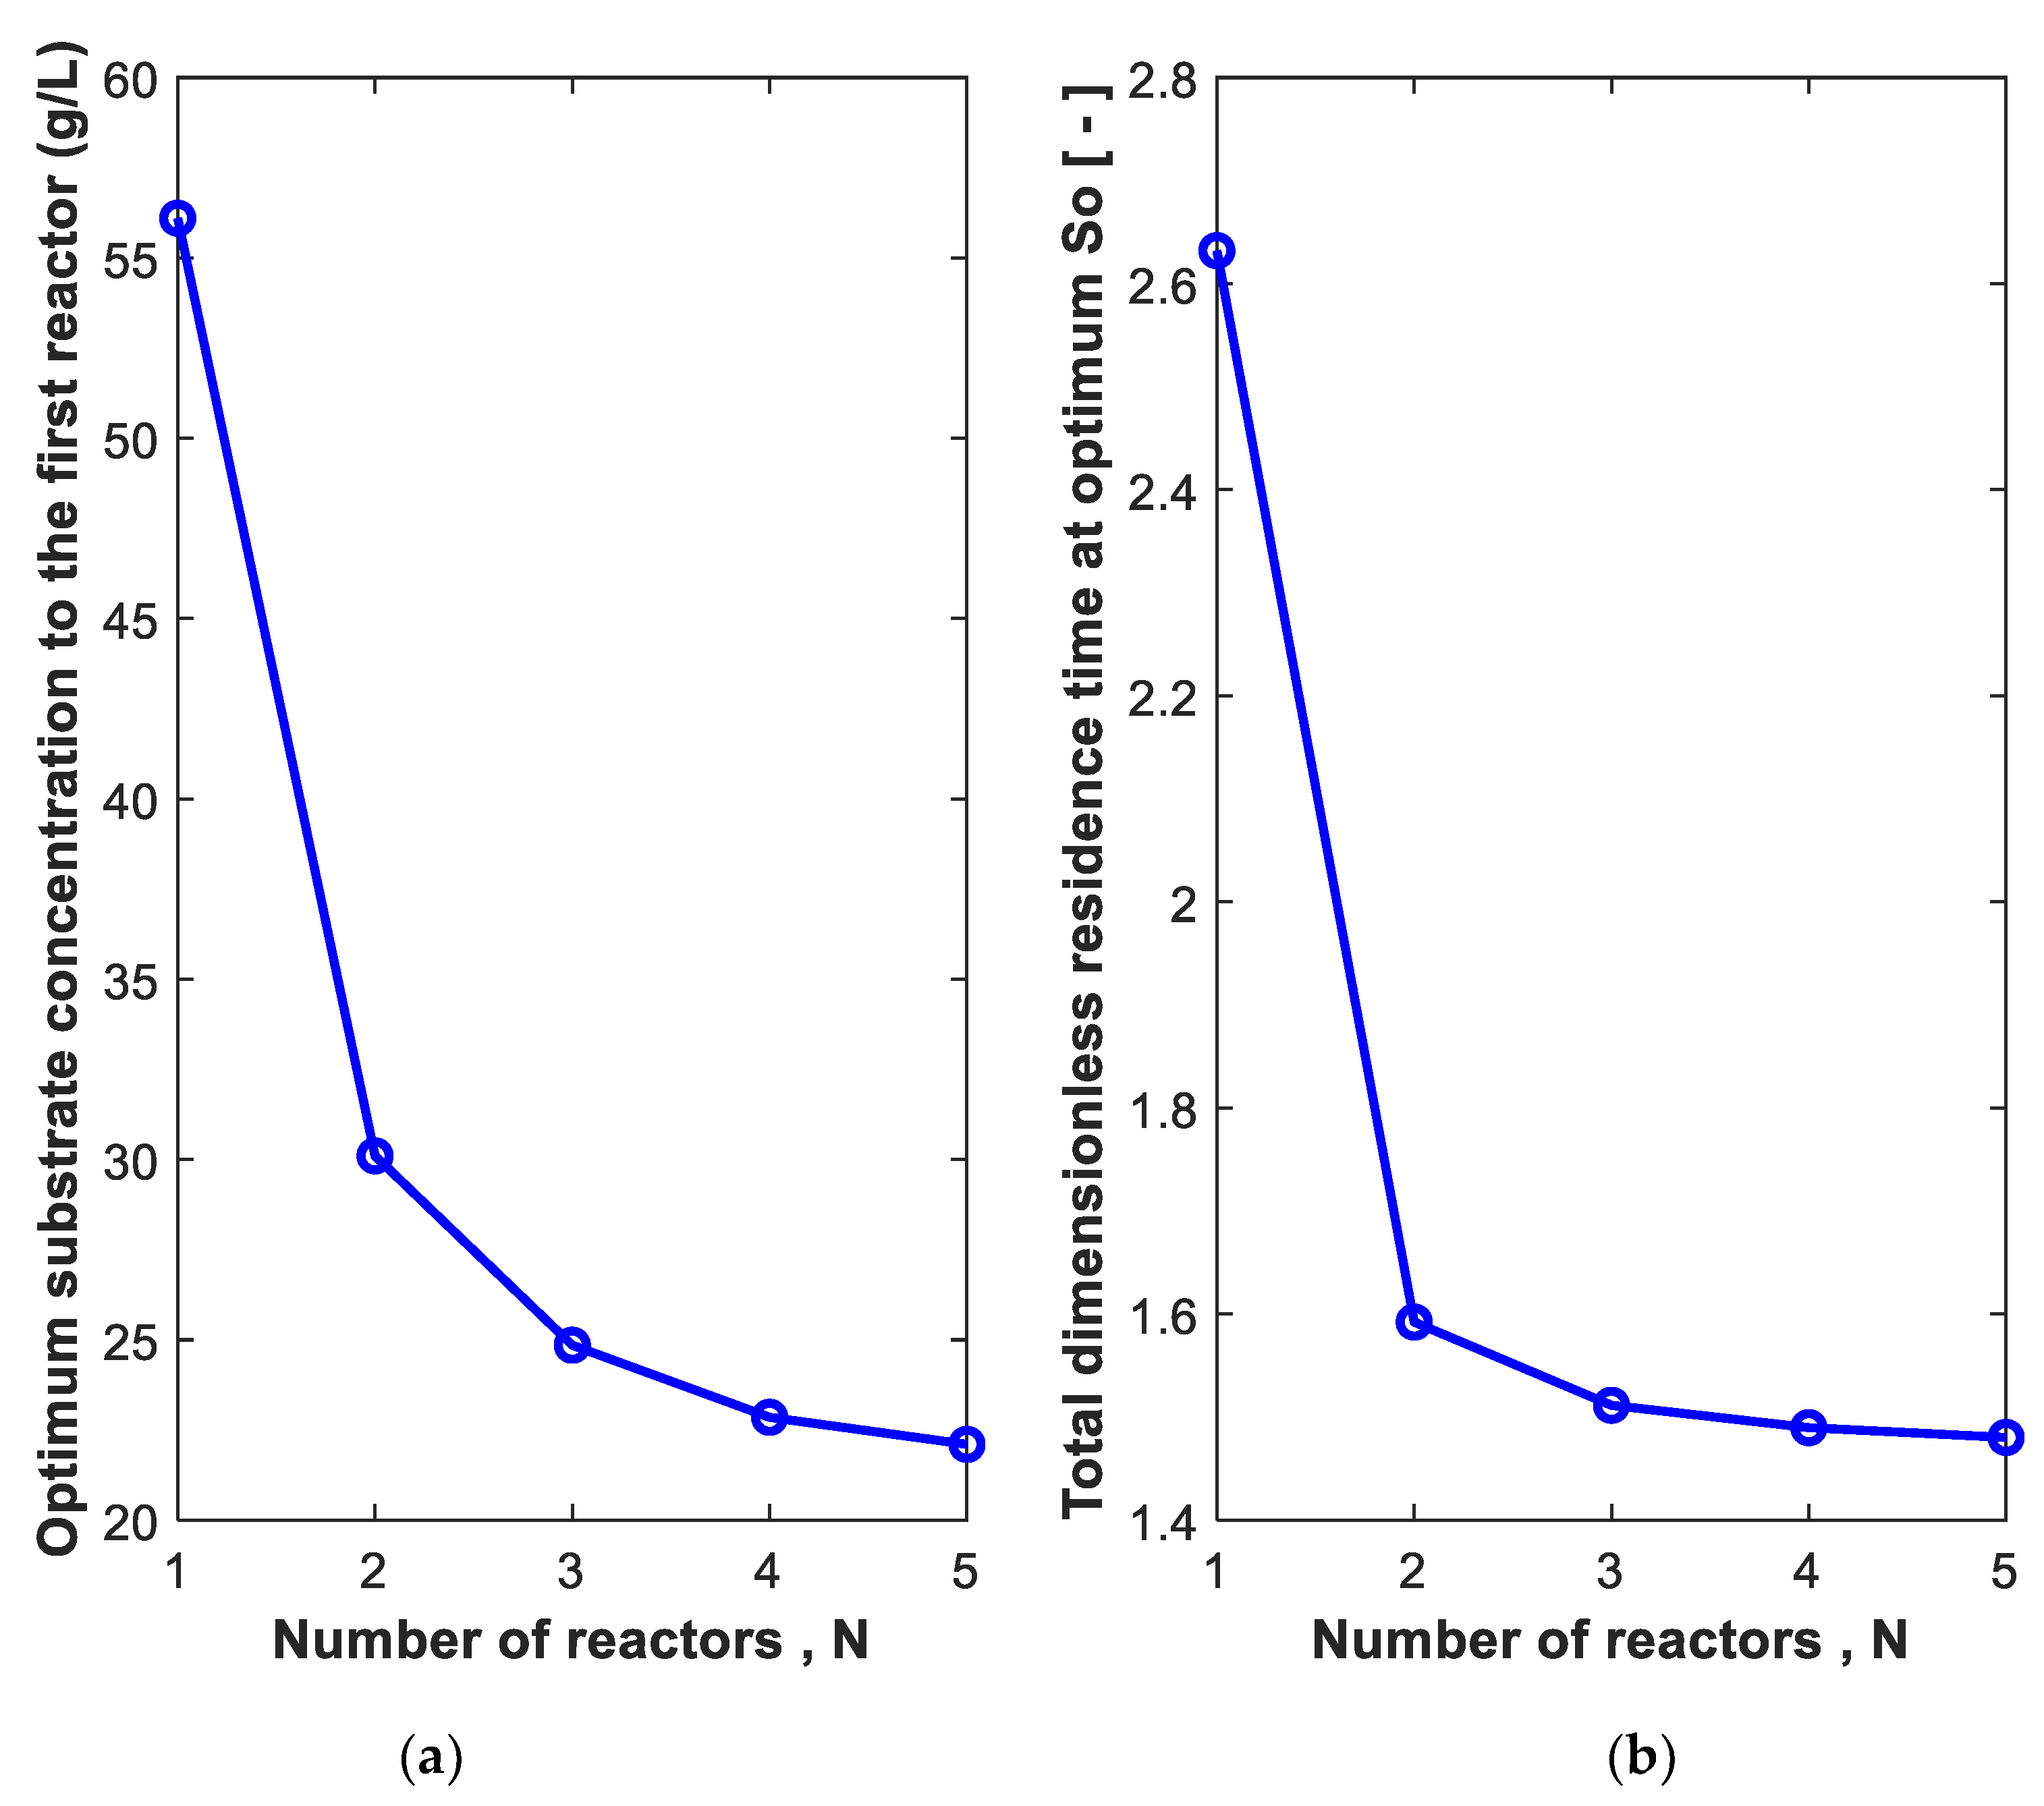
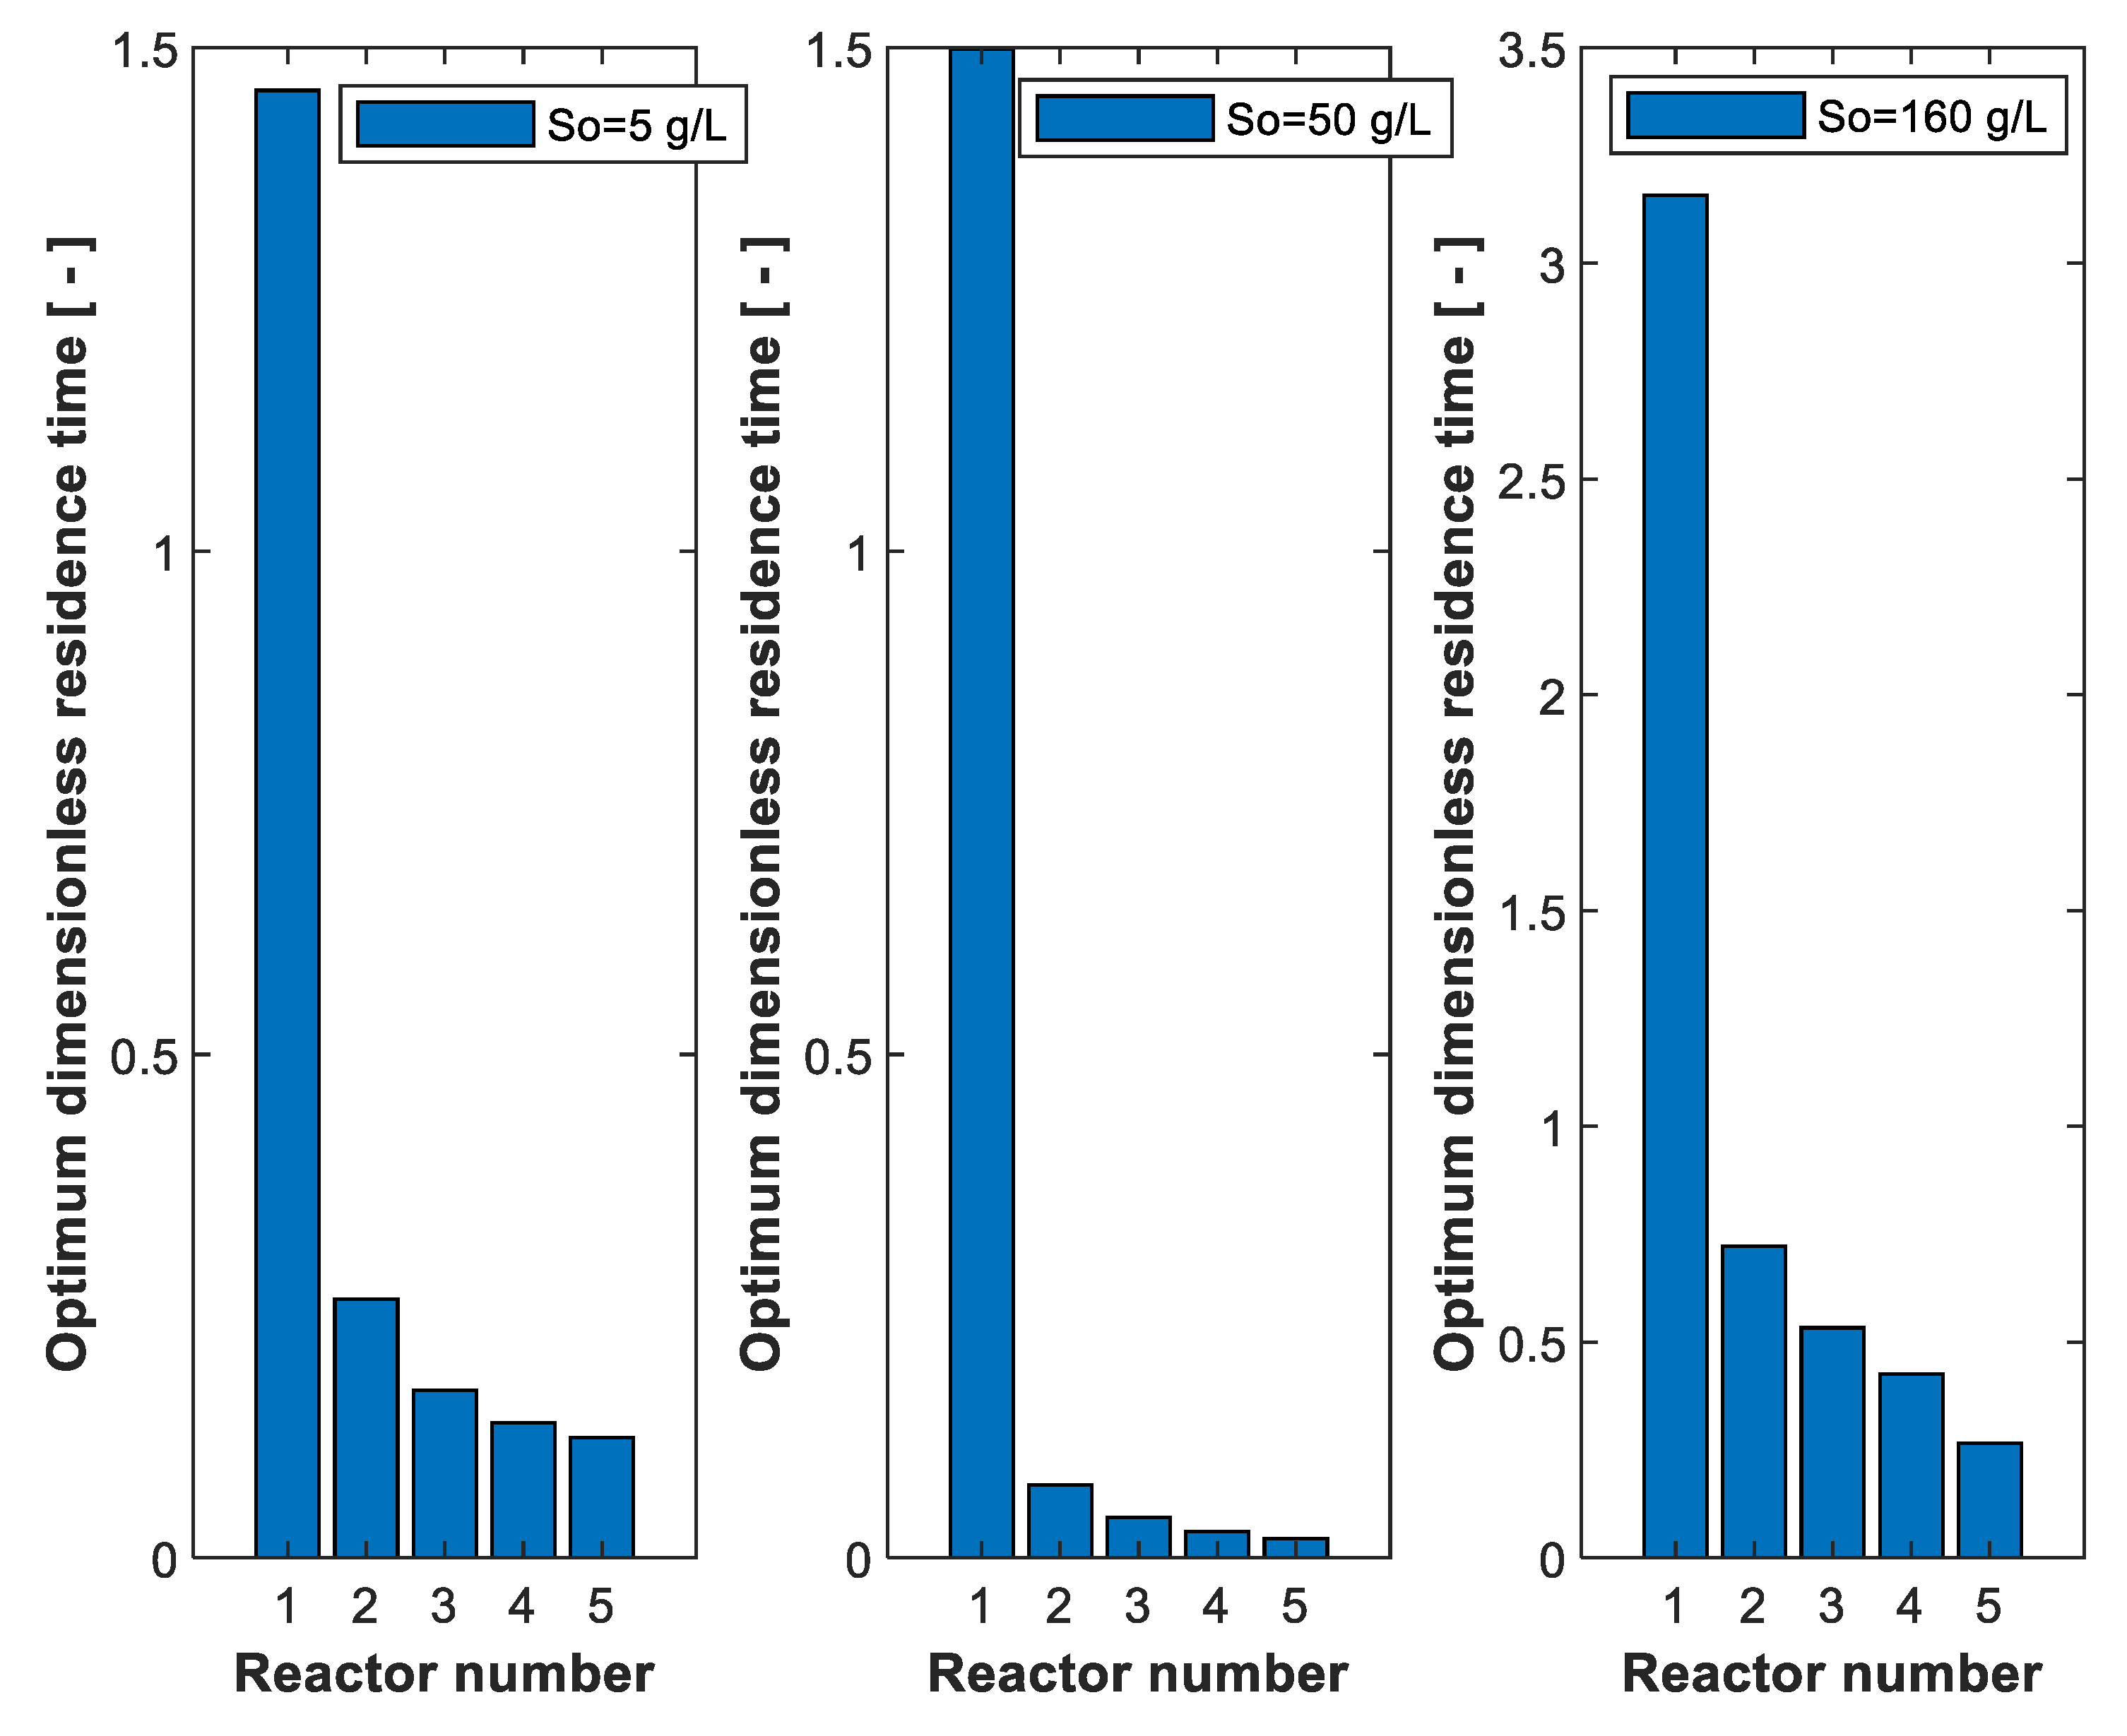
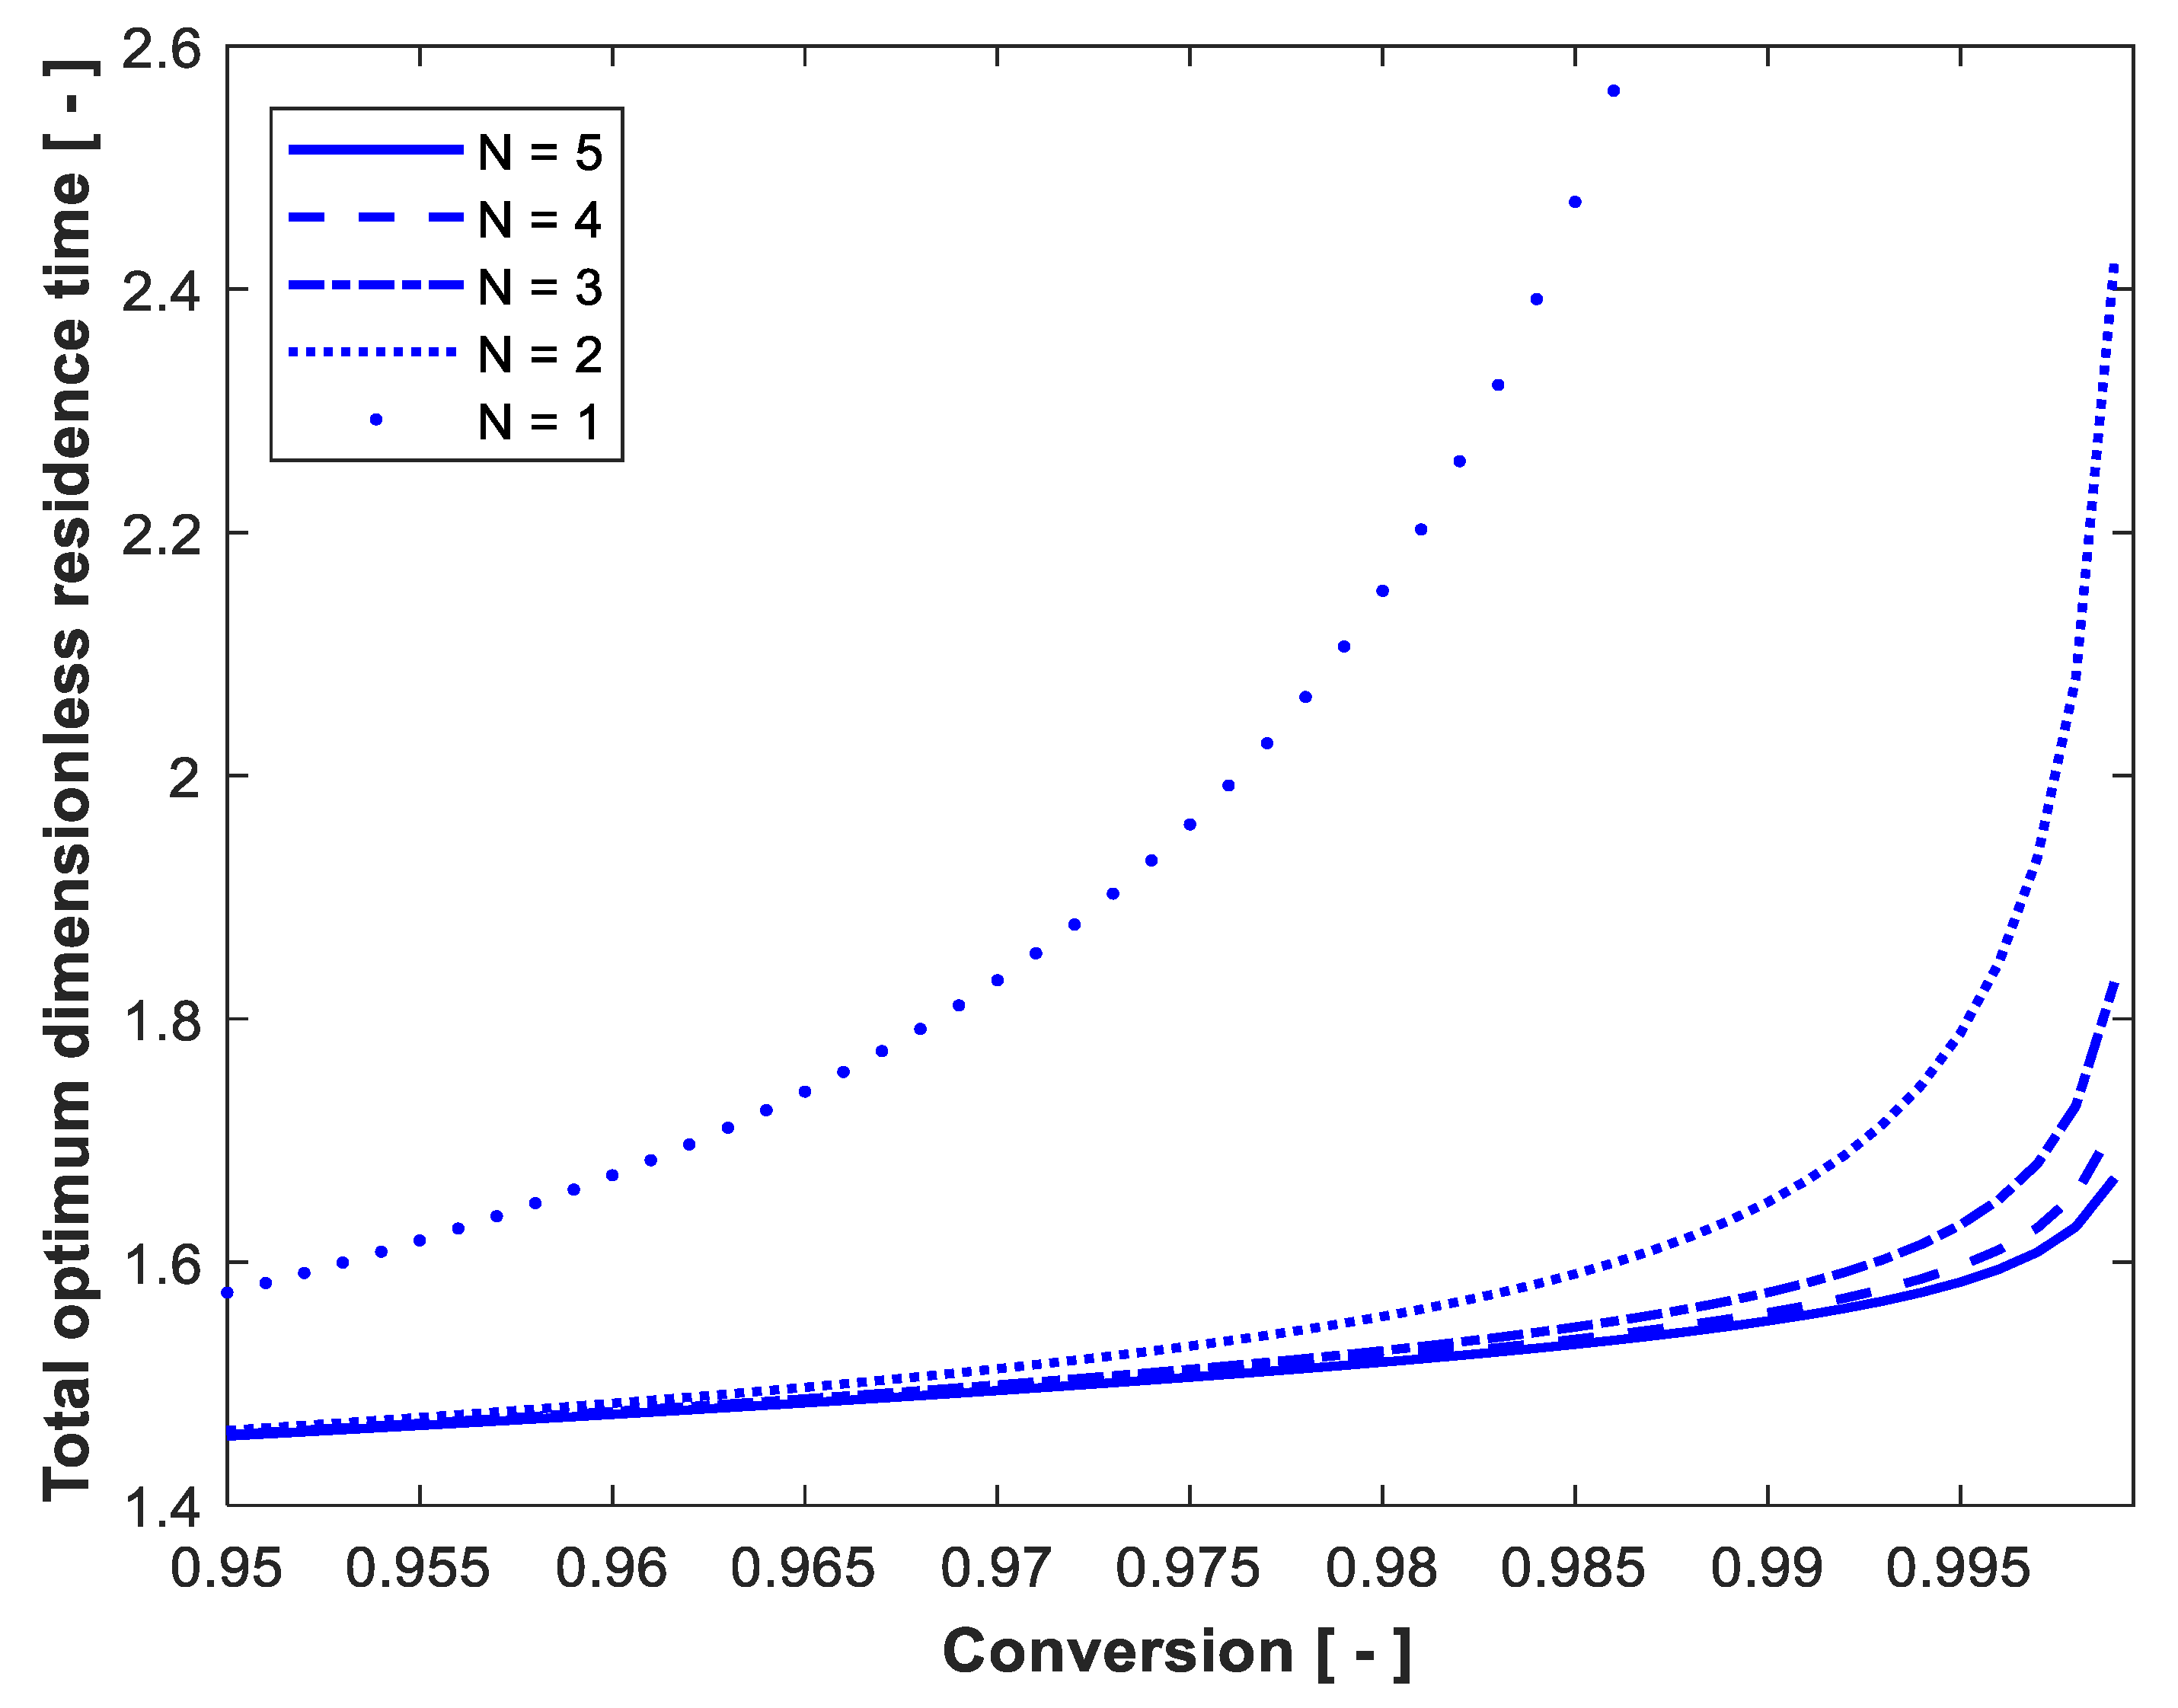
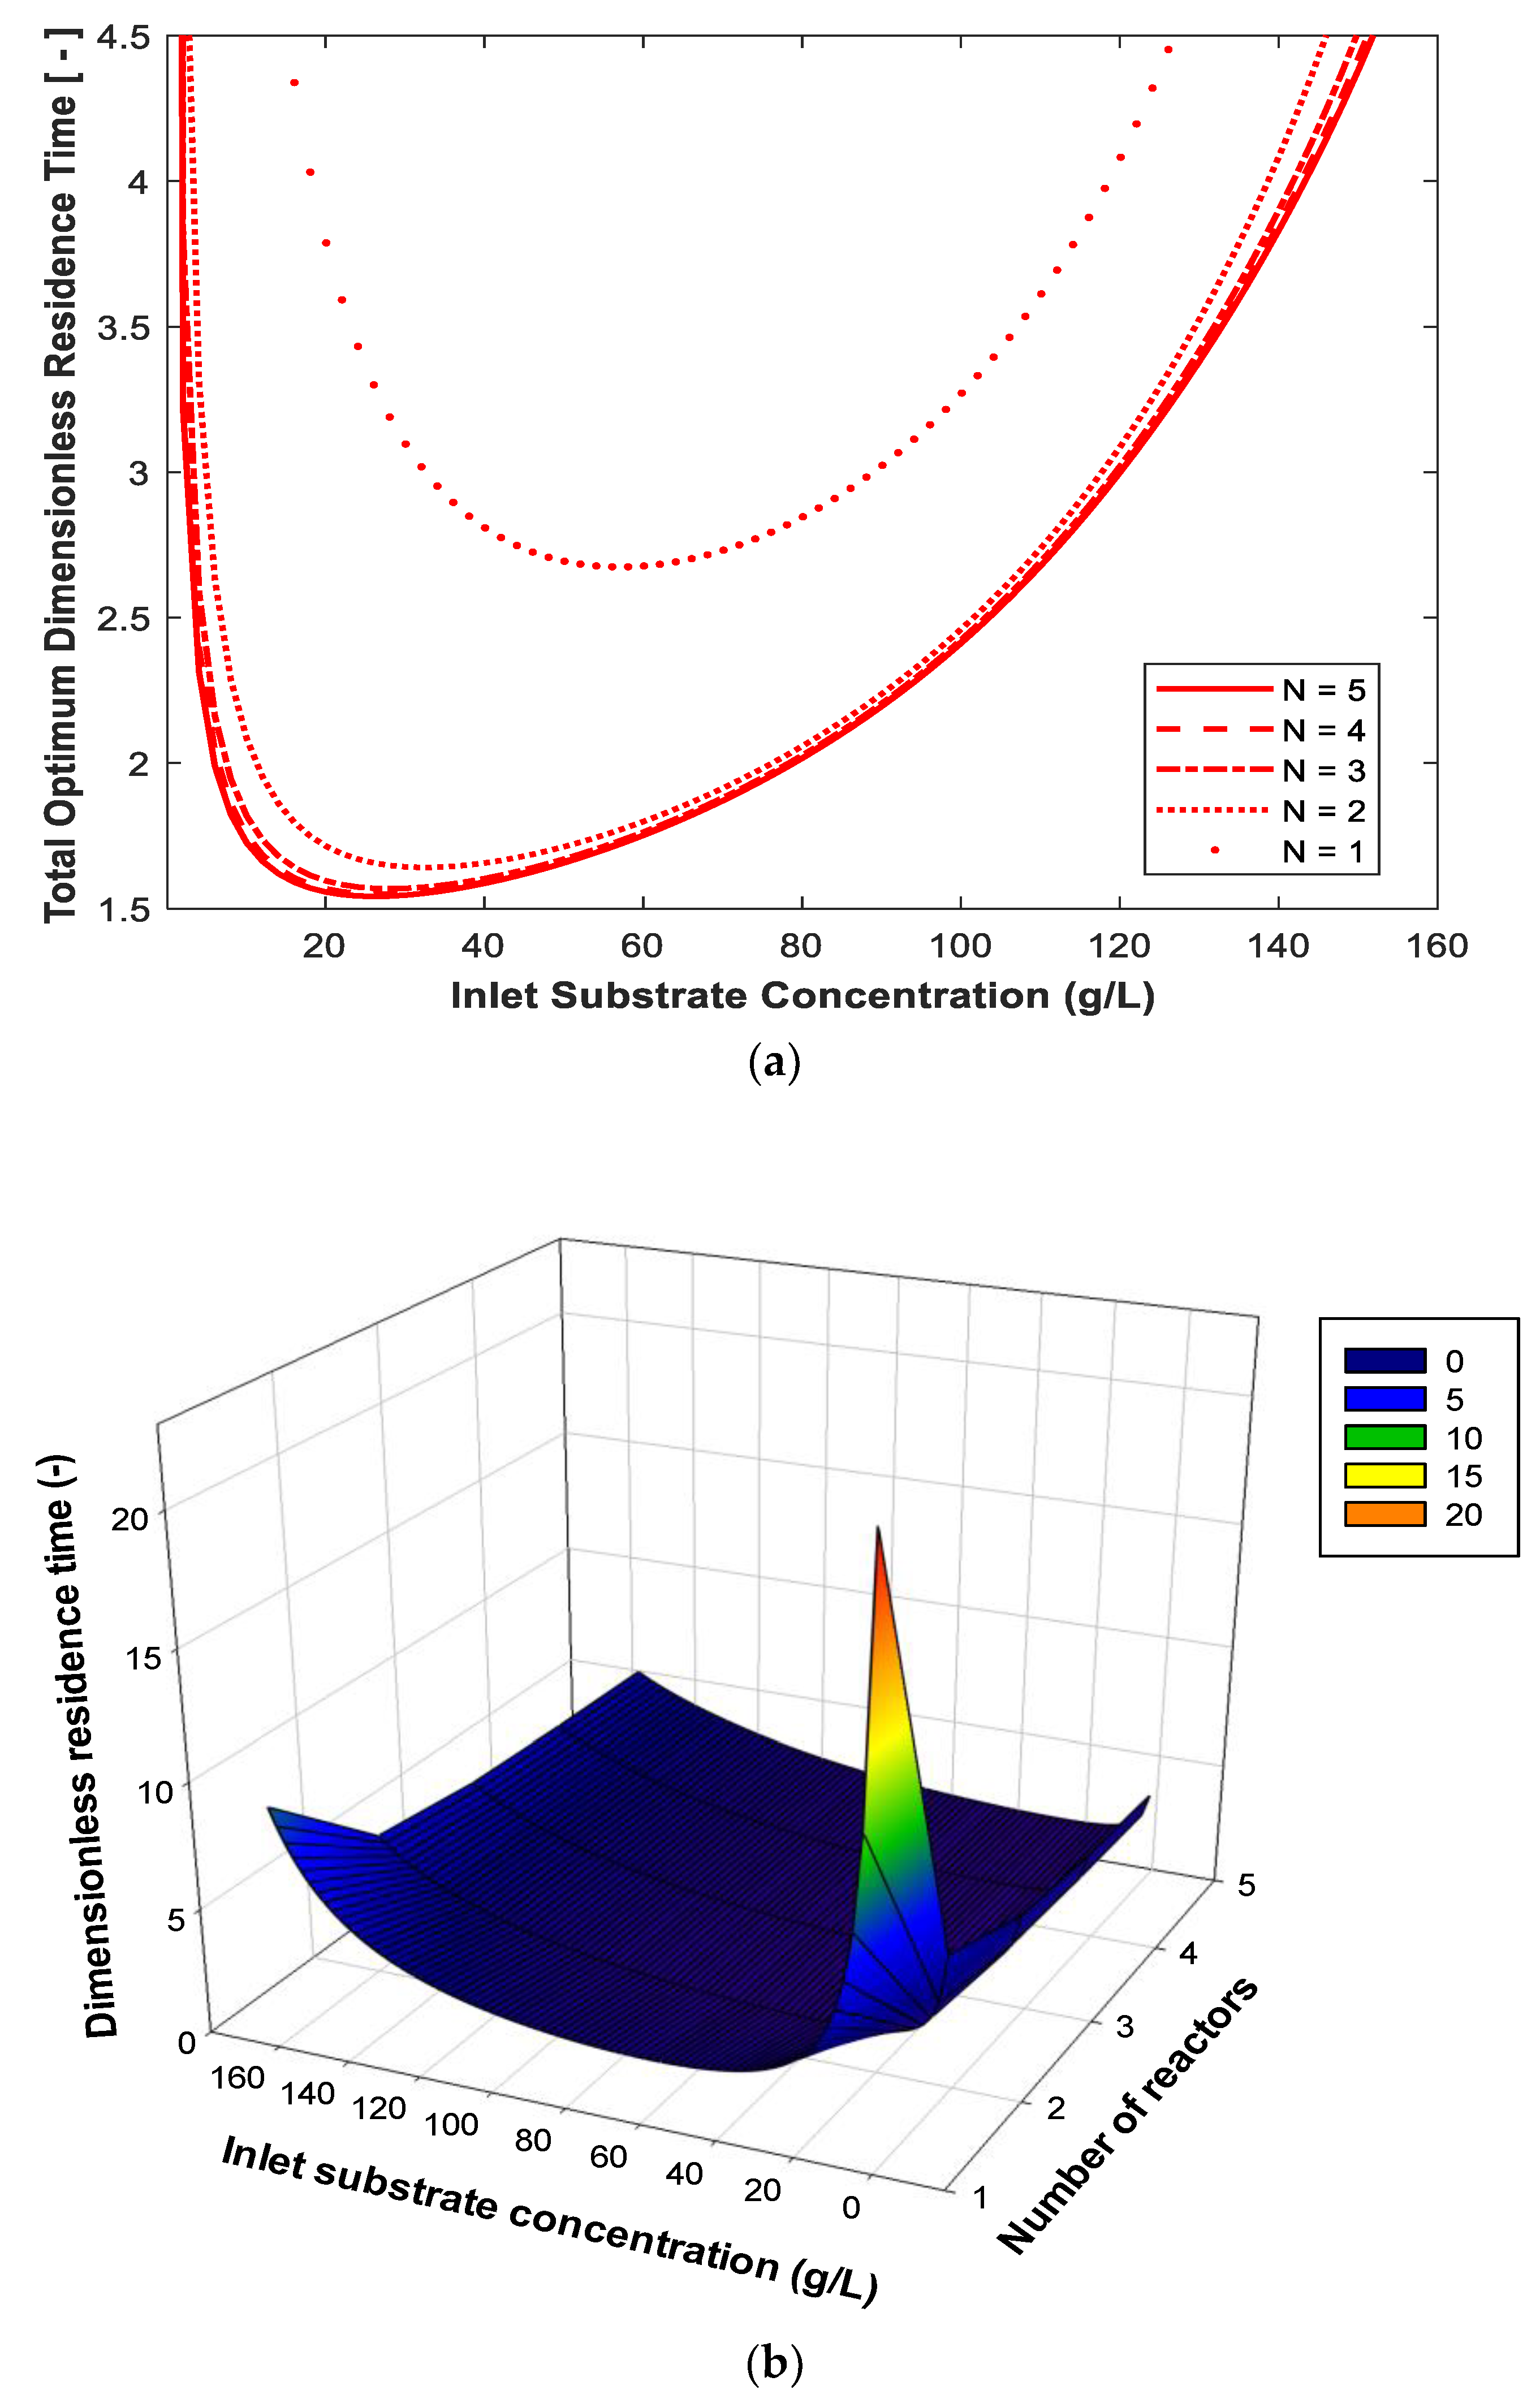
2.2. Continuous Stirred-Tank Reactors in Series with Total Minimum Volume

It is assumed that S o and X o are the substrate and cell concentrations in the feed to the first reactor. The exit stream from the first reactor is the feed to the second reactor and so on. The optimum design is defined as the minimum total reactor volume (residence time) required to achieve a certain degree of substrate conversion. Consider N CSTRs in series; substrate balance over the ith reactor at steady state gives the following:
  F S i 1 S i = 1 Y X   μ i   X i   V i                           i = 1 , 2 , N
where F is the volume flow rate (L/h).   V i is the volume of reactor i (L). The residence time is calculated by dividing the reactor volume by volume flow rate (τ = V / F ) .   Y X is the cell yield coefficient (g cell/g substrate). Cell concentration in the ith reactor can be related to the substrate concentration in the same reactor by the cell yield coefficient. The yield coefficients Y X and Y P are assumed constant.
X i = X o + Y X   S o S i  
    P i = P o + Y P   S o S i  
where S o is the substrate concentration in the feed to the first reactor (g substrate/L) and X o is the cell concentration in the feed to the first reactor (g cells/L). Substituting equations 1, 3 and 4 into 2, the dimensionless residence time in the reactor i is given by
θ i = K s s + α i + K i i   α i 2 α i B + C α i               i = 1 , 2 , N  
where α i = S i S o , K s s = K s S o , K i i =     S o K i , θ i = μ m a x   τ i , A = X o Y x   S o + 1 , B = P m P o Y p   S o P m and C = Y P   S o P m .
From definition α o = 1 , substrate conversion = 1 −   α N =     S o S N S o .
The total volume of N CSTRs connected in series is obtained by summing the volume of N reactors.
θ t o t , o p t = i = 1 N θ i                                             i = 1 , 2 , N  
The objective function of this optimization problem is to minimize the total dimensionless residence time (or volume) because flow rate is assumed constant. The numerical optimization was carried out using the MATLAB optimization function “fmincon” [30]. This function is used to optimize the basic parameters. The optimization model consists of objective function and constraints as given by the following:
  Minimize                                             θ t o t = i = 1 N θ i      
  Subject   to           θ i = α i 1 α i   A α i   K s s + α i + K i i   α i 2 α i B + C α i   i = 1 , 2 , N  
Constraints   α o > α 1 > > α N 1 > α N               i = 1 , 2 , N  
α o = 1   ,   α N = 1 δ
θ t o t = i = 1 N θ i 0                               i = 1 , 2 , N  
The “fmincon” function syntax command line is written in the following form:
[ a ,   fvalue ] = fmincon   ( @ objectfun ,   A o ,   A i n e q ,   B i n e q ,   [   ] ,   [   ] ,   lb ,   ub ,   @ confun ,   options )
where a is the vector of α values that minimize the function @objectfun, fvalue is the value of the objective function at the optimal α values, A o is a vector of initial guess of α values,   A i n e q   and B i n e q are inequality constraints, [ ] represents no constraints, lb and ub are lower and upper bound vectors of α , @objectfun is a function that accepts the input α and returns a scalar function fvalue determined at α , @confun is a function representing the inequality and equality constraints and options represents options about the way in which the algorithm looks for the minimum points. Knowing α N   and   α o ,   the intermediate dimensionless substrate concentrations that correspond to the optimum design can be calculated. Figure 2 shows the typical optimum configuration of five CSTRs connected in series showing reactor volume decrease with increasing reactor number.

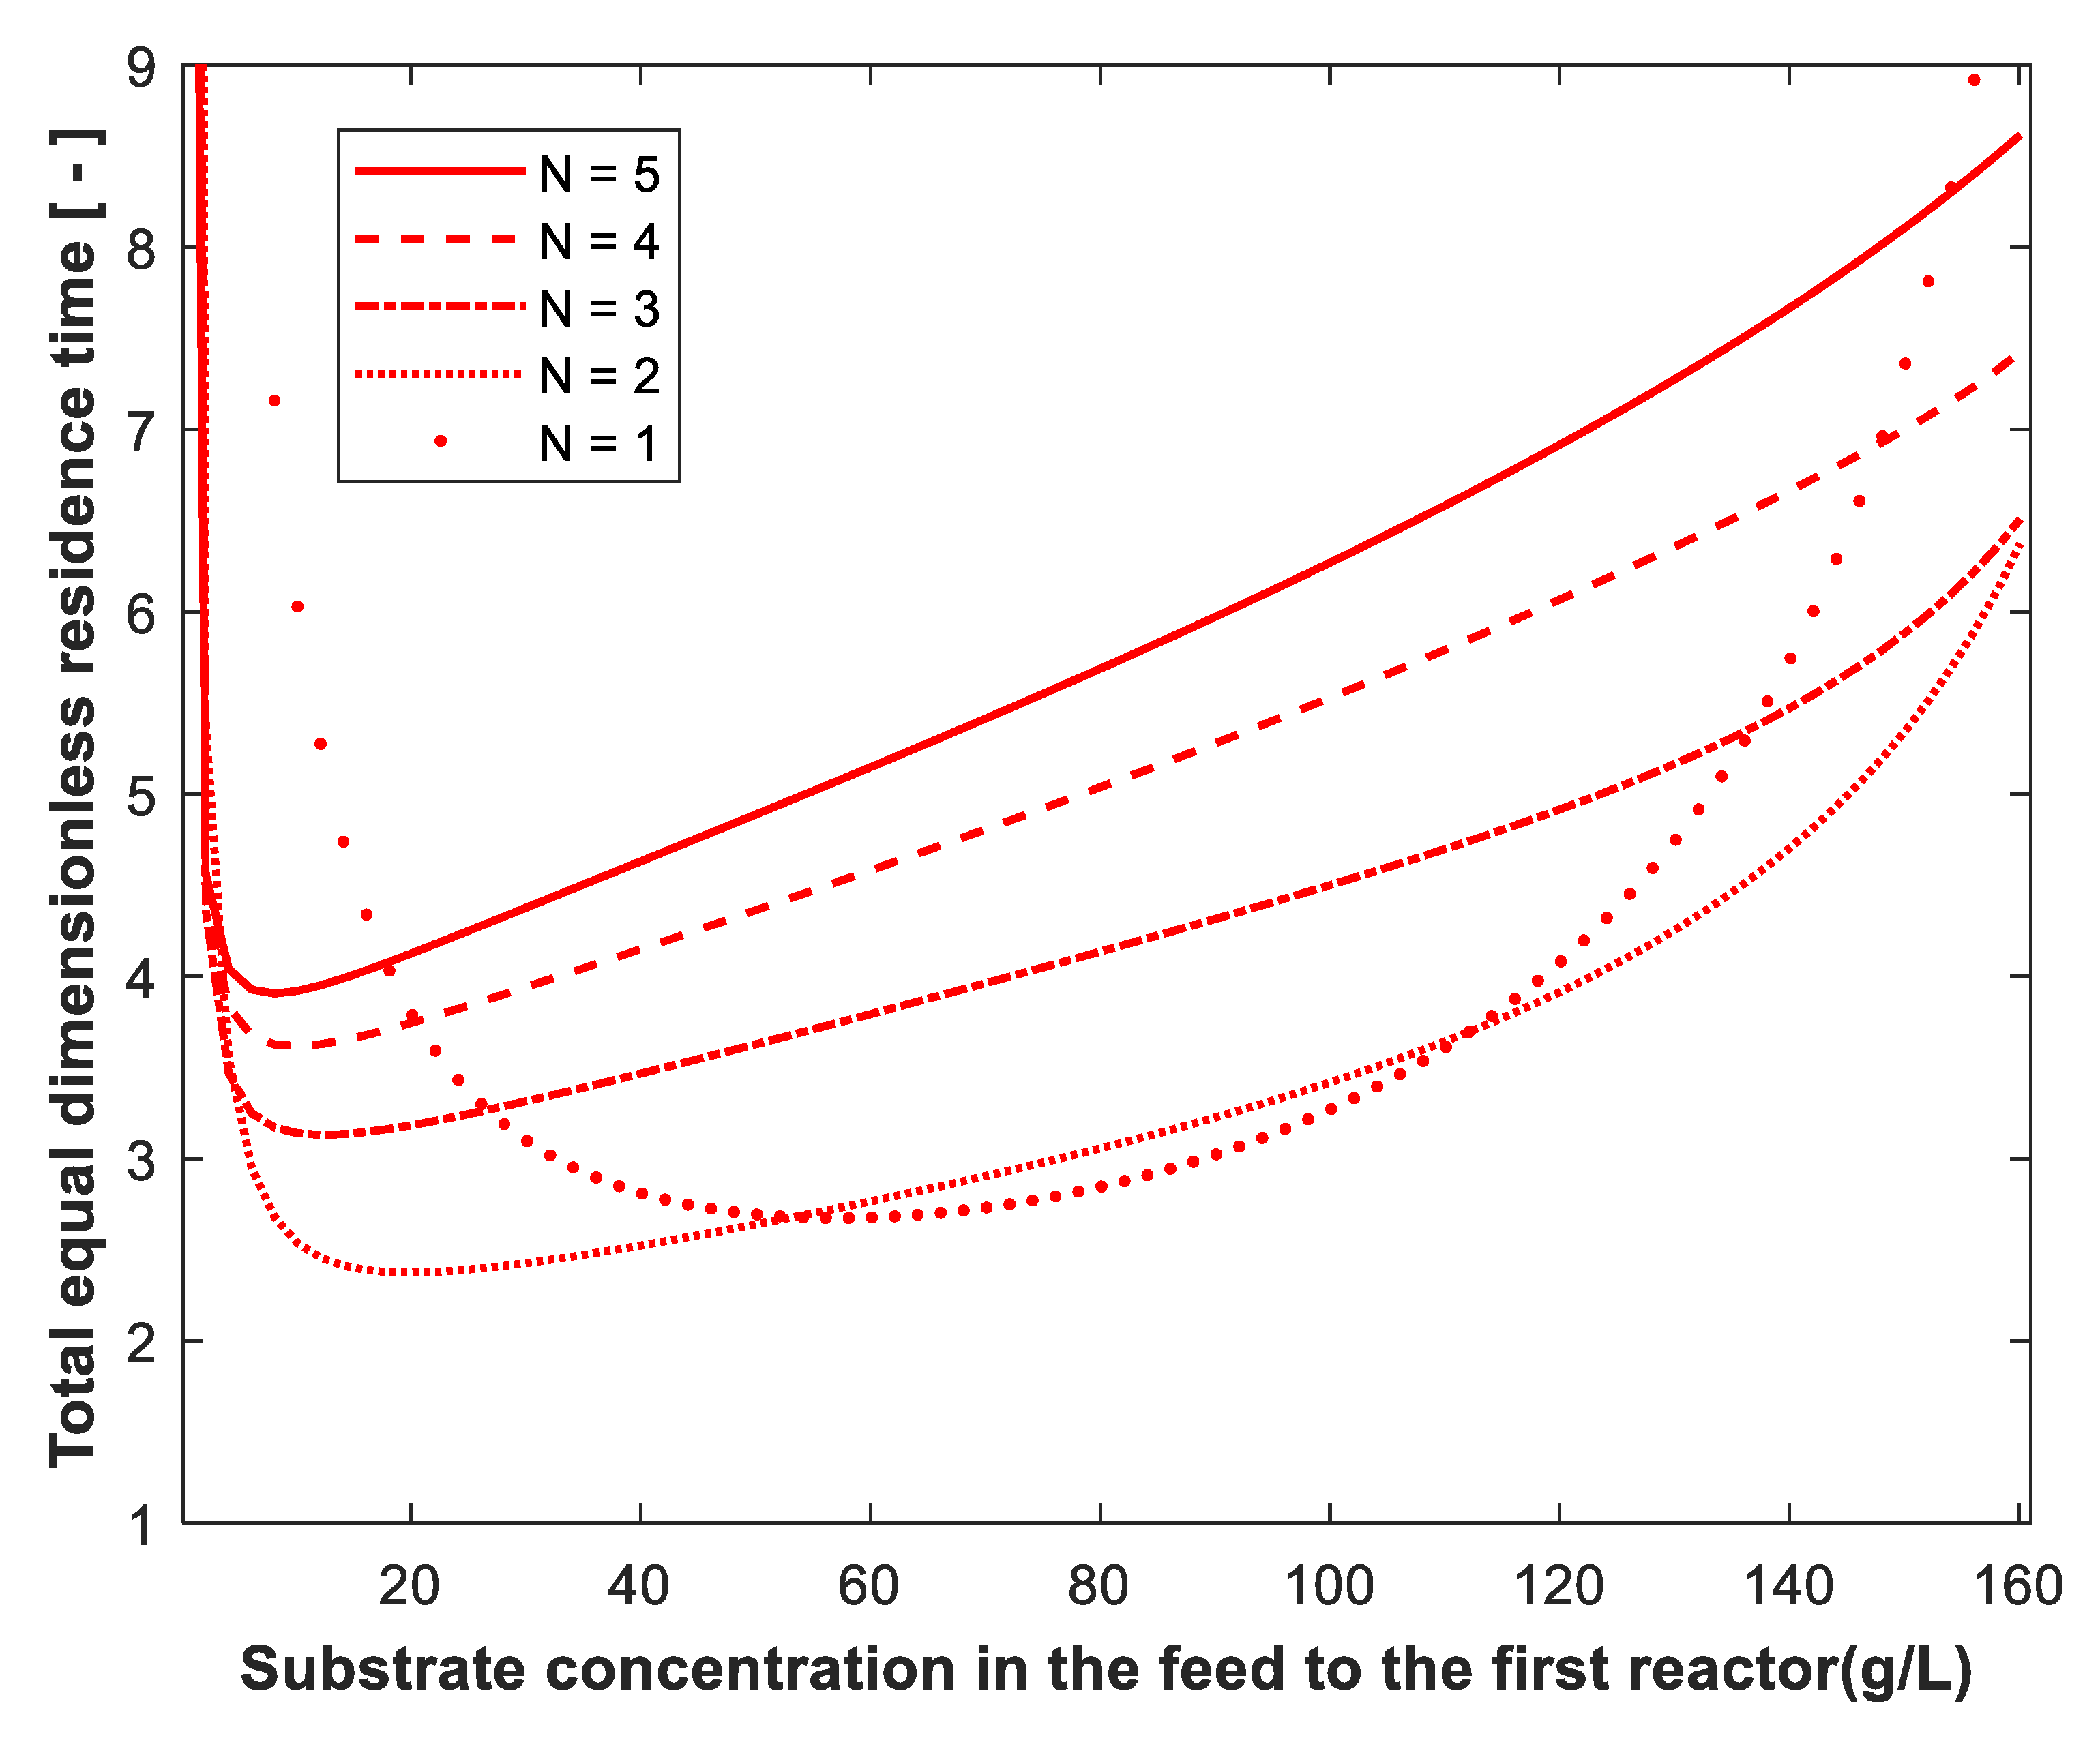
2.3. Continuous Stirred-Tank Reactors of Equal Size in Series

The volume of reactors of equal size was obtained and compared with the optimum reactor volume required to achieve the same degree of substrate conversion. Equation (5) is applied for reactors i and i + 1, equating θ i   and θ i + 1 . The intermediate substrate concentrations α i can be obtained as a function of α i + 1 and   α i 1 , which satisfies the conditions of equal-size reactors. The relation is given by
α i 1 = A α i A α i + 1 K s s + α i + 1 + K i i   α i + 1 2 K s s + α i + K i i   α i 2 α i α i + 1 B + C   α i B + C   α i + 1 α i α i + 1 + α i       i = 1 , 2 , N
Equation (11) represents N 1 nonlinear algebraic equations with N 1 unknowns ( α 1 , α 2 , . , α N ). The MATLAB “fsolve” routine [30] was used to calculate the intermediates for equal-size reactors. For equal-size CSTRs in series, the total residence time can be calculated:
θ t o t , e q = N   θ e q

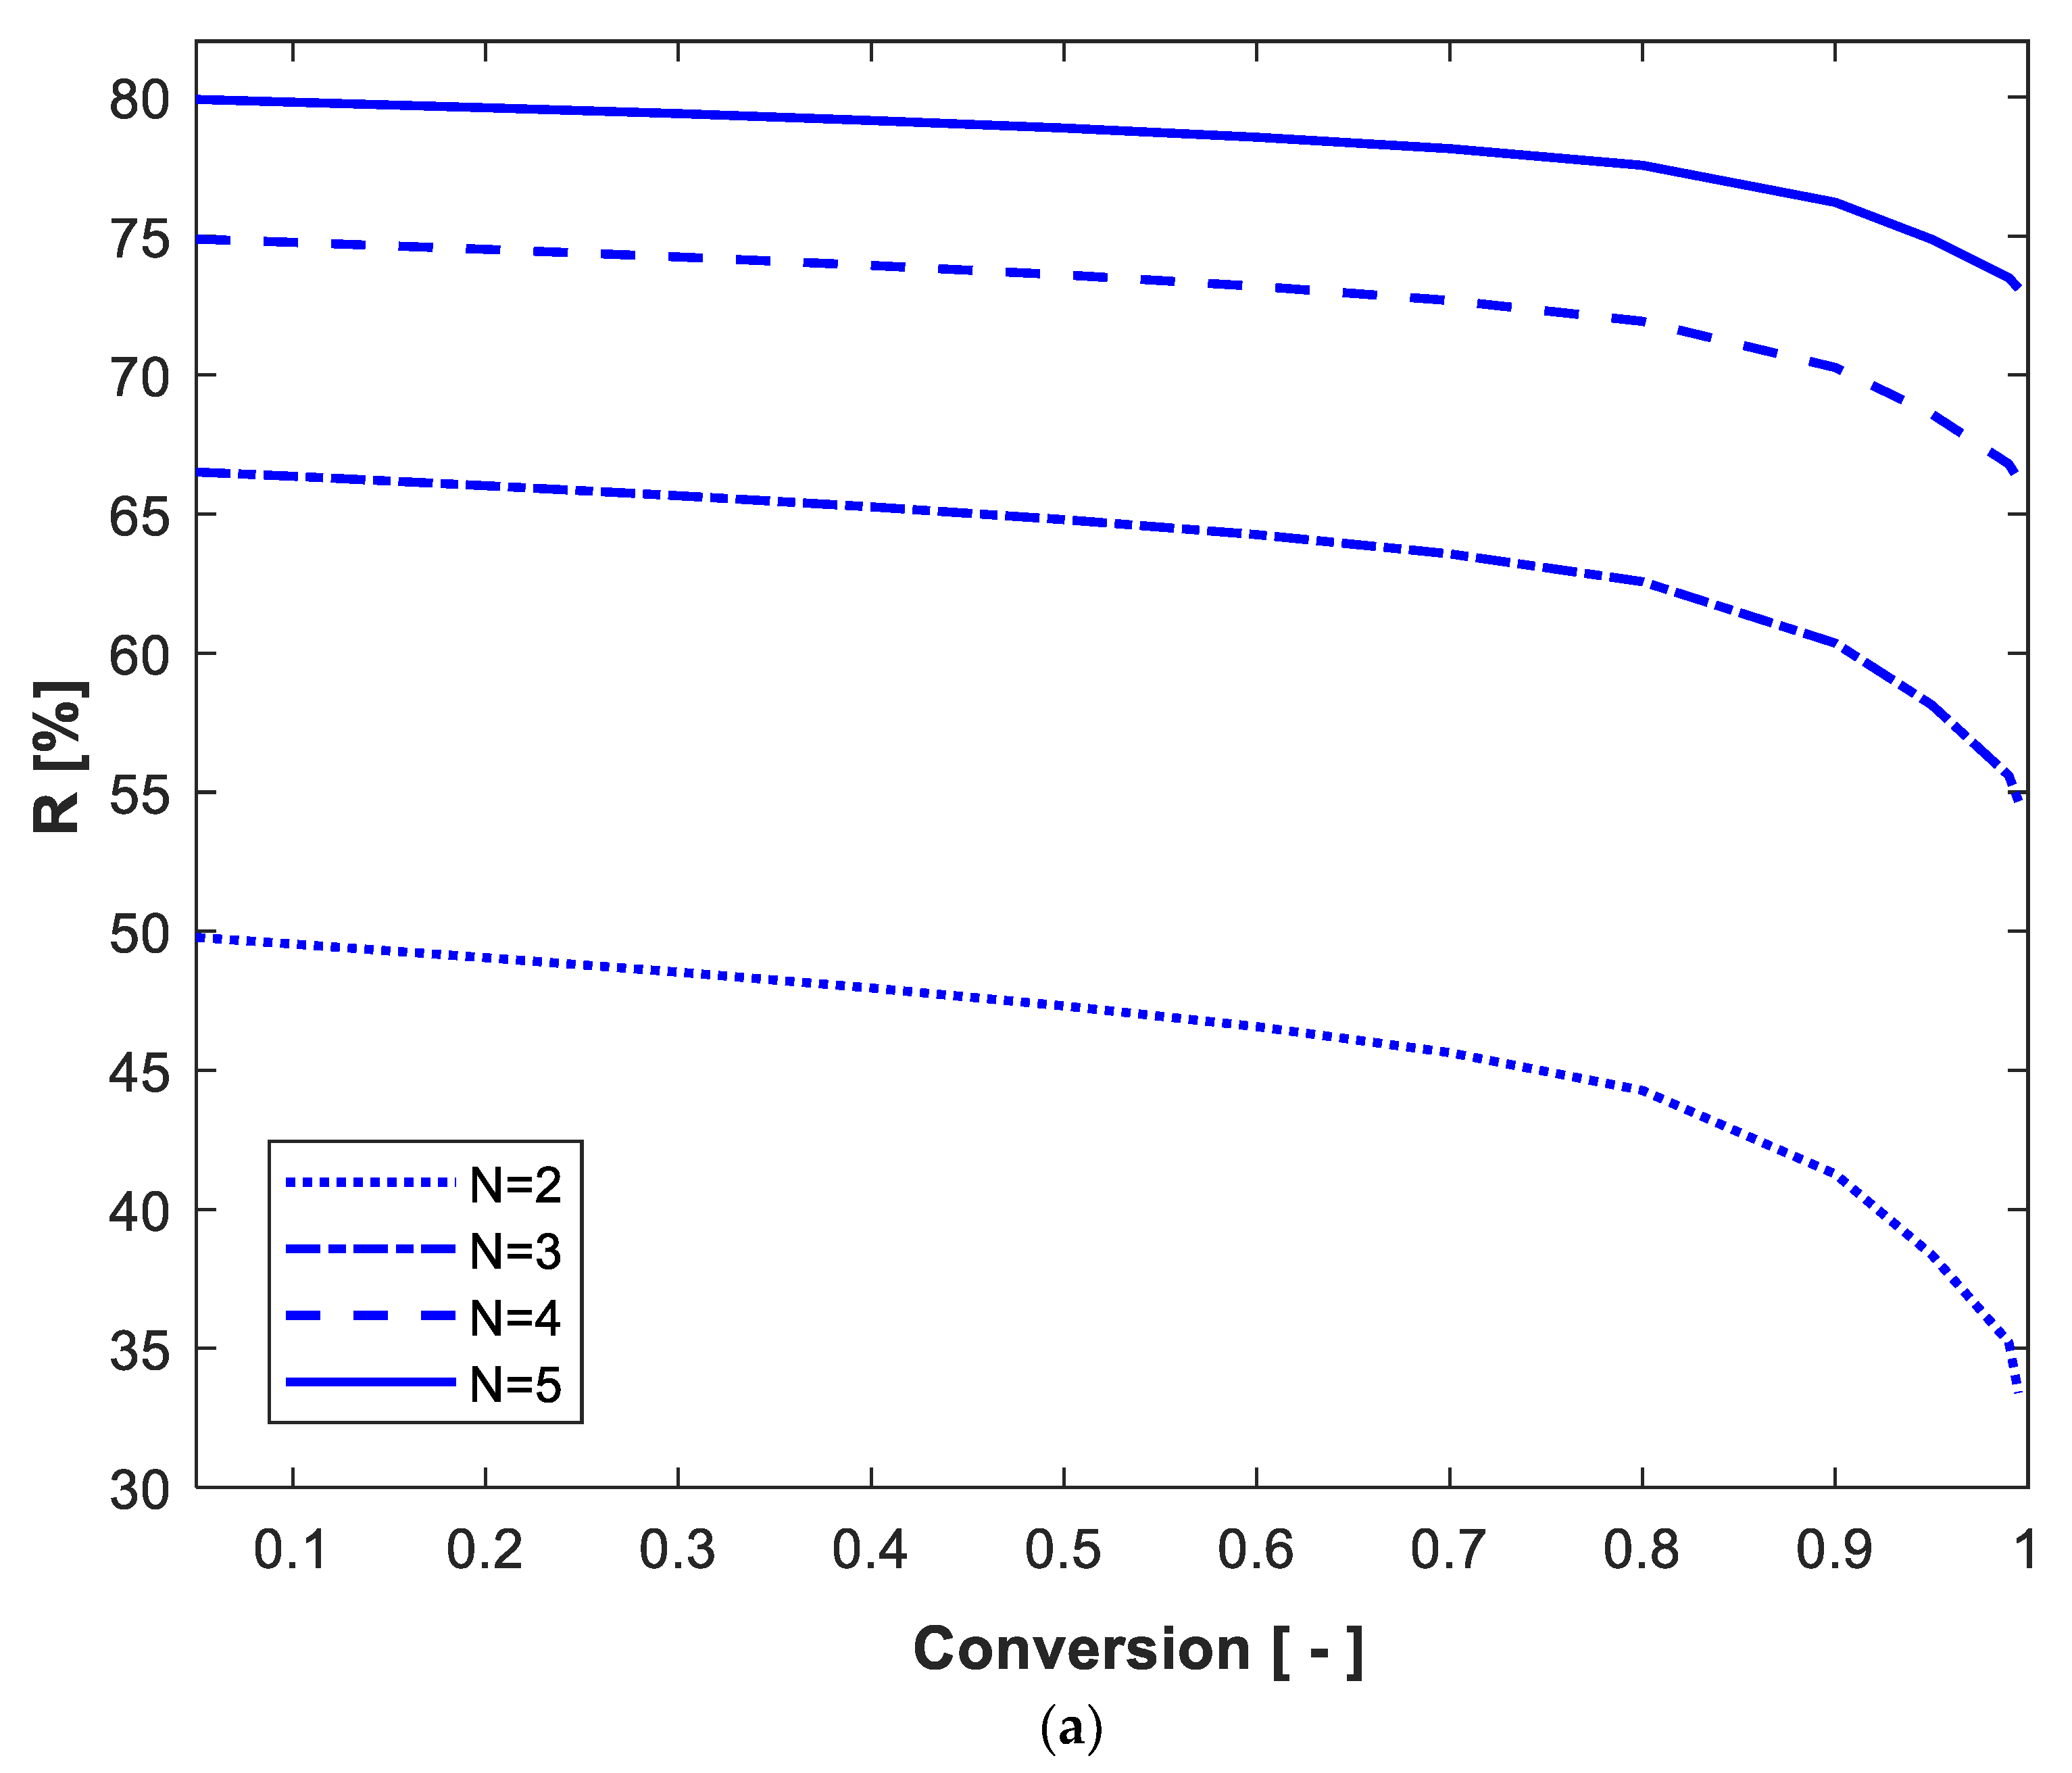
2.4. Percentage Reduction in Total Residence Time Using the Optimum Design Criteria

The percentage reduction in total residence time (or volume as volume flow rate is constant) using the optimum design criteria compared to equal-size reactors was calculated for 2, 3, 4 and 5 reactors in series using the following equation:
Percentage   reduction   in   total   volume       R % = θ t o t , e q θ t o t , o p t θ t o t , e q
Equal-size reactors in series used currently in industry are considered as a reference in this study to determine the percentage of volume saving using the optimum design.

3. Results and Discussion

The kinetic and stoichiometric coefficients used in this optimization study were obtained from the literature [2] as shown in Table 1. The kinetic data describe the production of ethanol from cellulose hydrolysate in continuous and batch reactors. High concentrations of ethanol and sugar inhibit the growth of yeast. From the design equations above, it is clear that the optimum configuration of N CSTRs in series depends on the substrate conversion, the substrate concentration in the feed to the first reactor, the biomass and product concentrations in the feed to the first reactor and the number of reactors in series. Up to five CSTRs in series were used in this study.
Assuming no biomass in the feed to the first reactor ( X o = 0) and substrate concentration in the feed to the first reactor ( S o ) of 30 g/L, Figure 3 shows the effect of substrate conversion on the total optimum dimensionless residence time. It is clear from the figure that at high conversion, the higher the conversion, the higher the residence time required to achieve this conversion. Moreover, increasing the number of reactors has an advantage only at very high substrate conversion (above 97%). At low substrate conversion (data not shown), all reactors have almost similar residence time, so the optimum configuration at low conversion is one CSTR.
Figure 4a (upper) shows the effect of substrate concentration in the feed to the first reactor (So, range 0.1 to 160 g/L) on the total optimum dimensionless residence time for 99% substrate conversion and biomass concentration in the feed to the first reactor (X = 0.01 g/L), where Po = 0. As shown in this figure, the total optimum dimensionless residence time passes through the minimum value for each number of reactors. At low So, the growth rate increases with the increase in the substrate concentration, while at high S o such as 160 g/L, the substrate inhibition is significant. The best So is a compromise between the two extremes (i.e., intermediate So). This agrees with experimental results for ethanol production in a two-stage reactor with recycling [21]. Figure 4b (lower) shows a 3D plot for the same conditions in Figure 4a except that the range of S o is from 2.1 to 160 g/L. It is clear from this figure that the dimensionless residence time passes through a minimum value at a certain S o   and the total optimum dimensionless residence time is reduced with the increase in the number of reactors.
As seen in Figure 4, using multistage CSTR is more beneficial than using a single CSTR. Figure 5a shows the optimum So required for each number of CSTRs. For N of 1, 2, 3, 4 and 5 reactors, the optimum So is 56, 30, 25, 23 and 22 g/L, respectively. For a single-stage CSTR, the optimum So is high compared to other numbers of reactors. This is expected since the substrate concentration dropped from So to S (0.01 So) at 99% conversion in one step in a single reactor. Figure 5b shows the dimensionless residence time at these conditions (i.e., 2.63, 1.59, 1.5, 1.49, 1.48). It is clear from Figure 5a that the optimum So decreases with the increase in the number of reactors at 99% conversion, and from Figure 5b, one can conclude that the best number of reactors N is 2 or 3 connected in series.
The effect of biomass concentration in the feed to the first reactor on the total optimum dimensionless residence is shown in Figure 6a assuming 99% conversion and S o = 30 g/L. It is clear that increasing Xo will decrease the total residence time because biomass is the catalyst for bioconversion (autocatalytic reaction). Compared to the case of no biomass in the feed (Xo = 0), the reactor volume can be reduced by 50% if the Xo increases to 1 g/L for N = 1 to 5 reactors. Similar results were reported in the literature for ethanol fermentation [21]. The effect of product concentration in the feed to the first reactor (Po) on the total optimum dimensionless residence time is shown in Figure 6b assuming 99% conversion, S o = 30 g/L and Xo = 0. As shown in Figure 6b, the dimensionless residence time increases with increasing Po. Unlike Xo, the effect of Po on the reactor volume is not dramatic. For an increase in Po from 0 to 15 g/L, the total volume increases by 22% for N = 1 to 5 reactors. This is due to the reduction in cell growth rate because of product inhibition.
For optimum five reactors connected in series, Figure 7 shows the optimum residence time for each reactor at three S o values, low (5 g/L), medium (50 g/L) and high (160 g/L), assuming 99% conversion. As shown in the figure, a large total reactor volume is required for high S o (160 g/L) due to the effect of substrate and product inhibition. At low S o (5 g/L), the effect of inhibition is negligible, but the rate is controlled by substrate concentration. As shown in Figure 7, the most conversion takes place in the first reactor, especially at medium S o (50 g/L).
The volume of reactors of equal size in series was determined and compared with the optimum volume required to achieve the same degree of substrate conversion. Figure 8 shows the effect of substrate conversion on the total dimensionless residence time of equal CSTRs in series with Xo = 0, S o = 30 g/L and Po = 0. The total dimensionless residence time is almost constant and depends on conversion only for N = 1 and at very high conversion. In this case, the optimum configuration is one CSTR up to 98.4% conversion, where one and two reactors have the same performance (crossover point). At conversions of 0.984, 0.9915, 0.994 and 0.996, the residence time of one CSTR is the same as that for two, three, four and five reactors in series, respectively. The effect of substrate concentration in the feed to the first reactor on the total dimensionless residence time of equal CSTRs in series is shown in Figure 9 for substrate conversion of 99%, Xo = 0.01 g/L and Po = 0. The same as in Figure 4 (optimum volume design), the total equal dimensionless residence time passes through minimum value at certain So for all reactors from N = 1 to 5. In addition, two crossover points exist between single CSTR and two, three, four and five reactors. This means that the volume of one reactor is the same as two, three, four and five reactors at two So: one is low and the other is high substrate concentration.
Using the equal reactor size design criteria, the So that gives the minimum total equal volume is shown in Figure 10a. The trend is the same as that of the optimum volume design criteria. As N increases, the So that corresponds to the minimum total volume decreases. As shown in Figure 10b, at 99% conversion, the required total volume is minimum when two reactors in series are used.
The percentage reduction in total volume using the optimum design criteria compared to equal-size reactor criteria (R%) was determined. Figure 11a shows how R% changes with conversion and number of reactors using S o   of 50 g/L, where Xo = 0 and Po = 0. R% increases with the increase in the number of reactors. For two, three, four and five reactors in series, The decline in R% is very slow with increasing conversion at low substrate conversion. At high conversion (above 80%), the decline in R% with conversion is clear, especially at very high substrate conversion (close to 100%). The effect of S o   on R% for 99% conversion is shown in Figure 11b. The R% passes through maximum value with So and increases with the increase in the number of reactors. For N = 2, 3, 4 and 5 equal-size reactors in series, the maximum R% values achieved were 35%, 54%, 62% and 66%, respectively; this was achieved at S o of 50 g/L. It can be seen in Figure 11b that at very low and very high So, the number of reactors in series and the design criteria (optimum versus equal-volume design) have very little effect on R%, and its value approaches zero. Although there is very little previous literature about volume minimization of CSTRs in series using simultaneous substrate and product inhibition kinetics, Table 2 shows a comparison of the current work simulation results with some closely related literature. Some optimization studies were carried out to determine the optimum number of reactors required to maximize ethanol productivity in a cascade of reactors. Dourado et al. [31,32] developed a mathematical model assuming substrate and ethanol inhibition kinetics to describe ethanol fermentation in a cascade of reactors. The authors used static optimization and determined the optimal number of reactors in a multistage system. The effect of substrate distributed feeding was also investigated.

4. Conclusions

Optimization of a bioprocess is carried out to improve the performance and reduce the cost of the process. The minimum volume design was determined for continuous stirred-tank reactors in series performing a fermentation process described by simultaneous substrate and product inhibition kinetics. Substrate and product inhibition showed to have a significant effect on the performance of multistage bioreactors in series. Multistage bioreactors are beneficial at high substrate conversion and at a medium level of feed substrate concentration. The best number of reactors is two to three for optimum arrangement and two for equal-size arrangements. The presence of biomass in the feed reduces the total required volume of N reactors (50% volume reduction for X o = 1 g/L), while the presence of product in the feed slightly increases the required total volume (22% volume increase for P o = 15 g/L). The percentage reduction in the total volume using the optimum design compared to equal-volume design ( R   % ) increased with the increase in the number of reactors in series. The R % is almost constant at low substrate conversion for each number of reactors (about 80% volume reduction for five reactors in series) and decreases at high conversion. For 99% conversion, the R % passed through a maximum value at the medium level of feed substrate concentration (50 g/L). For N = 2 ,   3 ,   4 and 5   reactors in series, the maximum R % values achieved were 35%, 54%, 62% and 66%, respectively. Although the optimum design criteria require less reactor volume, the cost of manufacturing variable-size reactors is greater than that of manufacturing equal-size reactors.

Funding

This research received no external funding.

Conflicts of Interest

The author declares no conflict of interest.

Nomenclature

A constant defined as X o Y x   S o + 1
B constant defined as P m P o Y p   S o P m
C constant defined as Y P   S o P m
F liquid flow rate (L/h)
K s         Monod constant (g/L)
K s s       dimensionless Monod constant K s S o
K i inhibition constant (g/L)
K i i         dimensionless inhibition constant S o K i
N number of CSTRs in series
S substrate concentration (g/L)
P product concentration (g/L)
P m maximum or critical product concentration (g/L)
V reactor volume, L
X cell concentration, g/L
Y x           cell yield coefficient, g biomass/g substrate
Y p           product yield coefficient, g product/g substrate
Greek Symbols
α   dimensionless substrate concentration S S o
τ residence time, h
θ dimensionless residence time μ m a x τ i
μ specific growth rate, h−1
μ m a x maximum specific growth rate, h−1
δ degree of substrate conversion 1 α N
Subscripts
i refers to the ith reactor
N refers to the Nth reactor
o initial
t o t total
e q equal
o p t optimum

References

  1. Nguyen, V.D.; Auresenia, J.; Kosuge, H.; Tan, R.R.; Brondial, Y. Vacuum fermentation integrated with separation process for ethanol production. Biochem. Eng. J. 2011, 55, 208–214. [Google Scholar] [CrossRef]
  2. Ghose, T.K.; Tyagi, R.D. Rapid ethanol fermentation of cellulose hydrolysate. II. Product and substrate inhibition and optimization of fermenter design. Biotechnol. Bioeng. 1979, 21, 1401–1420. [Google Scholar] [CrossRef]
  3. Moulin, G.; Boze, H.; Galzy, P. Inhibition of alcoholic fermentation by substrate and ethanol. Biotechnol. Bioeng. 1980, 22, 2375–2381. [Google Scholar] [CrossRef]
  4. Van den Heuvel, J.C.; Beeftink, H.H. Kinetic effects of simultaneous inhibition by substrate and product. Biotechnol. Bioeng. 1988, 31, 718–724. [Google Scholar] [CrossRef]
  5. Zhang, Q.; Wu, D.; Lin, Y.; Wang, X.; Kong, H.; Tanaka, S. Substrate and product inhibition on yeast performance in ethanol fermentation. Energy Fuels 2015, 29, 1019–1027. [Google Scholar] [CrossRef]
  6. Zentou, H.; Abidin, Z.Z.; Yunus, R.; Biak, D.R.A.; Issa, M.A.; Pudza, M.Y. A new model of alcoholic fermentation under a byproduct inhibitory effect. ACS Omega 2021, 6, 4137–4146. [Google Scholar] [CrossRef] [PubMed]
  7. Sunarno, J.N.; Prasertsan, P.; Suwan, W.D.; Kongjan, P.; Cheirslip, B. Mathematical modeling of ethanol production from glycerol by Enterobacter aerogenes concerning the influence of impurities, substrate and product concentration. Biochem. Eng. J. 2020, 155, 107471. [Google Scholar] [CrossRef]
  8. Sirisansaneeyakul, S.; Hipolito, C.N.; Kobayashi, G.; Lertsiri, S.; Luangpituksa, P.; Varavinit, S.; Ishizaki, A. Kinetic modeling of lactic acid fermentation from sago starch using Lactococcus IO-1. Annu. Rep. IC Biotechnol. 1998, 21, 504–524. [Google Scholar]
  9. Goncalves, L.M.D.; Xavier, A.M.R.B.; Almeida, J.S.; Carrondo, M.J.T. Concomitant substrate and product inhibition kinetics in lactic acid production. Enzym. Microb. Technol. 1991, 13, 314–319. [Google Scholar] [CrossRef]
  10. Balakrishnan, R.; Tadi, S.R.R.; Rajaram, S.K.; Mohan, N.; Sivaprakasam, S. Batch and fed-batch fermentation of optically pure D(-) lactic acid from kodo millet (Paspalum scrobiculatum) bran residue hydrolysate: Growth and inhibition kinetic modeling. Prep. Biochem. Biotechnol. 2020, 50, 365–378. [Google Scholar] [CrossRef]
  11. Moeller, L.; Strehlitz, B.; Aurich, A.; Zehnsdorf, A.; Bley, T. Optimization of citric acid production from glucose by Yarrowia lipolytica. Eng. Life Sci. 2007, 7, 504–511. [Google Scholar] [CrossRef]
  12. Lin, S.K.C.; Du, C.; Koutinas, A.; Wang, R.; Webb, C. Substrate and product inhibition kinetics in succinic acid production by Actinobacillus succinogenes. Biochem. Eng. J. 2008, 41, 128–135. [Google Scholar] [CrossRef]
  13. Ferone, M.; Raganati, F.; Olivieri, G.; Salatino, P.; Marzocchella, A. Continuous succinic acid fermentation by Actinobacillus succinogenes. Assessment of growth and succinic acid production kinetics. Appl. Biochem. Biotechnol. 2019, 187, 782–799. [Google Scholar] [CrossRef] [PubMed]
  14. Vlysidis, A.; Binns, M.; Webb, C. Utilization of glycerol to platform chemicals within the biorefinery concept: A case for succinate production. Chem. Eng. Trans. 2009, 18, 537–542. [Google Scholar]
  15. Van Niel, E.W.J.; Claassen, P.A.M.; Stams, A.J.M. Substrate and product inhibition of hydrogen by the extreme thermophile, Caldicellulosiruptor saccharolyticus. Biotechnol. Bioeng. 2003, 81, 255–262. [Google Scholar] [CrossRef] [Green Version]
  16. Chen, Y.; Yin, Y.; Wang, J. Recent advance in inhibition of dark fermentative hydrogen production. Int. J. Hydrogen Energy 2021, 46, 5053–5073. [Google Scholar] [CrossRef]
  17. Lopez, S.J.; Sola, C.; Lema, J.M. Substrate and product inhibition significance in the kinetics of sucrose hydrolysis by invertase. Biotechnol. Bioeng. 1982, 24, 2721–2724. [Google Scholar]
  18. Mukesh, D.; Salunke, R.; Banerji, A.A.; Bevinakatti, H.S. Modeling of lipase catalyzed transesterification reactions. Biocatalysis 1992, 6, 151–159. [Google Scholar] [CrossRef]
  19. Horvat, P.; Spoljaric, I.V.; Lopar, M.; Atlic, A.; Koller, M.; Braunegg, G. Mathematical modelling and process optimization of a continuous 5-stage bioreactor cascade for production of poly[-(R)-3-hydroxybutyrate] by Cupriavidusnecator. Bioprocess Biosyst. Eng. 2013, 36, 1235–1250. [Google Scholar] [CrossRef]
  20. Hill, G.A.; Robinson, C.W. Minimum tank volumes for CFST bioreactors in series. Can. J. Chem. Eng. 1989, 67, 818–824. [Google Scholar] [CrossRef]
  21. Wang, F.S.; Li, C.C.; Lin, Y.S.; Lee, W.C. Enhanced ethanol production by continuous fermentation in a two-tank system with cell recycling. Process Biochem. 2013, 48, 1425–1428. [Google Scholar] [CrossRef]
  22. Wall, J.B.; Hill, G.A. Optimum CFST bioreactor design. Experimental study using batch growth parameters for S. cerevisiae producing ethanol. Can. J. Chem. Eng. 1992, 70, 148–152. [Google Scholar] [CrossRef]
  23. Kalogeris, E.; Antzoulatos, O.; Mamma, D.; Hatzinikolaou, D.G.; Christakopoulos, P.; Kekos, D. Application of different processes for the biodegradation of 1,3-dichloro-2-propanol by the bacterium Pseudomonas putida DSM 437. Chem. Biochem. Eng. Q. 2007, 21, 297–305. [Google Scholar]
  24. Nishiwaki, A.; Dunn, I.J. Analysis of the performance of a two-stage fermenter with recycle for continuous ethanol production using different kinetic models. Biochem. Eng. J. 1999, 4, 37–44. [Google Scholar] [CrossRef]
  25. Nishiwaki, A.; Dunn, I.J. Analysis of a two-stage fermenter with recycle for continuous ethanol production. Chem. Eng. Comm. 1998, 168, 207–227. [Google Scholar] [CrossRef]
  26. Harmand, J.; Rapaport, A.; Trofino, A. Optimal design of interconnected bioreactors: New results. AIChE J. 2003, 49, 1433–1450. [Google Scholar] [CrossRef]
  27. Bayrock, D.P.; Ingledew, W.M. Ethanol production in multistage continuous, single stage continuous, Lactobacillus-contaminated continuous, and batch fermentations. World J. Microbiol. Biotechnol. 2005, 21, 83–88. [Google Scholar] [CrossRef]
  28. Abu Reesh, I.M. Optimal design for CSTRs in series using reversible Michaelis-Menten reactions. Bioprocess Eng. 1996, 15, 257–264. [Google Scholar]
  29. Abu Reesh, I.M. Optimal design of continuously stirred tank reactors in series using Michaelis-Menten kinetics with competitive product inhibition: Theoritical analysis. Desalination 2005, 180, 119–132. [Google Scholar] [CrossRef]
  30. MATLAB, Version (R2020b); The MathWorks Inc.: Natick, MA, USA, 2019.
  31. Dourado, A.; Goma, G.; Albuquerque, U.; Sevely, Y. Modeling and static optimization of the ethanol production in a cascade reactor. I. Modeling. Biotechnol. Bioeng. 1987, 29, 187–194. [Google Scholar] [CrossRef]
  32. Dourado, A.; Calvet, J.L.; Sevely, Y.; Goma, G. Modeling and static optimization of the ethanol production in a cascade reactor. II. Static optimization. Biotechnol. Bioeng. 1987, 29, 195–203. [Google Scholar] [CrossRef] [PubMed]
Figure 1. A 3D line plot of the specific growth rate as a function of substrate and product concentrations.
Processes 09 01419 g001
Figure 2. Typical optimum configuration of 5 CSTRs connected in series.
Processes 09 01419 g002
Figure 3. Effect of substrate conversion on the total optimum dimensionless residence time. So = 30 g/L, Xo = 0, Po = 0.
Processes 09 01419 g003
Figure 4. (a) Effect of substrate concentration in the feed to the first reactor using different reactor stages on the total optimum dimensionless residence time; (b) the same relation shown in a 3D surface plot. Substrate conversion: 99%. Xo = 0.01 g/L. Po = 0.
Processes 09 01419 g004
Figure 5. The substrate concentration in the feed to the first reactor (a) at which the total optimum dimensionless residence time (b) is minimum for N reactors in series. Substrate conversion: 99%. Xo = 0.01 g/L. Po = 0.
Processes 09 01419 g005
Figure 6. Effect of biomass concentration Xo (a) and product concentration Po (b) in the feed to the first reactor on the total optimum dimensionless residence time. Substrate conversion: 99%. S o = 30 g/L. Po = 0 in Figure 6a. Xo = 0 in Figure 6b.
Processes 09 01419 g006
Figure 7. Optimum dimensionless residence time for 5 reactors connected in series at 3 feed substrate concentrations. Substrate conversion: 99%. Xo = 0.01 g/L. Po = 0.
Processes 09 01419 g007
Figure 8. Effect of substrate conversion on the total dimensionless residence time of equal-volume reactors in series. Xo = 0. S o = 30 g/L. Po = 0. N = 1 is shown for comparison.
Processes 09 01419 g008
Figure 9. Effect of substrate concentration in the feed to the first reactor on the total dimensionless residence time of equal-volume reactors in series. Substrate conversion: 99%. Xo = 0.01 g/L. Po = 0. N = 1 is shown for comparison.
Processes 09 01419 g009
Figure 10. The substrate concentration in the first reactor (a) at which the total equal dimensionless residence time is minimum (b) for N reactors in series. Substrate conversion: 99%. X o = 0.01 g/L. P o = 0. N = 1 is shown for comparison.
Processes 09 01419 g010
Figure 11. The percentage reduction in total volume using the optimum design versus equal-volume design criteria for N-reactor series as a function of conversion (a) and inlet substrate concentration (b). In (a), S o = 50 g/L, Xo = 0 g/L, P o = 0 g/L; in (b), 99% conversion, Xo = 0.01 g/L, P o = 0 g/L.
Processes 09 01419 g011aProcesses 09 01419 g011b
Table 1. Kinetics and stoichiometric coefficients used in the optimization study [2].
Kinetics and Stoichiometric CoefficientsSymbolValue and Units
Maximum specific growth rate µ m a x 0.4   h 1
Monod constant K s 0.48 g   substrate / L
Inhibition constant K i     205.2 g   substrate / L
Maximum product concentration P m 87 g   product / L
Cell (biomass) yield coefficient Y X 0.1 g   cells / g   substrate
Product yield coefficient Y P 0.48 g   product / g   substrate
Table 2. Comparison of the current work simulation results with the literature.
Fermentation ProcessN Reactors/Equal or
Unequal Size
Reactor Performance/VolumeRef.
Ethanol fermentation by the yeast S. cerevisiae, 30 °C, pH of 4, bagasse hydrolysate as substrate.2 equal-size reactors in seriesVolume reduction using 2 CSTRs compared to one reactor is 58%.[2]
Ethanol fermentation by S. cerevisiae using glucose as substrate.1 and 5 equal-size reactorsEthanol productivity in 5 reactors in series is 4 times that of a single CSTR or batch reactor having the same volume.[27]
Ethanol fermentation in 2 CSTRs in series with cell recycling/separator after each stage of reactor. Numerical study using 4 kinetic models.2 unequal-size reactors2-CSTRs in series with recycling have volume of 25% less than one chemostat and 30% higher ethanol productivity.[24]
Ethanol fermentation by S. cerevisiae on glucose as substrate in continuous stirred-tank reactors.3 decreasing volume
CSTRs in series
Experimental results confirmed the optimal design predictions for substrate, product and biomass concentrations for each of the 3 unequal-size reactors in series.[22]
Minimum total volume of CSTRs in series based on substrate and product inhibition kinetic model obtained from [2].Up to 5 reactors in series.
Equal and optimum design.
For feed substrate concentration of 50 g/L and 99% conversion. The percentage reduction in the total volume using the optimum design compared to equal-size reactors is 35%, 54%, 62% and 66% for 2, 3, 4 and 5 reactors in series, respectively.This work
Publisher’s Note: MDPI stays neutral with regard to jurisdictional claims in published maps and institutional affiliations.

