Article

Risk Propagation of Concentralized Distribution Logistics Plan Change in Cruise Construction

School of Transportation and Logistics Engineering, Wuhan University of Technology (WUT), Wuhan 430063, China
*
Author to whom correspondence should be addressed.
Processes 2021, 9(8), 1398; https://doi.org/10.3390/pr9081398
Submission received: 6 July 2021 / Revised: 8 August 2021 / Accepted: 10 August 2021 / Published: 12 August 2021
(This article belongs to the Special Issue Optimization Algorithms Applied to Sustainable Production Processes)

Abstract

:
Compared with the ordinary merchant ship building, the concentralized distribution in cruise building is more complex. Plan change is a common phenomenon in cruise building, and it is easy to lead to mismatch between production and logistics, resulting in risks such as production schedule delay and inventory backlog. In order to reduce the adverse effects of plan change on the shipyard, it is necessary to conduct an in-depth study on the risks of a centralized distribution logistics plan. Based on the analysis of the composition of the centralized distribution logistics planning system, risk factors in different plan links are identified in this paper. A system dynamic model is constructed to simulate the propagation of five basic types of planning risk, including procurement plan, warehousing plan, pallet concentralization plan, distribution plan and production plan. In the case study of HVAC (heating, ventilation and air conditioning) materials, the values of risk factors are estimated though consulting experts with questionnaire. The weight of each risk factor in each subsystem is calculated by a method combined with analytic hierarchy process and coefficient of variation method. Through the simulation experiments carried out in Vensim, it is found that both inventory backlog risk and cruise construction schedule delay risk increase with the increasement of estimated values of risk factors, which is an effective proof of the rationality of the model, and that the most sensitive risk factor for both the two kinds of risk is production planning risk.

1. Introduction

Cruise ship construction is a giant system of engineering, with a complex process, long construction cycle and a huge quantity of materials. The number of parts is far more than that of high-speed rail, aircraft and ordinary ships. It is a huge project to assemble such a cruise ship. Due to the complexity of cruise ship construction technology, the cruise ship construction industry has been monopolized by a few large and stable shipyards, which has changed in recent years. Many companies began to place new cruise orders, and a large part of the cruise construction contracts were won by some shipyards who had no cruise construction experience before. In recent years, Chinese emerging shipbuilding enterprises have become the main factor to change the competitive landscape of the world cruise construction industry. Modern shipbuilding mode characterized by “integration of hull, outfitting and coating” and “integration of design, production and management” determines the important position of planning in cruise ship construction. In order to deliver the cruise on schedule, it is necessary to pay attention to the cruise construction production plan and concentralized distribution logistics planning management to ensure material distribution. The production plan management system is the foundation to ensure the construction of the cruise ship, and that the materials are delivered to the production site on time and in quantity as these are prerequisites for the production plan to proceed on schedule.
As there are many participants, and the relationship between the supply and demand of materials is complex, the concentralized distribution logistics plan change is quite common. Concentralized distribution logistics plan change risk in cruise construction come from the external environment and internal links. In the process of cruise construction, if the possible plan change risks cannot be effectively identified or no timely actions taken to control them, concentralized distribution logistics process will be interrupted. Further, some risk may transfer to other links, resulting in inventory backlog or delay of construction schedule, and this may seriously affect the cruise construction. It is necessary to study the risk propagation because it may affect the planning, inventory, production schedule and other related factors that are not directly at risk in some periods. Therefore, in order to improve the accuracy of risk assessment, it is necessary to introduce risk propagation factors into risk assessment and to study the risk propagation mode and path.
The main purpose of this study is to provide a decision-making reference for the preparation and management of concentralized distribution logistics plan in cruise construction by evaluating the related risk factors and analyzing the risk propagation process. The contributions of this paper are as follows: (i) This paper extends the research boundary of concentralized distribution logistics plan change. In addition to the concentralized distribution logistics plan process itself, the upstream stage, such as the production plan, procurement plan, etc., that may also affect are also considered. (ii) The system dynamics analysis method is used to calculate and compare the risk consequences caused by different risk factors. (iii) This paper constructs the risk factor set of concentralized distribution logistics plan change based on the opinions of experts from different shipyards in China. This can provide a reference for the risk assessment.
The remainder of this paper is organized as follows: Section 2 offers a concise summary of related research efforts about risk management and application of system dynamics. Section 3 introduces the methods used in this paper and the background of the case study. Then, Section 4 illustrates the results of the case study and shows relevant discussions. Finally, Section 5 concludes and proposes directions for future research.

2. Literature Review

At present, only a few European countries and Japan have experience in building cruise ships. Most of the research related to cruise ships is about cruise supply chain [1,2,3], cruise liner operations [4], marketing [5], cruise vessel design and construction [6], impacts of cruise tourism [7,8], the development of cruise tourism [9], and logistics in cruise ship construction [10].
The scope of concentralized distribution logistics in cruise ship construction starts from the supplier providing construction materials according to the contract and plan, through warehousing, distribution and other processes, until all construction materials are assembled and installed on board, and the cruise ship products are delivered. Its whole process revolves around the corresponding plan, so the concentralized distribution logistics plan has a wide range of influence, of which the complexity makes it a challenge to carry out risk management. However, compared with the studies on concentralized distribution logistics procedure, there has been less studies focusing on plan change. In order to study the concentralized distribution logistics planning change risk in cruise construction, we can learn from the research on supply chain risk and related evaluation models and methods.

2.1. Risk Management in Supply Chain

Supply chain risk management (SCRM) has received increased attention in recent years, aiming to shield supply chains from disruptions by predicting their occurrence and mitigating their adverse effects [11]. The different strategies in SCRM proposed by researchers or practitioners generate from the process of identifying, assessing, mitigating or monitoring unexpected events or conditions which might have adverse impacts on any part of a supply chain. George Baryannis et al. [12] investigated the various definitions and classifications of supply chain risk and related notions such as uncertainty. They classified the risks into three categories: external or environmental risk, industrial risk and internal risk. According to the literature viewed by them, the approaches adopted in SCRM includes mainly five categories, mathematical programming, network-based approach (Petri nets and Bayesian networks), agent-based approach, reasoning, machine learning and big data analytics.
The strategies implemented SCRM can be considered either reactive or proactive, the former is applied after a risk materializes, while the latter allows to identify and assess risks before they occur, in order to make suitable mitigation and contingency plans. Proactive strategies rely on the ability to accurately predict the likelihood of occurrence and the potential impact of risks [12]. In terms of academic research, proactive strategies are preferred. As the reactive strategies rely more on the practical situation and scenarios, it is difficult to propose strategies of universal adaptation. Therefore, many studies focus on risk control strategy. Jianjun Han et al. [13] proposed risk management and control methods for risk avoidance, risk control, risk dispersion and risk transfer, and constructed static and dynamic models of risk management. Tsan Ming Choi et al. [14] studied the risk transmission path and how to promote risk and put forward the risk management and control suggestions for logistics services, enterprise operation, disaster and emergency management. Rapha ë Oger et al. [15] studied and designed a system to support the collaborative supply chain risk management of logistics network stakeholders.
Within the proactive strategies in SCRM, the resilience paradigm plays an important role [16]. SC resilience has recently gained extensive attention in research. Resilience is commonly considered as the SC’s ability to withstand disruptions and recover from disruption [17,18]. A resilient SC is usually characterized with some redundancy and recovery capabilities [19].

2.2. Risk Propagation in Supply Chain

The ripple effect in the supply chain (also known as the “domino effect,” “cascading effect,” and “snowball effect”) occurs if a disruption cannot be localized and cascades downstream impacting supply chain performance such as sales, stock return, service level, and costs [20,21]. Ivanov [22] summarized major reasons of ripple effect as: complexity, leanness, geographical specialization and IT-failures. Corresponding countermeasures are proactive strategies, such as redundancies or reserves (material inventory, capacities), contingency plans, constructing resilient, agile and responsive supply chains to make supply chains more flexible, coordination in supply chains, etc. In some cases, disruptions are hardly predictable, and hence difficult to plan in advance [23]. Therefore, the supply chain control function is critical in practice, in which information technologies play important roles. For example, feedback control can be supported by RFID (radio-frequency identification) technology which can be used to effectively communicate these disruptions to other tiers and help revise initial schedules [22].
Among the strategies above, supply chain resilience has received a lot of attention in recent years. It has been extensively studied via different approaches. Resilient supply chain design creates certain protections and takes into account possible perturbations while generating supply chain design [23,24], e.g., with the help of contingency plans or backup planning (e.g., alternative suppliers or shipping routes) [25,26]. Kleindorfer and Saad [23] and Sheffi and Rice [27] considered sourcing flexibility, inventory and capacity excessiveness as major resilience drivers in the supply chain.

2.3. System Dynamics Used in Tacking Supply Chain Risk

System dynamics (SD) is a popular approach to deal with high levels of uncertainty, causal ambiguity, and complexity. SD models can represent clearly the key feedback structures in the system, therefore it is implemented to manage supply chain risks [28]. SD models were applied to describe and analyze the behavior of the supply chain, with different types of delay or disruption, such as the bullwhip effect [29], or various disasters, such as road rush-repairs after an earthquake [30], coal mine accidents [31,32], and floods [33,34]. Peng M. et al. [35] propose a system dynamics model to analyze the behaviors of disrupted disaster relief supply chain by simulating the uncertainties associated with predicting post-seismic road network and delayed information. Li et al. [36] proposed a novel modelling and simulation method with system dynamics to address the dynamic risks effects in the chemical supply chain transportation system, especially the consideration of time-dependent system behavior in different operational conditions.

2.4. Summary

From the above literature review, there is no research on the change risk of concentralized distribution logistics plan in cruise building or even in the ordinary ship building. However, obviously, plan change is closely related to ship construction progress and logistics cost. The research of this paper is an innovative beginning, trying to fill the gap in this field.

3. Materials and Methods

This paper takes the change risk of concentralized distribution logistics plan in cruise construction as the research object and uses the SD method to quantitatively analyze the risk transmission process. The data needed to determine the initial values of variables and logical equations in SD model are mainly obtained by analyzing the investigation results in Shanghai Waigaoqiao Shipbuilding CO. LTD (SWS).

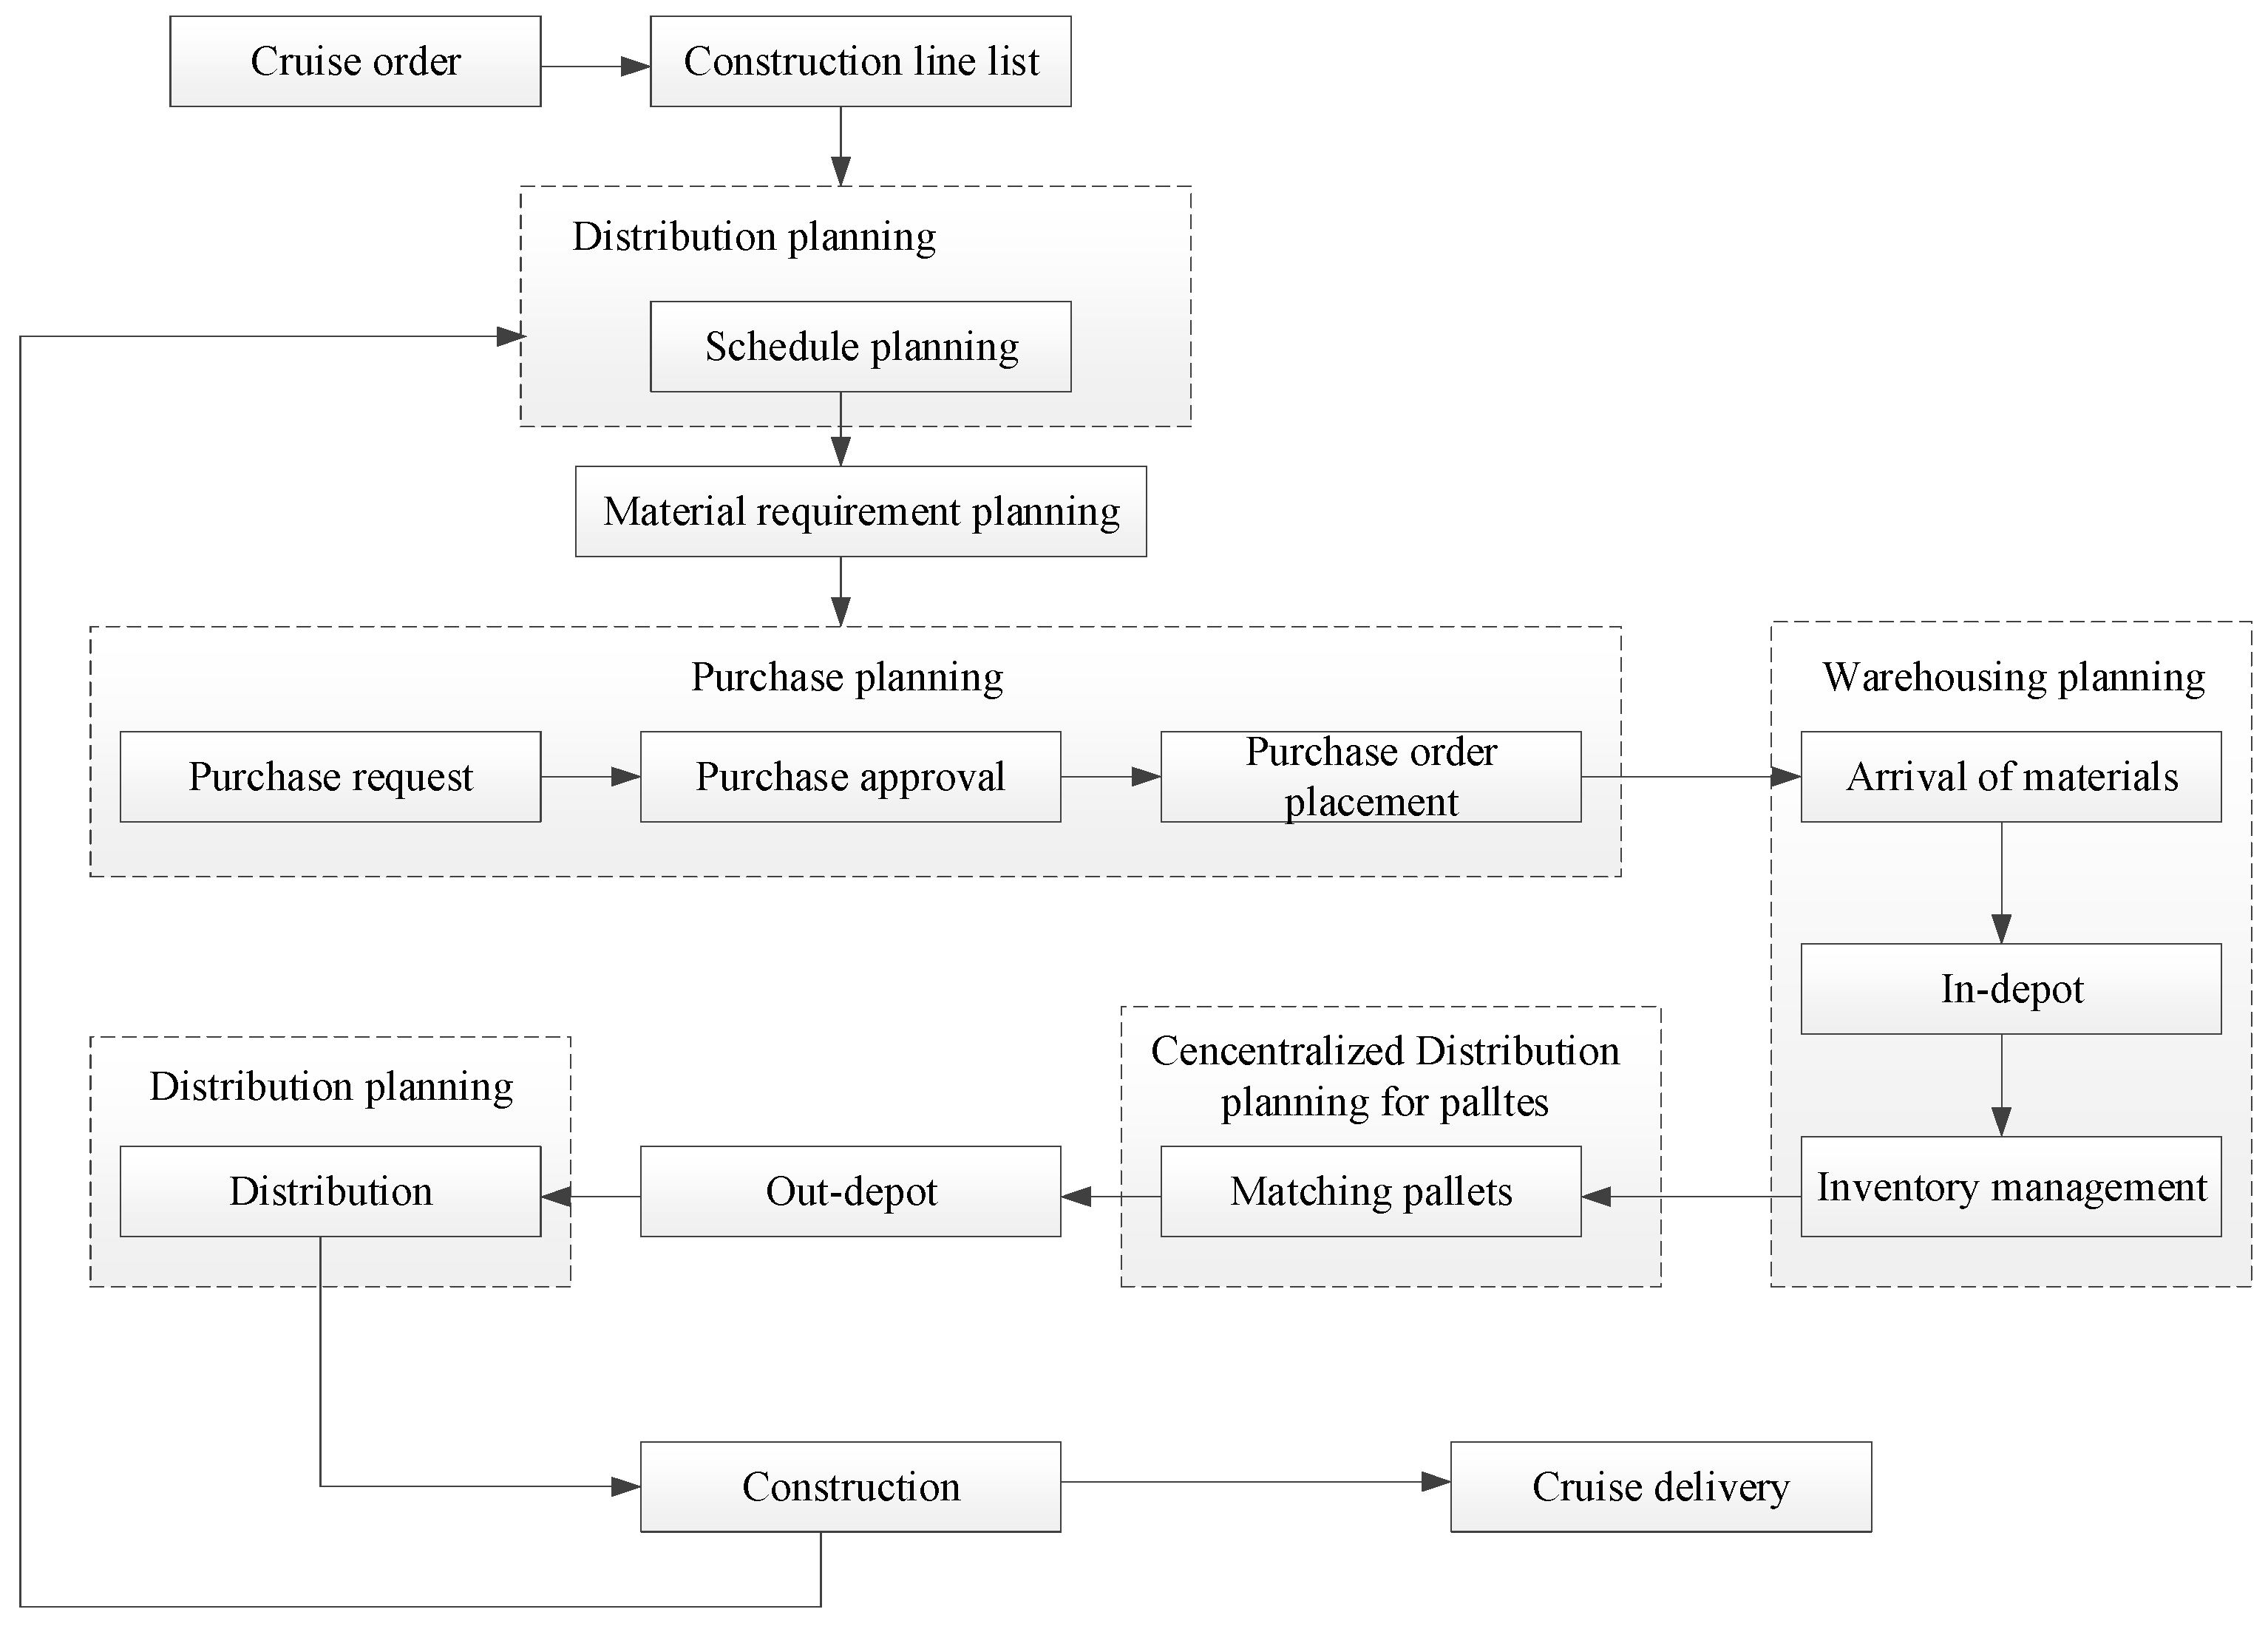
3.1. Background and Materials

For many shipyards, compared with the production plan, many links in the concentralized distribution logistics plan, such as storage plan and distribution plan, have not attracted enough attention. The incompleteness of logistics distribution plan can easily lead to problems such as overstock of materials. Before analyzing the change risk of concentralized distribution logistics plan, it is necessary to analyze the composition of concentralized distribution logistics plan. In order to facilitate the readers who do not know much about the shipbuilding industry to understand this paper, this section first describes the concentralized distribution logistics process in cruise construction, and then introduces the concentralized distribution logistics planning system on this basis.
With the continuous development of shipbuilding technology, the “intermediate product” oriented modern shipbuilding mode has become the mainstream. Under the guidance of “lean shipbuilding”, the modern shipbuilding mode applies group technology, coordinates all production and construction activities, and produces in the way of subsection assembly. It gradually forms the orderly and synchronous operation of shell fitting, outfitting and painting, and realizes the shipbuilding technology of integration of design, production and management.
As a part of shipbuilding logistics, concentralized distribution logistics in cruise construction is closely related to the production process and technological process. Concentralized distribution logistics in cruise construction refers to the material collection and distribution activities accompanied by shipbuilding production activities, that is, according to the idea of intermediate products oriented and the production requirements of “intermediate products”, to realize the circulation activities of various raw materials, auxiliary parts and modules between workshops and processes in the shipyard.
The process of concentralized distribution logistics in cruise ship construction includes starting from the warehouse receiving materials according to the arrival plan, keeping them in the warehouse according to the storage plan, and then selecting materials from the warehouse for concentralization according to the material requisition list of the production department, until materials are distributed to the production site through transportation within the shipyard. During the process, due to many uncertainties in the actual production planning, the change of production plan will have impacts on the concentralized distribution logistics process. The effective development of concentralized distribution logistics activities and production activities, as well the connection between the two parts, need the guidance of planning, which is the concentralized distribution logistics plan studied in this paper.
According to the investigation in SWS, a typical concentralized distribution logistics planning system in cruise construction is obtained as shown in Figure 1, which includes three parts: warehousing plan, concentralized distribution plan for pallets and the distribution plan. Although the purchasing plan and the production plan are not affiliated to the concentralized distribution logistics plan system, for which they are the forerunners, they have a direct impact. Therefore, the procurement plan and production plan will be introduced when the logistics distribution plan is introduced below.
The risk of concentralized distribution logistics plan change is related to the flow of materials and intermediate products in the whole cruise ship construction process, caused by many uncertain factors. The consequence of these uncertain factors is that the overall concentralized distribution logistics plan does not conform to the original plan, resulting in a certain deviation, which eventually leads to the delay of cruise ship construction production schedule.

3.1.1. Risk Factors of Concentralized Distribution Logistics Plan Change

The risk factors of concentralized distribution logistics plan change can be divided into external factors and internal factors. External factors refer to the risk sources of planning system change caused by external environment, and internal factors refer to the risk sources of planning system change caused by concentralized distribution logistics process.
The external risk sources of concentralized distribution logistics plan are mainly the natural, political, economic, market, legal, traffic and so on in the process of suppliers transporting materials to the warehouse. On the one hand, the change of the external environment may lead to the delay of the material arrival plan, which will affect the on-time progress of the procurement plan and the warehousing plan, resulting in the delivery delay, material damage and other problems, and then lead to the delay of the construction schedule. On the other hand, it may lead to design changes or process changes, resulting in production plan changes, and then affect the concentralized distribution logistics plan.
Internal risk source is the main reason for the risk of concentralized distribution logistics plan. In the concentralized distribution logistics planning system, different plans run through to form a whole. The generation of risk in one plan will pass to other plans along the connection between them.
According to consultation with several experts from two shipyards in Wuhan, China and the investigation in SWS, the following subsections analyze the main risk source factors leading to the risk of concentralized distribution logistics plan change from five aspects: procurement plan change risk, warehousing plan change risk, pallets concentralization plan change risk, distribution plan change risk and production plan change risk. As the limitations of this study which is mentioned in the “Discussion” section, this paper ignores certain risks of which the probability of occurrence is very difficult to measure and does not further trace source of the risk factors listed below.
(1)
Purchase plan change risk factors
  • Changes in external environment
Compared with ordinary ships, many of the materials needed for cruise ship construction are imported from abroad, which will be affected by the political, customs, market and other environments. In the way of long-distance transportation, there will be more uncertainties, such as the impact of natural environment phenomena such as gale winds, rainstorms, and even some natural disasters, which will delay the arrival time or bring about damage and loss of purchased materials. When the delivered materials do not meet the quantity or quality requirements, the purchase plan needs to be changed.
b.
Changes in material requirement plan
The material requirement plan is based on the schedule plan (the main form of production plan) in the cruise ship construction process. In the actual construction and production activities, it is inevitable that there are schedule changes. For example, if the production in one stage is delayed, it will lead to the postponement of production activities in the next stage. At this time, the material requirement time will change, so the purchasing department needs to make a new purchasing plan.
(2)
Warehousing plan change risk factors
The warehousing plan includes the arrangement for storage space and production activities in the warehouse. The storage location plan is the key point of the warehousing plan. Orderly turnover of materials is a prerequisite for the implementation of the warehousing plan. Generally, the location is arranged according to the type, quantity, storage time, delivery time, floor area and storage requirements of the goods. The delay of pallet concentralization plan caused by the delay of production schedule in actual production activities will directly affect the implementation of material retrieval plan. This hence results in the inability to free up the storage space required by the continuous influx of materials according to the original purchase plan, and even leads to a “warehouse explosion”. At this time, it is necessary to change the warehousing plan to deal with the shortage of storage space for some materials.
(3)
Pallets concentralization plan change risk factors
The pallet concentralization plan mainly arranges the material allocation operation, i.e., allocates different types of materials and intermediate products to different specifications of pallets. There are two main factors that cause the change of pallet concentralization plan: material supply and material quality. Material supply involves the work of warehouse out and empty pallet management in warehouse management. Only when the two aspects of material out and empty pallet are ready can the collection and distribution work be carried out. In the process of storage, delivery and distribution, if the quality is not up to standard due to material damage, it will lead to the change of pallet distribution plan and subsequent distribution plan.
(4)
Pallets distribution plan change risk factors
After the completion of pallet concentralization, the distribution department will deliver the pallets to the production site according to the distribution plan formulated according to the production demand and pallet list, including the nominal pallets of large equipment such as mainframe. The main reasons for the change of distribution plan are that the pallets are not ready on time, the distribution and transportation equipment are not available, and the pallets cannot be accepted on time at the production site. Due to the diversity of materials, pallets are often not ready on time. The auxiliary mechanical equipment such as forklifts, cranes and trucks for transporting pallets are limited resources for shipyards. Therefore, the effective scheduling of distribution and transportation equipment is also a challenge. Due to process complexity and other reasons, the production site may not be able to install pallets on time, resulting in distribution and transportation equipment not being returned on time. The production site may also change the time of accepting pallets due to the postponement of the production schedule, resulting in the change of the distribution plan.
In the process of distribution and transportation, pallets are completed through human activities. There are inevitably mistakes or errors, resulting in the occurrence of wrong or less delivery of materials, which may increase the workload of the distribution department and then reduce distribution efficiency, even to affect the implementation of the subsequent distribution plan. In addition, if there is no planned transportation route in the factory during on-site transportation, it will lead to disorderly distribution and risk of traffic accident. During the distribution process, the empty pallet should be recovered in time. It also should be noted that the space of the installation site is limited. After the pallet is transported to the site for unloading the pallet materials, the empty pallet should be recovered in time to reduce the occupation of the construction site. In other words, the busy distribution transportation route, the operation of distribution personnel, and whether the pallets are recovered in time, are also factors that may lead to the change of distribution plan. Of course, the probability of these situations is relatively small.
(5)
Production plan change risk factors
  • Production disjointed
Production disjointed refers to the phenomenon that the gap between the actual production and the production plan prepared in advance is too large. When the actual production activities lag behind the production plan, there will be too many raw materials stacked on the production site or lead to overstock in the warehouse. On the one hand, the occupation of the installation site will hinder the production activities, further leading to the production activities lagging behind again, forming a vicious circle. On the other hand, the materials piled up in the warehouse caused by production disjointed will affect the implementation of the warehousing plan.
b.
Design change
Compared with other construction industries, one of the characteristics of shipbuilding industry is that the design of production plan is not achieved overnight but modified with the design and production of ship construction. Design change almost runs through the whole process of cruise ship construction. The reasons for the design changes include the requirements of the shipowner, the process changes caused by the application of new technology, the requirements of the safety rules and regulations of the classification society, the quality problems of the original design, and the design conflicts between different specialties.
c.
Design out of date
Design out of date mainly refers to that the design drawings do not conform to the production operation time, which leads to the failure to prepare for the next stage of production in time, and even leads to the stagnation of production activities. The main reasons for design delay are failing to respond to the design changes in time for redesign, and delayed comments from classification society.
d.
Line table adjustment
Construction line table (also known as line list) is directly connected with the production plan. It is based on the business line table, cruise ship construction contract, instruction manual, construction load balance, etc. to plan the construction schedule of the contracted cruise ships. It determines the main material requirement plan in cruise ship construction. In the process of cruise ship construction, the new functional requirements put forward by the ship owner will require timely adjustment of the construction schedule, which will guide the adjustment of relevant material requirement plan and ship design.

3.1.2. Overview of the Case Study

There are many kinds of cruise construction materials. For the assessment of risk factors listed in Section 4, it is necessary to consult relevant experts for specific materials. This paper takes HVAC (heating, ventilation and air conditioning) materials as an example. HVAC material is a typical representative of cruise ship construction materials, concentralized and distributed with pallet.
HVAC is a control system including temperature, humidity, air freshness and air circulation. The total amount of HVAC materials accounts for about 5% of the total amount of cruise ship construction materials, which is the key storage materials. HVAC materials in cruise are mainly composed of air conditioning water system, ventilation system, hood system, refrigerant water/hot water system and air conditioning system. In addition, HVAC materials include refrigeration equipment, and iron outfitting in public areas, etc. From the perspective of warehousing and distribution, HVAC materials are mainly Class II and III materials. Class II materials are light crane lifting materials, including construction materials, accessories and other materials. Class III materials are the materials transported by the stacker, including superstructure, accessories and other materials.
Due to the long lead time of HVAC material procurement, a large number of storage equipment should be set up. The whole concentralized distribution process includes procurement, customs declaration, unloading, inspection, inbound, storage, demand application from production department, picking, outbound, concentralization, and distribution, etc.

3.2. SD Model Development for the Case Study

3.2.1. Risk Propagation Analysis

(1)
Risk propagation path
The risk factors will move to the risk receiver along the specific ways and channels. In the process of moving, the route of risk factors is the risk propagation path. It is necessary to study the risk propagation, because it makes the planning, inventory, schedule and other related factors which are not directly at risk also affected. Therefore, as an example to improve the accuracy of risk assessment, it is necessary to introduce risk propagation factors into risk assessment. Through discussion with planners during the investigation in SWS, it is known that there is a high degree of correlation between the plans formulated by various departments of the shipyard. For example, the distribution plan is based on the production plan and the concentralization plan. When there is a problem in one part, the risk will be transmitted and spread ring by ring along the business process in the plan, which will have an impact on other plans and ultimately affect the production progress, resulting in inventory backlog and delay of cruise construction schedule, as shown in Figure 2, in which “ab” indicates that the risk of a will be transferred to b, while there is a two-way arrow between a and b, which means that the risks at a and b are 3ransferred to each other.
(2)
Effect analysis of risk propagation
In this paper, a system dynamics (SD) model is built to compare and analyze the risk factors mentioned above from the perspective of risk propagation intensity and ripple effect.
  • System dynamics model construction
The determination of model boundary is a key step in SD modeling. Based on the comprehensive research results and the actual situation of cruise construction, this paper sets the boundary range of risk propagation system of concentralized distribution logistics plan in cruise construction. In order to ensure the realizability of the model, the following basic assumptions are made:
  • As mentioned above, the concentralized distribution logistics plan risk system consists of five subsystems: production plan change risk, purchase plan change risk, warehousing plan change risk, pallet concentralization plan change risk and distribution plan change risk.
  • The direct influence of natural, political, technological and other macro conditions on each subsystem is not considered.
  • The influence of further risk sources of the risk factors is not considered, such as the reasons which cause the design change, such as change of ship owner’s demand, the withdrawal of the classification society and so on.
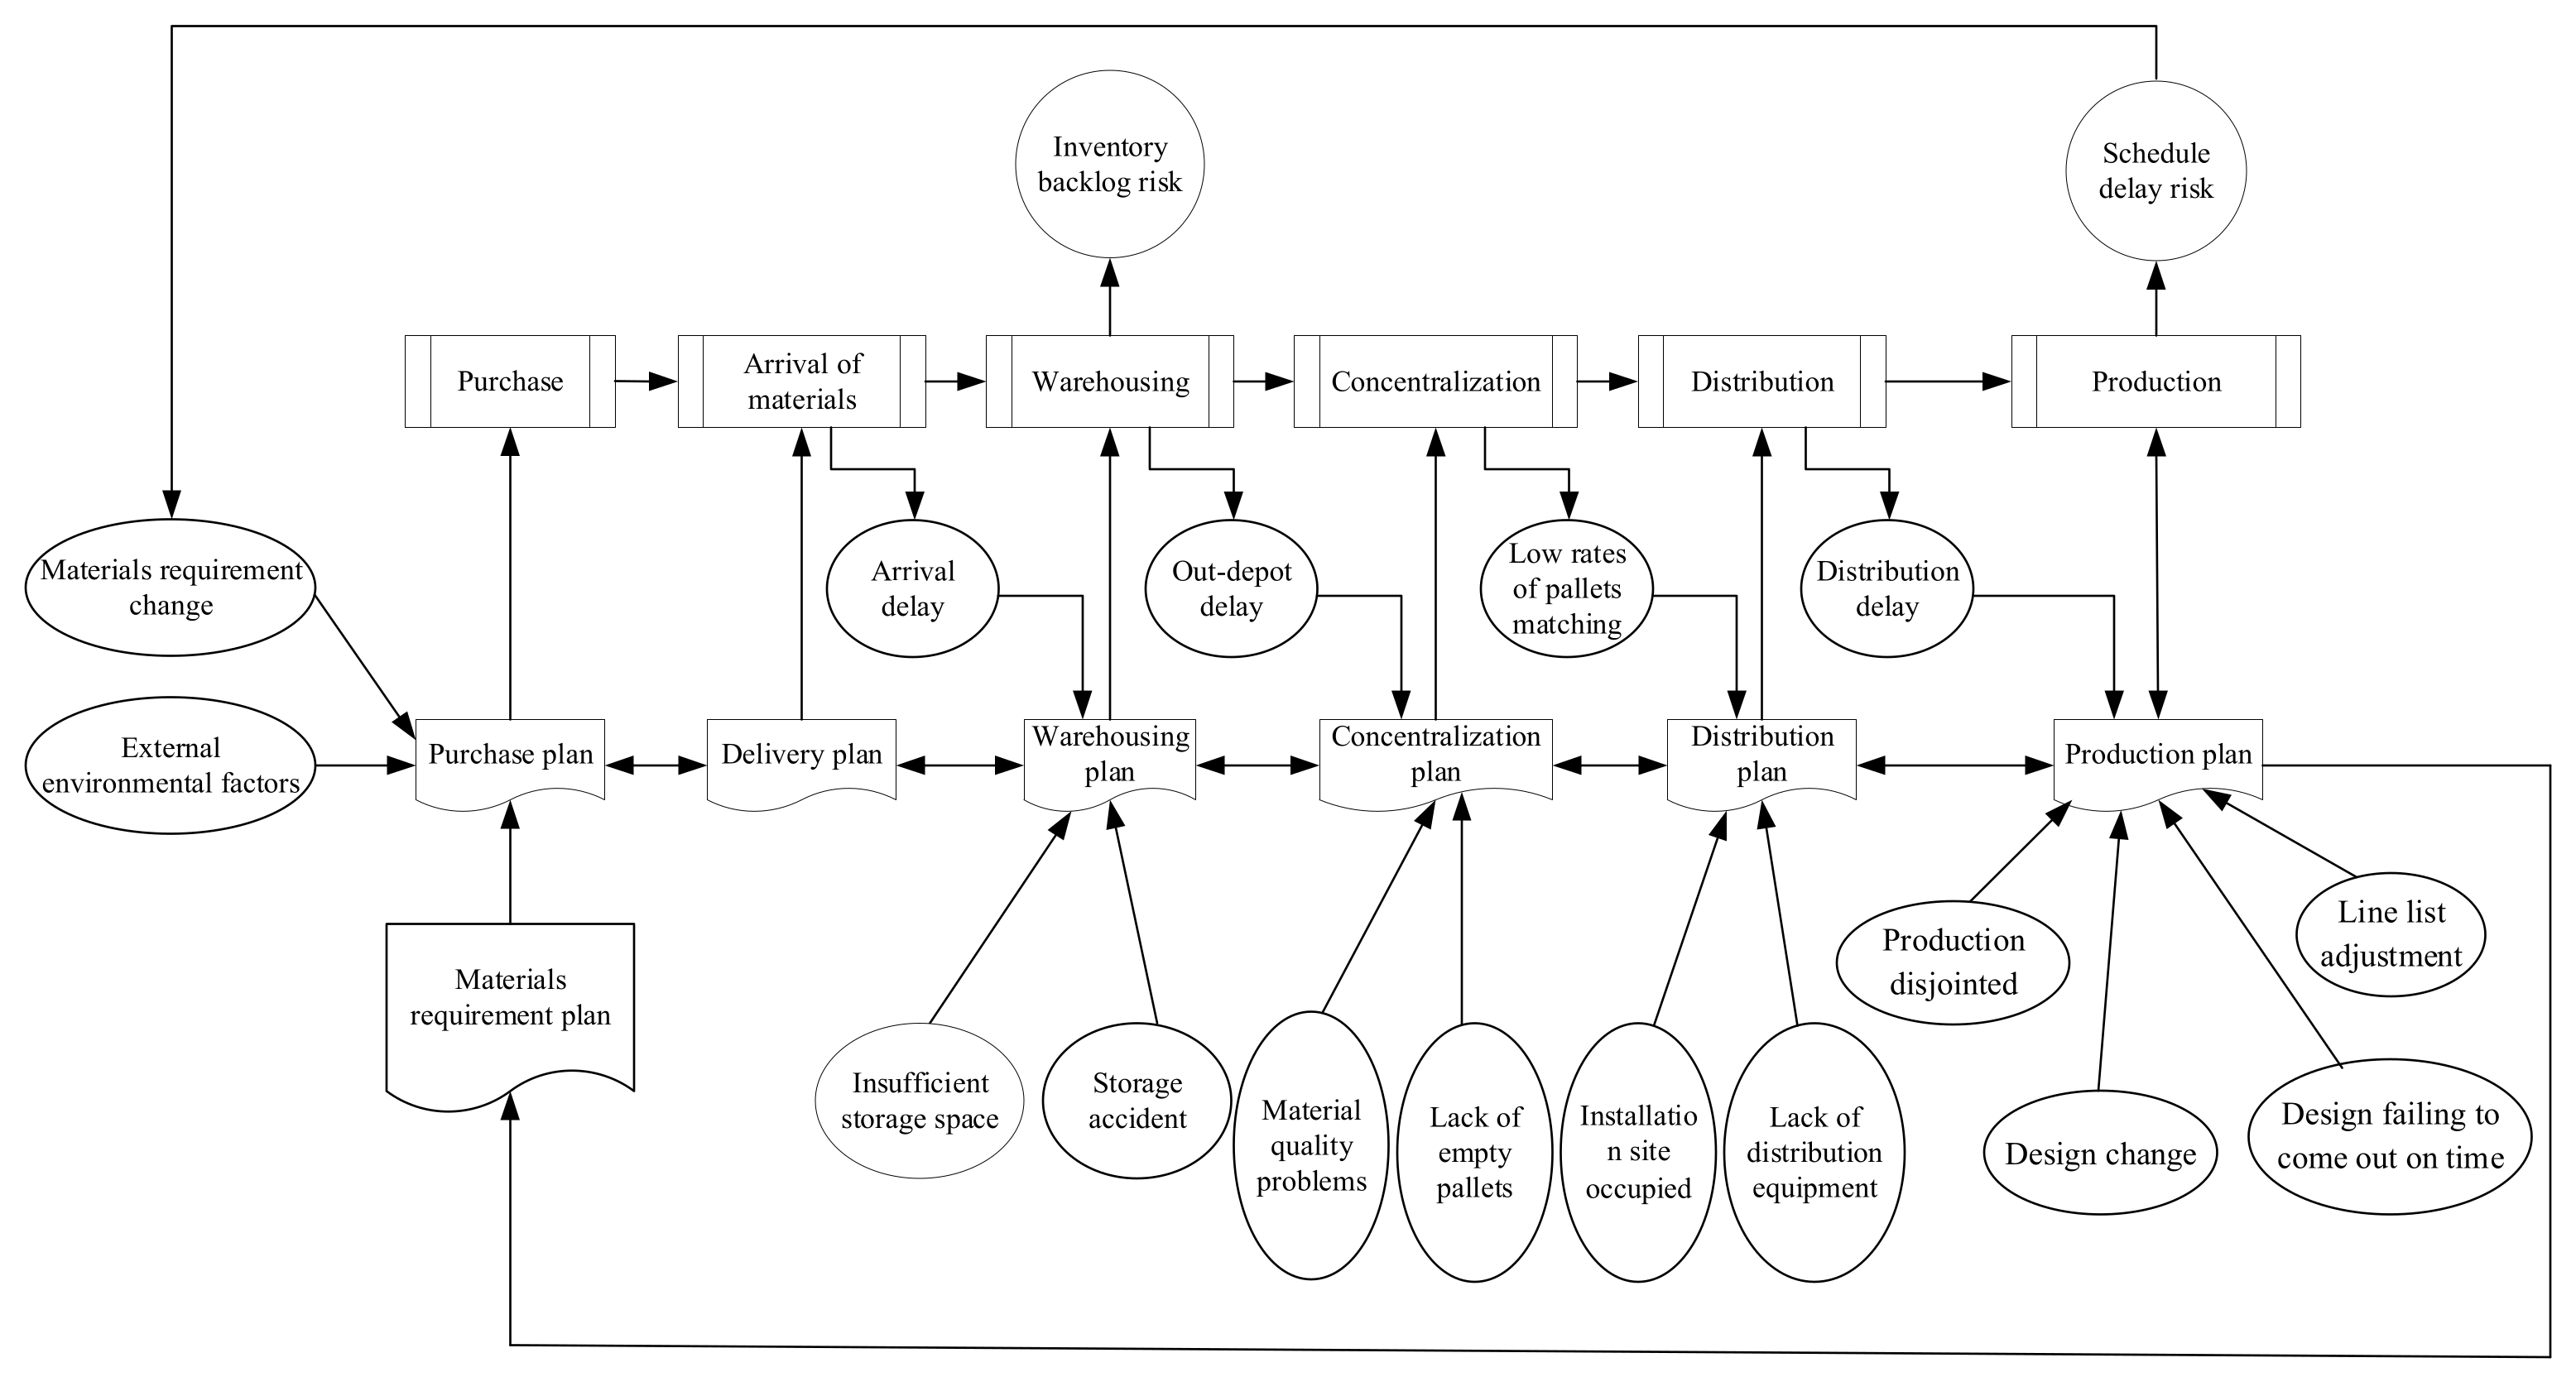
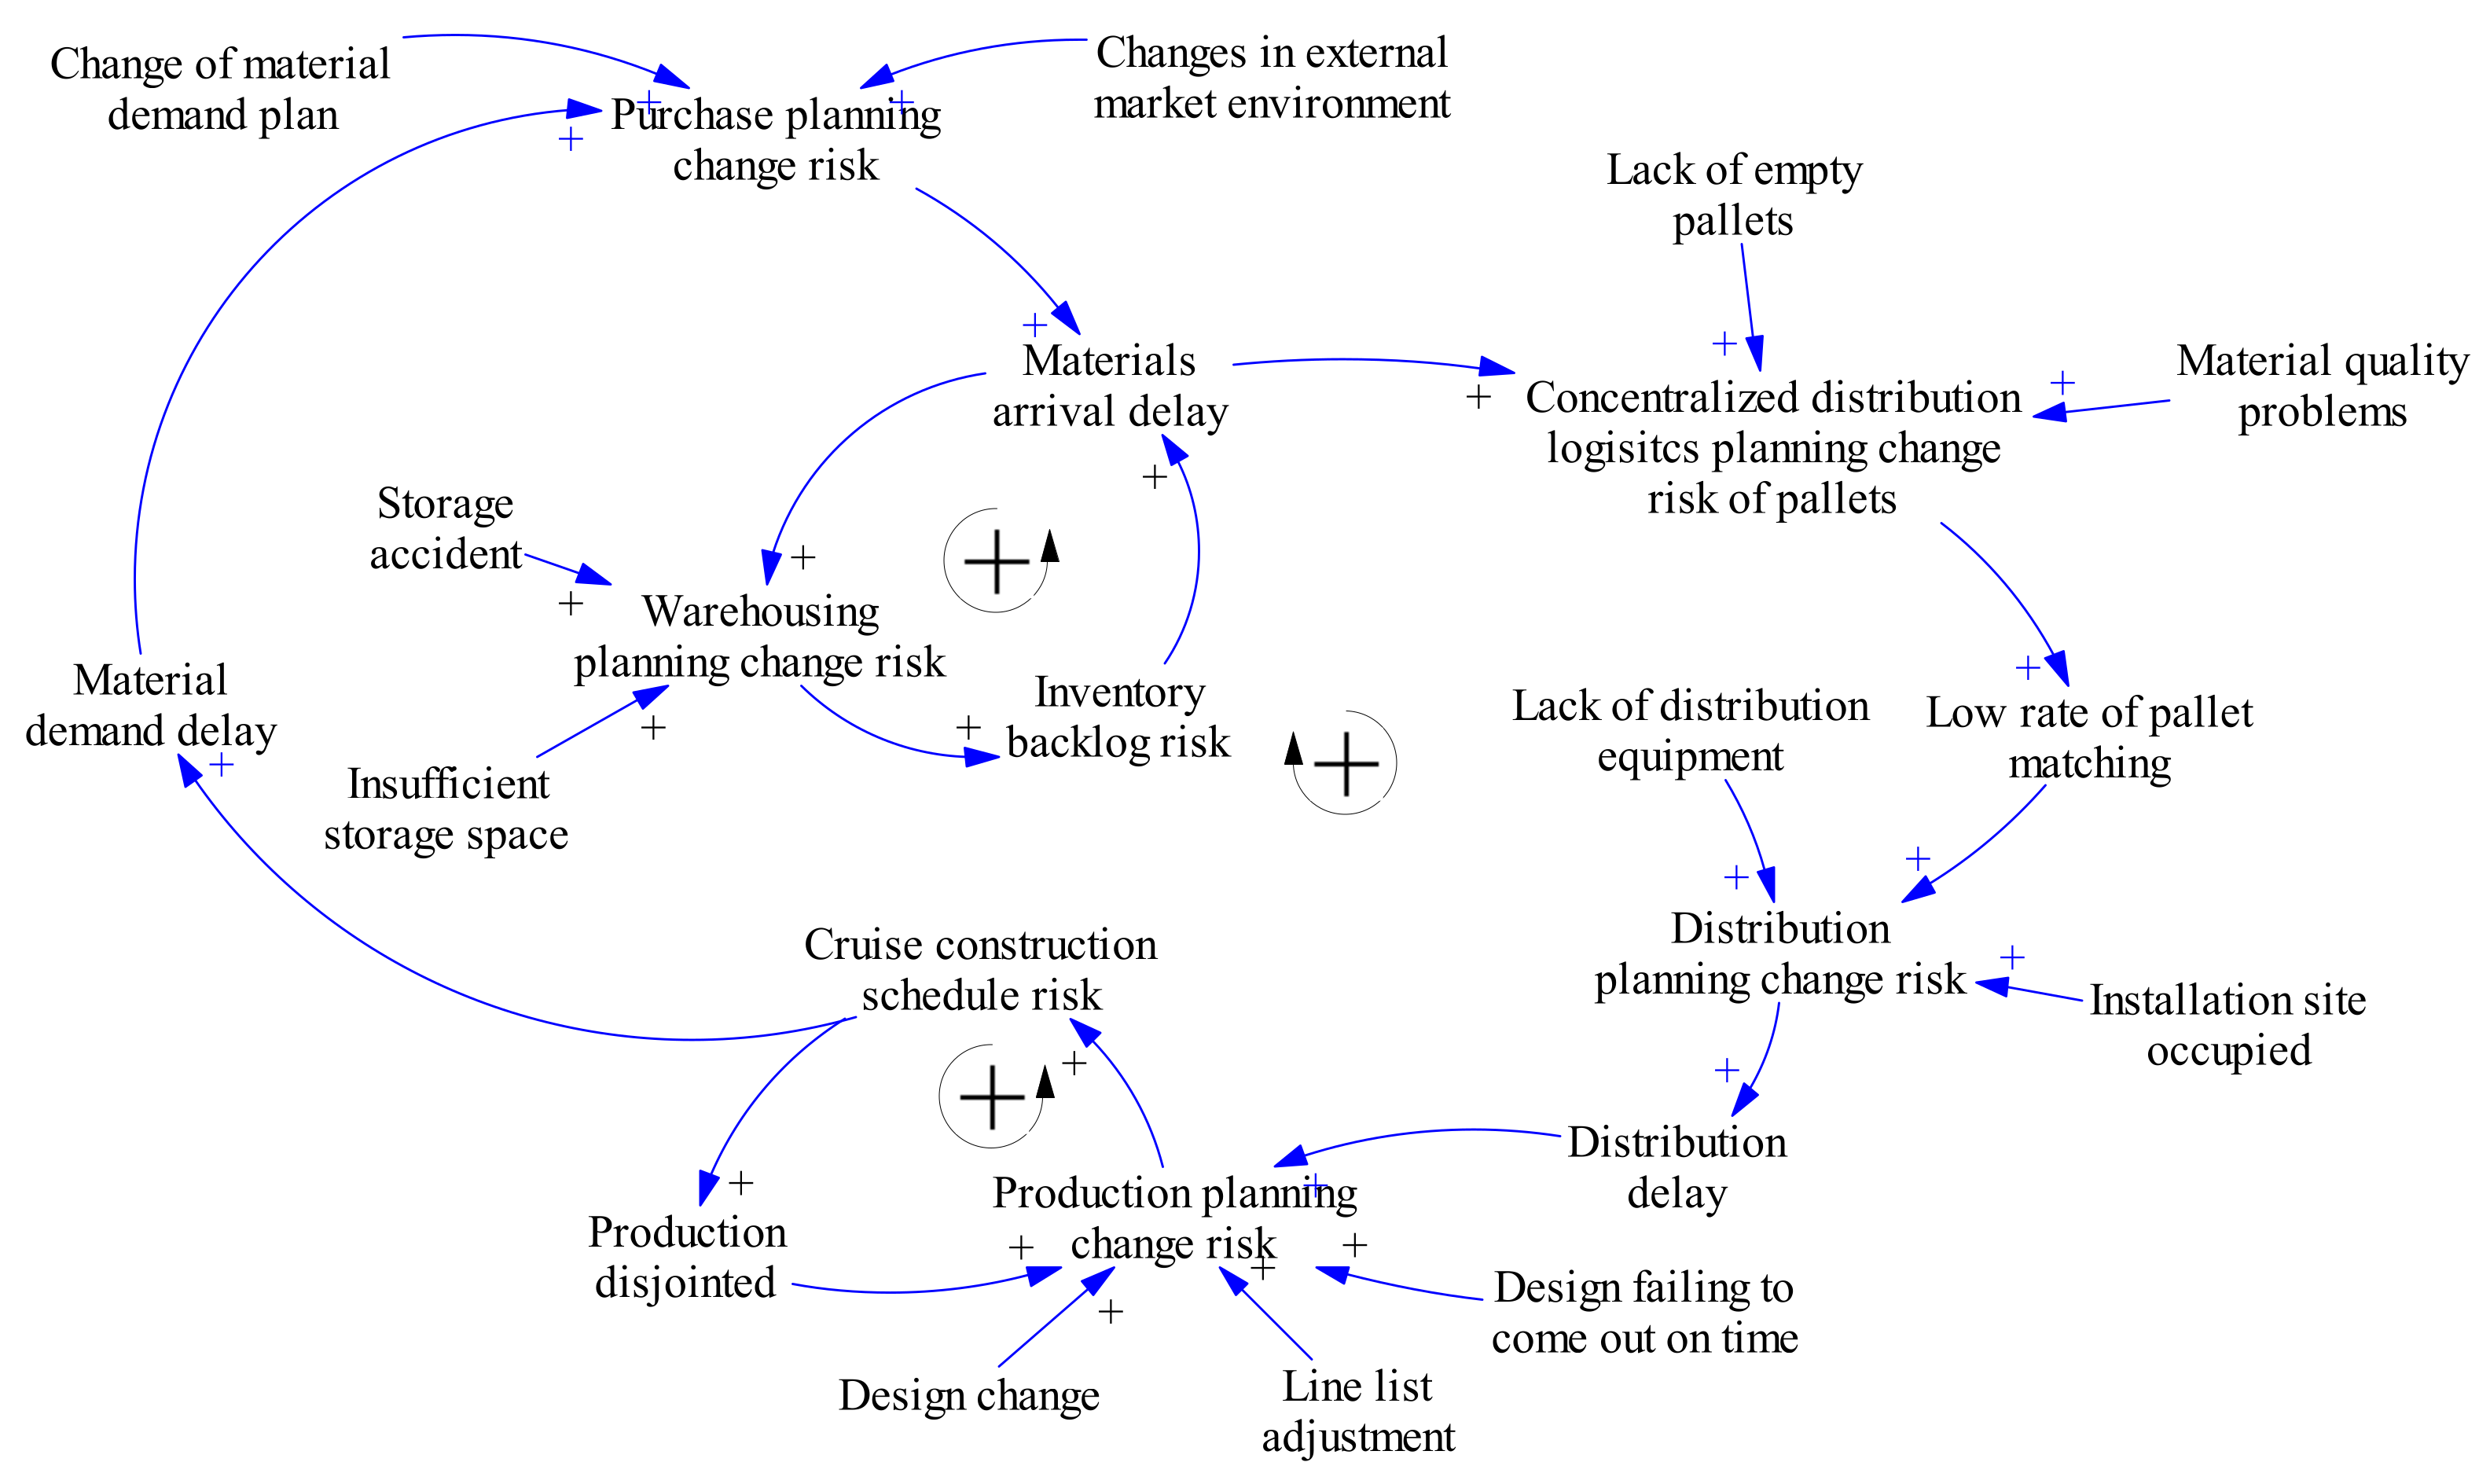
In order to simplify the calculation and maintain logical rationality, a SD model is constructed as follows. The causal diagram is shown in Figure 3 and the stock and flow diagram is shown in Figure 4.
b.
Variable description
  • State variables
There are five state variables, namely purchase plan change risk, warehousing plan change risk, pallet concentralization plan change risk, distribution plan change risk and production plan change risk.
  • Rate variables
There are five rate variables, namely purchase plan change, warehousing plan change, pallet concentralization plan change, distribution plan change, and production plan change.
  • Auxiliary variables and constants
Auxiliary variables are intermediate variables in the process of information transfer and transformation between state variables and rate variables. In this study, the arrival delay, low pallet matching rate, delivery delay, material requirement delay, cruise construction schedule risk and inventory backlog risk are the auxiliary variables, and the 12 risk factors listed in the previous planning system are constant.
  • Determining the relationship between system variables
Table function, regression analysis and other methods are generally used to determine the relationship between variables in SD. In order to simplify the calculation, this study adopts the dimensionless form of variable units, and uses the combination of analytic hierarchy process and coefficient of variation method to determine the weight relationship between variables, and then to determine the relationship equation between variables.

3.2.2. Weight Calculation for Risk Factors

The most basic way to determine the weight is to get the index weight through the analytic hierarchy process (AHP), but this method has certain subjectivity. Therefore, this paper uses the combined weight to reduce the weight deviation, through combining the AHP for determining the subjective weight and the variation coefficient method for determining the objective weight. Adoption of this combination is to scientifically reflect the real state of the risk on the concentralized distribution logistics plan system in cruise construction.
  • Determination of initial weight with AHP
In this paper, AHP is used to determine the subjective weight as the initial weight. In AHP, the importance of the risk factors in the current level corresponding to that in the upper level is different. It is necessary to determine the importance degree namely the weight value, which is usually scored by expert survey method.
Based on the data of experts in the questionnaire survey, the weight of each index at the first level (with three decimal places reserved) is as follows:
v 1 = 0.078 , 0.338 , 0.198 , 0.307 , 0.079
b.
Determination of objective weight with coefficient of variation method
Coefficient of variation is a statistic to measure the degree of variation of objective measurement, and the coefficient of variation of each index is used to measure the degree of variation of each index. The calculation formula is as follows:
                V i = σ i x ¯ i            
where, V i is the coefficient of variation of index, σ i is the standard deviation of index i, x ¯ i is the average of index i.
The objective weight formula of each index is as follows:
u i = V i i = 1 n V i
Based on the data of experts, the final weights of the coefficients of variation for each index of the first level (with three decimal places reserved) are as follows:
u 1 = 0.374 , 0.146 , 0.108 , 0.123 , 0.249
c.
Determine the combination weight
Set the weight linear combination as:
w i = α × V i + 1 α × u i
where, w i is the combination weight of risk factors, α is the proportion of combination weight in AHP algorithm,   1 α   is the proportion of combination weight under the coefficient of variation algorithm, v i is the weight of index i, u i is the weight of the variation coefficient of the index i.
The objective function is established to minimize the squares sum of deviation, w i , denoted as z :
min z = i = 1 n [ w i v i 2 + w i u i 2 ]
The results are as follows:
min z = i = 1 n { α × v i + 1 α × u i v i 2 + α × v i + 1 α × u i u i 2 }      
Find the first derivative with respect to α and set it to 0 to obtain:
α = 0.5
Get the combined weight formula:
w i = α × V i + 1 α × u i
Then, the comprehensive weight vector is denoted as:
A 0 = w 1 , , w i
Synthesizing the data, the final combined weights (reserving three decimal places) of the indicators of the first level are as follows:
w 1 = 0.226 , 0.242 , 0.153 , 0.215 , 0.164
In the same way, the relative weight of each risk factor in each layer can be obtained. The weights of risk factors at each level are shown in Table 1.

3.2.3. Determination of the Initial Value of Risk Factors

This paper uses expert scoring method to estimate the value of risk factors, 12 in total. In order to ensure the consistency of the data, the risk factors are assigned in the range of zero to one. A zero means that the probability of risk occurrence is zero, and one means that the probability of risk occurrence is 100%. This study first designed an expert questionnaire and invited 15 experts in SWS in the field of cruise construction projects to score and rank the border risk factors. After statistical analysis of data, the numerical estimates of border risk factors are shown in Table 2. All 15 experts have worked in SWS for more than five years, including two planners in the concentralized distribution department, one manager in the concentralized distribution department, two warehouse administrators, two distribution personnel in the logistics center, two designers, two planners in the production management department, two technicians in the cruise project department and two technicians in the coating department. Due to the particularity of large cruise project, it is not convenient to disclose the details of 15 experts here.

3.2.4. Establishment of System Dynamics Logic Equations

  • Procurement planning change risk subsystem
Materials arrival delay = 0.6 × purchase planning change risk + 0.4 × inventory backlog risk
Purchase planning change = 0.2 × changes in external market environment + materials demand delay × 0.4 + changes of material demand planning × 0.4
Purchase planning change risk = INTEG(purchase planning change, 0)
b.
Warehousing planning change risk subsystem
Warehousing planning change = 0.1 × storage accident + 0.5 × insufficient storage space + 0.4 × materials arrival delay
Warehousing planning change risk = INTEG(warehousing planning change + 0.066 × purchase planning change risk, 0)
Inventory backlog risk = 0.65 × warehousing planning change risk + 0.35 × concentralized distribution planning change risk of pallets
Materials arrival delay = 0.66 × purchase planning change risk + 0.34 × inventory backlog risk
c.
Concentralized distribution logistics planning change subsystem
Concentralized distribution planning change of pallets = 0.35 × materials arrival delay + 0.35 × material quality problems + 0.3 × lack of empty pallets
Concentralized distribution planning change risk of pallets = INTEG(concentralized distribution planning change of pallets, 0)
d.
Distribution planning change risk subsystem
Distribution planning change = 0.6 × low rates of pallets matching + 0.2 × installation site occupied + 0.2 × lack of distribution equipment
Distribution planning change risk = INTEG(distribution planning change + 0.019 × concentralized distribution planning change risk of pallets, 0)
Distribution delay = 0.58 × distribution planning change risk
e.
Production planning change risk subsystem
Production planning change = 0.25 × production disjointed + 0.35 × design change + 0.1 × line list adjustment + 0.2 × design failing to come out on time + 0.1 × distribution delay
Production planning change risk = INTEG(production planning change + 0.012 × distribution planning change risk, 0)
Cruise construction schedule risk = 0.68 × production planning change risk + 0.12 × distribution planning change risk + 0.2 × design change
f.
Inventory backlog risk
Inventory backlog risk = 0.65 × warehousing planning change risk + 0.35 × concentralized distribution planning change risk of pallets
g.
Cruise construction schedule risk
Cruise construction schedule risk = 0.68 × production planning change risk + 0.12 × distribution planning change risk + 0.2 × design change

4. Results and Discussion

4.1. Planning Change Risk Assessment

The SD software Vensim PLE is used for simulation. The running time of the model is set as one hundred days, the initial running time is zero, and the time step is one. The trend chart of cruise construction schedule delay risk and inventory backlog risk caused by the plan change risk of concentralized distribution logistics in cruise construction (as shown in Figure 5) and the risk trend of each level variable within a given time range (as shown in Figure 6) are obtained. In the system, the influence of variables on variables mainly reflects a positive feedback effect, so the risk trend chart shows an upward trend.

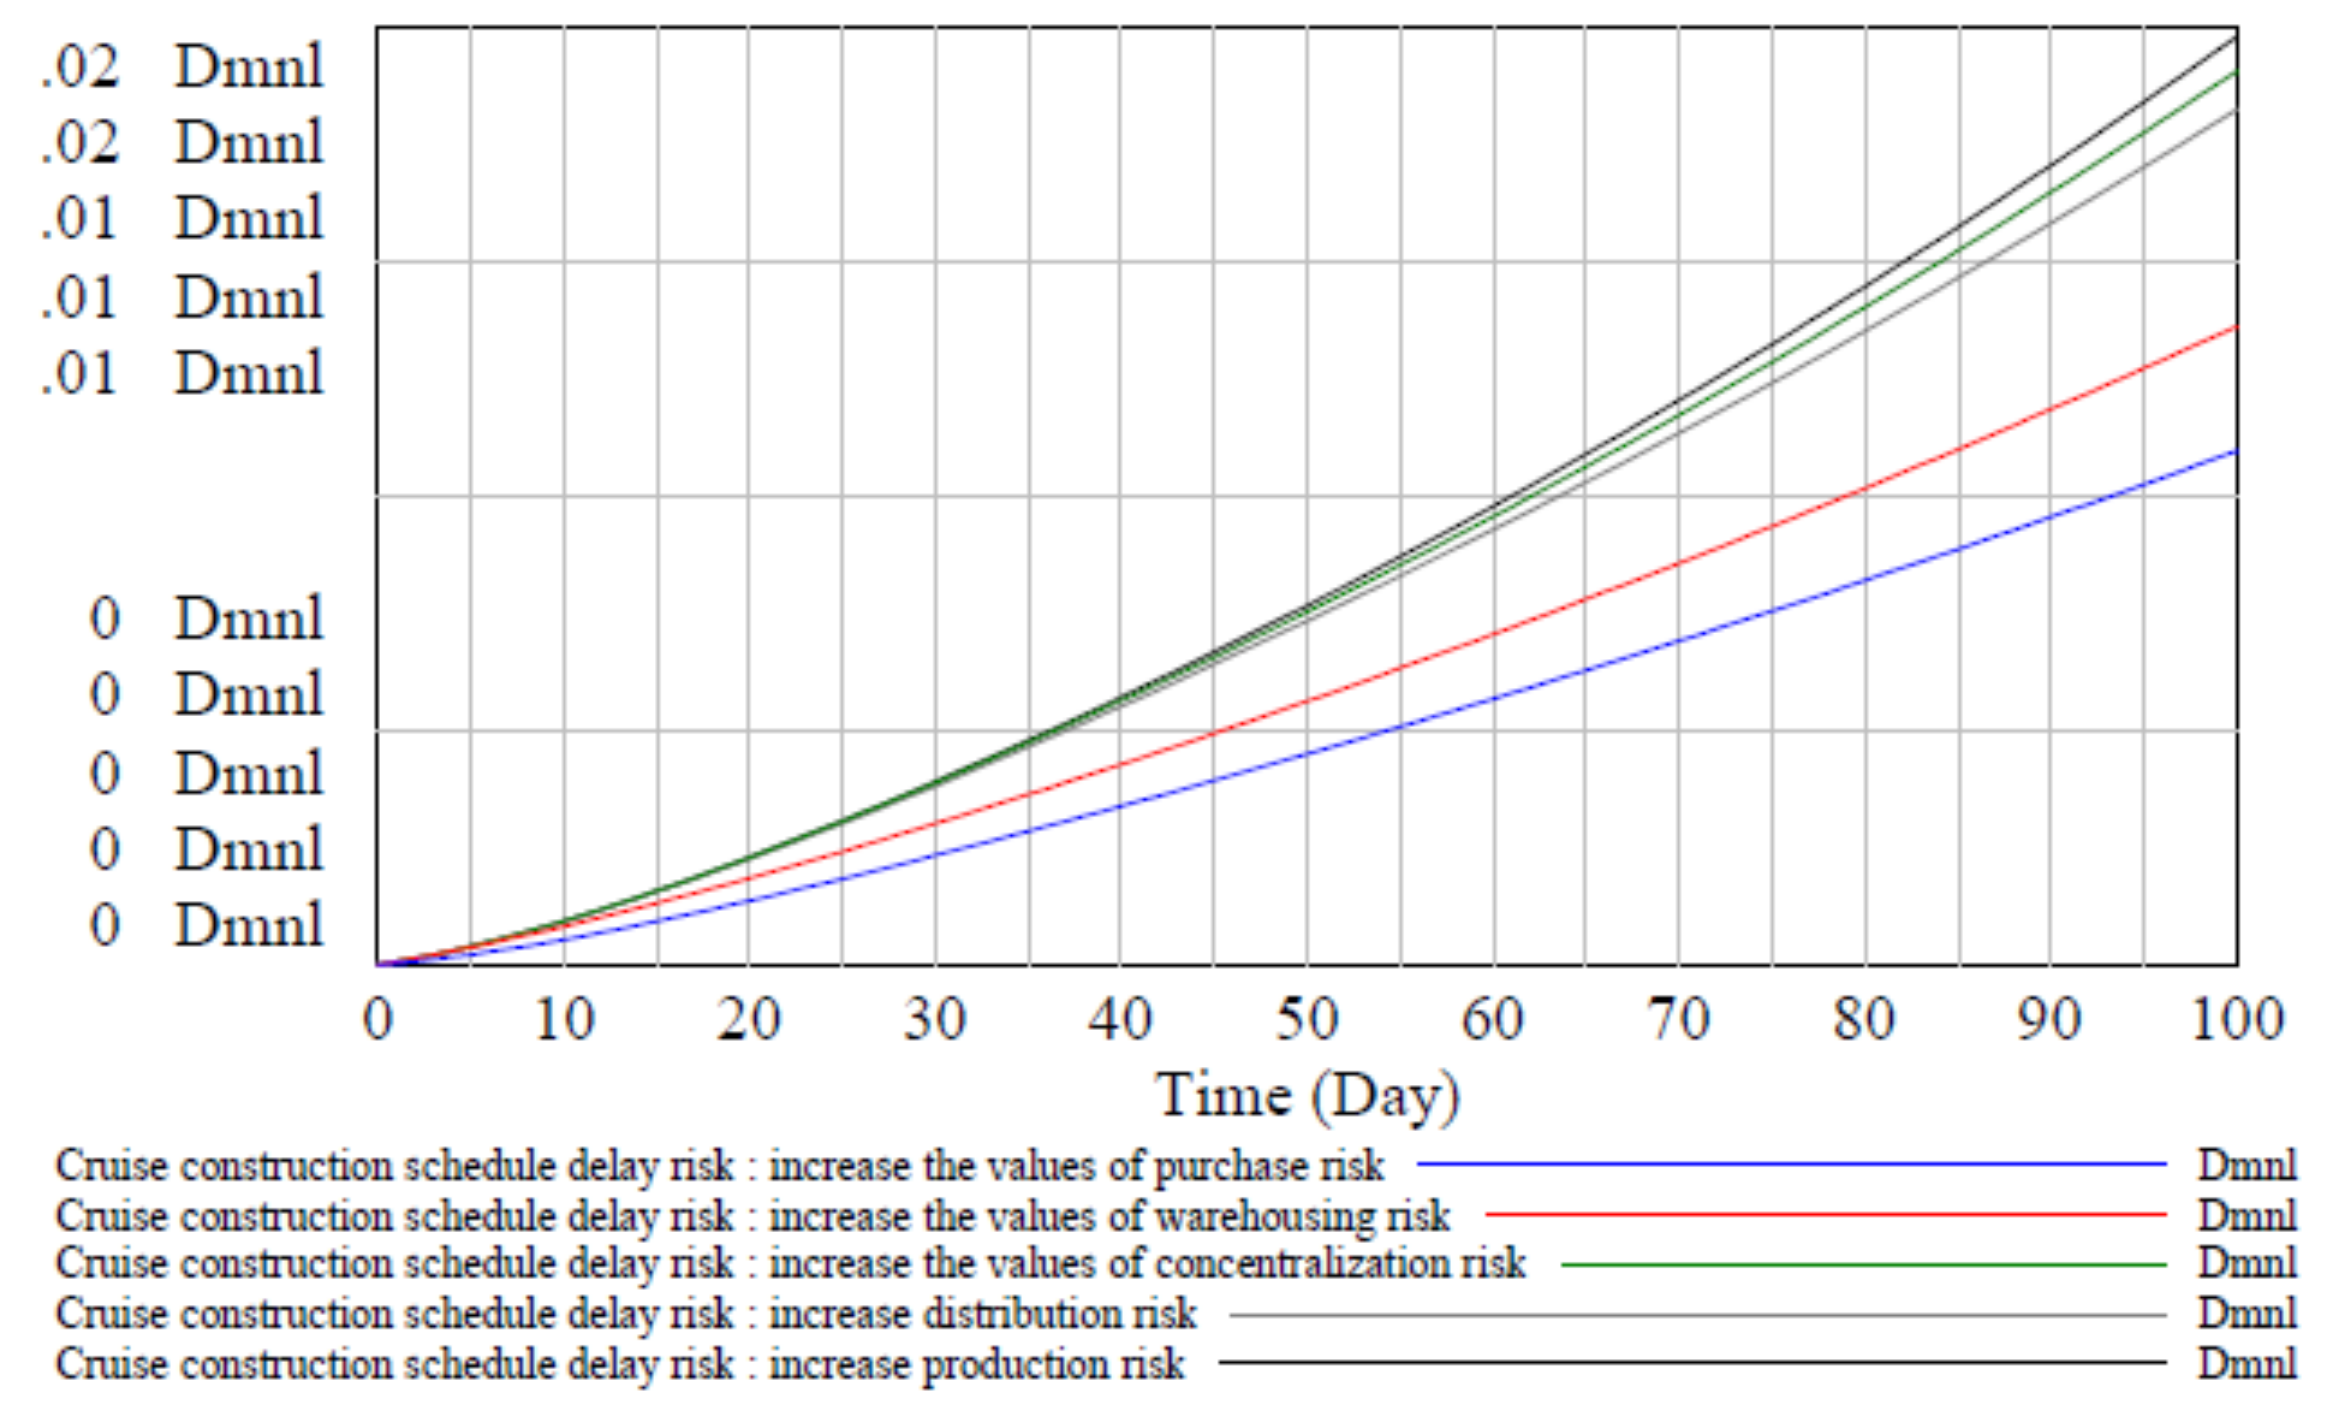
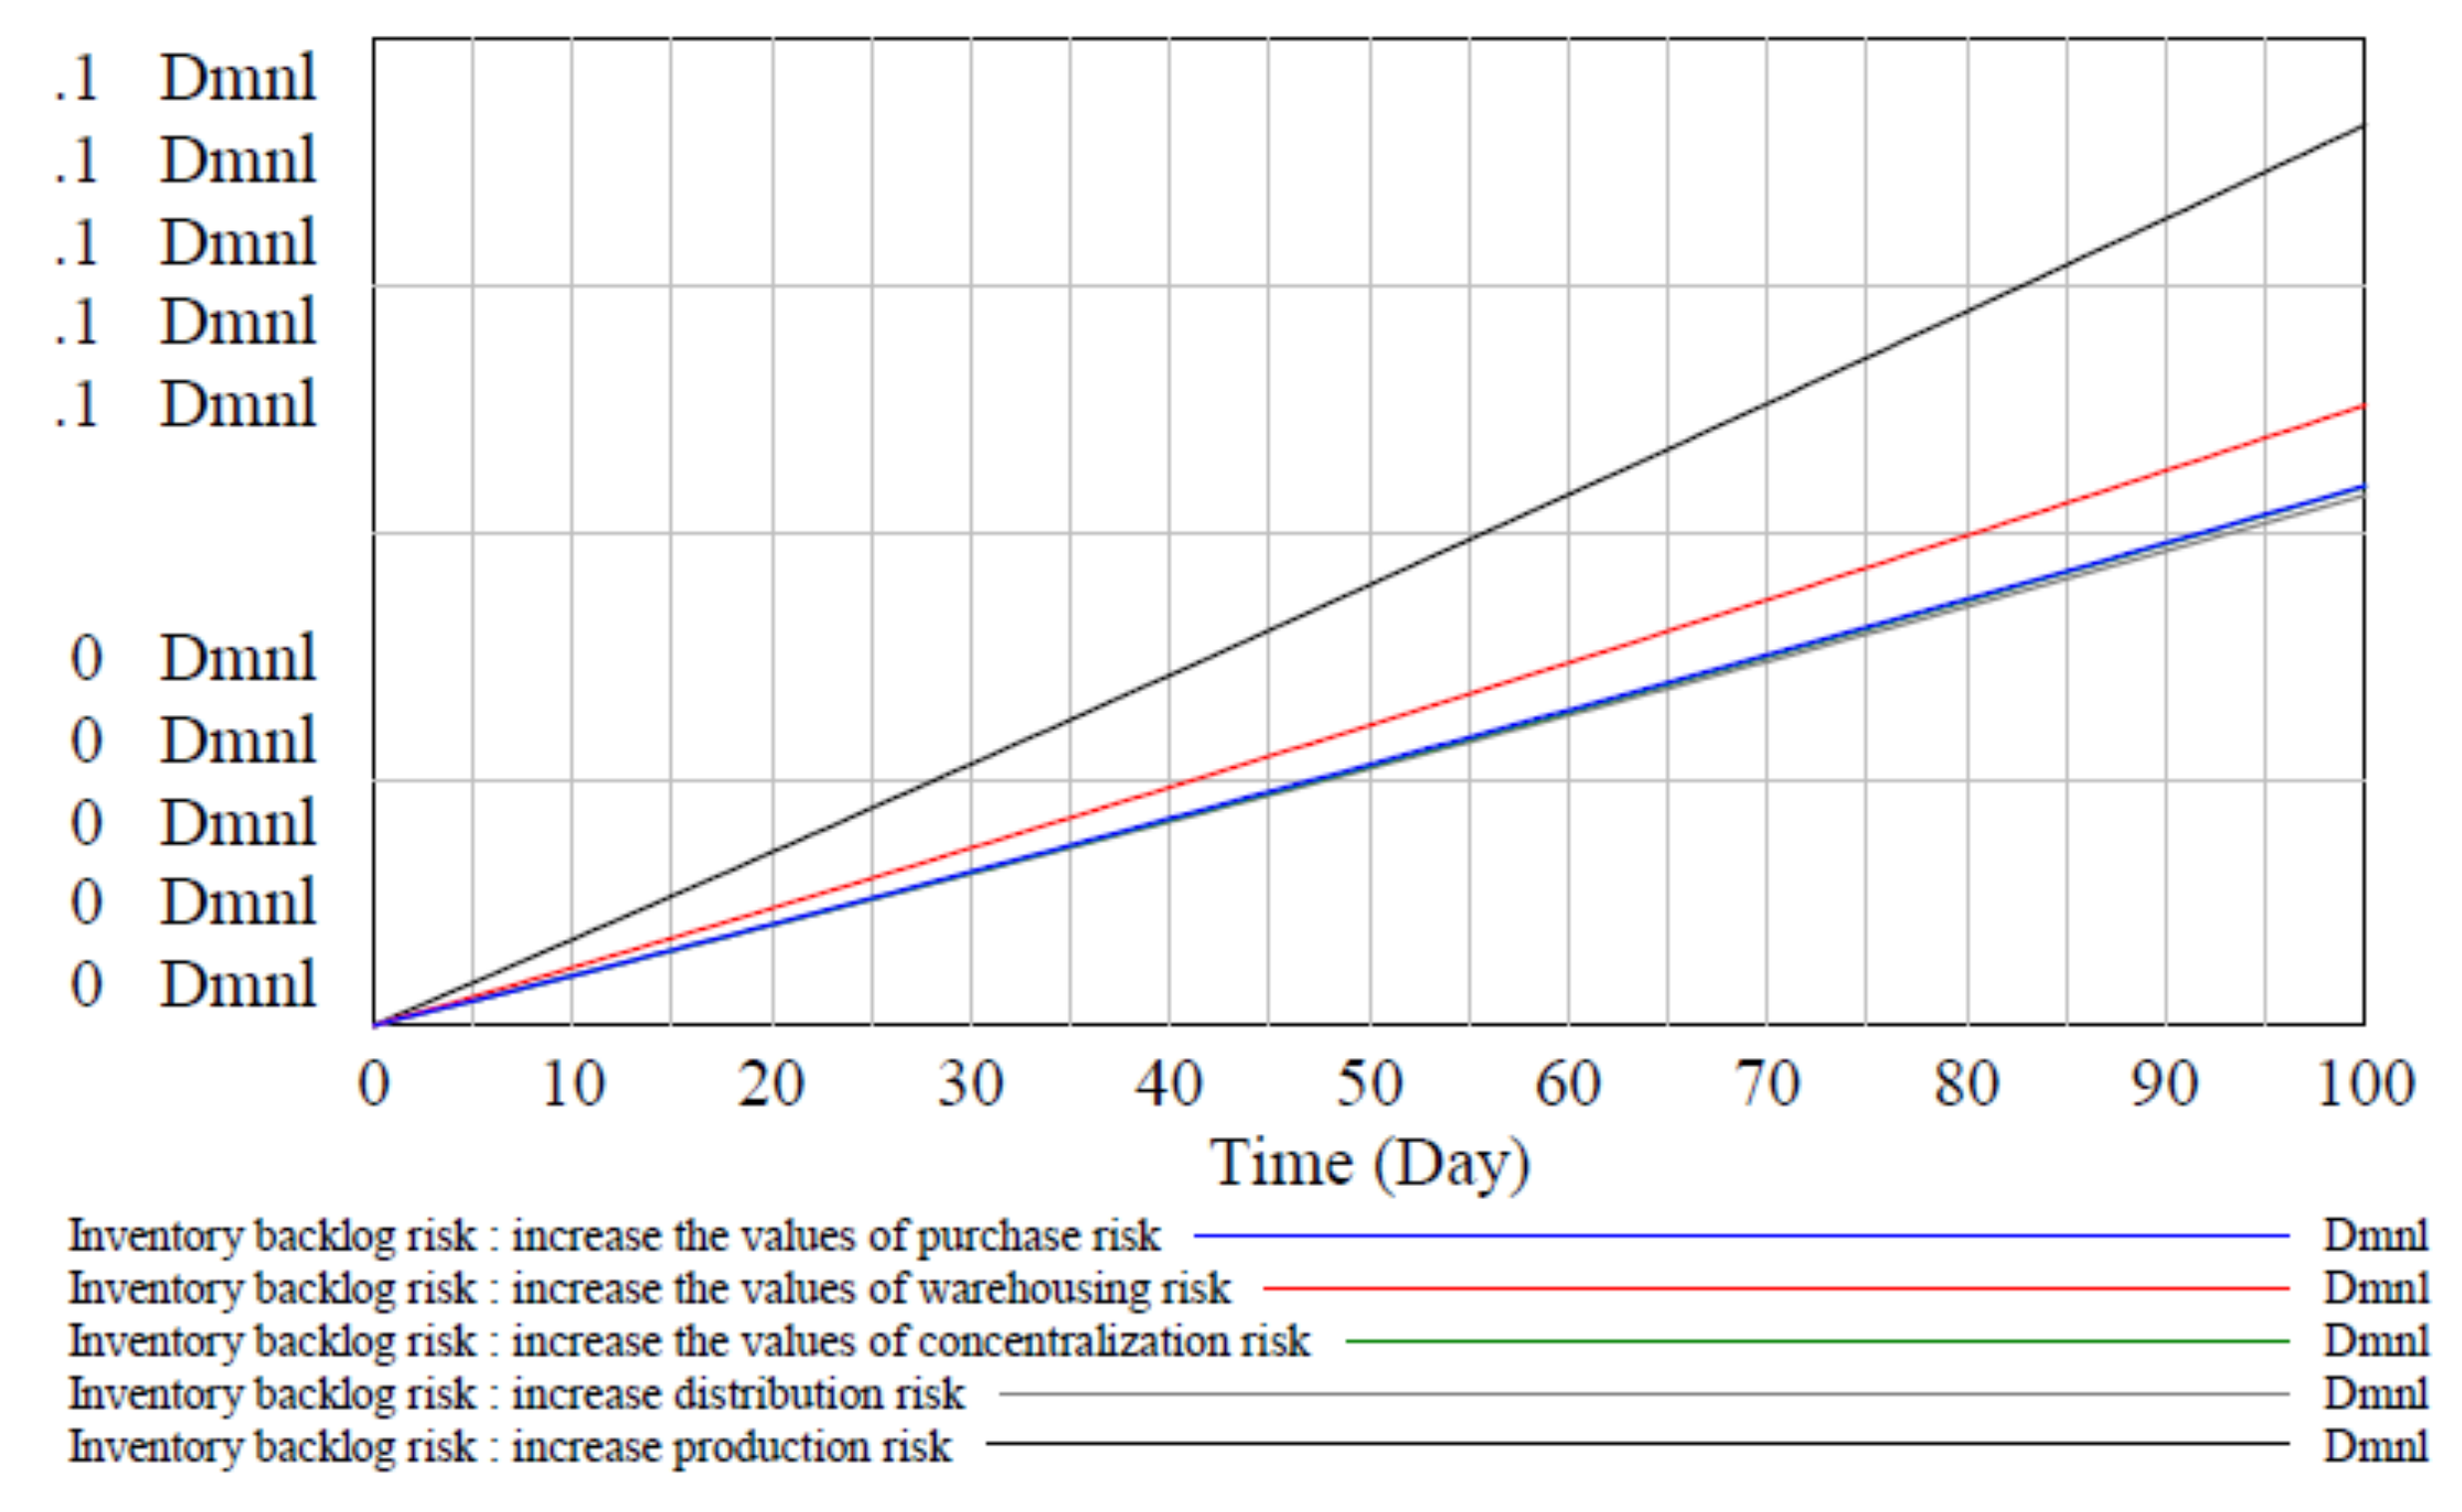
4.2. Sensitivity Analysis

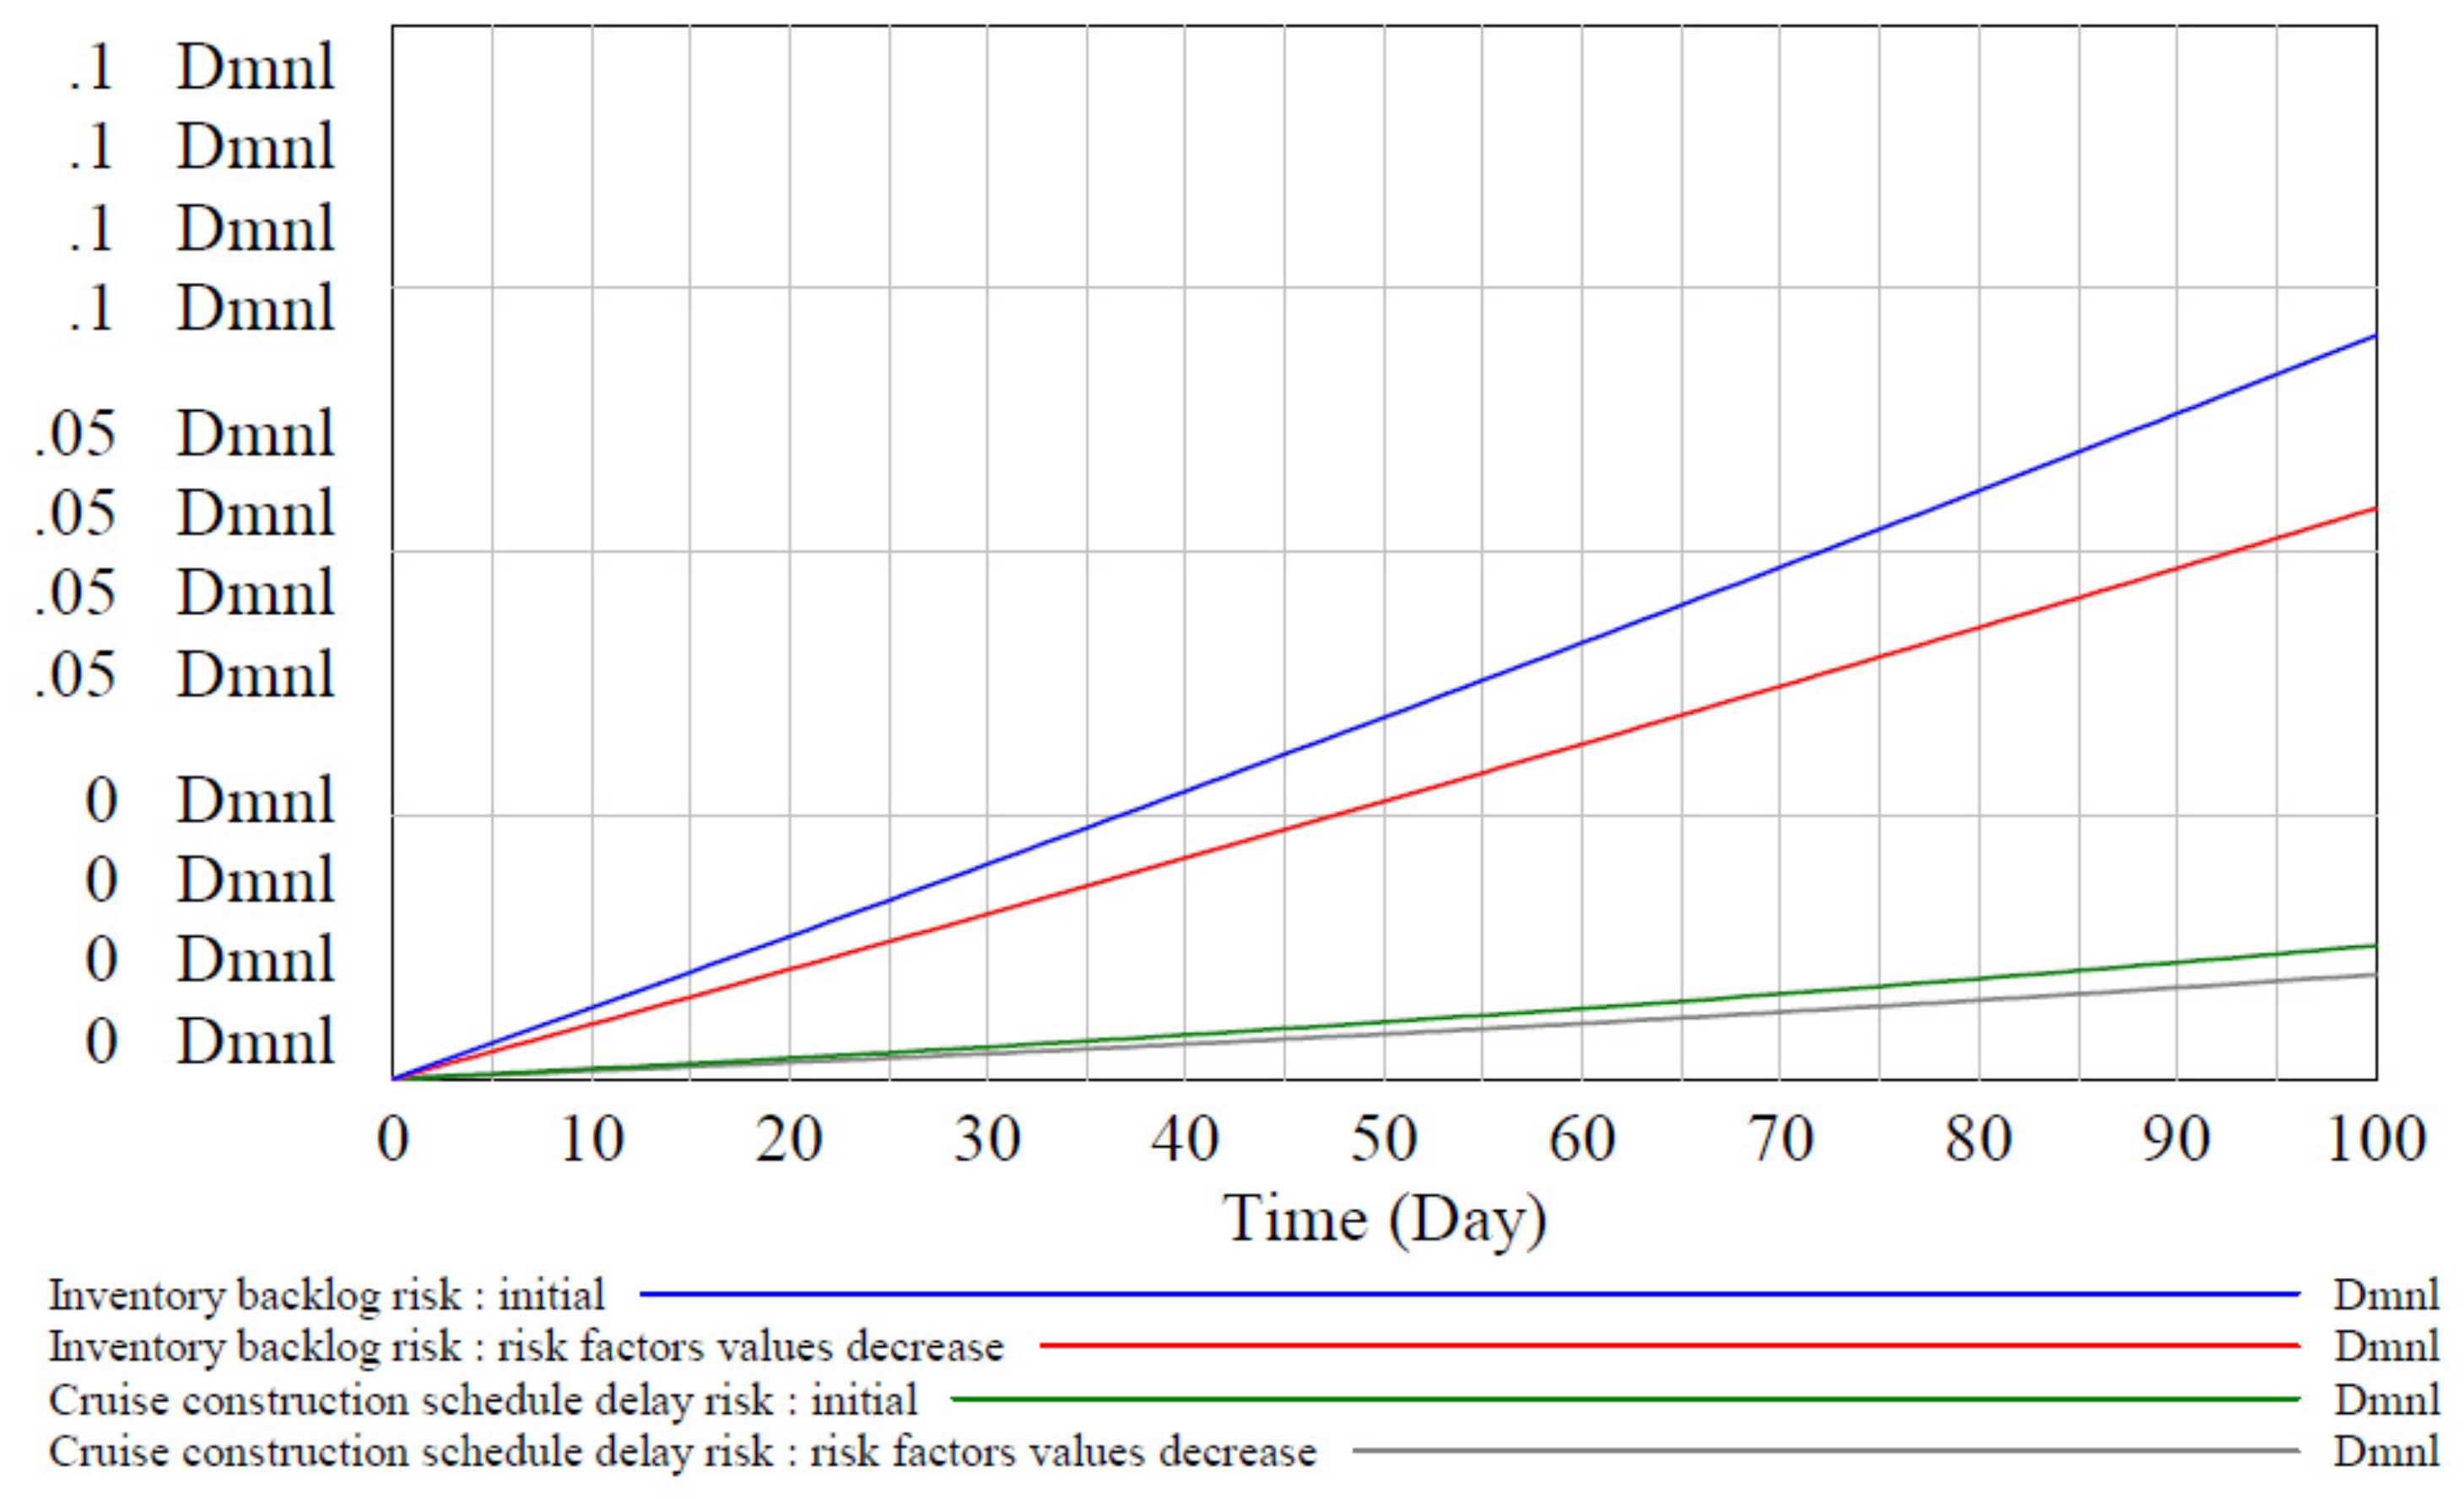
  • Reducing the initial values of 12 risk factors by 0.05
The risk result chart as shown in Figure 7 was obtained. The blue line represents the inventory backlog risk trend before the change, the red line represents that after the values of all risk factors decreases with 0.1. Similarly, the green and gray lines represent the cruise construction schedule delay risk trend before and after the change, respectively. It is found that the consequences of both types of risks have weakened when the risk factors’ values decrease.
b.
Sensitivity analysis of two risk consequences
In order to find out the most sensitive risk factors of the two kinds of risk consequences, simulation with separate increasement of 0.1 for the five basic categories of risk factors is carried out, with the results shown in Figure 8 and Figure 9, respectively. From the result in Figure 8, it can be concluded that the order of sensitive factors of cruise construction schedule delay risk is: production plan risk factor > pallet centralization risk factor > distribution plan risk factor > warehousing plan risk factor > purchase plan risk factor. Figure 9 shows the sensitivity analysis result for inventory backlog risk, which are very different from Figure 8. For the inventory backlog risk, the production plan risk factor is the most sensitive one, followed by the warehousing plan risk factor, but the other three risk factors are almost the same.

4.3. Discussion

The risk trend charts in Figure 5, Figure 6, Figure 7, Figure 8 and Figure 9 all show that with the passage of time, the risk has an increasing trend. This is because in the whole process of concentralized distribution logistics, no measures are taken to restrain the risk. If some control measures are added, such as inventory adjustment or process duration adjustment strategy, the risk fluctuation chart will be obtained. Since this paper is not to discuss the effectiveness of risk control strategy, this part is not discussed. It can be further discussed in the future research to provide risk control strategies for decision makers.
The most sensitive factor for both inventory backlog and cruise construction schedule delay are the same, production plan change, because production plan is the source of concentralized distribution logistics plan. The delay of production plan will destroy the distribution plan, thus destroying the pallet concentralization plan and the delivery plan. After the materials are delivered from the suppliers, especially those which of great importance, it is difficult for refuse materials to enter the warehouse. Hence it is difficult to adjust the in-depot plan. In this case, it is easy to cause the problem of insufficient storage capacity caused by the overstock of inventory. As for the cruise ship construction schedule delay risk, if the schedule is not adjusted after the production plan is changed, such as working overtime, the whole construction schedule will certainly be delayed. The causes for other sensitive factors of cruise construction schedule delay risk and inventory backlog risk can be analyzed by deducing their respective risk propagation paths from Figure 2.
The high dependence of research conclusions on data is a major limitation of this paper. During the research, it is found that the adjustment of some risk factor values in Table 1 and Table 2 will have a certain impact on the results. Taking Table 2 as an example, although the data in Table 2 are obtained in SWS, in fact, some data are highly representative. For example, the estimated value of storage accident is 2%, which is very reasonable, because actually every shipyard now pays much attention to warehouse safety. Of course, there are some exceptions. There is an example. According to the investigation, the production plan in Nantong COSCO KHI Ship Engineering Co., Ltd. (NACKs) changes very little. While the conclusion of this paper is that the change of production plan is the most important risk factor. It is conceivable that this is not in line with the situation of NACKs. If the experts from NACKs are consulted, different results should be obtained.

5. Conclusions

How to make concentralized distribution of materials better serve the production is an important problem to solve for shipyards. The shipbuilding plan is a management method to complete shipbuilding in a safe, high-quality, efficient and low-cost way. The function of the centralized distribution logistics plan is to make the centralized distribution of materials better connect with production. In the actual production activities, with the arrival of materials in the warehouse, the risk also arises. Plan change risk is a very important kind of plan risk. Identifying and evaluating the centralized distribution logistics plan change risk is the basis of making a risk control strategy.
The main contribution of this paper lies in the innovative analysis of the risk of concentralized distribution logistics plan in cruise building. The paper analyzes the composition of concentralized distribution logistics planning system in cruise construction, from the aspects of the procurement plan, warehousing plan, pallet concentralization plan, distribution plan and production plan. On this basis, the risk factors existing in each planning link and the risk propagation path are analyzed. A system dynamics model is built to simulate the risk propagation, which is a new application for system dynamics method. A total of twelve kinds of risk factors are considered as constants in the model as they are the source of planning change risk. The values of the risk factors are obtained by consulting experts through questionnaires. When establishing the relationship equation between variables, the weight of each risk factor is determined by an analytic hierarchy process and the coefficient of variation method. In part of the model simulation, it can be found that the simulation results are reasonable, which proves the rationality and feasibility of the model. Through sensitivity analysis, it is found that the production planning risk factor is the most sensitive one for both inventory backlog risk and cruise construction schedule delay risk.
It is worth mentioning that the results obtained in this paper are for the case study of HVAC materials in SWS. If for other materials, the results should change, since the SD simulation results depend much on the constant values and logic equations. Further, the results will be different for some other cruise building company. The limitation of the paper is analyzed in the discussion subsection above. Further study can be carried to investigate how the sensitive factors will change when using different logical equations for different materials and different companies. It will also be interesting to study other risk consequences, such as cost increase risk.

Author Contributions

Conceptualization, H.W. and J.K.; methodology, Y.Z. and J.K.; software, Y.Z. and J.K.; validation, Y.Z.; formal analysis, J.K.; data curation, J.K.; writing—original draft preparation, Y.Z.; writing—review and editing, H.W. and J.K.; funding acquisition, H.W. All authors have read and agreed to the published version of the manuscript.

Funding

This research was funded by large cruise R & D project in China, Grant Number MC-202009-Z03.

Acknowledgments

The authors would like to thank Yifeng Zhang, a graduate of Wuhan University of technology in 2021, for her inspiration on some methods used in the paper. The authors also would like to thank anonymous reviewers who gave valuable suggestion that has helped to improve the quality of the manuscript.

Conflicts of Interest

The authors declare no conflict of interest.

References

  1. Sun, L.; Liu, W.; Tang, L.; Bao, X.; Wang, X.; Zhang, Y.; Ge, Y.-E.; Huang, Y. Analyzing Network Attributes of Cruise Service Supply Chains. In CICTP 2016; American Society of Civil Engineers (ASCE): Reston, VA, USA, 2016; pp. 353–363. [Google Scholar]
  2. Véronneau, S.; Roy, J.; Beaulieu, M. Cruise ship suppliers: A field study of the supplier relationship characteristics in a service supply chain. Tour. Manag. Perspect. 2015, 16, 76–84. [Google Scholar] [CrossRef] [Green Version]
  3. Jpr, A.; Gwyw, B. Cruise shipping supply chains and the impacts of disruptions: The case of the Caribbean. Res. Transp. Bus. Manag. 2020, 9, 100551. [Google Scholar]
  4. Wang, G.; Zeng, Q.; Ghoram, L.C. The impacts of deviations from standard daily procedures on stock performance—A case study of Carnival Cruise Line. Marit. Bus. Rev. 2018, 3, 70–88. [Google Scholar] [CrossRef]
  5. Sun, X.; Jiao, Y.; Tian, P. Marketing research and revenue optimization for the cruise industry: A concise review. Int. J. Hosp. Manag. 2011, 30, 746–755. [Google Scholar] [CrossRef]
  6. Knnl, K.; Kangas, K.; Seppl, K.; Mäkelä, M.; Lehtonen, T. Considering sustainability in cruise vessel design and construction based on existing sustainability certification systems. J. Clean. Prod. 2020, 259, 120763. [Google Scholar]
  7. MacNeill, T.; Wozniak, D. The economic, social, and environmental impacts of cruise tourism. Tour. Manag. 2018, 66, 387–404. [Google Scholar] [CrossRef]
  8. Vayá, E.; Garcia, J.R.; Murillo, J.; Romaní, J.; Suriñach, J. Economic impact of cruise activity: The case of Barcelona. J. Travel Tour. Mark. 2018, 35, 479–492. [Google Scholar] [CrossRef]
  9. Papathanassis, A. Cruise tourism management: State of the art. Tour. Rev. 2017, 72, 104–119. [Google Scholar] [CrossRef]
  10. Wang, J.; Yin, J.; Khan, R.U.; Wang, S.; Zheng, T. A Study of Inbound Logistics Mode Based on JIT Production in Cruise Ship Construction. Sustainability 2021, 13, 1588. [Google Scholar] [CrossRef]
  11. Baryannis, G.; Dani, S.; Antoniou, G. Predicting supply chain risks using machine learning: The trade-off between performance and interpretability. Future Gener. Comput. Syst. 2019, 101, 993–1004. [Google Scholar] [CrossRef]
  12. Baryannis, G.; Validi, S.; Dani, S.; Antoniou, G. Supply chain risk management and artificial intelligence: State of the art and future research directions. Int. J. Prod. Res. 2019, 57, 2179–2202. [Google Scholar] [CrossRef]
  13. Han, J.; Lu, X. Research on Risk Management of Logistics Material Purchase. In Proceedings of the 2016 International Conference on Education, Management, Computer and Society, Shenyang, China, 1–3 January 2016. [Google Scholar]
  14. Choi, T.M.; Chiu, C.H.; Chan, H.K. Risk management of logistics systems. Transp. Res. Part E Logist. Transp. Rev. 2016, 90, 1–6. [Google Scholar] [CrossRef]
  15. Oger, R.; Bénaben, F.; Lauras, M.; Montreuil, B. Towards Decision Support Automation for Supply Chain Risk Management among Logistics Network Stakeholders—ScienceDirect. IFAC PapersOnLine 2018, 51, 1505–1510. [Google Scholar] [CrossRef]
  16. Hosseini, S.; Ivanov, D. Bayesian networks for supply chain risk, resilience and ripple effect analysis: A literature review. Expert Syst. Appl. 2020, 161, 113649. [Google Scholar] [CrossRef] [PubMed]
  17. Dubey, R.; Gunasekaran, A.; Childe, S.J.; Papadopoulos, T.; Blome, C.; Luo, Z. Antecedents of Resilient Supply Chains: An Empirical Study. IEEE Trans. Eng. Manag. 2019, 66, 8–19. [Google Scholar] [CrossRef]
  18. Pettit, T.J.; Croxton, K.L.; Fiksel, J. The Evolution of Resilience in Supply Chain Management: A Retrospective on Ensuring Supply Chain Resilience. J. Bus. Logist. 2019, 40, 56–65. [Google Scholar] [CrossRef]
  19. Behzadi, G.; O’Sullivan, M.J.; Olsen, T.L. On metrics for supply chain resilience. Eur. J. Oper. Res. 2020, 287, 145–158. [Google Scholar] [CrossRef]
  20. Ivanov, D.; Sokolov, B.; Dolgui, A. The Ripple effect in supply chains: Trade-off ‘efficiency-flexibility-resilience’ in disruption management. Int. J. Prod. Res. 2014, 52, 2154–2172. [Google Scholar] [CrossRef]
  21. Dolgui, A.; Ivanov, D.; Sokolov, B. Ripple effect in the supply chain: An analysis and recent literature. Int. J. Prod. Res. 2018, 56, 414–430. [Google Scholar] [CrossRef] [Green Version]
  22. Ivanov, D. Structural Dynamics and Resilience in Supply Chain Risk Management; Springer Science and Business Media LLC: Berlin/Heidelberg, Germany, 2018. [Google Scholar]
  23. Kleindorfer, P.R.; Saad, G.H. Managing disruption risks in supply chains. Prod. Oper. Manag. 2005, 14, 53–68. [Google Scholar] [CrossRef]
  24. Snyder, L.V. Facility location under uncertainty: A review. IIE Trans. 2006, 38, 547–564. [Google Scholar] [CrossRef]
  25. Yang, Z.B.; Aydin, G.; Babich, V.; Beil, D.R. Using a dual-sourcing option in the presence of asymmetric information about supplier reliability: Competition vs. diversification. Manuf. Serv. Oper. Manag. 2011, 14, 202–217. [Google Scholar] [CrossRef]
  26. Benyoucef, L.; Xie, X.; Tanonkou, G.A. Supply chain network design with unreliable suppliers: A Lagrangian relaxation-based approach. Int. J. Prod. Res. 2013, 51, 6435–6454. [Google Scholar] [CrossRef]
  27. Sheffi, Y.; Rice, J.B., Jr. A supply chain view of the resilient enterprise. MIT Sloan Manag. Rev. 2005, 47, 41–48. [Google Scholar]
  28. Tako, A.A.; Robinson, S. The application of discrete event simulation and system dynamics in the logistics and supply chain context. Decis. Support Syst. 2012, 52, 802–815. [Google Scholar] [CrossRef] [Green Version]
  29. Ge, Y.; Yang, J.-B.; Proudlove, N.; Spring, M. System dynamics modelling for supply-chain management: A case study on a supermarket chain in the UK. Int. Trans. Oper. Res. 2004, 11, 495–509. [Google Scholar] [CrossRef]
  30. Zhang, T.Z.; Lu, Y.M. Study on simulation and optimization of the road rush-repair model after disaster. Appl. Mech. Mater. 2011, 50, 298–303. [Google Scholar] [CrossRef]
  31. Li, X.G.; Song, X.F.; Meng, X.F. System Dynamics Simulation of Coal Mine Accident System Cause. In Proceedings of the 16th International Conference on Management Science and Engineering (ICMSE2009), Moscow, Russia, 14–16 September 2009; pp. 2137–2142. [Google Scholar]
  32. Cooke, D.L. A system dynamics analysis of the Westray mine disaster. Syst. Dyn. Rev. 2003, 19, 139–166. [Google Scholar] [CrossRef]
  33. Simonovic, S.P.; Ahmad, S. Computer-based model for flood evacuation emergency planning. Nat. Hazards 2005, 34, 25–51. [Google Scholar] [CrossRef]
  34. Brouwers, L.; Hansson, K.; Ekenberg, L. Simulation of Three Competing Flood Management Strategies—A case Study. In Proceedings of the IASTED International Conference on Applied Simulation and Modelling (ASM2002), Crete, Greece, 25–28 June 2002; Acta Press: Crete, Greece, 2002; pp. 506–513. [Google Scholar]
  35. Min, P.; Yi, P.; Hong, C. Post-seismic supply chain risk management: A system dynamics disruption analysis approach for inventory and logistics planning. Comput. Oper. Res. 2014, 42, 14–24. [Google Scholar]
  36. Li, C.; Ren, J.; Wang, H. A system dynamics simulation model of chemical supply chain transportation risk management systems. Comput. Chem. Eng. 2016, 89, 71–83. [Google Scholar] [CrossRef]
Figure 1. Concentralized distribution logistics planning system in cruise construction.
Processes 09 01398 g001
Figure 2. Risk propagation path of concentralized distribution logistics plan change.
Processes 09 01398 g002
Figure 3. Causal loop diagram.
Processes 09 01398 g003
Figure 4. Stock and flow diagram.
Processes 09 01398 g004
Figure 5. Risk consequence trend chart.
Processes 09 01398 g005
Figure 6. Trend charts of the five basic types of risk.
Processes 09 01398 g006
Figure 7. Effect of decreasing risk factors’ estimated values.
Processes 09 01398 g007
Figure 8. Comparison of cruise schedule delay risk when only one kind of risk increase.
Processes 09 01398 g008
Figure 9. Comparison of inventory backlog risk when only one kind of risk increase.
Processes 09 01398 g009
Table 1. Weight of risk factor.
Risk CategoryRisk FactorWeight
Purchase plan change riskChanges in external market environment0.2
Materials demand delay0.4
Changes of material demand plan0.4
Warehousing plan change riskStorage accident0.1
Insufficient storage space0.5
Materials arrival delay0.4
Concentralized distribution plan change risk of palletsMaterials arrival delay0.35
Material quality problems0.35
Lack of empty pallets0.3
Distribution plan change riskLow rates of pallets matching0.6
Installation site occupied0.2
Lack of distribution equipment0.2
Production plan change riskProduction disjointed0.25
Line list adjustment0.1
Design change0.35
Design failing to come out on time0.2
Distribution delay0.1
Inventory backlog riskWarehousing plan change risk0.65
Concentralized distribution plan change risk of pallets0.35
Cruise construction schedule riskProduction plan change risk0.68
Distribution plan change risk0.12
Design change0.2
Table 2. Estimated values of risk factor.
Risk FactorEstimated ValueRisk FactorEstimated Value
Changes in external market environment0.35Installation site occupied0.20
Changes of material demand planning0.42Lack of distribution equipment0.10
Insufficient storage space0.20Production disjointed0.30
Storage accident0.02Design change0.25
Lack of empty pallets0.05Design failing to come out on time0.30
Publisher’s Note: MDPI stays neutral with regard to jurisdictional claims in published maps and institutional affiliations.

