Article

Simulation Tests of a Cow Milking Machine—Analysis of Design Parameters

1
Institute of Mechanical Engineering, Warsaw University of Life Sciences, 02-787 Warsaw, Poland
2
Institute of Information Technology, Warsaw University of Life Sciences, 02-787 Warsaw, Poland
*
Authors to whom correspondence should be addressed.
Processes 2021, 9(8), 1358; https://doi.org/10.3390/pr9081358
Submission received: 30 June 2021 / Revised: 20 July 2021 / Accepted: 30 July 2021 / Published: 2 August 2021

Abstract

:
The objective of this paper was to create a mathematical model of vacuum drops in a form that enables the testing of the impact of design parameters of a milking cluster on the values of vacuum drops in the claw. Simulation tests of the milking cluster were conducted, with the use of a simplified model of vacuum drops in the form of a fourth-degree polynomial. Sensitivity analysis and a simulation of a model with a simplified structure of vacuum drops in the claw were carried out. As a result, the impact of the milking machine’s design parameters on the milking process could be analysed. The results showed that a change in the local loss and linear drag coefficient in the long milk duct will have a lower impact on vacuum drops if a smaller flux of inlet air, a higher head of the air/liquid mix, and a higher diameter of the long milk tube are used.

1. Introduction

A milking machine is a device designed for the efficient yielding of milk from a cow and for transporting milk to the milk tube. The milking process should be effective; therefore, milking machine settings are aimed at achieving high milking efficiency, that is, a short machine operation time combined with the maximum quantity of milk [1]. The function of the milking parlour is one of the factors which affect the efficiency of milk production on the farm. The increased dairy herds also require the modernization of milking equipment. [2,3]. It is important to find the appropriate criteria and technical parameters for milking parlours that would allow for optimal type of milking parlour to be chosen [4,5]. In large dairy farms robotic milking, also known as Automatic Milking Systems (AMS), are used [6]. AMS are internationally accepted as a valid alternative to conventional milking parlours, and as an advanced means of dairy farm management [7,8]. The conditions for the mechanical milking of cows are analyzed, taking various design parameters of the milking machine into account [9,10,11]. The goal of these studies is to make the machine-based milking of cows more efficient [12,13] and improve the efficiency of the milking process [14]. Appropriate milking parameters have a significant influence on cow health [15,16,17,18], and a key role in yielding milk of an appropriate level of value [7,19,20].
Among these studies, a special position is occupied by tests of vacuum changes in the milking equipment [21], which is the main technical parameter of a mechanical milking machine. Vacuum drops and oscillations in the milking cluster reduce milking efficiency and constitute the factors that are mostly responsible for udders diseases in mechanically milked cows. These cause return flows of the air/milk mix, which can achieve significant speeds with certain design solutions for the milking machine [22,23,24,25,26].
Irregular vacuum oscillations during milking, combined with cyclical vacuum oscillations and a very high value of vacuum at the end of the teat, seem to increase the frequency of udder infections and reduce milk flow [27]. A higher vacuum at the end of the teat decreases the peak flow rate of milk but may also increase hyperaemia or oedema of the teat [28]. If the working vacuum in the milking machine is too high, milking cups climb up the teats more intensively, possibly causing teat tip injuries. A high vacuum in the milking machine may cause udder infections, fluid accumulation, and teat tip tissue clogging [1,29,30]. Too high a pressure can lead to increased teat wall thickness [31]. Several authors analysed the factors affecting the vacuum inside a milking cluster with the use of simulated milking equipment and by measuring milking claw vacuum when adjusting the flow rate [32,33]. Others tested how a high vacuum affects the efficiency of mechanical milking, the condition of teats, and the health of milking cows [34,35,36]. Ambord and Bruckmaier [37] assessed the impact of various milking machine settings, causing different values of vacuum loss, on milking properties and changes in teat issue. Wiercioch et al. [38] found that a milking cluster with ventilated teat rubbers, despite creating the lowest vacuum, reduces vacuum oscillations in a cycle to the greatest extent.
The vacuum drop is increased with high milk flow rates [37,39] and small or blocked diameters of air inlets in the claw [39,40]. The operating parameters of the milking cluster should be selected to ensure the lowest possible vacuum drops.
The parameters of the milking cluster can be tested using real equipment or mathematical models and simulations. Mathematical modelling is an essential tool for analysing the impact of selected design components of the milking cluster on the course and extent of these phenomena. A model tying all milking cluster components makes it possible to analyse, by simulation, the qualitative and quantitative variations in the described values. A properly completed model may be used to control the process or for optimisation.
Demba [41] studied the effect of different milking settings on the teat–liner interface with the help of a pressure-indicating film. The experiment was performed with a conventional milking cluster equipped with round silicone liners. Ipema and Hogewerf [42] presented the design of a milking stall with special functions for monitoring and control, and tested the effect of technical milking machine settings (pulsation or milking vacuum, pulsation rate or ratio and detachment level) on quarter milking performance. Upton et al. [43] described a novel quarter milking analysis device for use in the field of bovine milking research. Wiercioch [44] benchmarked the operating parameters of pulsators in a milking process, simulated in a laboratory during disturbances in the milking machine’s vacuum system.
The milking cluster was tested with the use of various methods and models, such as linear regression [45,46], non-linear regression [22,25], or square dependencies [47]. To control the milking procedure, fuzzy logic models were used [48,49].
Tan et al. [50,51,52] presented dynamic deterministic models that define pressure levels in a milking machine. The change in air mass in milking cluster chambers was also defined by differential equations, and the existing pressure levels existing were calculated based on the ideal gas law. Kupczyk [23] presented a dynamic model of pressure variations in under-teat chambers of milking cups in the claw’s milk chamber.
Skalska et al. [53] prepared models to describe changes in the selected milking parameters, i.e., the average suction vacuum, suction vacuum amplitude, and massage vacuum amplitude in measuring milking clusters. The operation of a milking cluster was also modelled with computer simulations using Matlab®Simulink. The authors modelled vacuum in the claw’s milk chamber for 0, 1, 2, and 3 mm changes in air flux diameters [54,55] and developed a simulation model for a system controlling milk flow in the collector column of an autonomous milking cluster [56]. A control system that will adjust the area of the aerating hole in such a way as to maintain a minimum vacuum drop throughout the milking procedure when the milk flow rate is changing was proposed [57].
The literature also mentions applications that support the operation of a milking cluster: one that controls an autonomous milking cluster to regulate vacuum levels in the under-teat chamber of milking cups [58], and one that supports the calculation of selected pressure parameters of milking, which is based on mathematical formulas available in the source literature [59].
The examination of physical phenomena occurring in the milking cluster of a milking machine and their analysis using mathematical models make it possible to determine the factors that are most responsible for ensuring a proper milking procedure and identifying the factors that cause injuries and diseases in cow udders. The available literature examining the milking process does not include any optimisation models. Mathematical models based on a physical description of phenomena occurring in a milking machine make it possible to simulate the operation of a milking machine and build optimisation models. By using the sensitivity analysis in research using mathematical models, it is also possible to assess the influence of the input variables on the value of the output variable [60,61]. One example is Bernoulli’s equation for the head loss, which defines the vacuum drop in a long milk tube [23].
The objective of this paper was to create a mathematical model of vacuum drops in a form that enables the testing of the impact of design parameters of a milking cluster on the values of vacuum drops in the claw.

2. Materials and Methods

Simulation tests and a sensitivity analysis of a cow milking cluster were conducted with the use of a simplified model of vacuum drops in the form of a fourth-degree polynomial.

2.1. Simplified Structure of the Vacuum Drop Model

Vacuum drops in a milking machine are defined by Bernoulli’s equation
Δ p k o l = ( 1 α p d p m ) ρ m g H + ( 1 α p d p m ) λ ρ m l d p m D u M 2 2 + ( 1 α p d p m ) ξ ρ m u M 2 2
which is a physical model of the flow of a mixture of milk and air in the long milk tube. In this equation, the reduced velocity of mixture uM is the sum of the reduced velocities of milk and air.
The paper includes the following assumptions [62]:
  • Linear velocity is the sum of the velocity of the milk/air mixture with coefficient characterising a turbulent flow (1.2 uM) and rise velocity of a single bubble in a quiescent liquid;
  • The reduced air velocity requires the actual conditions to be lowered to normal conditions (a change in pressure causes a change in gas volume);
  • The rise velocity of a single bubble in a quiescent liquid is the function of Archimedes (Ar) and Eötvös (Eo) numbers, which, due to the air density, depend on pressure p in the long milk tube;
  • Volumetric air coefficient αpdpm in the long milk tube is the quotient of the reduced velocity and linear velocity (calculated relative to the tube walls);
  • Pressure in the milking claw is equal to operating pressure po plus drop Δpkol.
In addition, considering the calculation’s assumption that p = (po + Δpkol)/2, and taking the assumed relationships between the reduced velocity of the (milk/air) mixture and volumetric air coefficient αpdpm into account, Majkowska [63] determined a simplified Bernoulli’s equation in the following form:
Δ p k o l = ( 1 Q p A d p m p N ( p o + Δ p k o l 2 ) 1.2 ( Q m A d p m + Q p A d p m p N ( p o + Δ p k o l 2 ) ) + v ) × ( ρ m g H + λ ρ m l d p m D ( Q m A d p m + Q p A d p m p N ( p o + Δ p k o l 2 ) ) 2 2 + ζ ρ m ( Q m A d p m + Q p A d p m p N ( p o + Δ p k o l 2 ) ) 2 2 )
Velocity v is calculated using the following formula:
v = k 1 g ( ρ m ρ p ) D ρ m
where:
k 1 = 0.345 ( 1 exp ( 0.01 A r 0.345 ) ) ( 1 exp ( 3.37 E o M 1 ) ) = ( 1 exp ( 0.01 g ( v m ρ m ) 2 ( ρ m p R T ) D 3 0.345 ) ) × ( 1 exp ( 3.37 g σ ( ρ m p R T ) D 2 M 1 ) )
M 1 = M 1 ( A r )
where:
Qm, Qp—flow of milk [kg·min–1] and air [m3·h–1];
D—diameter of the long milk tube [m];
H—head [m];
ldpm—length of the milk tube [m];
po—operating pressure [kPa];
pN—atmospheric pressure in normal conditions, 100 [kPa];
pkol—pressure in the claw’s milk chamber, [kPa];
αpdpm—volumetric air coefficient in the long milk tube [-];
ζ—local loss coefficient, [-];
λ—linear loss coefficient, dependent on the relative roughness of the tube and the Re number;
ρm, ρp—density of milk and air [kg·m−3];
R—air gas constant 287 [J kg K−1];
T—temperature, [K];
Re—Reynolds number, [-];
qm—flux in milk mass (milk-like liquid) flowing in the long milk tube, [kg min−1];
σ—surface tension of the liquid, [N m−1];
v—velocity of rising a single bubble in a still liquid, [m s−1];
Adpm—cross-sectional area of long milk tube, [m2].
The following additional simplifications were assumed:
  • For flows in the long milk tube, it can be assumed that M1 = M1(Ar) = 10 [62].
  • When analysing the value of derivative dv/dp for g = 9.81 ms−2, D = 0.016 m, ρm = 1030 kg m−3, T = 288 K, it was found that, for pressure variations ranging from 48,000 to 52,000 Pa, the derivative is approx. 0.5315 × 10⁻⁹ and is almost constant. A variation in diameter D does not change this relationship.
  • The insensitivity of the rise velocity of a single bubble to pressure variations in the analysed task results from the values of milk and air density. Milk density is ρm = 1030 kg m−3 at 288 ÷ 293 K, whereas air density at 288 K and p = 101.3 kPa is ρp = 1.225 kg m−3 [64]. The ratio of these values is approx. 1000:1. As a result, in terms of the vacuum drops observed in the long milk tube and, thus, in terms of variations in operating pressure po, air velocity v is almost constant.
The discussed relationships made it possible to assume the bubble velocity in the vacuum drop model to be constant for a given milk tube diameter. After substitutions Δpkol = x and v = c, and taking into account that pN = 100 kPa = 105 Pa, expression (2) takes the following form:
x = ( 1 4 Q p π D 2 2 10 5 ( 2 p o + x ) 1.2 ( 4 Q m π D 2 + 4 Q p π D 2 2 10 5 ( 2 p o + x ) ) + c ) × ( ρ m g H + ( λ ρ m l d p m D + ζ ρ m ) 1 2 ( 4 Q m π D 2 + 4 Q p π D 2 2 10 5 ( 2 p o + x ) ) 2 )
Transforming this, we get:
x [ 1.2 ( 4 Q m π D 2 + 8 10 5 Q p π D 2 ( 2 p o + x ) + c ) ] = [ 1.2 ( 4 Q m π D 2 + 8 10 5 Q p π D 2 ( 2 p o + x ) + c ) + c 8 10 5 Q p 5 π D 2 ( 2 p o + x ) ] × { ρ m g H + 1 2 ( λ ρ m l d p m D + ζ ρ m ) ( 4 Q m π D 2 + 8 10 5 Q p π D 2 ( 2 p o + x ) + c ) 2 }
Multiplying by the factor [ π D 2 ( 2 p o + x ) ] 3 and denoting v = c, polynomial is obtained:
π 2 D 4 [ 4 p o 2 x + 4 p o x 2 + x 3 ] [ 24 5 Q m ( 2 p o + x ) + 48 10 5 5 Q p + c π D 2 ( 2 p o + x ) ] = [ 24 5 Q m ( 2 p o + x ) + 8 10 5 5 Q p + c π D 2 ( 2 p o + x ) ] × [ ρ m g H π 2 D 4 ( 2 p o + x ) 2 + 1 2 ( λ ρ m l d p m D + ζ ρ m ) ( 24 5 Q m ( 2 p o + x ) + 8 10 5 5 Q p ) 2 ]
After transformations and carrying the terms to one side, Equation (8) takes the following form:
w x 4 x 4 + w x 3 x 3 + w x 2 x 2 + w x 1 x + w w = 0
Giving Bernoulli’s equation as a polynomial enables the use of more effective methods of calculating x from Equation (9), simplifying the analysis of vacuum drops in the long milk tube.
The searched vacuum drops are real roots of the following function:
W ( x ) = w x 4 x 4 + w x 3 x 3 + w x 2 x 2 + w x 1 x + w w
Absolute term ww of polynomial (10) has the form:
w w = [ ( 1.2 Q m A d p m + v ) p o + 0.2 Q p A d p m p N ] × { ρ m g H p 2 r + 1 2 ( λ ρ m l d p m D + ξ ρ m ) [ ( Q 2 m A 2 d p m ) p 2 o + 2 Q m Q p A 2 d p m p N p o + Q 2 p p N A 2 d p m ] }
Given that all its factors are positive, it can be concluded that, irrespective of the design parameters of a milking cluster, the vacuum drop will not be equal to zero (the number zero cannot be a zero of a polynomial).

2.2. Verification of a Model with a Simplified Structure of Vacuum Drops in the Claw

The vacuum drops calculated by the model (1) and the simplified model (10) were compared. The comparison of the models concerned different milking speeds and different air streams admitted in milking machines with a high-lying milk tube and canning machines for the diameters of a long milk tube in the range from 0.01 to 0.02 m. Relative errors of the simplified model (10) and model (1), regardless of the type of milking machine, milking speed and admitted air stream, do not exceed 3%. The small discrepancy in the models allows for Bernoulli Equation (1) to be replaced with its approximation, with a fourth degree polynomial (10).
Figure 1 and Figure 2 show the relative errors of the drops, calculated on the basis of model (10), in relation to the drops calculated using model (1). The results confirm that the models are compatible.
The model of vacuum drops (10) was also verified with the experimental data presented in the work [23]. The comparison of the simplified model with laboratory data also shows the high compatibility of the simplified model (10). The mean absolute error of this comparison is 0.03 kPa. The obtained results authorize the adoption of a simplified form of the vacuum drops model in the long milk tube for further consideration.

2.3. Sensitivity of a Model with a Simplified Structure of Vacuum Drops in the Claw

A model sensitivity test includes the examination of the value of changes in the model status variable when model parameters are changed at preset input variables. In the vacuum drop model, the division of input values into input variables and parameters arises from the underlying assumptions. When the parameters are changed from As to AsAs, the status of the model will change from x to (x + Δx + o(║As║) ). The drop model equation meets the assumptions of the implicit function theorem. A set of values of polynomial W(x) was analysed for coefficients that were the functions of preset parameters As and input variables Us present in a milking cluster (vectors As and Us). Elements of vector Us belong to set Ωs:
Ω s = { 0.1 < Q p < 1 ; 0.008 < D < 0.02 ; 0.4 < H < 2.0 ; 0.7 < l d p m < 2.4 ; 48 < p o < 60 ; 0.5 < Q m < 12 }
For input variables Us belonging to domain Ωs (12), the polynomial includes real roots. At each point, the polynomial is a function of class C1. Given the simple form of function (10), the following derivatives were calculated analytically:
W x ( x , U s , A s ) = W ( x , U s , A s ) x
W A s ( x , A s , U s ) = W ( x , A s , U s ) A s
It was numerically tested that, in domain Ω and for the drops observed in reality, that is, for x∈(0, 5000) [Pa], the derivatives of polynomial (10) after x do not equal zero. At the determined point in domain P = [x0, As0, Us0], the derivative of the function defining an explicit form of variable x relative to the parameters composing vector As is expressed by the following formula:
x ( A s 0 , U s 0 ) A si = W ( x 0 , A s 0 , U s 0 ) A si / W ( x 0 , A s 0 , U s 0 ) x
The differential Δx of the vacuum drops is expressed as a scalar product:
Δ x = x ( x 0 , A s 0 , U s 0 ) A si · Δ A s = [ W ( x 0 , A s , U s ) A si / W ( x 0 , A s , U s ) x ] · Δ A s
The vacuum drop model and the related sensitivity model are shown in the block diagram in Figure 3.
Equation (16) makes it possible to examine the sensitivity of the drop model in a simplified structure, relative to any disturbances introduced to the parameters (and input variables). It is a convenient tool for simulating variations in drops resulting from changes in the input of the drop model. Equation (15) allows for the values of partial derivatives (11) to be traced. By analysing the sensitivity of the model to changes in the value of the vector of variables and input parameters, the strength and direction of the impact of changes in input values on changes in the status of the model can be examined. In some cases, sensitivity analysis may indicate the existence of an extremum of the analysed function.

3. Results and Discussion

Sensitivity analysis of the vacuum drop model was performed with the use of formula 16. The values of differential Δx(As0, Us0, Qm) referred to the values of drops x(As0, Us0, Qm), and are expressed as a percentage. The sign of the differential indicates the direction of changes, while its absolute value shows the strength of the impact of the change in parameter Asi on changes in value x at point (As0, Us0, Qm). Quotient Δ x x / Δ A s i A s i is often used as a measure of model sensitivity. In this paper, ten percent changes in the parameters were analysed. The analysis of the results presented later in the paper will concern the expression Δ x x * 100 % . The sensitivity of model (9) was tested for points from the allowable set Ωs (12).
The diagrams in Figure 4 and Figure 5 show relative values of the differentials expressed as a percentage. They correspond to the values calculated for a series of points P0i, given in the legend below. A point in the legend is clearly identified with a colour and an index. The value of the differential (Figure 4) is calculated at the point with index “i”.
The value of the differential (Figure 5) is calculated at the point with index “i”.
Legend for Figure 4 and Figure 5.
P0i = (Qpi, Di, Hi, ldpmi, poi, ζ, λ where qm = 10 kg min−1, ldpm = Hi + 0.3 m
***** P 0 i = [ Q pi ; 0.018; 1.9; 2.2; 49.3; 0.5; 0.03] Qpi = 0.2 + 0.1(i − 1) [m3 h−1],  i = 1, …, 9
***** P 0 i = [0.4; D i ; 1.9; 2.2; 49.3; 0.5; 0.03] Di = 0.014 + 0.001(i − 1) [m], i = 1, …, 9
***** P 0 i = [0.4; 0.018; H i ; l dpmi ; 49.3; 0.5; 0.03] Hi = 0.2 + 0.2(i − 1) [m], i = 1, …, 10
***** P 0 i = [0.4; 0.018; 1.9; 2.2; p ri ; 0.5; 0.03] poi = 49 + 1(i − 1) [kPa], i = 1, …, 10
Milk mass flux qm is a value set for the actual milking phase. In practice, this value is not constant. Similar calculations were performed for different milk mass fluxes. Change qm does not alter the opinions on the model’s sensitivity to changes in the parameters. The observations point to the following relationships between the design parameters of the milking machine and the milking process:
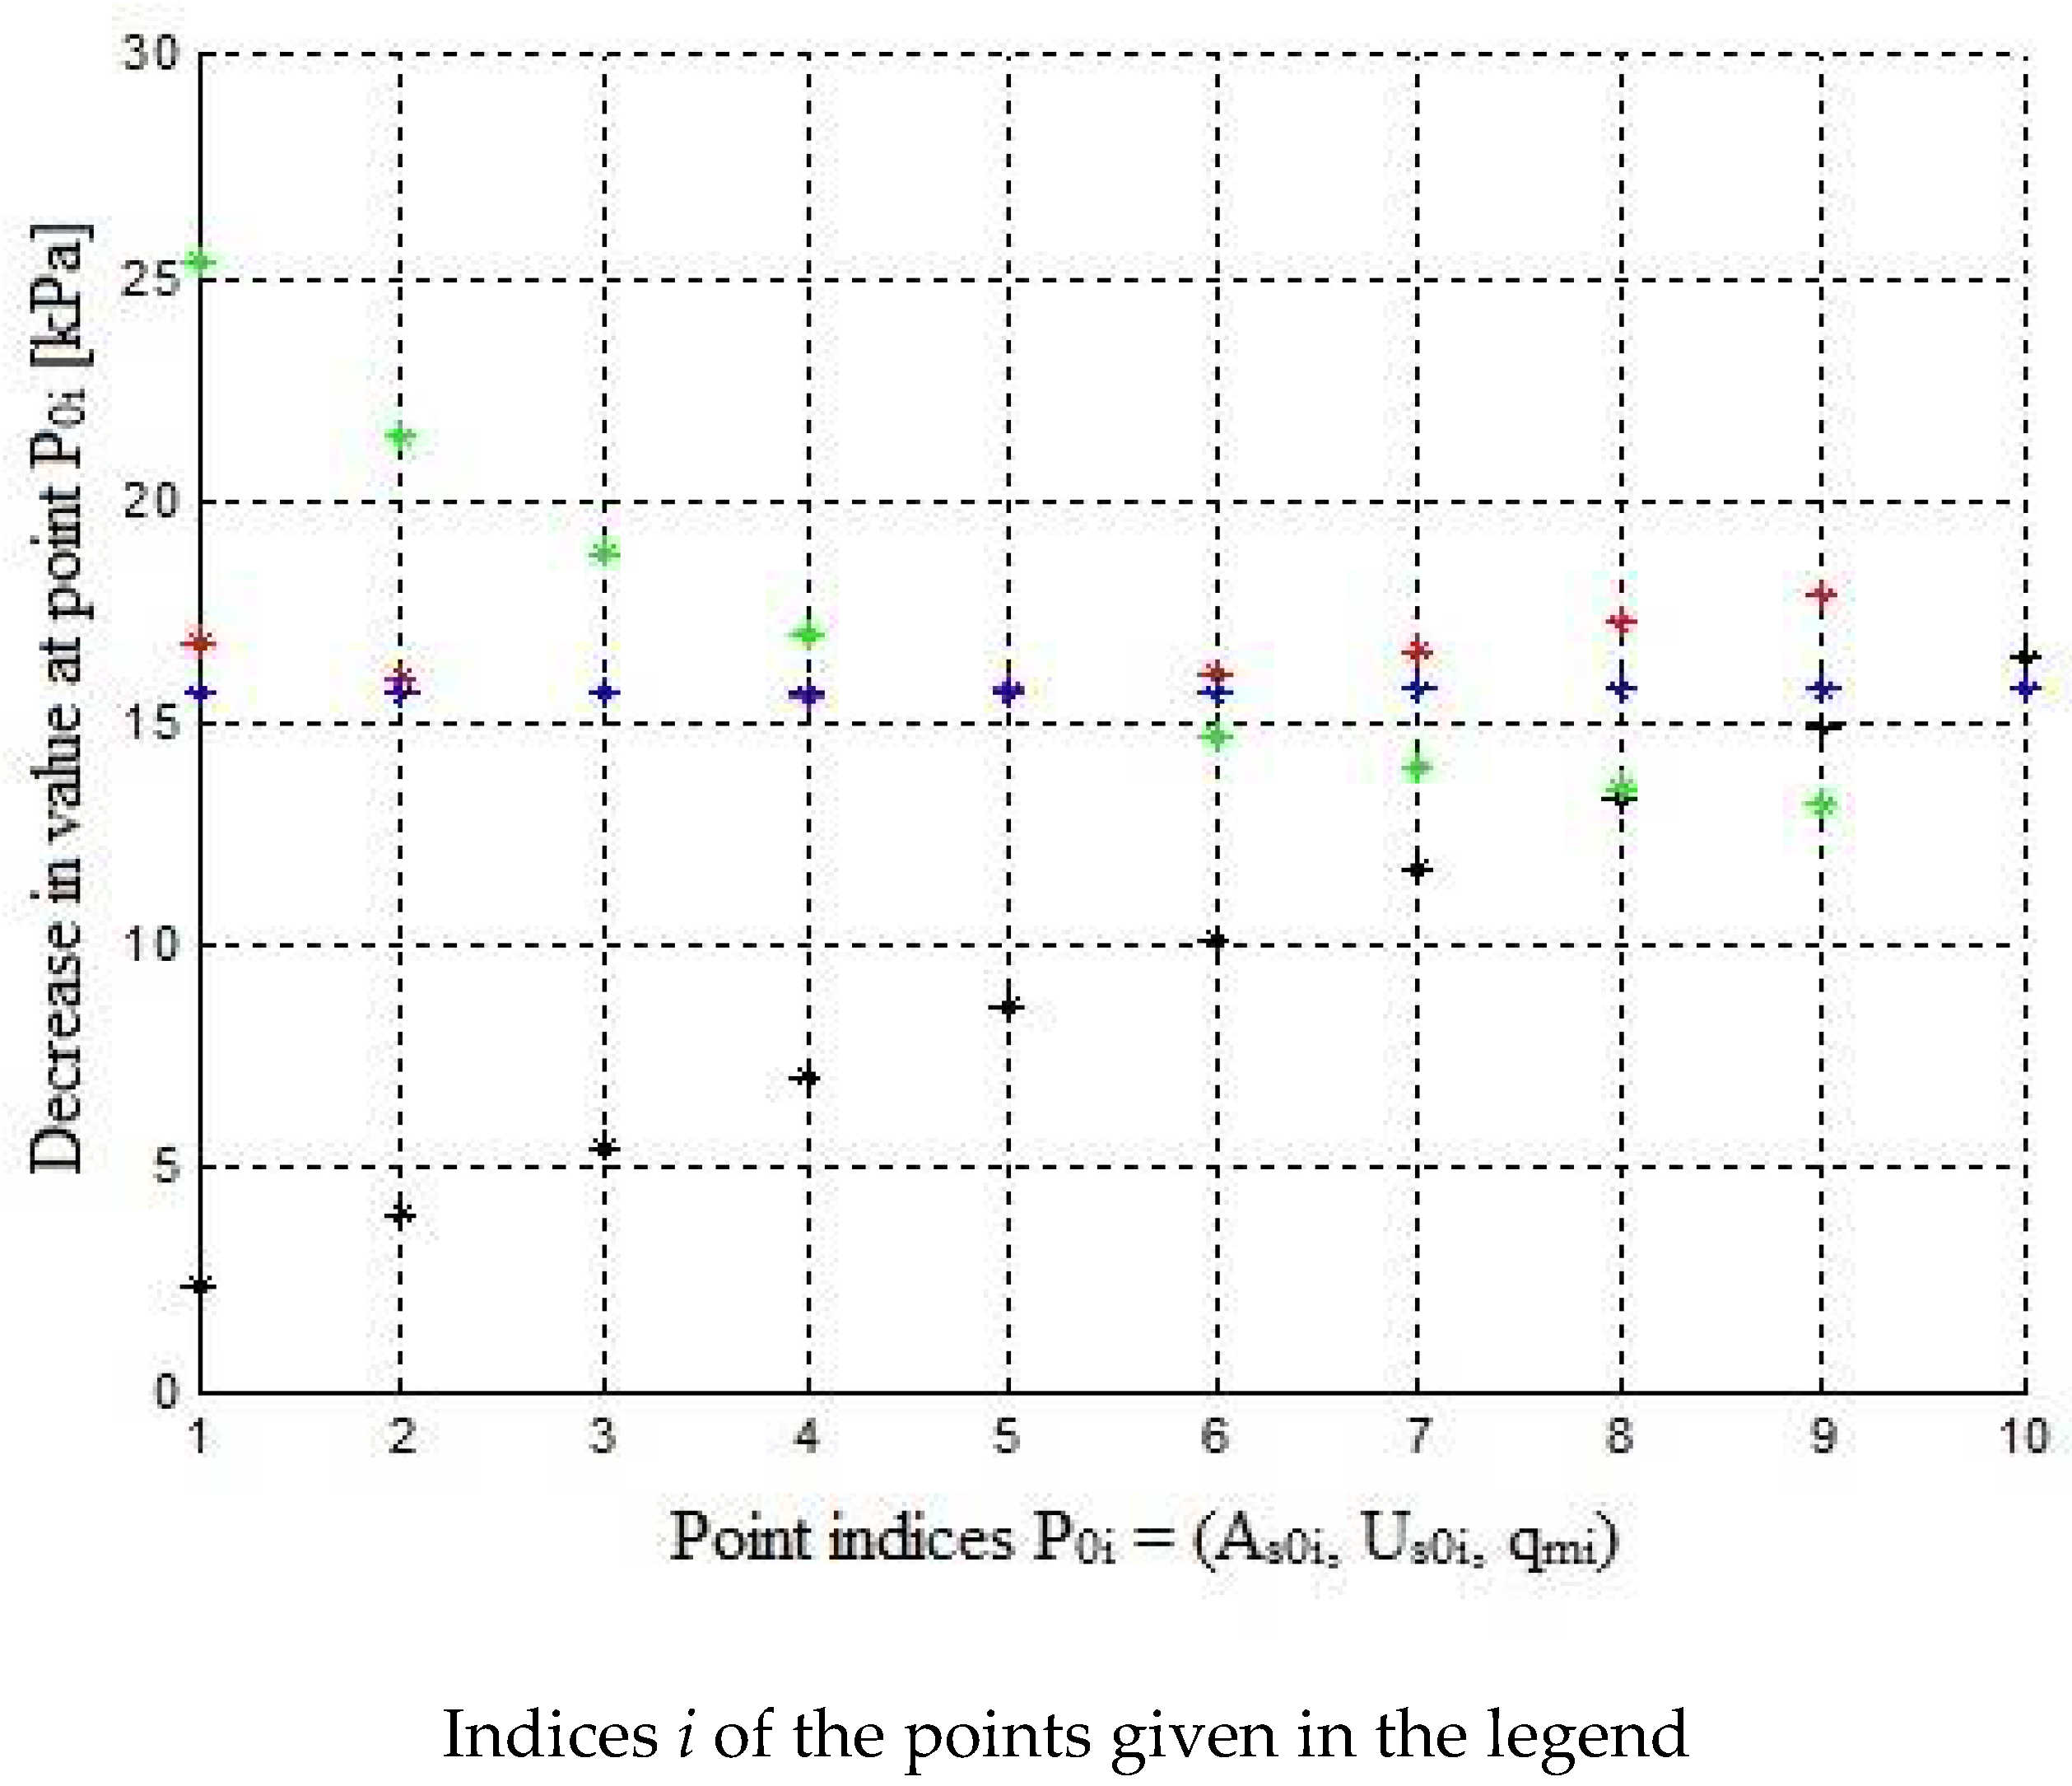
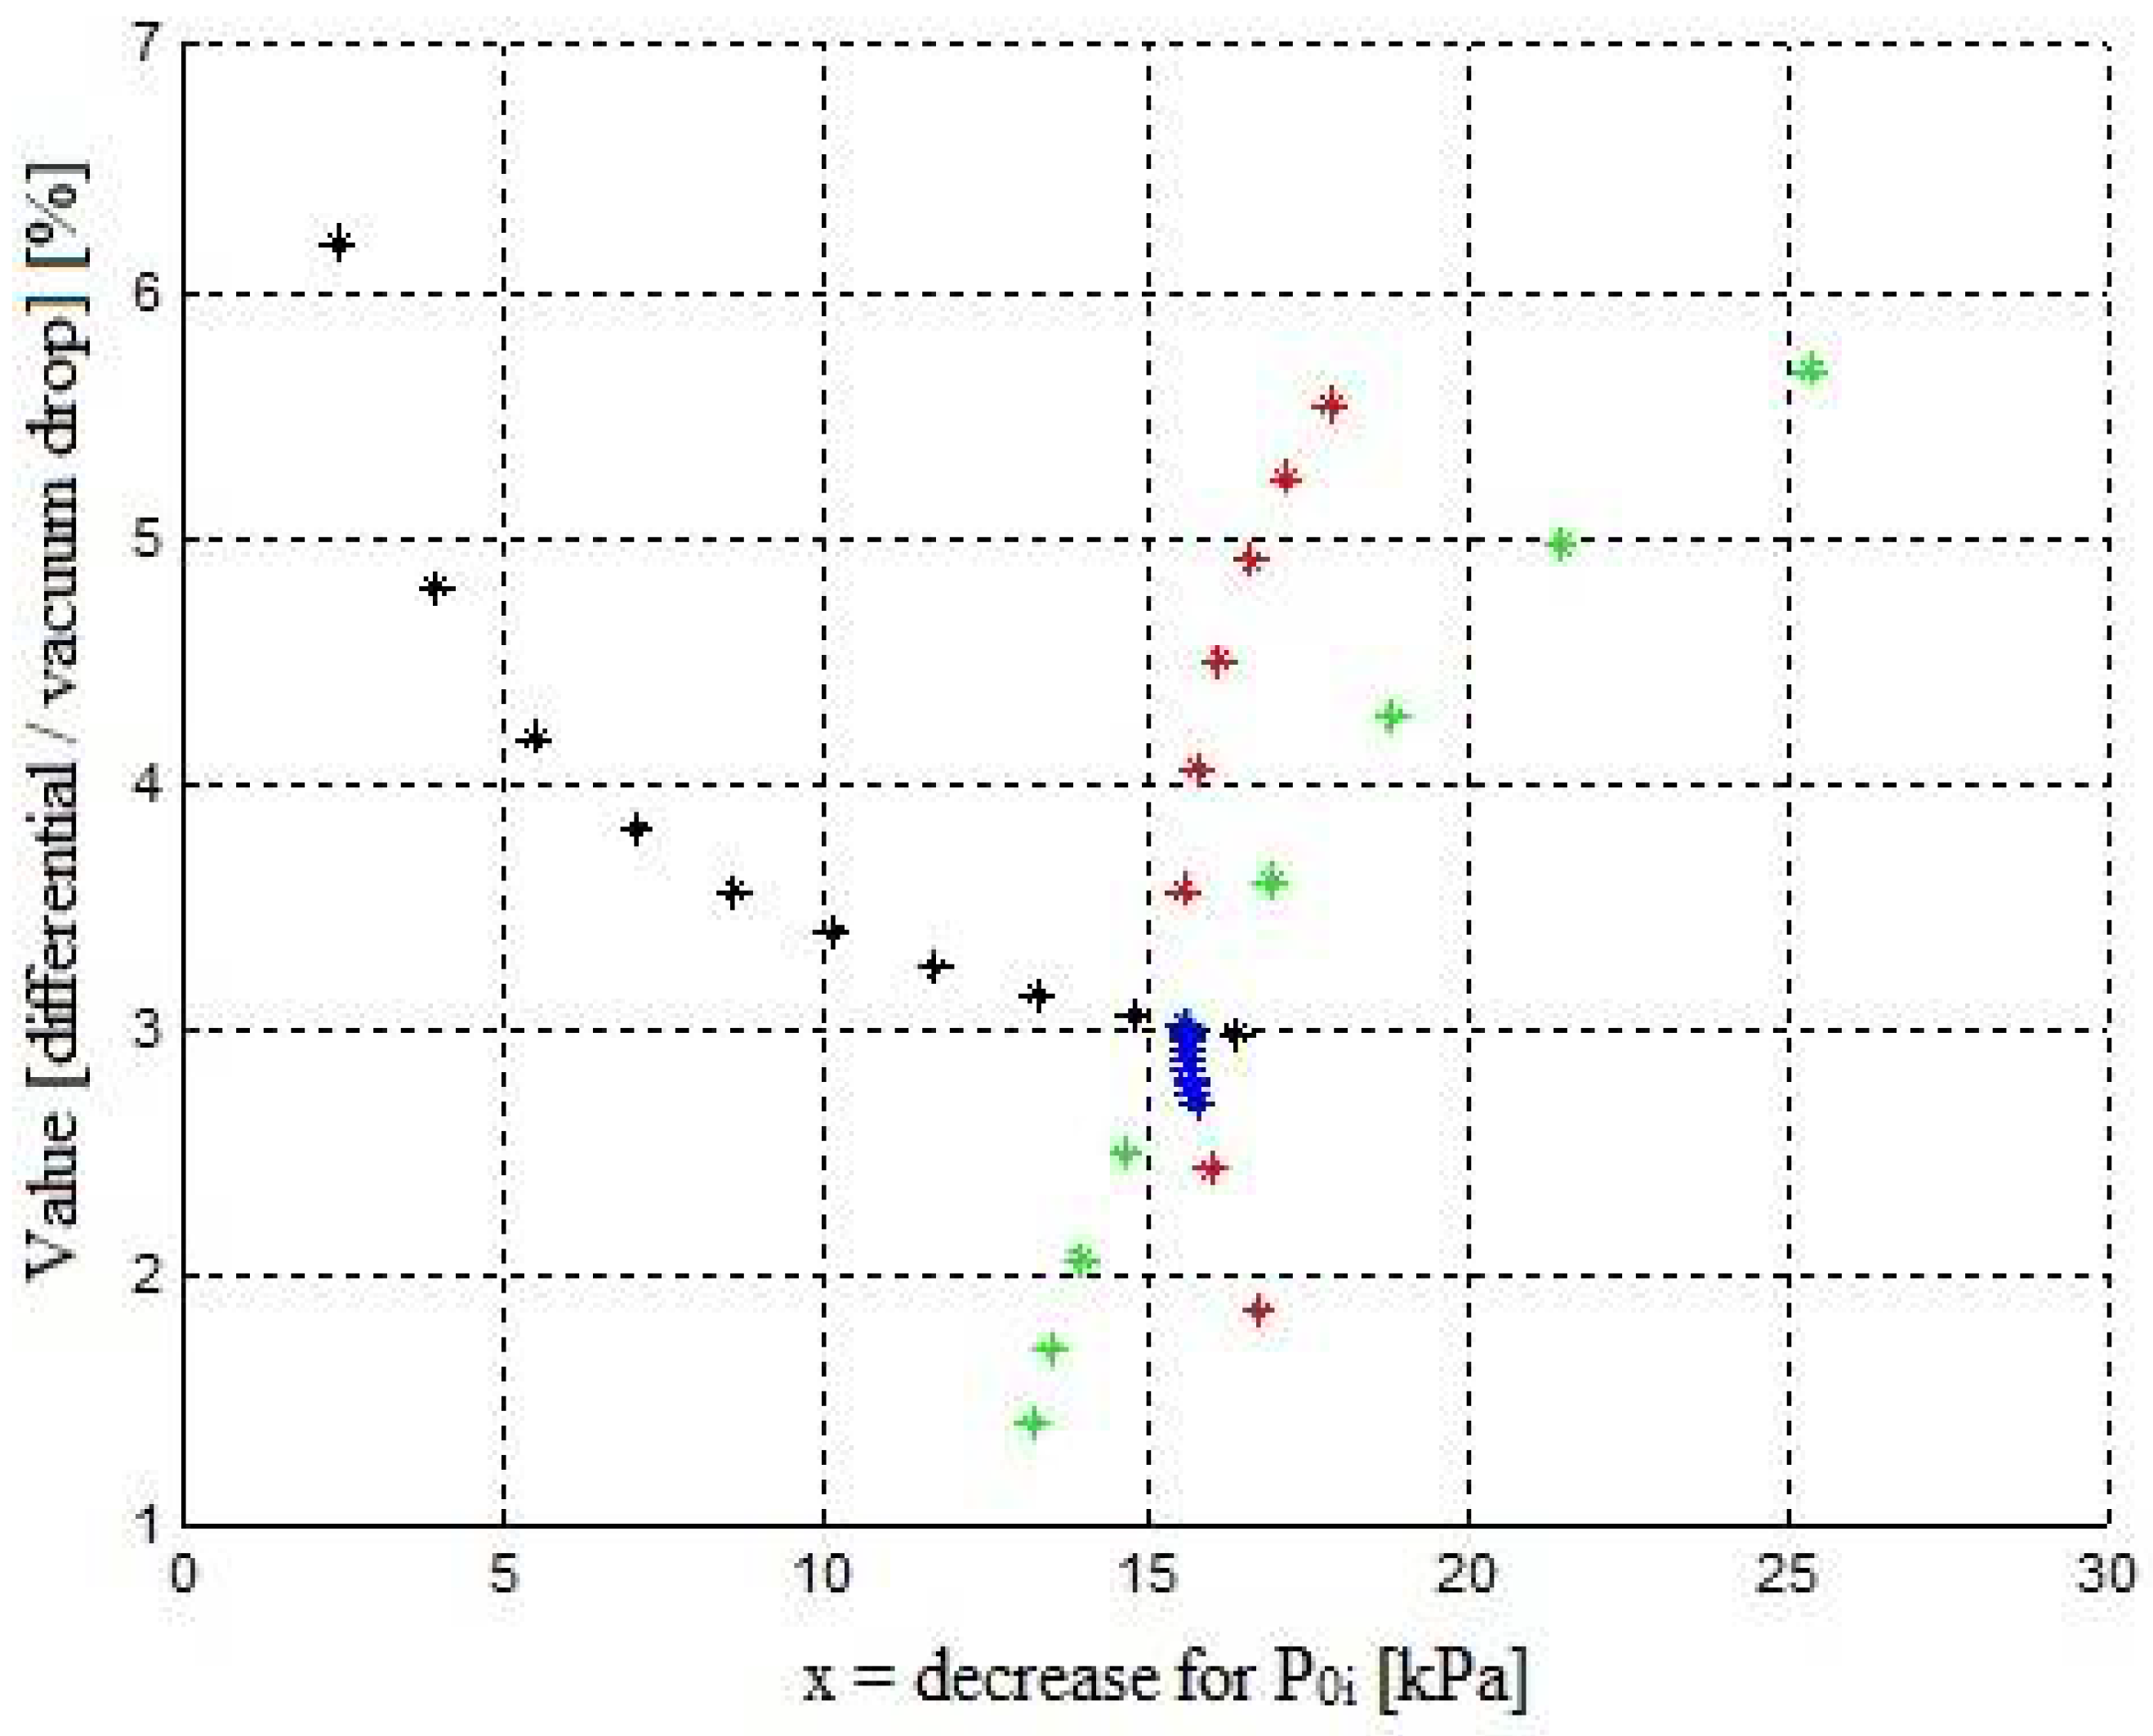
  • At lower heads of the milk/air mixture, the model is more sensitive to variations in parameters ζ and λ (Figure 5, black colour).
    Local mechanical energy losses in the pipes are caused by various obstacles located in the tubes. The values of local loss coefficients ζ should be determined empirically based on measurements; these values are affected by, for example, pipe curvatures, kinks in tubes, an abrupt increase or decrease in the pipe cross-section, etc.
    Linear loss coefficient λ depends on two parameters: Reynolds number (Re) and relative roughness of a pipe (e), which is a non-dimensional parameter. Relative roughness is defined as: e = k/d, where: k—roughness (equivalent sand-grain roughness); [m], d—inside diameter of a pipe [m]. For isothermal turbulent flows with a practical importance for water supply pipelines (for Re > 4000), the flow can exist in three zones: A—hydraulically smooth piping zone, λ = f(Re), B—transition zone (with variable roughness), λ = f(Re, e), C—quadratic drag zone, λ = f(e);
  • An increase in diameter D reduces the sensitivity of the system to a change in parameters (Figure 5, green colour). For the long milk tube diameter of 0.014 m, the sensitivity of the model is approx. 6%;
  • A decrease in air flow reduces sensitivity (Figure 5, red colour); the course of vacuum drops as a function of inlet air flux (Figure 5, red colour), which indicates the existence of flux Ω*pi at which the drop is minimal (approx. 15 kPa in the diagram), and the sensitivity of the model around that point is approx. 3%;
  • Operating pressure does not alter the sensitivity of the model to changes in parameters ς and λ (Figure 5, blue colour).
    The analysis presented above applies to point P0i = [0.4; 0.018; 1.9; 2.2; 49.3; 0.5; 0.03].
    In the entire allowable domain Ω, the nature of the relationship is similar.

4. Summary and Conclusions

The preparation of a vacuum drop model in the claw, in the form of a model with a simplified structure, by expressing Bernoulli’s equation as a fourth-degree polynomial, allowed the sensitivity model to be analytically developed. Examinations of the sensitivity of a simplified-structure drop model to any disturbances introduced to the parameters resulted in the formulation of a number of recommendations for the design parameters of the milking machine. Based on these examinations, certain general relationships can be presented:
  • A change in local loss coefficient ς and linear drag coefficient λ in the long milk tube will have a lower impact on vacuum drops if a smaller flux of inlet air Qp, a higher head of the air/liquid mix H, and a higher diameter of the long milk tube D are used;
  • Operating pressure does not affect these changes;
  • The model is insensitive to changes in parameter T: ten percent changes in temperature T caused changes in the drops to be lower than one percent.
The methodology applied in this paper makes it possible to carry out a broader analysis of the impact of design parameters of milking machines on the milking procedure, leading to improvements in the design of these machines.

Author Contributions

Conceptualization: M.M., A.K., J.T. and E.G.; Knowledge analysis: E.G.; Modeling and simulation: M.M., A.K.; Sensitivity analysis and discussion of the results: M.M., J.T.; Conclusions: M.M., A.K., J.T. and E.G.; Writing–original draft preparation: E.G., M.M., J.T. All authors have read and agreed to the published version of the manuscript.

Funding

APC was partially funded by the Institute of Mechanical Engineering, Warsaw University of Life Sciences.

Institutional Review Board Statement

Not applicable.

Informed Consent Statement

Not applicable.

Data Availability Statement

Not applicable.

Conflicts of Interest

The authors declare no conflict of interest.

References

  1. Odorčić, M.; Rasmussen, M.D.; Paulrud, C.O.; Bruckmaier, R.M. Review: Milking machine settings, teat condition and milking efficiency in dairy cows. Animals 2019, 13, S94–S99. [Google Scholar] [CrossRef] [Green Version]
  2. Gaworski, M.; Kamińska, N.; Kic, P. Evaluation and optimization of milking in some Polish dairy farms differed in milking parlours. Agron. Res. 2017, 15, 112–122. [Google Scholar]
  3. Chiumenti, A.; da Borso, F.; Chiumenti, R.; Kic, P. Applying a Mathematical Model to Compare, Choose, and Optimize the Management and Economics of Milking Parlors in Dairy Farms. Agriculture 2020, 10, 472. [Google Scholar] [CrossRef]
  4. Kic, P. Criteria for optimization of milking parlour on dairy farm. In Proceedings of the 14th International Scientific Conference on Engineering for Rural Development, Jelgava, Latvia, 20–22 May 2015; Latvia University of Agriculture: Jelgava, Latvia, 2015; pp. 106–111. [Google Scholar]
  5. Gaworski, M.; Kic, P. Improvement of mobile milking parlours in small dairy farms including technical and functional aspects. Conference Paper. In Proceedings of the 16th International Scientific Conference Engineering for Rural Development, Jelgava, Latvia, 24–26 May 2017. [Google Scholar] [CrossRef]
  6. Tremblay, M.; Hess, J.; Christenson, B.; McIntyre, K.; Smink, B.; Kamp, A.; Jong, L.; Döpfer, D. Factors associated with increased milk production for automatic milking systems. J. Dairy Sci. 2016, 99, 3824–3837. [Google Scholar] [CrossRef] [PubMed]
  7. Pezzuolo, A.; Cillis, D.; Marinello, F.; Sartori, L. Estimating efficiency in automatic milking systems. Eng. Rural Dev. 2017, 16, 736–741. [Google Scholar] [CrossRef]
  8. Costa, D.; Reinemann, D.; Billon, P. Design Considerations for Milking Machines Used in Brazil. Soc. Eng. Agric. Food Boil. Syst. 2003, 033015. [Google Scholar] [CrossRef]
  9. Paliy, A.; Aliiev, E.; Paliy, A.; Ishchenko, K.; Shkromada, O.; Musiienko, Y.; Plyuta, L.; Chekan, O.; Dubin, R.; Mohutova, V. Development of a device for cleansing cow udder teats and testing it under industrial conditions. East. Eur. J. Enterp. Technol. 2021, 1, 43–53. [Google Scholar] [CrossRef]
  10. Nielsen, N.I.; Larsen, T.; Bjerring, M.; Ingvartsen, K.L. Quarter Health, Milking Interval, and Sampling Time During Milking Affect the Concentration of Milk Constituents. J. Dairy Sci. 2005, 88, 3186–3200. [Google Scholar] [CrossRef] [Green Version]
  11. Borodin, S.A.; Andrianov, E.A.; Andrianov, A.A.; Tertychnaya, T.N. Substantiating Design Parameters of a multi functional milking machine. J. Mech. Contin. Math. Sci. 2020, 176–190. [Google Scholar] [CrossRef]
  12. Dmytriv, V.; Dmytriv, I.; Lavryk, Y.; Horodeckyy, I. Models of adaptation of the milking machines systems. Contemporary Contemp. Res. Trends Agric. Eng 2018, 10, 7. [Google Scholar] [CrossRef] [Green Version]
  13. Achkevych, V.I.; Khmelevsky, V.S.; Achkevych, O.M. The influence of the design parameters of the milking machine collector on the oscillation of the vacuum pressure in the suction phase. Meh. Electrif. Agric. 2020, 117–123. [Google Scholar] [CrossRef]
  14. Palii, A.P.; Mihalchenko, S.A.; Chechui, H.F.; Reshetnichenko, A.P.; Rozum, Y.E.; Bredykhin, V.V.; Bogomolov, O.V.; Denicenko, S.A.; Mitiashkina, T.Y.; Sychov, A.I.; et al. Milking and udder health assessment in industrial farming. Ukr. J. Ecol. 2020, 10, 375–381. [Google Scholar]
  15. Nørstebø, H.; Dalen, G.; Rachah, A.; Heringstad, B.; Whist, A.C.; Nødtvedt, A.; Reksen, O. Factors associated with milking-to-milking variability in somatic cell counts from healthy cows in an automatic milking system. Prev. Vet. Med. 2019, 172, 104786. [Google Scholar] [CrossRef]
  16. Paliy, A.; Nanka, O.; Ishchenko, K.; Paliy, A. Research on high-yielding dairy cow treatment techniques during milking. Anim. Biol. Anim. Husb. 2019, 11, 1–11. [Google Scholar]
  17. Hovinen, M.; Pyörälä, S. Invited review: Udder health of dairy cows in automatic milking. J. Dairy Sci. 2011, 94, 547–562. [Google Scholar] [CrossRef]
  18. Vijayakumar, M.; Park, J.H.; Ki, K.S.; Lim, D.H.; Kim, S.B.; Park, S.M.; Jeong, H.Y.; Park, B.Y.; Kim, T.I. The effect of lactation number, stage, length, and milking frequency on milk yield in Korean Holstein dairy cows using automatic milking system. Asian-Australas J Anim Sci. 2017, 30, 1093–1098. [Google Scholar] [CrossRef]
  19. Jacobs, J.A.; Siegford, J.M. Invited review: The impact of automatic milking systems on dairy cow management, behavior, health, and welfare. J. Dairy Sci. 2012, 95, 2227–2247. [Google Scholar] [CrossRef] [PubMed]
  20. Dohmen, W.; Neijenhuis, F.; Hogeveen, H. Relationship between udder health and hygiene on farms with an automatic milking system. J. Dairy Sci. 2010, 93, 4019–4033. [Google Scholar] [CrossRef] [PubMed] [Green Version]
  21. Achkevych, O.; Achkevych, V.; Bratishko, V.; Potapova, S. Justification of rational design parameters of milking machine for installations with milk line system. Eng. Rural Dev. 2020, 1313–1318. [Google Scholar] [CrossRef]
  22. Wiercioch, M. Przepływy w Kubku Udojowym Dojarki Mechanicznej. Rozprawa Hab. Ph.D. Thesis, Akademia Rolnicza, Wrocław, Poland, 1994. [Google Scholar]
  23. Kupczyk, A. Improvement in Milking Conditions with Particular Emphasis on Subatmospheric Pressure in the Milking Unit. Ph.D. Thesis, Institute for Building, Mechanization and Electrification of Agriculture, Warsaw, Poland, 1999. (In Polish). [Google Scholar]
  24. O’Callaghan, E.J.; Gleeson, D.E. Evaluation of Milking Systems in Terms of Mastitis Risk, Teat Tissue Reactions & Milking Performance, End of Project Reports, Teagasc. 2000. Available online: https://t-stor.teagasc.ie/handle/11019/1403 (accessed on 21 April 2021).
  25. Pawlak, T.; Szlachta, J.; Luberański, A. The analysis of the effect of changing the volume of the under-teat chamber, rubber elasticity and pulsation type on the size of the return flow in a short milk tube. Electron. J. Pol. Agric. Univ. 2005, 8, 42. Available online: http://www.ejpau.media.pl/volume8/issue4/art-42.html (accessed on 21 April 2021).
  26. Abeni, F.; Terzano, M.G.; Speroni, M.; Migliorati, L.; Capelletti, M.; Calza, F.; Bianchi, L.; Pirlo, G. Evaluation of milk enzymes and electrolytes, plasma metabolites, and oxidative status in twin cows milked in an automatic milking system or twice daily in a conventional milking parlor. J Dairy Sci. 2008, 91, 3372–3384. [Google Scholar] [CrossRef]
  27. Besier, J.; Lind, O.; Bruckmaier, R.M. Dynamics of teat-end vacuum during machine milking: Types, causes and impacts on teat condition and udder health—A literature review. J. Appl. Anim. Res. 2015, 44, 263–272. [Google Scholar] [CrossRef] [Green Version]
  28. Gleeson, D.E.; O’Callaghan, E.J.; Rath, M.V. Effect of liner design, pulsator setting, and vacuum level on bovine teat tissue changes and milking characteristics as measured by ultrasonography. Ir. Vet. J. 2004, 57, 289. [Google Scholar] [CrossRef] [PubMed] [Green Version]
  29. Penry, J.F.; Upton, J.; Mein, G.A.; Rasmussen, M.D.; Ohnstad, I.; Thompson, P.D.; Reinemann, D.J. Estimating teat canal cross-sectional area to determine the effects of teat-end and mouthpiece chamber vacuum on teat congestion. J. Dairy Sci. 2017, 100, 821–827. [Google Scholar] [CrossRef] [Green Version]
  30. Wieland, M.; Nydam, D.V.; Virkler, P.D. A longitudinal field study investigating the association between teat-end shape and two minute milk yield, milking unit-on time, and time in low flow rate. Livest. Sci. 2017, 205, 88–97. [Google Scholar] [CrossRef]
  31. Hamann, J.; Mein, G.A.; Wetzel, S. Teat tissue reactions to milking: Effects of vacuum level. J Dairy Sci. 1993, 76, 1040–1046. [Google Scholar] [CrossRef]
  32. Enokidani, M.; Kawai, K.; Shinozuka, Y.; Watanabe, A. Milking performance evaluation and factors affecting milking claw vacuum levels with flow simulator. Anim. Sci. J. 2016, 88, 1134–1140. [Google Scholar] [CrossRef] [PubMed]
  33. Enokidani, M.; Kuruhara, K.; Kawai, K. Analysis of factors affecting milking claw vacuum levels using a simulated milking device. Anim. Sci. J. 2016, 87, 848–854. [Google Scholar] [CrossRef] [PubMed]
  34. Besier, J.; Bruckmaier, R.M. Vacuum levels and milk-flow-dependent vacuum drops affect machine milking performance and teat condition in dairy cows. J. Dairy Sci. 2016, 99, 3096–3102. [Google Scholar] [CrossRef] [PubMed]
  35. Stauffer, C.; Feierabend, M.; Bruckmaier, R.M. Different vacuum levels, vacuum reduction during low milk flow, and different cluster detachment levels affect milking performance and teat condition in dairy cows. J. Dairy Sci. 2020, 103, 9250–9260. [Google Scholar] [CrossRef]
  36. Pařilová, M.; Ježková, A.; Stádník, L.; Štolc, L. Effect of milking vacuum and overmilking on selected milking characteristics. Cattle Res. 2010, 3, 35–42. [Google Scholar]
  37. Ambord, S.; Bruckmaier, R.M. Milk flowdependent vacuum loss in high-line milking systems: Effects on milking characteristics and teat tissue condition. J. Dairy Sci. 2010, 93, 3588–3594. [Google Scholar] [CrossRef] [Green Version]
  38. Wiercioch, M.; Luberański, A.; Krzyś, A.; Skalska, D.; Szlachta, J. Impact of the System of Air Supply to a Milking Unit on Selected Parameters of Milking Machine Operation. Agric. Eng. 2016, 20, 195–205. [Google Scholar] [CrossRef] [Green Version]
  39. Ströbel, U.; Rose-Meierhöfer, S.; Öz, H.; Brunsch, R. Development of a control system for the teat-end vacuum in individual quarter milking systems. Sensors 2013, 13, 7633–7651. [Google Scholar] [CrossRef] [PubMed]
  40. Rasmussen, M.D.; Wiking, L.; Bjerring, M.; Larsen, H.C. Influence of air intake on the concentration of free fatty acids and vacuum fluctuations during automatic milking. J. Dairy Sci. 2006, 89, 4596–4605. [Google Scholar] [CrossRef]
  41. Demba, S.; Ammon, C.; Rose-Meierhöfer, S. The influence of different milking settings on the measured teat load caused by a collapsing liner. Comput. Electron. Agric. 2018, 153, 54–61. [Google Scholar] [CrossRef]
  42. Ipema, A.H.; Hogewerf, P.H. Quarter-controlled milking in dairy cows. Comput. Electron. Agric. 2008, 62, 59–66. [Google Scholar] [CrossRef]
  43. Upton, J.; Reinemann, D.J.; Penry, J.F.; Thompson, P.D. A quarter milking analysis device—Development and demonstration. Biosyst. Eng. 2016, 147, 259–264. [Google Scholar] [CrossRef]
  44. Wiercioch, M.; Luberański, A.; Szlachta, J.; Skalska, D. Wpływ zakłóceń w instalacji próżniowej dojarki na parametry pracy wybranych pulsatorów. (Influence of disturbances in the milking machine vacuum system on the operating parameters of selected pulsators). Inżynieria Rol. 2011, 8, 285–292. [Google Scholar]
  45. Lisowski, A. Wpływ pojemności kolektora i średnicy przewodów mlecznych na podciśnienie w komorze podstrzykowej i kolektorze. (Influence of claw capacity and diameter of milk tubes on vacuum in the under-teat chamber and the collector). Przegląd Tech. Rol. I Leśnej 2003, 3, 12–13. [Google Scholar]
  46. Szlachta, J.; Krzyś, A.; Luberański, A. Modelowanie wpływu parametrów ciśnieniowych na przepływy zwrotne w krótkim przewodzie mlecznym aparatu udojowego. (Modeling the influence of pressure parameters on the return flows in the short milk tube of the milking unit). Inżynieria Rol. 2000, 2, 165–173. [Google Scholar]
  47. Skalska, D.; Szlachta, J.; Luberański, A. Analiza strumienia masy cieczy oraz obciążenia rurociągu mlecznego na wartość średniego podciśnienia ssania w kubku udojowym dojarki rurociągowej.(Analysis of the liquid mass flow and the load of the milk pipeline on the value of the average vacuum in the teat cup of the pipeline milking machine). Tech. Agrar. 2003, 2, 75–87. [Google Scholar]
  48. Juszka, H.; Tomasik, M.; Lis, S. Mikroprocesorowy system sterowania pulsacją doju maszynowego krów.( Microprocessor control system for pulsation of machine milking of cows). Inżynieria Rol. 2010, 1, 243–249. [Google Scholar]
  49. Juszka, H.; Lis, S. Zastosowanie programu Matlab® w modelowaniu podciśnienia w aparacie udojowym. (Application of the Matlab® program in modeling of vacuum in a milking unit). Inżynieria Rol. 2009, 13, 95–100. [Google Scholar]
  50. Tan, J.; Janni, K.A.; Appleman, R.D. Dynamic variations in vacuum milking systems. Presented at the Summer Meeting, Quebec City, QC, Canada, 25–28 June 1989. [Google Scholar]
  51. Tan, J.; Janni, K.A.; Stelson, K.A. Mathematical modeling of milking machine vacuum systems. Trans. Am. Soc. Agric. Eng. 1992, 35, 327. [Google Scholar] [CrossRef]
  52. Tan, J.; Janni, K.A.; Appleman, R.D. Milking system dynamics. 1. Measurement of variation. J. Dairy Sci. 1993, 76, 2195. [Google Scholar] [CrossRef]
  53. Skalska, D.; Nejman, M.; Wiercioch, M.; Luberański, A.; Krzyś, A. Odporność wybranych aparatów udojowych na wahania podciśnienia w instalacji dojarki rurociąg0owej. (Resistance of selected milking units to vacuum fluctuations in the pipeline milking machine installation). Inżynieria Rol. 2013, 3, 349–359. [Google Scholar]
  54. Juszka, H.; Lis, S.; Tomasik, M. Modelowanie matematyczne systemu sterowania aparatem udojowym. (Mathematical modeling of the milking unit control system.). Inżynieria Rol. 2006, 2006, 61–67. [Google Scholar]
  55. Juszka, H.; Lis, S.; Tomasik, M. Modelowanie podciśnienia w kolektorze aparatu udojowego dla krów. (Modeling of vacuum in the claw of milking apparatus for cows). Acta Tech. Agrar. 2006, 5, 81–90. [Google Scholar]
  56. Lis, S.; Tomasik, M.; Juszka, H. The design of a prototype system which controls the flow of milk in the collector’s column of an autonomous milking apparatus. Contemp. Res. Trends Agric. Eng. 2018, 10, 02016. [Google Scholar] [CrossRef] [Green Version]
  57. Kupczyk, A.; Gaworski, M.; Szlachta, J.; Tucki, K.; Wojdalski, J.; Luberański, A.; Dróżdż, B.; Krzywonos, M. Slug flow model in a long milk tube for designing a milking unit control system. J. Anim. Plant Sci. 2019, 29, 1238–1246. [Google Scholar]
  58. Juszka, H.; Tomasik, M.; Lis, S.; Haczyk, G. Sterowanie automatyczne autonomicznym aparatem udojowym. (Automatic control of an autonomous milking unit). Inżynieria Rol. 2011, 4, 99–104. [Google Scholar]
  59. Luberański, A.; Pruski, K.; Wiercioch, M. Metoda komputerowego wspomagania obliczeń ciśnieniowych parametrów mechanicznego doju i nacisków masujących strzyk. (A method of computer aid for calculating pressure parameters of mechanical milking and pressures that massage a teat). Inżynieria Rol. 2013, 3, 235–242. [Google Scholar]
  60. Chun, J. Reliability-Based Design Optimization of Structures Using theSecond-Order Reliability Method and Complex-Step Derivative Approximation. Appl. Sci. 2021, 11, 5312. [Google Scholar] [CrossRef]
  61. Sławik, D. Metody badania wrażliwosci cech sygnałów diagnostycznych. (Methods of studying the sensitivity of the characteristics of diagnostic signals). Politechnika Śląska 2005. Available online: https://delibra.bg.polsl.pl/Content/30996/BCPS_34767_2005_Metody-badania-wrazl_0000.pdf (accessed on 30 July 2021).
  62. Orzechowski, Z.; Prywer, R.; Zarzycki, R. Mechanika Płynów w Inżynierii Środowiska. (Fluid Mechanics in Environmental Engineering); Wydawnictwo Naukowe PWN: Warszawa, Poland, 2001. [Google Scholar]
  63. Majkowska, M. Optimization of milking unit performance in mechanical milking machines. Ph.D. Thesis, Warsaw University of Life Sciences, Warsaw, Poland, 2008. (In Polish). [Google Scholar]
  64. Walden, H. Mechanika Płynów. (Fluid Mechanics); PWN: Warszawa, Poland, 1978. [Google Scholar]
Figure 1. Relative errors of vacuum pressure drops calculated by model (1) and simplified model (10) for D = 0.016 m, H = 0.4 m, ldpm = 0.7 m, po = 58.0 kPa and ξ = 0.5, λ = 0.03 for selected values of the milk stream in the range from 2 to 10 kg min−1.
Processes 09 01358 g001
Figure 2. Relative errors of vacuum pressure drops calculated by model (1) and simplified model (10) for D = 0.016 m, H = 1.9 m, ldpm = 2.2 m, po = 49.3 kPa and ξ = 0.5, λ = 0.03 for selected values of the milk stream in the range from 2 to 5 kg min−1.
Processes 09 01358 g002
Figure 3. Vacuum drop model and related sensitivity model.
Processes 09 01358 g003
Figure 4. Values of vacuum drops calculated at points P0i.
Processes 09 01358 g004
Figure 5. Relative value of the differential, calculated at points ([P0i, ΔP0i)), where: ΔP0i = (0, 0, 0, 0, 0, 0.003, 0.05).
Processes 09 01358 g005
Publisher’s Note: MDPI stays neutral with regard to jurisdictional claims in published maps and institutional affiliations.

