Article

Bioenergy Potential of Albumin, Acetic Acid, Sucrose, and Blood in Microbial Fuel Cells Treating Synthetic Wastewater

1
Department of Environmental Sciences, Abbottabad Campus, COMSATS University Islamabad, Khyber Pakhtunkhwa 22060, Pakistan
2
Department of Landscape and Architecture, School of Design, Shanghai Jiao Tong University, Shanghai 200240, China
3
Department of Development Studies, Abbottabad Campus, COMSATS University Islamabad, Khyber Pakhtunkhwa 22060, Pakistan
4
Department of Chemistry, College of Science, University of Bahrain, Sakhir P.O. Box 32038, Bahrain
5
School of Biotechnology and Food Engineering, Huanghuai University, Zhumadian 463000, China
6
School of Materials Science and Engineering, Jiangsu University, Zhenjiang 212013, China
7
Advanced Materials Research Chair, Chemistry Department P.O. Box 2455, College of Science, King Saud University, Riyadh 11451, Saudi Arabia
8
Department of Chemistry P.O. Box 84428, College of Science, Princess Nourah bint Abdulrahman University, Riyadh 11671, Saudi Arabia
*
Author to whom correspondence should be addressed.
First two authors equally contributed in the manuscript.
Processes 2021, 9(8), 1289; https://doi.org/10.3390/pr9081289
Submission received: 7 May 2021 / Revised: 17 June 2021 / Accepted: 23 June 2021 / Published: 26 July 2021
(This article belongs to the Section Environmental and Green Processes)

Abstract

:
Microbial fuel cells (MFCs) are a recent biotechnology that can simultaneously produce electricity and treat wastewater. As the nature of industrial wastewater is very complex, and it may contain a variety of substrates—such as carbohydrates, proteins, lipids, etc.—previous investigations dealt with treatment of individual pollutants in MFCs; the potential of acetic acid, sucrose, albumin, blood, and their mixture has rarely been reported. Hence, the current investigation explored the contribution of each substrate, both separately and in mixture. The voltage generation potential, current, and power density of five different substrates—namely, acetic acid, sucrose, albumin, blood, and a mixture of all of the substrates—was tested in a dual-chambered, anaerobic MFC operated at 35 °C. The reaction time of the anaerobic batch mode MFC was 24 h, and each substrate was treated for 7 runs under the same conditions. The dual-chambered MFC consisted of anode and cathode chambers; the anode chamber contained the biocatalyst (sludge), while the cathode chamber contained the oxidizing material (KMnO4). The maximum voltage of 769 mV was generated by acetic acid, while its corresponding values of current and power density were 7.69 mA and 347.85 mW, respectively. Similarly, being a simple and readily oxidizable substrate, acetic acid exhibited the highest COD removal efficiency (85%) and highest Coulombic efficiency (72%) per run. The anode accepted the highest number of electrons (0.078 mmol/L) when acetic acid was used as a substrate. The voltage, current, and power density generated were found to be directly proportional to COD concentration. The least voltage (61 mV), current (0.61 mA), and power density (2.18 mW) were observed when blood was treated in the MFC. Further research should be focused on testing the interaction of two or more substrates simultaneously in the MFC.

1. Introduction

With the increasing demands of fossil fuels, some non-conventional energy sources should also be explored. Increased consumption of fossil fuels has resulted in climate change and planetary pollution. Bioenergy is green energy that should be explored in order to fulfill our increasing energy demands. According to the U.S. Energy Information Administration, the industrial sector and the travel industry use the largest amounts of energy. These sectors are the biggest contributors to water pollution which, in turn, causes detrimental environmental and health effects. It is important that the water being released is treated before being discharged into the surrounding environment. Wastewater treatment can be organized or categorized by the nature of the treatment process operation being used—for example, physical, chemical, or biological, most of which are energy-intensive processes. A variety of organic substances—such as carbohydrates, lipids, fatty acids, proteins, and some other related organics—are found in wastewater, constituting its chemical oxygen demand (COD), which can be utilized to harness bioenergy. The organic matter in raw wastewater contains almost 10 times the energy needed to treat it. On average, 1 kg of carbohydrate represents 1.06 kg of COD, which can be converted to an equivalent power of 4.41 kWh, or 13 × 106 Coulombs [1]. Hence, this energy should be harnessed during wastewater treatment. There are several pathways enabling the conversion of biomass to bioenergy; one of these is microbial fuel cells (MFCs), which can harvest energy from dissolved biomass by using microorganisms [2,3].
MFCs produce power from organic waste by direct conversion of organic substrates to simple organic substances, and subsequent voltage generation. Most dual-chambered MFCs comprise two compartments—the anodic and cathodic half-cells—which are separated by a selectively permeable membrane: for example, proton-exchange membranes [4]. In an MFC, the anodic chamber may consist of aerobic or anaerobic microbes suspended in the anolyte, while the cathodic chamber contains the electron acceptor (e.g., oxygen). In essence, the electron donor is physically separated from the terminal electron acceptor across the two chambers [5]. Most of the electrons released from the oxidation process are transferred to the anode. Electron transfer to the anode can be accomplished by electron mediators or shuttling agents, either directly by the cell or by means of “nanowires” [6]. Nanowires are electrically conductive appendages produced by a number of bacteria and some other microbes. Certain microbial species make use of soluble electron shuttles (or mediators)—usually produced by the cell—and carry electrons to pass through the membranes. Another way of transferring electrons in certain microbial species is the use of cytochromes, which work in a similar fashion as they do during the respiratory electron transport chain. These electrons are directed to the cathode across an external circuit, and for every electron conducted, a proton is transported across the membrane to the cathode to complete the reaction and sustain the electric current [7].
The efficiency of MFCs is greatly influenced by several factors. The substrate being used for electricity generation is one of the most important biological factors; it has a great influence over the composition of microbial consortia in the MFC, along with its power generation capacity [8]. Wastewater is a source of a number of different organic substrates. There is no typical wastewater composition from any industrial source; wastewater characteristics vary according to the nature of the industry and its peak activity. The wastewater coming from different industries contains different substrates, e.g., the wastewater being released from the textile industry mostly contains dyes, starch, fats, acetate, surfactants, waxes, etc. [9], which is totally different from that coming from the pharmaceutical industry, which can contain antibiotics, hormones, etc. [10]. Even the wastewater from a single industry—e.g., the food processing industry—mostly contains organic substrates belonging to different chemical classes [11].
Various classes of compounds have variable potential of power generation in an MFC [12]. It is hypothesized that a mixture of compounds in an MFC contributes differently to the generation of energy. Research was conducted to study the effect of different types and concentrations of substrates on the performance of anaerobic microbial fuel cells [13]. In a study, the MFCs were fed with various types of substrates, including acetate, glucose, and sucrose; however, the chemical oxygen demand (COD) concentration was fixed to 1000 mg/L. The acetate was studied for three various concentrations of 500, 2000, and 3000 mg/L of COD. Acetate had the greatest energy production among the three different substrates, with the greatest power density and COD removal of 91 mW/m2 and 77%, respectively [13]. Studies show that there is a significant effect of the type and concentration of the organic substrate on the performance of the MFC. For the same organic load, acetate is the most efficient substrate in comparison to glucose (single sugar) and sucrose (double sugar). In another study, it was concluded that the greatest COD removal of 82% and a power density of 121.39  ±  2.12 mW m−2 were obtained in the MFC that was connected to an external resistance of 220 Ω, using sucrose as an energy source [14].
Wastewater from fish markets, with high blood and protein content, was treated using an anaerobic microbial fuel cell [15]. The increased electrochemical activity of the anodic biofilm of the MFC that was operated with raw fish market wastewater—as compared to that of the MFC operated with synthetic wastewater—further supported the increased electrogenic activity, as well as suppression of methanogenesis, due to the occurrence of greater ammonium concentration in the feed [15]. In another study, seafood industry wastewater was treated using a microbial fuel cell under saline conditions. The results showed COD removal of 85% to the organic load of 1.25 g COD/L under saline conditions [16].
The above review highlights how various substrates have been treated in MFCs under varying conditions. Still, there was a need to treat acetic acid, sucrose, albumin, blood, and their mixture with the same MFC under anaerobic conditions. In view of the presence of various compounds in the industrial wastewater, the present investigation aimed to evaluate the selected carbohydrates, proteins, lipids, blood, and their mixture in an MFC treating synthetic wastewater.

2. Materials and Methods

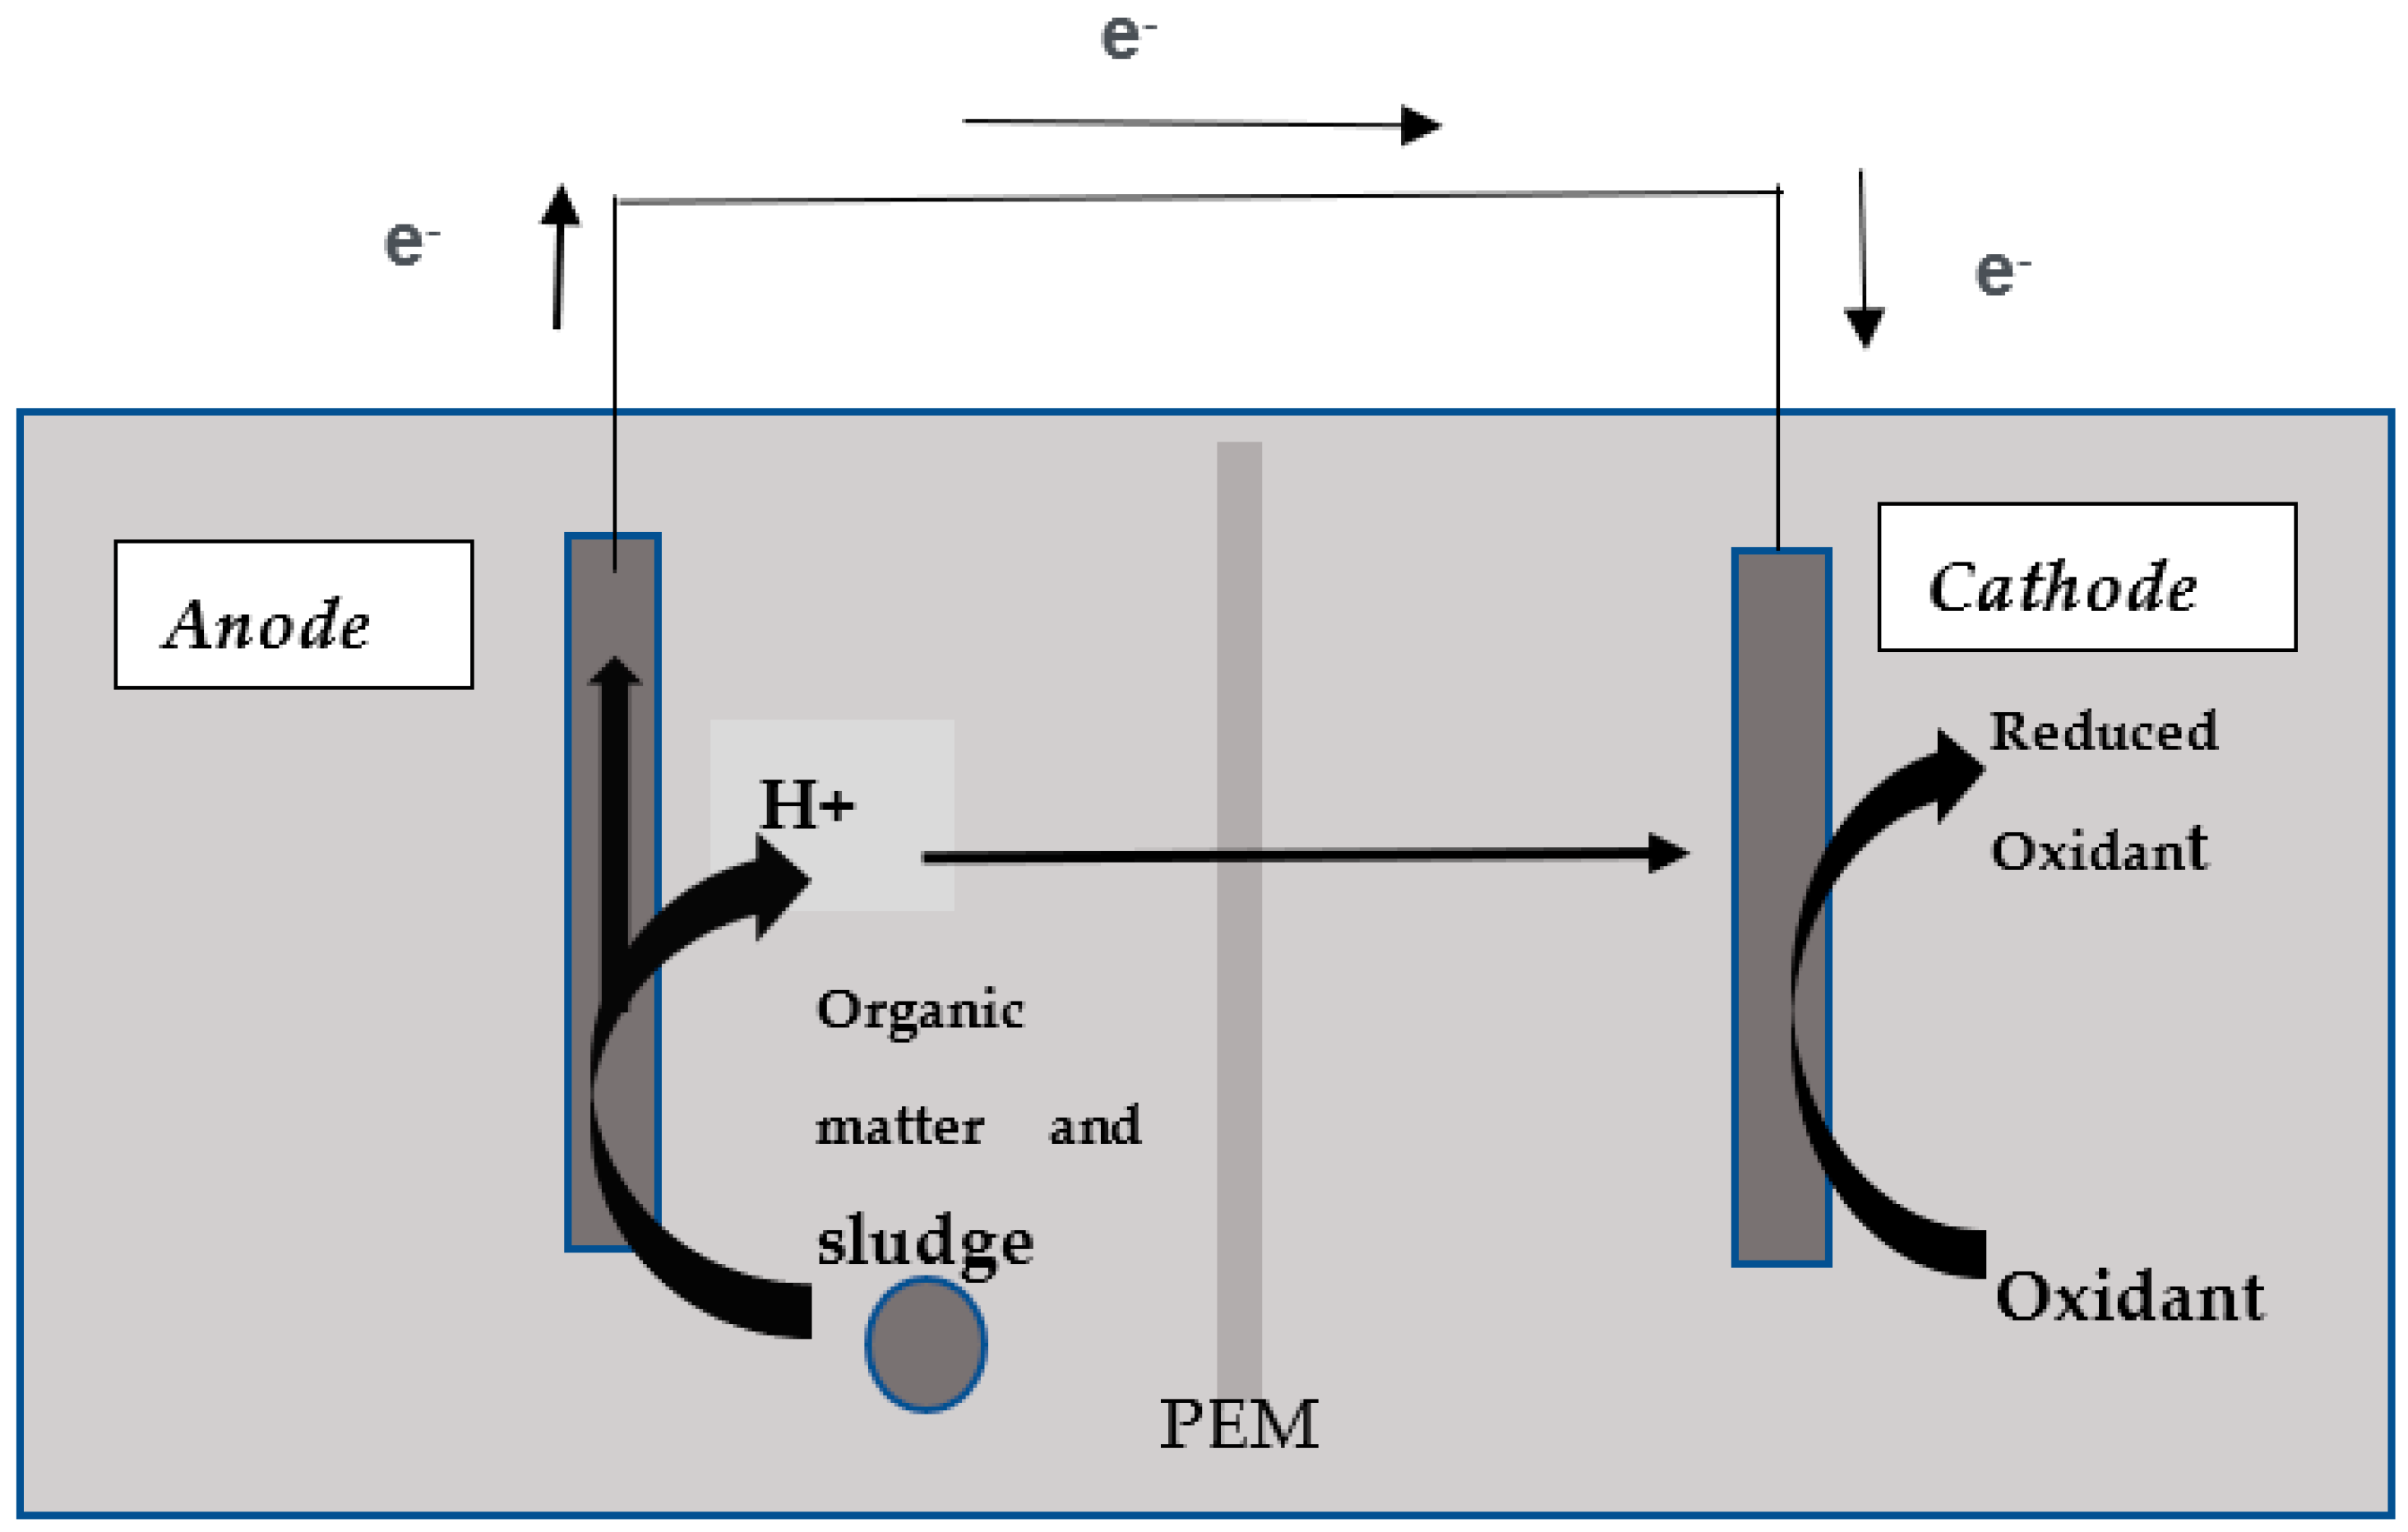
2.1. MFC Construction

A dual-chambered glass MFC consisting of an anode and cathode was constructed and illustrated in Figure 1. The MFC had two chambers with a working volume of 500 mL each, which were separated from one another by the cation-exchange membrane (CEM, CMI-7000, Membrane International, Inc., Ringwood, NJ, USA). The MFC used in the current research was made of transparent Perspex glass material. Electrodes made of titanium and carbon cloth were suspended in both chambers parallel to the cation-exchange membrane. Carbon cloth was used as the anode (16 cm2), and titanium wire (17.4 cm2) was used as the cathode, as described by Abbasi et al. [17].
Various substrates were chosen based on the assumption that these are normally present in the wastewater. There is no typical wastewater composition from any industrial source—the wastewater characteristics vary according to the nature of the industry and its peak activity. Synthetic wastewater was formulated based on the enrichment principle in order to study the treatability of various substrates in the MFC. The representative substrates used in the experiment included acetic acid, sucrose, albumin, blood samples taken from animal butcher shop, and mixed substrates (a mixture of acetic acid, sucrose, albumin, and blood, contributing equal amounts of COD). Sludge (150 mL) from an already working anaerobic MFC was used in the anodic chamber as a source of exoelectrogens. In each MFC, eight different concentrations (ranging from 50 ppm to 1000 ppm) of a single substrate were tested. These eight concentrations ranged from the minimum to maximum concentrations, which could be treated by the microbial communities present in the sludge. The experiments were repeated thrice in the MFC. Beyond the maximum concentration, the performance of the MFC could be deteriorated. These procedures are usual practice in wastewater treatment optimization under laboratory conditions. The mixed substrates had equal ratios of 1:1. Each substrate solution (300 mL) was added to the anode, along with the trace element solution made as described by Mahmood et al. [18]. Nitrogen was purged through both chambers for 15 min to get rid of any oxygen, and then the chambers were sealed in order to maintain anaerobic conditions.

2.2. MFC Operation

Different concentrations of each substrate were fed to the anodic chamber one by one in batch mode, where anaerobic conditions were maintained. Potassium phosphate buffer (pH = 8) and 100 mg/L potassium permanganate (KMnO4) were added to the cathodic chamber. The purpose of adding KMnO4 was to act as an electron acceptor for electrons coming from the cathode chamber. The reaction time was 24 h for the MFC in batch mode. Each experiment consisted of seven runs, and the data were presented as the means of all of the values. The volatile suspended solids (VSS) were measured at the end of each week. The MFC was operated in batch mode at 35 °C. The external resistance was 1000 Ω.

2.3. Analytical Procedure

The COD and pH concentration of both influent and effluent were analyzed according to the standard methods for wastewater analysis set out by the American Public Health Association (APHA) [19]. The closed reflux colorimetric method, using a digester (HACH-LTG 082.99.40001), was used to measure COD [19].
Voltage was recorded using a voltameter. Coulombic efficiency was found using the formula Cp/Cti × 100, where Cp is the Coulombs actually generated, and Cti is theoretical amount of Coulombs that would have been generated if all of the substrate was used. The number of electrons generated from various substrates was calculated as described by Cai et al. [20].

3. Results and Discussion

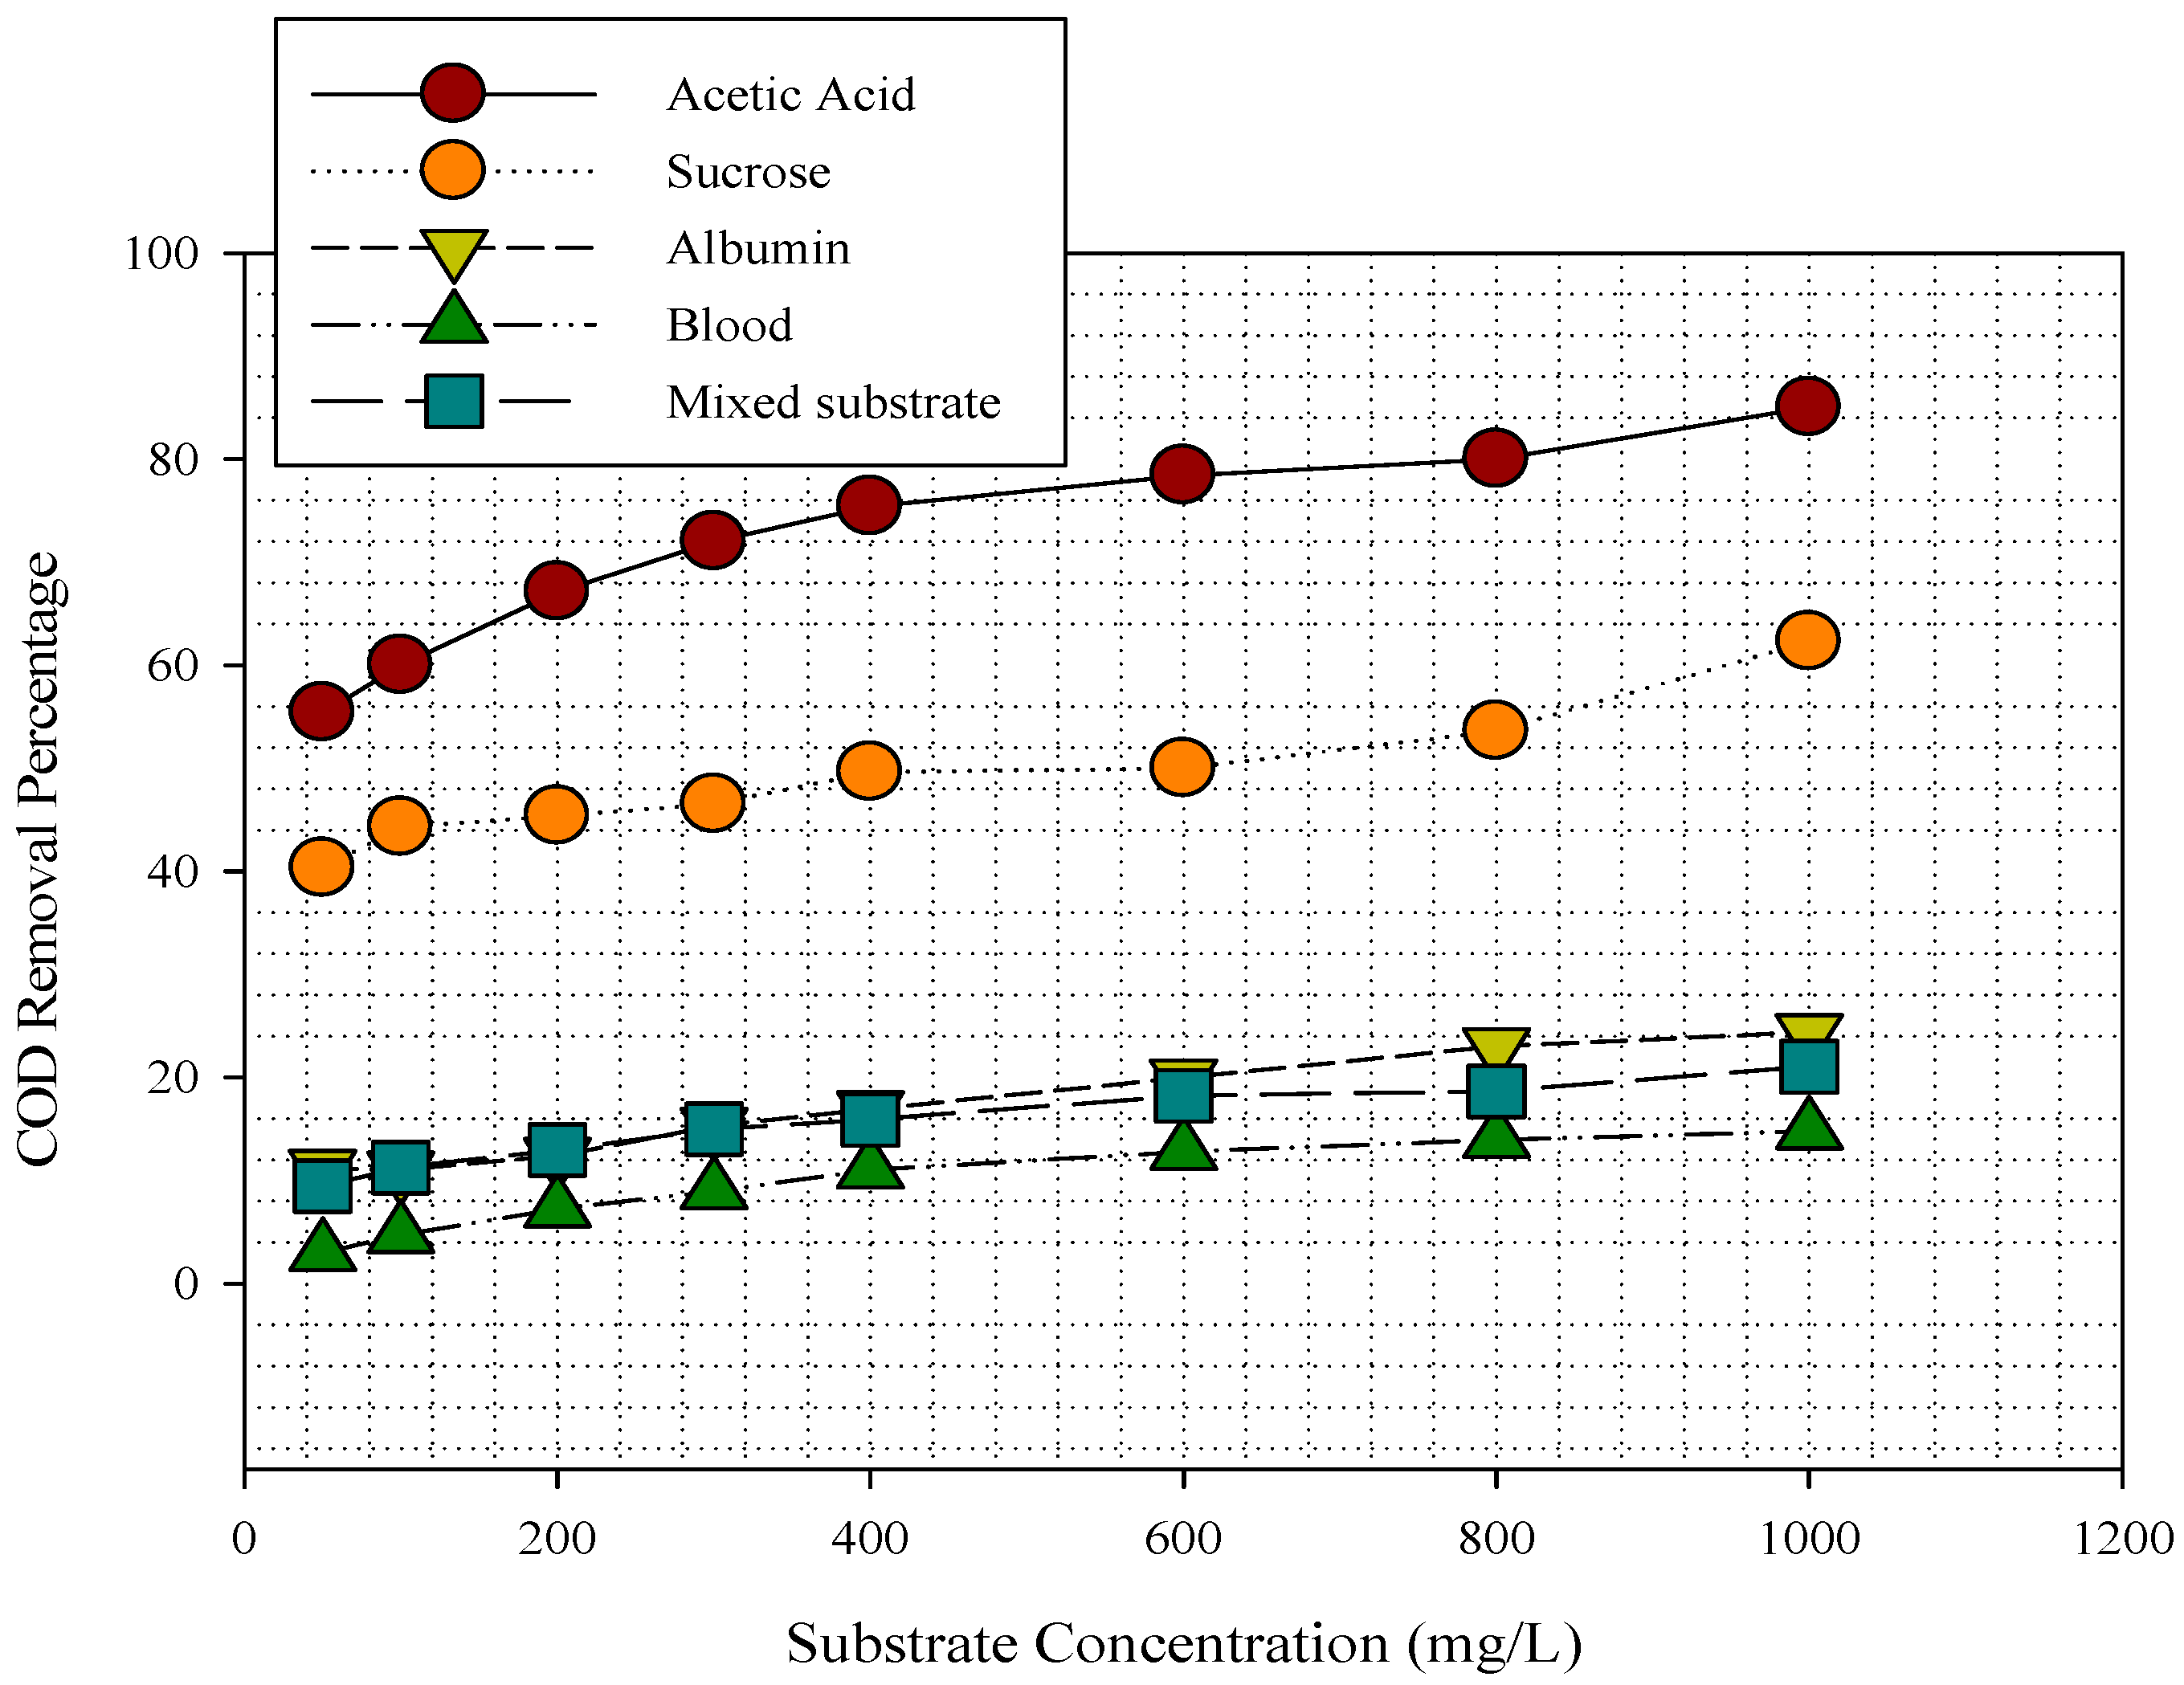
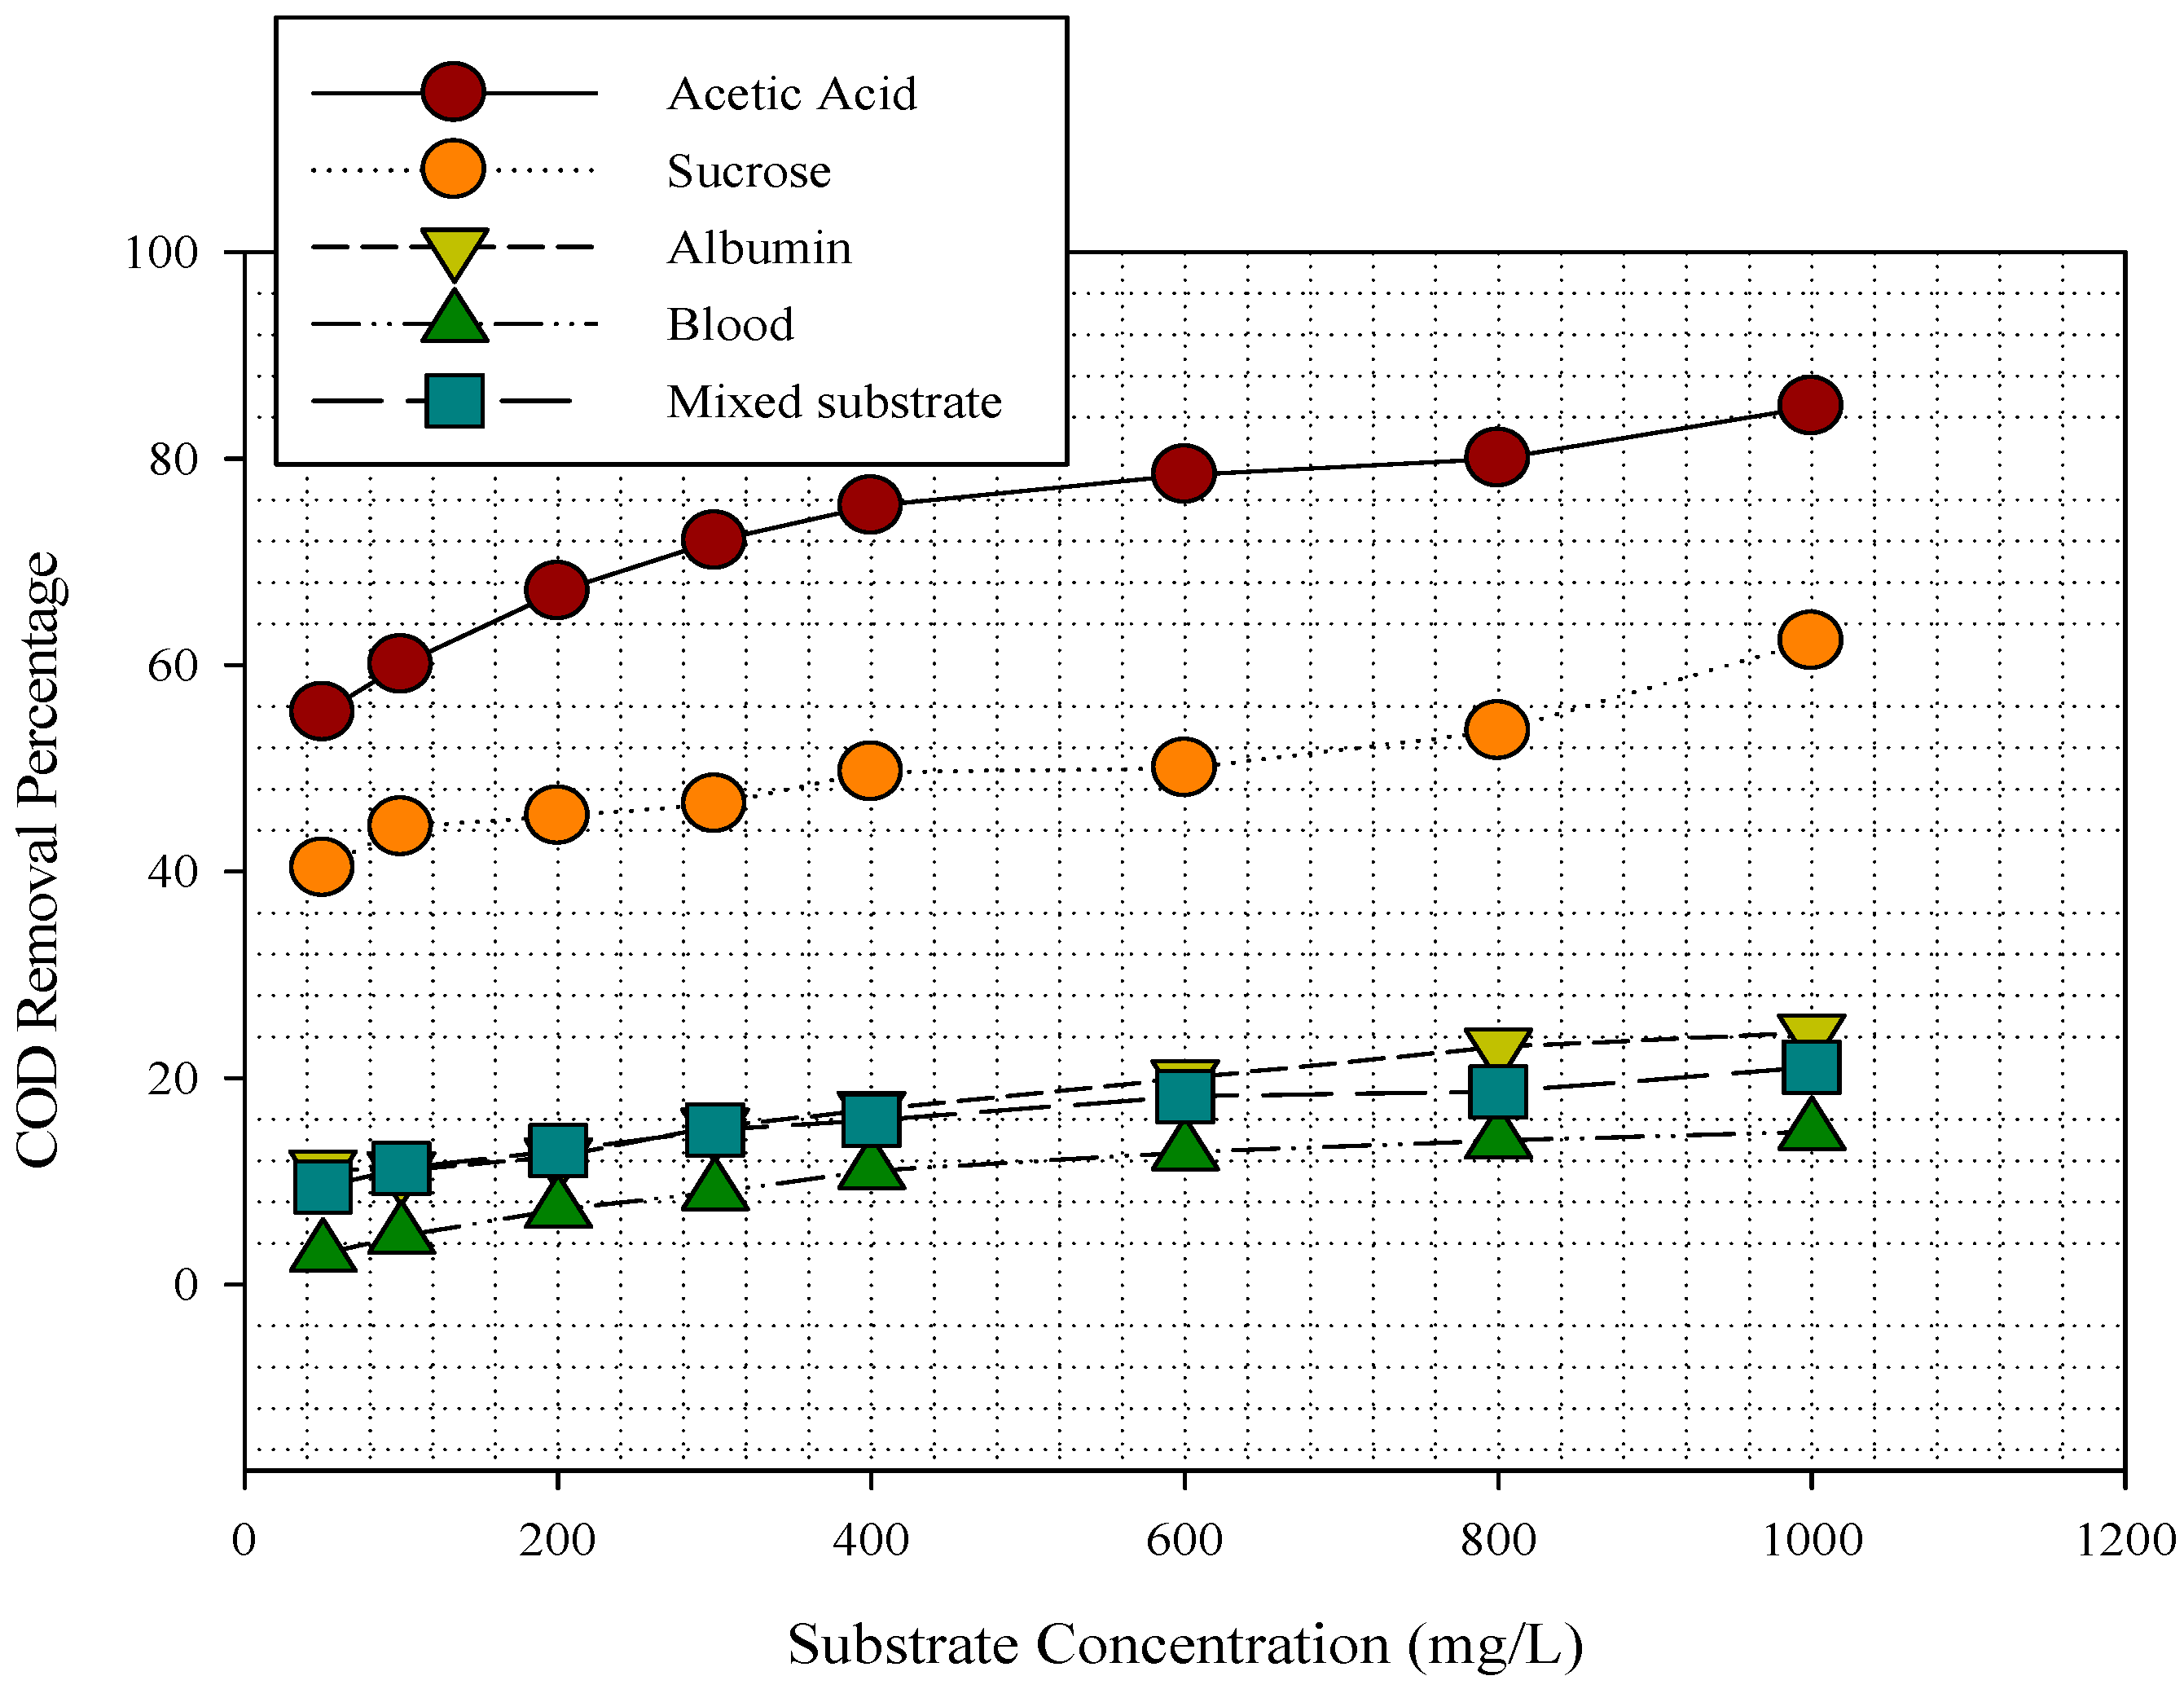
3.1. Substrates Removal in MFC

The performance of the MFC was examined by using various concentrations of each given substrate (50–1000 mg/L). The purpose was to determine which substrate could be most readily removed by the MFC, and to study the relationship between influent concentration and removal efficiency. The reaction time was 24 h, and a pH of 8 was maintained with the help of phosphate buffer. The MFC achieved the highest removal efficiency when acetic acid was used in the system. When the acetic acid concentration was increased from 50 mg/L to 1000 mg/L, the COD removal efficiency increased from 55% to 85% (Figure 2). After each run of 24 h, sucrose showed the second highest COD removal efficiency (Figure 2), with values in the range of 40–62%. When albumin concentration was increased in the MFC from 50 mg/L to 1000 mg/L, the COD removal efficiency was 11% and 24%, respectively (Figure 2).
The mixture of all of these substrates was also tested in the MFC, and 9–21% of the total added amount was removed (Figure 2). The least COD removal efficiency was demonstrated for blood; when 50 mg/L blood was used in the MFC, only 3% COD removal efficiency was achieved. When the blood concentration was increased to 1000 mg/L, 14.8% removal efficiency was observed (Figure 2). The substrates showed the highest COD removal efficiencies at 1000 mg/L because of the greater amount of organic matter available for microbial degradation. Similar results have been reported when COD-rich wastewater was treated in MFCs [21,22].
The volatile solids (VS) of a sludge may be considered akin to the active microbial species in any biological system. The dynamics of VS at various substrate concentrations are presented in Figure 3. It is evident that the growth of volatile solids was greatest for acetic acid utilization, followed by sucrose, albumin, mixed substrates, and blood. The VS growth in the MFC clearly explained the observation of the maximum voltage generation for acetic acid.

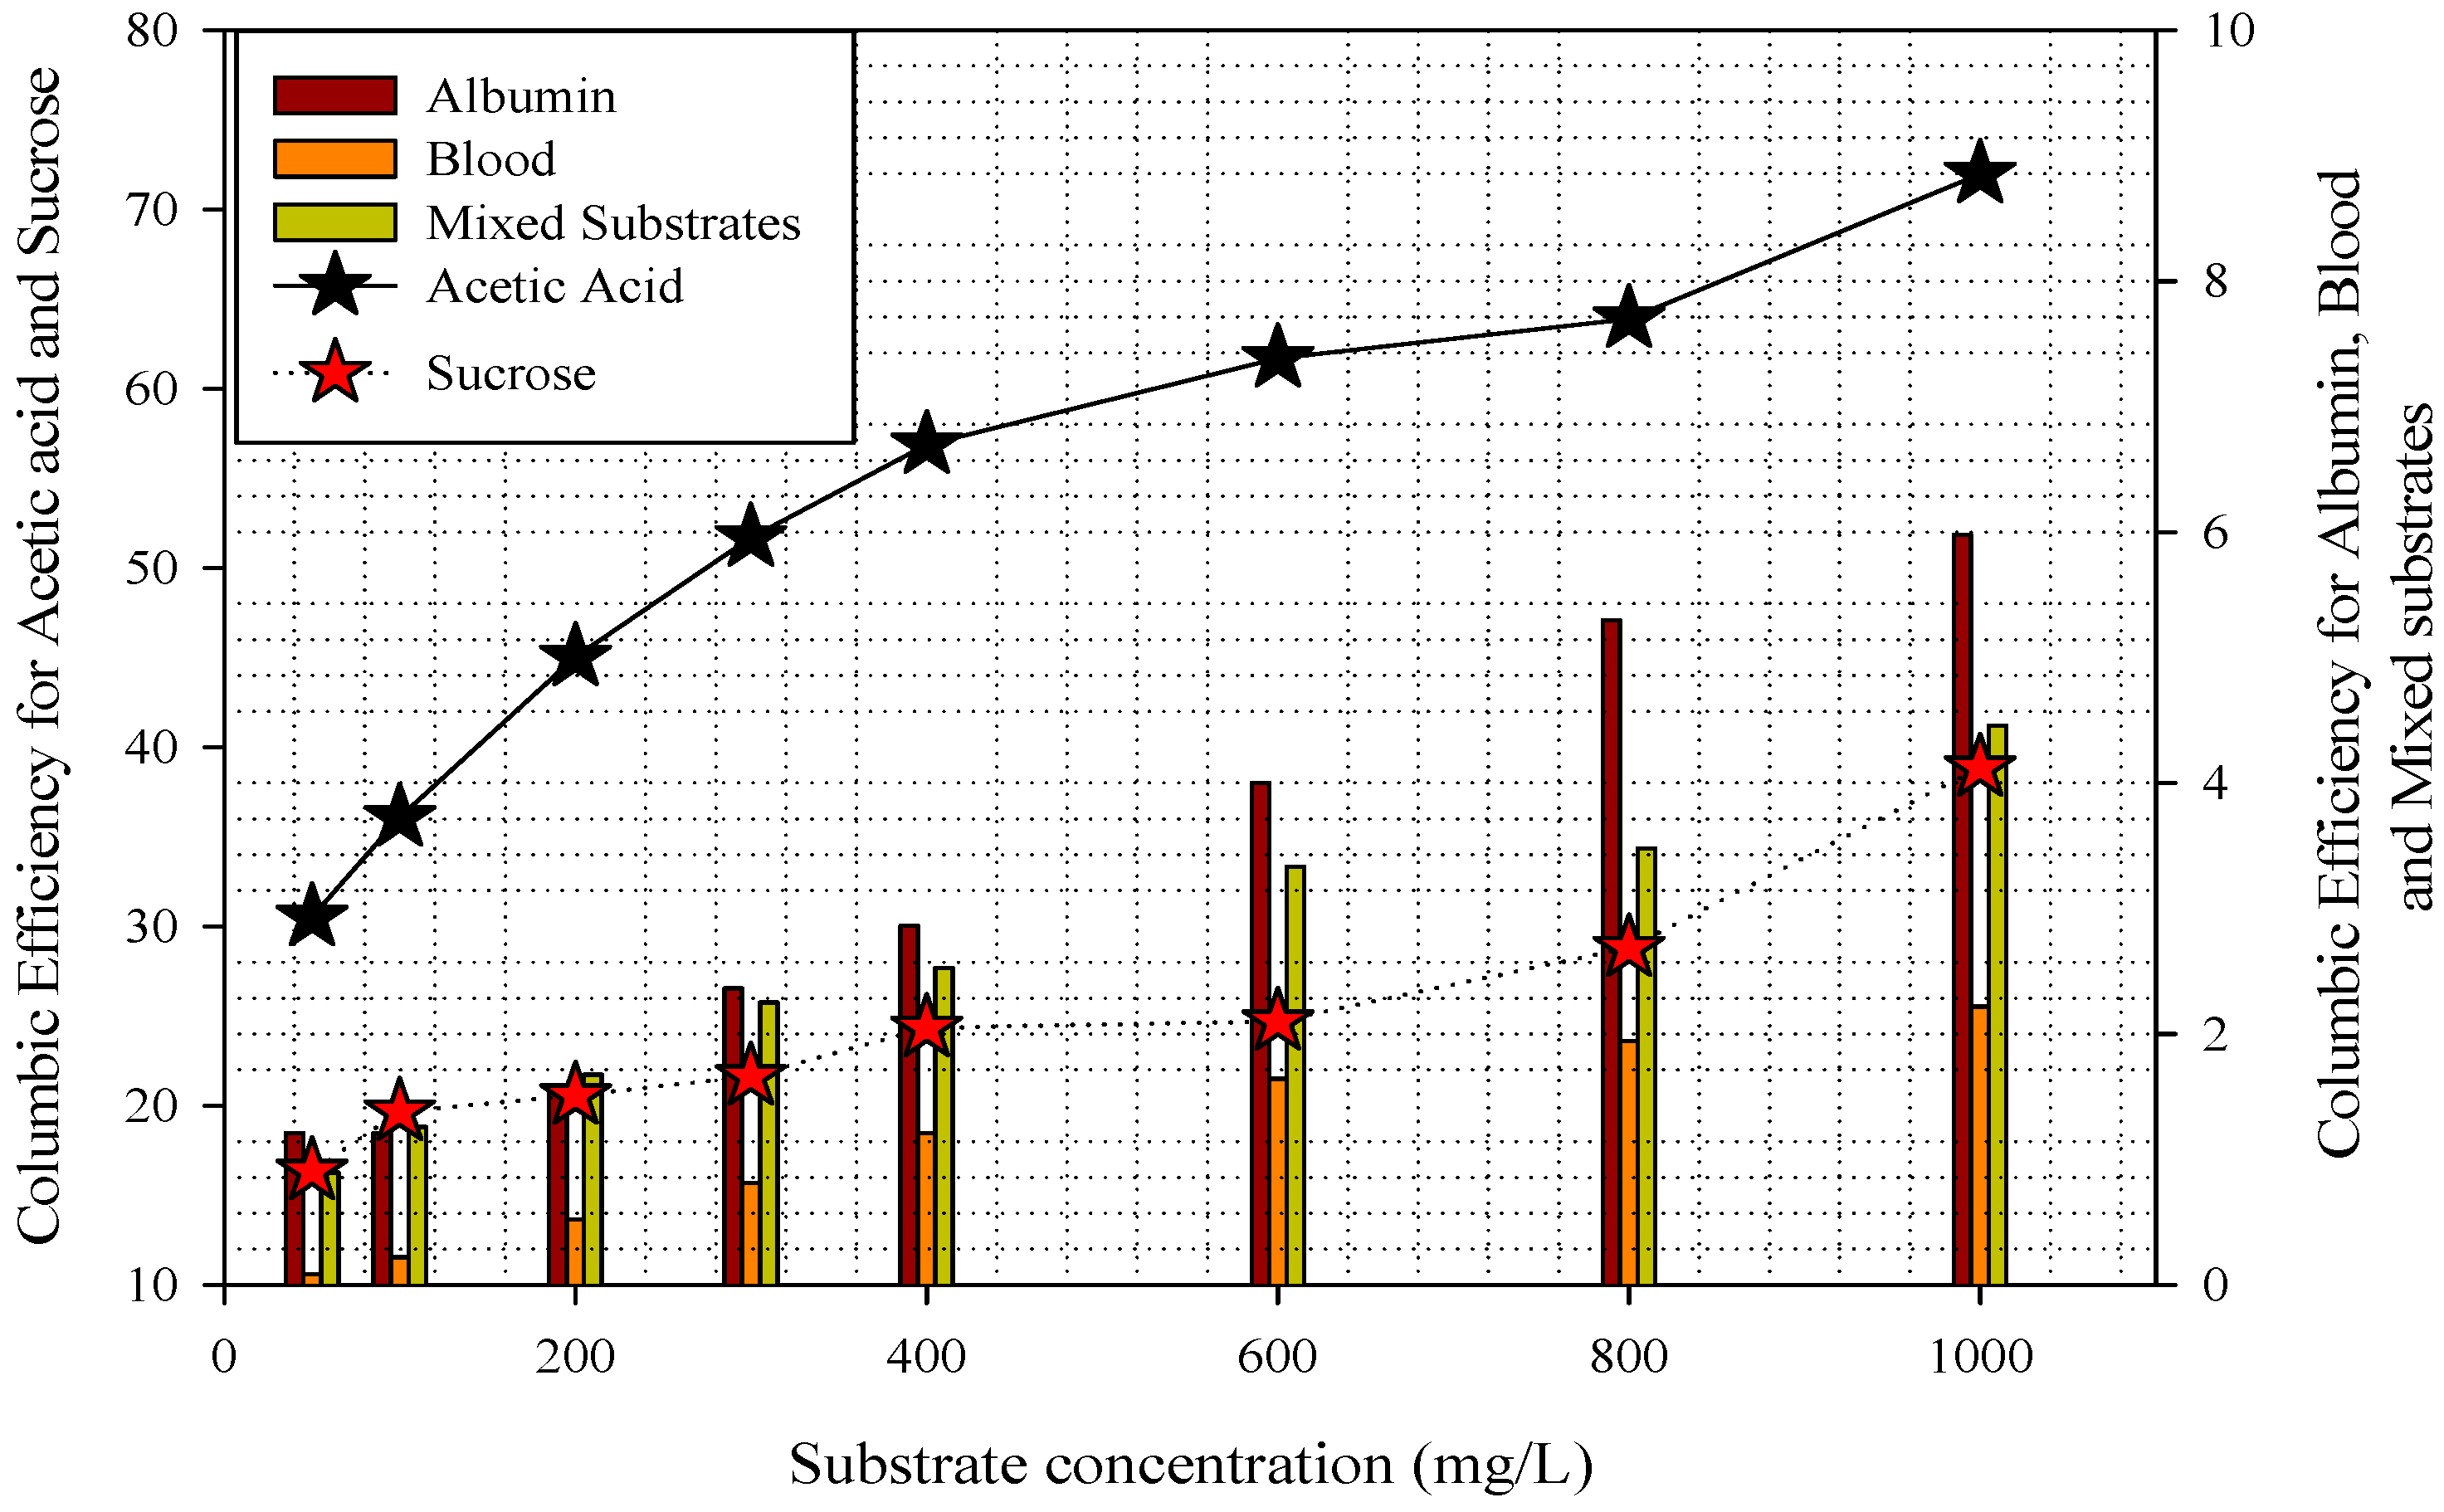
3.2. Substrate Removal, Current, Power Density, and Coulombic Efficiency

Each substrate was tested in the MFC, while keeping the operating conditions uniform. The results were used to calculate the Coulombic efficiencies. The highest Coulombic efficiency was found for acetic acid (Figure 4), whose value ranged from 30 to 72%, increasing when the influent concentration was increased from 50 mg/L to 1000 mg/L. For each substrate, the Coulombic efficiency increased with the increase in influent concentration (Figure 5). Sucrose showed the second highest efficiency, with values ranging from 16 to 39%. The Coulombic efficiencies for albumin, mixed substrates, and blood were found in the ranges of 1.2–6%, 0.89–4.5%, and 0.84–2.2%, respectively. A positive correlation was found between the substrate concentration and Coulombic efficiency. As the substrate concentration increases, more substrate is degraded, leading to more electronic production, which eventually increases Coulombic efficiency [22]. Current and power density observed at various substrate concentrations treated in the anaerobic MFC are shown in Table 1. It is clearly evident from Table 1 that current and power density are linearly correlated with the amount of substrate—especially acetic acid. Acetic acid conversions in the MFC resulted in the greatest current and power density, compared to other substrates alone or in their combination.
Coulombic efficiency indicates how many electrons (from the total electrons generated by a particular substrate) are accepted in electricity generation by the MFC after a particular time. The complexity of the substrates seemed to exert an impact on Coulombic efficiency. Acetic acid contains two carbon atoms—it is a carbon-neutral source that must be hydrolyzed by electrogenic bacteria in order to generate electrons [23]. Sucrose (a 22-carbon compound) is a disaccharide that needs hydrolysis before it can be used by microorganisms, while many microbial species may uptake sucrose for assimilatory metabolism as well. Albumin is a protein with 123 carbon atoms, which indicates the complexity of albumin in comparison to acetic acid [24]. Blood also contains proteins—namely, the heme protein—which makes its degradation more difficult.

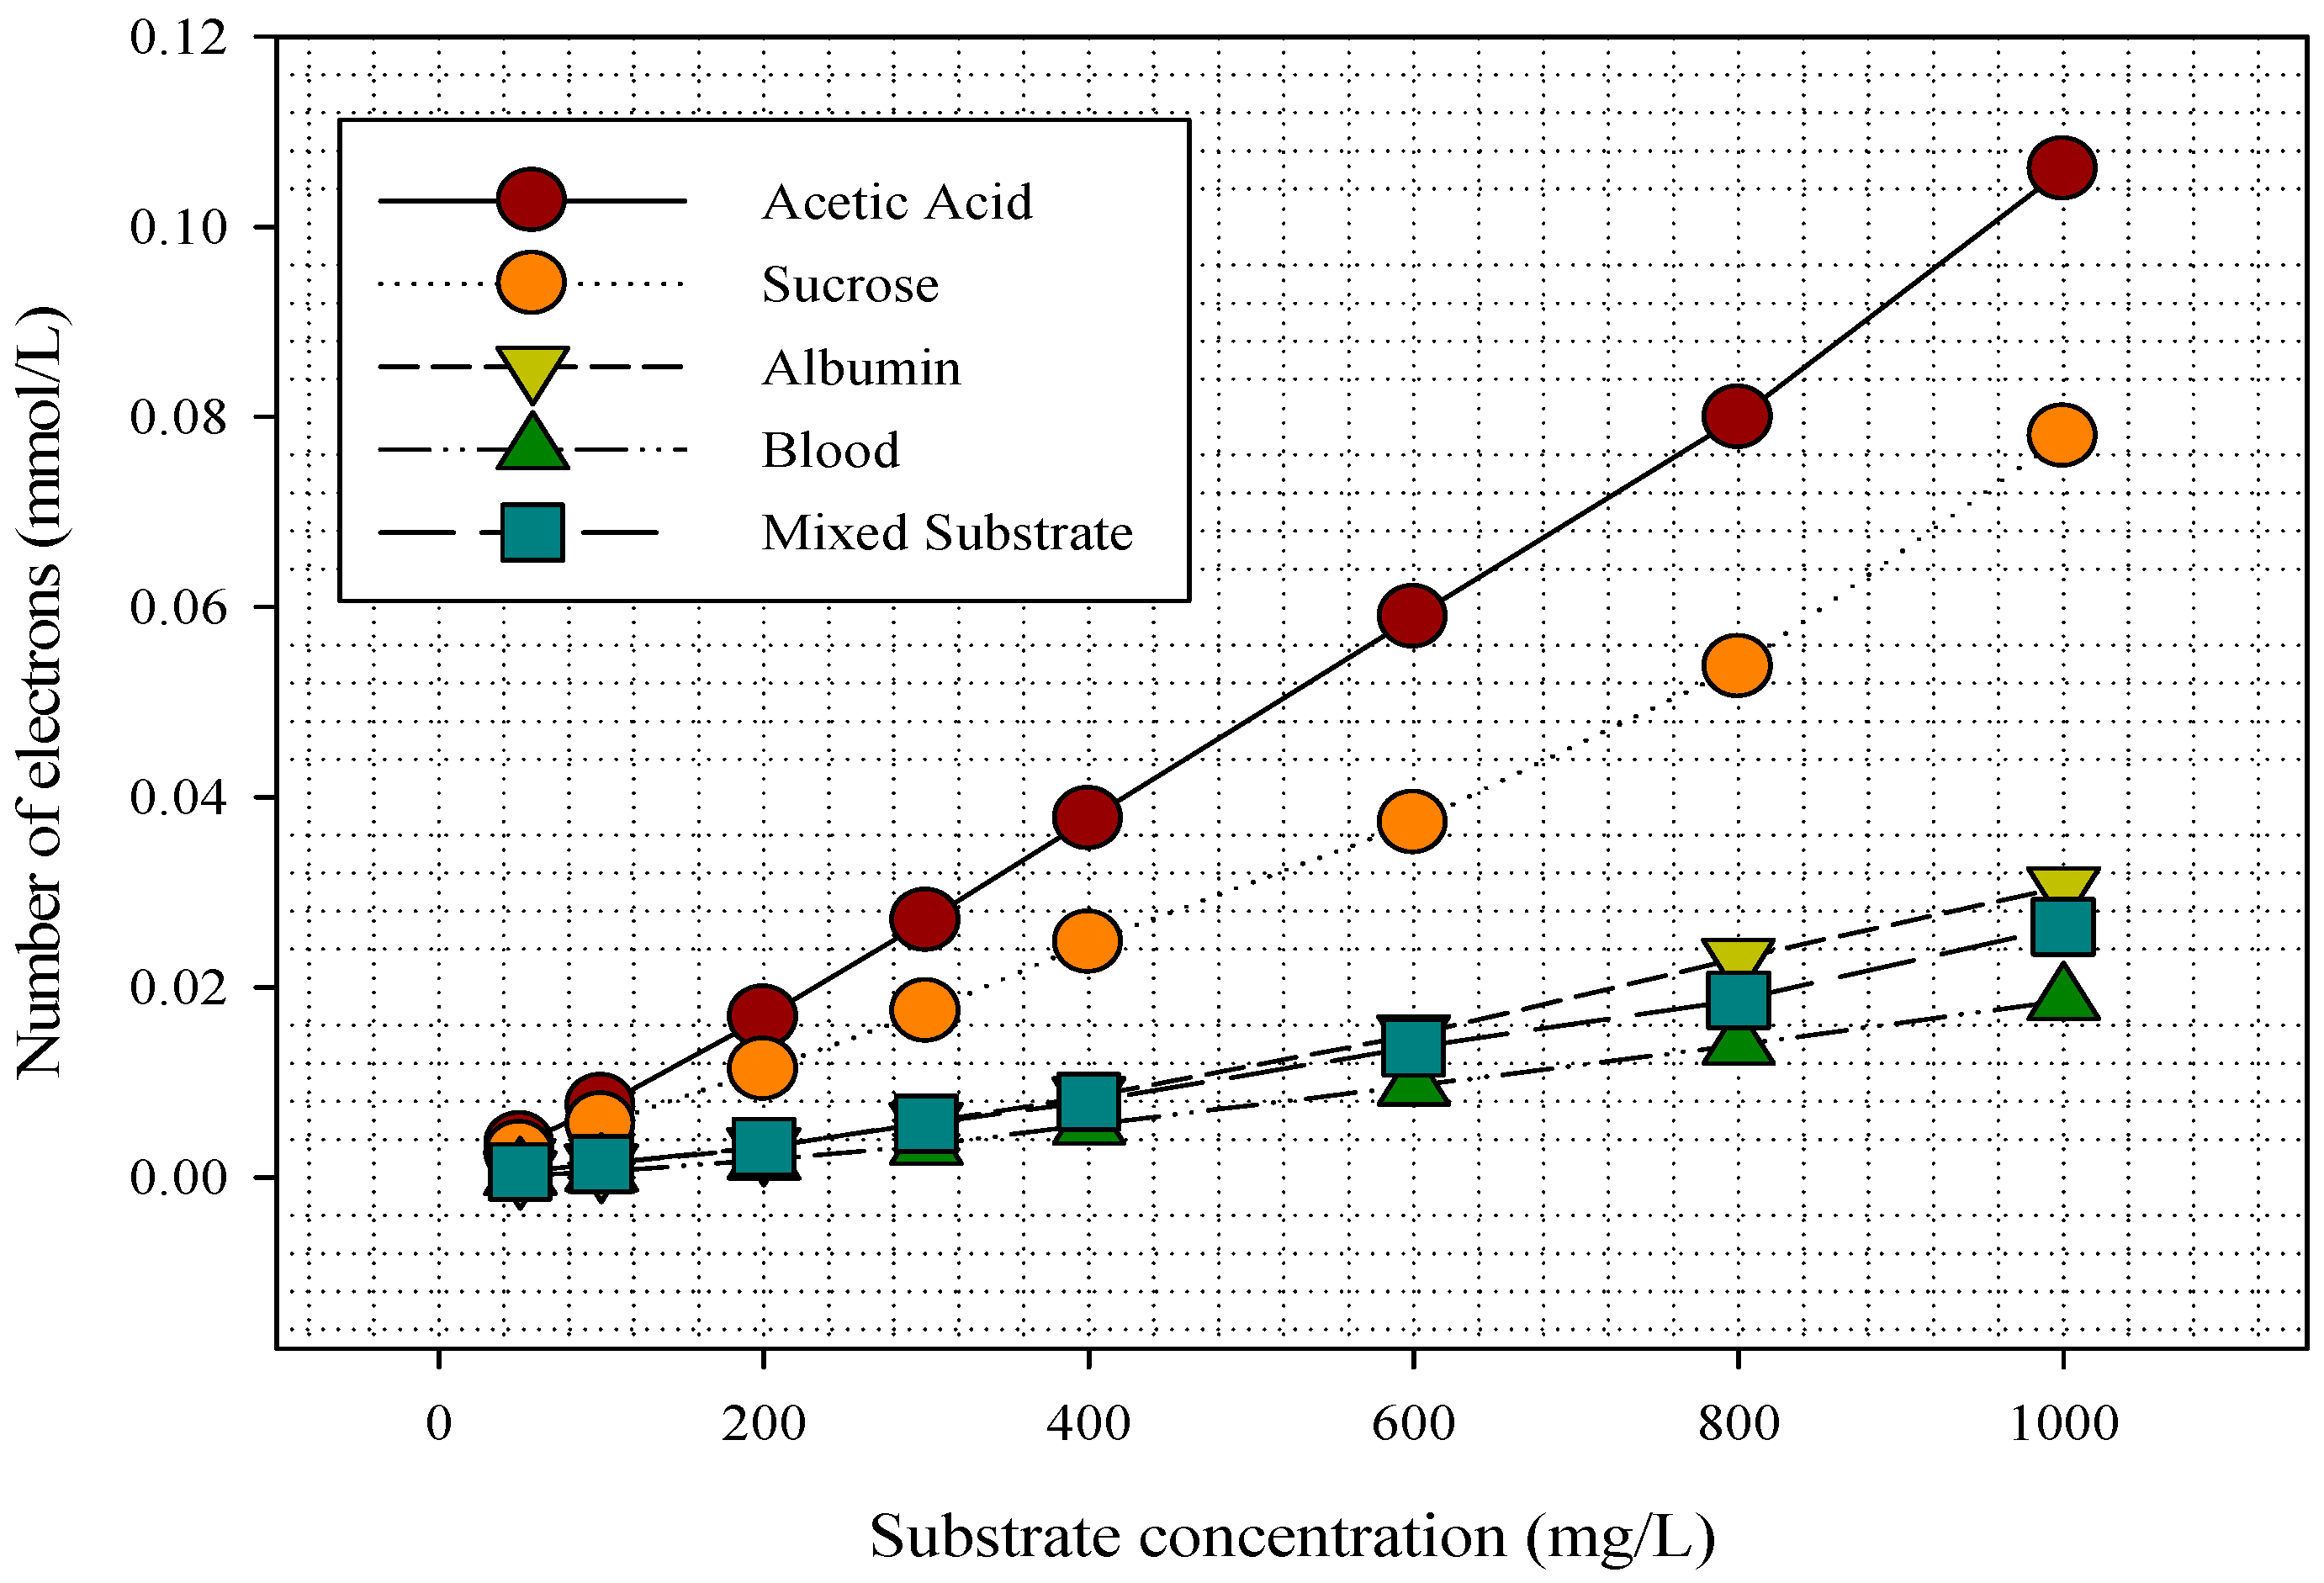
3.3. Electron and Voltage Generation in the MFC

The MFC was operated at an HRT of 24 h in an anode chamber with an external resistance of 1000 Ω. The experiment was conducted using titanium wires as electrodes. Various concentrations (50–1000 mg/L) of each substrate were fed into the anode, and the number of electrons accepted by the anode was calculated (Figure 6). The electrode accepted the most electrons in the case of acetic acid—i.e., 0.1060 mmol/L when the influent concentration was 1000 mg/L. When the acetic acid concentration was kept at 50 mg/L, the number of electrons used by anode was 3.452 × 10⁻³ mmol/L. After acetic acid, sucrose exhibited the most promising results—i.e., 0.078 mmol/L electrons were transferred to the electrode when 1000 mg/L substrate solution was used. In the case of albumin as the substrate, the number of electrons accepted by the anode increased from 6.87 × 10⁻⁴ mmol/L to 0.031 mmol/L with the increase in substrate concentration. The number of electrons that were accepted by the titanium wire when 1000 mg/L of mixed substrates was used in the MFC was 0.0264 mmol/L. For blood, 0.0186 mmol/L electrons were accepted at the anode. A similar trend was observed for all of the substrates—i.e., with the increase in substrate concentration, the number of electrons accepted by the anode increased.
When substrates are biodegraded by microbes, a variable number of electrons are released. In an ideal system, all of the electrons would have been accepted by the electrodes, but only a percentage of the total released electrons are accepted by the electrode, resulting in the electricity generation [25]. The voltage generated by the MFC was variable for the different substrates and their concentrations used.
The highest voltage was produced using acetic acid at a substrate concentration of 1000 mg/L. At this concentration, 769 mV were produced, whereas the lowest concentration of 50 mg/L of acetic acid produced 201 mV (Figure 7). This was followed by sucrose, with a production of 103 mV and 356 mV at the lowest and highest substrate concentrations of 50 mg/L and 1000 mg/L, respectively. The lowest voltage was observed for the mixed substrate, producing 12 and 61 mV at the lowest and highest substrate concentrations, respectively. The production of voltage and the availability of electrons to the anode are directly proportional to the concentration of the substrate in the solution within the COD range studied in the experiment.
The increase in voltage production with an increase in the substrate concentration for all substrates could be a result of the enzyme reactions by the microbes, which speed up in relation to the concentration of substrate present [26].
It was also seen that there is a positive correlation between removal efficiency and amount of voltage generated. Acetic acid showed the highest removal efficiency (85%), as well as the highest amount of voltage generated—i.e., 769 mV (Figure 7). This was followed by sucrose, which exhibited a removal efficiency of 62% and generated 356 mV of electricity (Figure 7). Albumin, mixed substrates, and blood showed 24%, 21%, and 14% removal efficiency, and produced 121 mV, 101 mV, and 61 mV of electricity, respectively (Figure 7).
The number of electrons accepted by the electrodes, voltage generation, and removal efficiency are all related to one another, and come down to the affinity that microbes have for particular substrates [27]. The simpler the compound is, the more affinity the microbes will exhibit for it. It is easier for microbes to take up simpler substrates and use them for their growth and metabolism. Acetic acid is a very simple acid, and does not need to be further degraded before it can be used up by the microbial community [28]. Sucrose cannot be used before it undergoes hydrolysis; this process is carried out by the enzyme sucrase, and converts sucrose to glucose and fructose [29]; these are then further degraded, and then used by microbes. Hence, sucrose degradation takes up a longer time compared to acetic acid to be degraded in the MFC. Albumin is a protein, and when protease enzymes break it down, the main products of degradation are peptides. When peptides undergo hydrolysis, amino acids, sulfur amino acids, and aromatic amino acids are formed [30]; these amino acids are then further degraded into acetate, propionate, butylate, and ammonia before they can be used up by microbes. Blood contains plasma, blood glucose, proteins, nutrients, waste gases, electrolytes, etc. [31]; all of these constituents first need to be broken down into simpler forms before they can be used by microbes for their metabolic processes. The more complex the substrate, the more degradation steps are required for its degradation. Hence, in a given time period, microbes can use acetic acid more efficiently than the more complex substrates, and generate the greatest number of electrons (producing more voltage). A previous study [32] evaluated the possibility of bagasse as a substrate to produce voltage along with COD reduction in an MFC under anaerobic conditions. The authors indicated the possibility of converting bagasse extract into sustainable bioenergy. Another study [33] evaluated MFCs, investigating dark fermentative H2 production effluents alongside operating features (reactor configuration, mode of operation, anode surface, and reactor size). It was concluded that “MFC should be optimized for a well-defined research target (energy recovery, COD removal, etc.)”.

4. Conclusions

The current investigation involved the testing of various represented substrates belonging to carbohydrates, lipids, and proteins in an MFC, to test their potential for voltage generation. Different substrates showed variable performance related to treatability and voltage generation in an anaerobic MFC. Simple organic substances such as acetic acid exhibited the highest COD removal efficiency (85%) and Coulombic efficiency, as well as voltage generation (769 mV), current, and power generation. It was observed that the anode accepted the most electrons in the case of acetic acid, and the electrical conductivity of the anode was directly proportional to the voltage generation, current, and power density. A positive correlation exists between the amount of substrate (COD), voltage generation, current, power density, and Coulombic efficiency. Complex substrates such as blood showed the lowest removal efficiency (14.8%), as well as the lowest Coulombic efficiency (2.2%). Future work should be conducted on testing organic and inorganic pollutants and evaluating their efficiency for power generation.

Author Contributions

Conceptualization, M.T., M.B. and J.W.; methodology, Z.A.B.; software, A.J.M.; validation, Q.M. and S.H., formal analysis, Q.M.; resources, M.S.A. and Q.M.; data curation, M.T.; writing—original draft preparation, M.S.A. and M.O., M.T.; writing—review and editing, J.W., M.B. and M.O.; visualization, Q.M.; supervision, S.H., A.G., M.M.A.-A.; funding acquisition, S.H. and M.O. All authors have read and agreed to the published version of the manuscript.

Funding

The authors are grateful to the Deanship of Scientific Research, King Saud University for funding through Vice Deanship of Scientific Research Chairs and thankful to the financial support funded by the Deanship of Scientific Research at Princess Nourah bint Abdulrahman University through the Fast-track Research Funding Program.

Institutional Review Board Statement

Not applicable.

Informed Consent Statement

Not applicable.

Data Availability Statement

Not applicable.

Acknowledgments

The authors are grateful to the Deanship of Scientific Research, King Saud University for funding through Vice Deanship of Scientific Research Chairs and thankful to the financial support funded by the Deanship of Scientific Research at Princess Nourah bint Abdulrahman University through the Fast-track Research Funding Program.

Conflicts of Interest

The authors declare no conflict of interest.

References

  1. McCarty, P.L.; Bae, J.; Kim, J. Domestic wastewater treatment as a net energy producer—Can this be achieved? Environ. Sci. Technol. 2011, 45, 7100–7106. [Google Scholar] [CrossRef]
  2. Watanabe, K. Recent developments in microbial fuel cell technologies for sustainable bioenergy. J. Biosci. Bioeng. 2008, 106, 528–536. [Google Scholar] [CrossRef]
  3. Rathour, R.; Kalola, V.; Johnson, J.; Jain, K.; Madamwar, D.; Desai, C. Treatment of various types of wastewaters using microbial fuel cell systems. In Microbial Electrochemical Technology; Elsevier: Amsterdam, The Netherlands, 2019; pp. 665–692. [Google Scholar]
  4. Franks, A.E.; Nevin, K.P. Microbial fuel cells, a current review. Energies 2010, 3, 899–919. [Google Scholar] [CrossRef]
  5. Duet, Z.; Li, H.; Gu, T. A state-of-the-art review on microbial fuel cells: A promising technology for wastewater treatment and bioenergy. Biotechnol. Adv. 2007, 25, 464–482. [Google Scholar]
  6. Oliveira, V.B.; Simões, M.; Melo, L.F.; Pinto, A.M.F.R. Overview on the developments of microbial fuel cells. Biochem. Eng. J. 2013, 73, 53–64. [Google Scholar] [CrossRef]
  7. Lee, D.J.; Liu, X.; Weng, H.L. Sulfate and organic carbon removal by microbial fuel cell with sulfate-reducing bacteria and sulfide-oxidising bacteria anodic biofilm. Bioresour. Technol. 2014, 156, 14–19. [Google Scholar] [CrossRef]
  8. Liu, Z.; Liu, J.; Zhang, S.; Su, Z. Study of operational performance and electrical response on mediator-less microbial fuel cells fed with carbon-and protein-rich substrates. Biochem. Eng. J. 2009, 45, 185–191. [Google Scholar] [CrossRef]
  9. Moga, I.C.; Ardelean, I.; Petrescu, G.; Crăciun, N.; Popa, R. The potential of biofilms from moving bed bioreactors to increase the efficiency of textile industry wastewater treatment. Ind. Text. 2018, 69, 412–418. [Google Scholar]
  10. Pal, P. Treatment and disposal of pharmaceutical wastewater: Toward the sustainable strategy. Sep. Purif. Rev. 2018, 47, 179–198. [Google Scholar] [CrossRef]
  11. Galanakis, C.M. (Ed.) Sustainable Food Systems from Agriculture to Industry: Improving Production and Processing; Academic Press: Cambridge, MA, USA, 2018. [Google Scholar]
  12. Ebadinezhad, B.; Ebrahimi, S.; Shokrkar, H. Evaluation of microbial fuel cell performance utilizing sequential batch feeding of different substrates. J. Electroanal. Chem. 2019, 836, 149–157. [Google Scholar] [CrossRef]
  13. Ullah, Z.; Zeshan, S. Effect of substrate type and concentration on the performance of a double chamber microbial fuel cell. Water Sci. Technol. 2020, 81, 1336–1344. [Google Scholar] [CrossRef]
  14. Cordova-Bautista, Y.; Ramirez-Morales, E.; Perez-Hernandez, B.; Ojeda-Morales, M.E.; Lopez-Lazaro, J.S.; Martinez-Pereyra, G. Electricity Production and Bioremediation from Synthetic Sugar Industry Wastewater by Using Microbial Isolate in Microbial Fuel Cell. Sugar Technol. 2020, 22, 820–829. [Google Scholar] [CrossRef]
  15. Bhowmick, G.D.; Neethu, B.; Ghangrekar, M.M.; Banerjee, R. Improved Performance of Microbial Fuel Cell by In Situ Methanogenesis Suppression While Treating Fish Market Wastewater. Appl. Biochem. Biotechnol. 2020, 192, 1060–1075. [Google Scholar] [CrossRef] [PubMed]
  16. Pugazhendi, A.; Eid Al-Mutairi, A.; Jamal, M.T.; Jeyaku, R.B.; Palanisamy, K. Treatment of seafood industrial wastewater coupled with electricity production using air cathode microbial fuel cell under saline condition. Int. J. Energy Res. 2020, 44, 12535–12545. [Google Scholar] [CrossRef]
  17. Abbasi, U.; Jin, W.; Pervez, A.; Bhatti, Z.A.; Tariq, M.; Shaheen, S.; Iqbal, A.; Mahmood, Q. Anaerobic microbial fuel cell treating combined industrial wastewater: Correlation of electricity generation with pollutants. Bioresour. Technol. 2016, 200, 1–7. [Google Scholar] [CrossRef] [PubMed]
  18. Mahmood, Q.; Zheng, P.; Cai, J.; Hayat, Y.; Hassan, M.J.; Wu, D.L.; Hu, B.L. Sources of sulfide in waste streams and current biotechnologies for its removal. J. Zhejiang Univ.-Sci. A 2007, 8, 1126–1140. [Google Scholar] [CrossRef]
  19. APHA. Standard Methods for the Examination of Water and Wastewater, 21st ed.; American Public Health Association: Washington, DC, USA, 2005. [Google Scholar]
  20. Cai, J.; Mahmood, Q.; Sun, Y.; Wang, K.; Lou, J.; Wang, R. Coupled substrate removal and electricity generation in microbial fuel cells simultaneously treating sulfide and nitrate at various influent sulfide to nitrate ratios. Bioresour. Technol. 2020, 306, 123174. [Google Scholar] [CrossRef]
  21. Ye, Y.; Ngo, H.H.; Guo, W.; Chang, S.W.; Nguyen, D.D.; Liu, Y.; Wang, J. Effect of organic loading rate on the recovery of nutrients and energy in a dual-chamber microbial fuel cell. Bioresour. Technol. 2019, 281, 367–373. [Google Scholar] [CrossRef] [PubMed]
  22. Zhang, J.; Zheng, P.; Zhang, M.; Chen, H.; Chen, T.; Xie, Z.; Abbas, G. Kinetics of substrate degradation and electricity generation in anodic denitrification microbial fuel cell (AD-MFC). Bioresour. Technol. 2013, 149, 44–50. [Google Scholar] [CrossRef] [PubMed]
  23. Moestedt, J.; Westerholm, M.; Isaksson, S.; Schnürer, A. Inoculum source determines acetate and lactate production during anaerobic digestion of sewage sludge and food waste. Bioengineering 2020, 7, 3. [Google Scholar] [CrossRef] [Green Version]
  24. Pant, D.; Van Bogaert, G.; Diels, L.; Vanbroekhoven, K. A review of the substrates used in microbial fuel cells (MFCs) for sustainable energy production. Bioresour. Technol. 2010, 101, 1533–1543. [Google Scholar] [CrossRef]
  25. Jadhav, G.S.; Ghangrekar, M.M. Performance of microbial fuel cell subjected to variation in pH, temperature, external load and substrate concentration. Bioresour. Technol. 2009, 100, 717–723. [Google Scholar] [CrossRef]
  26. Copeland, R.A. Enzymes: A Practical Introduction to Structure, Mechanism, and Data Analysis; John Wiley & Sons: Hoboken, NJ, USA, 2000. [Google Scholar]
  27. Lovley, D.R. The microbe electric: Conversion of organic matter to electricity. Curr. Opin. Biotechnol. 2008, 19, 564–571. [Google Scholar] [CrossRef] [PubMed]
  28. Demirel, B.; Scherer, P. The roles of acetotrophic and hydrogenotrophic methanogens during anaerobic conversion of biomass to methane: A review. Rev. Environ. Sci. Bio/Technol. 2008, 7, 173–190. [Google Scholar] [CrossRef]
  29. Catal, T.; Liu, H.; Fan, Y.; Bermek, H. A clean technology to convert sucrose and lignocellulose in microbial electrochemical cells into electricity and hydrogen. Bioresour. Technol. Rep. 2019, 5, 331–334. [Google Scholar] [CrossRef]
  30. Tang, Y.; Shigematsu, T.; Morimura, S.; Kida, K. Microbial community analysis of mesophilic anaerobic protein degradation process using bovine serum albumin (BSA)-fed continuous cultivation. J. Biosci. Bioeng. 2005, 99, 150–164. [Google Scholar] [CrossRef] [PubMed]
  31. Chiao, M. A microfabricated PDMS microbial fuel cell. J. Microelectromech. Syst. 2008, 17, 1329–1341. [Google Scholar]
  32. Christwardana, M.; Joelianingsih, J.; Yoshi, L.A. Performance of yeast microbial fuel cell integrated with sugarcane bagasse fermentation for cod reduction and electricity generation. Bull. Chem. React. Eng. Catal. 2021, 16, 446–458. [Google Scholar] [CrossRef]
  33. Koók, L.; Nemestóthy, N.; Bélafi-Bakó, K.; Bakonyi, P. Treatment of dark fermentative H2 production effluents by microbial fuel cells: A tutorial review on promising operational strategies and practices. Int. J. Hydrog. Energy 2020, 46, 5556–5569. [Google Scholar] [CrossRef]
Figure 1. Various parts of the MFC: anode chamber, cathode chamber, and proton-exchange membrane (PEM). The arrows show the direction of the flow of electrons within the MFC; the cathode contains buffer and KMnO4 as an electron acceptor. The whole system was kept in a water bath at 35 °C.
Processes 09 01289 g001
Figure 2. Substrate removal (COD) percentage at various substrates concentrations in MFC.
Processes 09 01289 g002
Figure 3. The dynamics of volatile solids at various substrate concentrations.
Processes 09 01289 g003
Figure 4. Substrate removal (COD) percentage at various substrates concentrations in MFC.
Processes 09 01289 g004
Figure 5. Columbic efficiency of various substrates used in the experiment.
Processes 09 01289 g005
Figure 6. Number of electrons expected to be accepted at the anode.
Processes 09 01289 g006
Figure 7. Voltage generated by various substrates after each batch experiment.
Processes 09 01289 g007
Table 1. Current and power density observed at various substrate concentrations treated in the anaerobic MFC.
Substrates Acetic AcidSucroseAlbuminBloodMixed Substrates
Concentration (mg/L)Current (mA)Power Density (mW/m2)Current (mA)Power Density (mW/m2)Current (mA)Power Density (mW/m2)Current (mA)Power Density (mW/m2)Current (mA)Power Density (mW/m2)
502.0123.761.036.240.511.560.120.080.220.28
1003.0956.161.157.820.692.800.210.250.270.43
2004.17102.281.218.610.702.930.260.400.350.73
3004.61125.011.5514.240.783.600.30.520.431.08
4005.93206.852.0123.760.834.080.380.870.521.59
6006.86276.822.4936.550.995.830.451.220.713.01
8006.96284.953.0554.931.137.590.531.670.844.18
10007.69347.853.5674.8021.218.610.612.181.016.03
Publisher’s Note: MDPI stays neutral with regard to jurisdictional claims in published maps and institutional affiliations.

