Article

Investigation of Stress Response Genes in Antimicrobial Resistant Pathogens Sampled from Five Countries

1
Department of Chemical and Biological Engineering, Villanova University, Villanova, PA 19085, USA
2
Department of Health, Nutrition & Exercise Sciences, Immaculata University, Immaculata, PA 19345, USA
*
Author to whom correspondence should be addressed.
Processes 2021, 9(6), 927; https://doi.org/10.3390/pr9060927
Submission received: 24 April 2021 / Revised: 16 May 2021 / Accepted: 19 May 2021 / Published: 25 May 2021

Abstract

:
Pathogens, which survive from stressed environmental conditions and evolve with antimicrobial resistance, cause millions of human diseases every year in the world. Fortunately, the NCBI Pathogen Detection Isolates Browser (NPDIB) collects the detected stress response genes and antimicrobial resistance genes in pathogen isolates sampled around the world. While several studies have been conducted to identify important antimicrobial resistance genes, little work has been done to analyze the stress response genes in the NPDIB database. In order to address this, this work conducted the first comprehensive statistical analysis of the stress response genes from five countries of the major residential continents, including the US, the UK, China, Australia, and South Africa. Principal component analysis was first conducted to project the stress response genes onto a two-dimensional space, and hierarchical clustering was then implemented to identify the outlier (i.e., important) genes that show high occurrences in the historical data from 2010 to 2020. Stress response genes and AMR genes were finally analyzed together to investigate the co-occurring relationship between these two types of genes. It turned out that seven genes were commonly found in all five countries (i.e., arsR, asr, merC, merP, merR, merT, and qacdelta1). Pathogens E. coli and Shigella, Salmonella enterica, and Klebsiella pneumoniae were the major pathogens carrying the stress response genes. The hierarchical clustering result showed that certain stress response genes and AMR genes were grouped together, including golT~golS and mdsB~mdsC, ymgB and mdtM, and qacEdelta1 and sul1. The occurrence analysis showed that the samples containing three stress response genes and three AMR genes had the highest detection frequency in the historical data. The findings of this work on the important stress response genes, along with their connection with AMR genes, could inform future drug development that targets stress response genes to weaken antimicrobial resistance pathogens.

1. Introduction

Pathogens cause 9.4 million foodborne illness, 55,961 hospitalizations, and 1351 deaths in the US each year [1]. These pathogens survive the stress imposed by hostile environments before they reach humans and cause diseases. In particular, they must survive any decontaminating processes designed to eliminate them, especially if the pathogens are transmitted through food or water [2]. For example, E. coli, a widespread foodborne pathogen, is partly susceptible to freezing temperatures [3,4]. However, many strains of E. coli have obtained genes triggering thermal stress responses to the cold shock, in which the environmental temperature suddenly drops. The production of cold shock proteins is one of the ways the pathogen mediates this stress response. These proteins regulate essential cellular functions such as transcription, translation, and recombination that aid in the microorganism’s survival [5]. Other than the cold stress, pathogens have to experience other types of stresses to survive extreme conditions and proliferate more rapidly before they cause human infection. For example, the pathogens must also protect themselves against the body’s natural defenses, including gastric acid (pH-stress), fevers (thermal stress), and nutrient restriction (starvation stress) [6]. It is thus important to study the mechanisms of microbial stress response in which pathogens perceive and quickly adapt to changes in environmental conditions that may otherwise harm or kill them [2]. Fortunately, existing databases, such as the NCBI Pathogens Isolates Browser [7], provide stress response gene detection data sampled from both environmental and clinical pathogen isolates. It is necessary to systematically analyze those existing datasets to identify genes that play an important role in regulating the stress response of pathogens.
While stress response mechanisms may enable the survival of pathogens from a hostile environment (e.g., high/low temperature, low pH, and limited nutrients), pathogens may be further treated by antimicrobials. Those pathogens that survive from the treatment contribute to antimicrobial resistance (AMR). In particular, proteins encoded by AMR genes may degrade antimicrobials, alternate the targets of antimicrobials, expel antimicrobials via efflux pumps, or reduce the cell membrane permeability of antimicrobials [8,9,10]. Unfortunately, AMR genes can be transmitted by horizontal gene transfer through conjugation, transformation, transduction, or mobile genetic vectors like plasmids [9]. It is reasonable to infer that pathogens with stronger stress response ability may have higher chances of survival from the treatment of antimicrobials, as stress response was implied to be coordinated with the pathogen’s response to antimicrobials [11,12] and more effective stress responses have been tentatively linked with increased antimicrobial resistance [12,13,14]. It is thus important to identify the genes that coordinate the stress response and antimicrobial resistance in pathogens [15,16,17].
Fortunately, the data for stress response genes of pathogen isolates became available recently in the NCBI Pathogen Detection Isolates Browser (NPDIB), which was mainly focused on detecting AMR in pathogens in the US first and later in other countries over the world [7]. Accordingly, existing research on the NPDIB database was mainly related to antimicrobial resistance. In particular, Li et al., 2019 [15], examined the prominent AMR genes from the clinical pathogens that carried those genes in six countries and studied the occurrence trend of AMR genes over time. Yang et al., 2020 [16], further extended the work of Li et al., 2019 [15], to foodborne pathogens and studied the important AMR genes in foodborne pathogens for eight countries. It was reported in that study that the occurrence of these AMR genes shows an increasing trend over time. While Li et al., 2019 [15], and Yang et al., 2020 [16], studied clinical and foodborne pathogens, respectively, Hua et al., 2020 [17], further compared AMR genes sampled in these two types of pathogens in the US. It was found in this study that antimicrobial resistance was detected in the foodborne pathogens first and then in the clinical pathogens. This study then inferred that AMR genes might be found in the foodborne pathogens (mainly carried by animals) first and then transferred to the clinical pathogens (mainly carried by humans). While the aforementioned studies have reported findings that are helpful for combating antimicrobial resistance, the recently available stress response data were not considered in them. It is thus necessary to further identity the common stress response genes from the data and investigate the genes that coordinate the stress response and antimicrobial resistance.
This work aimed to broaden the scope of knowledge by identifying important stress response genes and analyzing the relationship between those genes and AMR genes. While some studies have examined specific genes that play a role in both stress response and antimicrobial resistance [12,14], few have looked at the general relationships and patterns between these genes from a large scale of data sampled in various countries. In this work, we analyzed stress response gene data from NCBI Pathogen Detection Isolates Browser for five countries that contain the greatest amount of available data in the five major continents (i.e., the US, the UK, China, South Africa, and Australia). Since thousands of gene samples were available for analysis, multivariate statistical methods like principal component analysis (PCA) [18,19] were used to project the high-dimensional gene data onto a two-dimensional space to visualize the genes. On the basis of the projection of the genes by PCA, the hierarchical clustering approach [20,21] was further applied to identify those important stress response genes from the dataset for each country. The genes that coordinate stress response and antimicrobial resistance were then investigated.

2. Materials and Methods

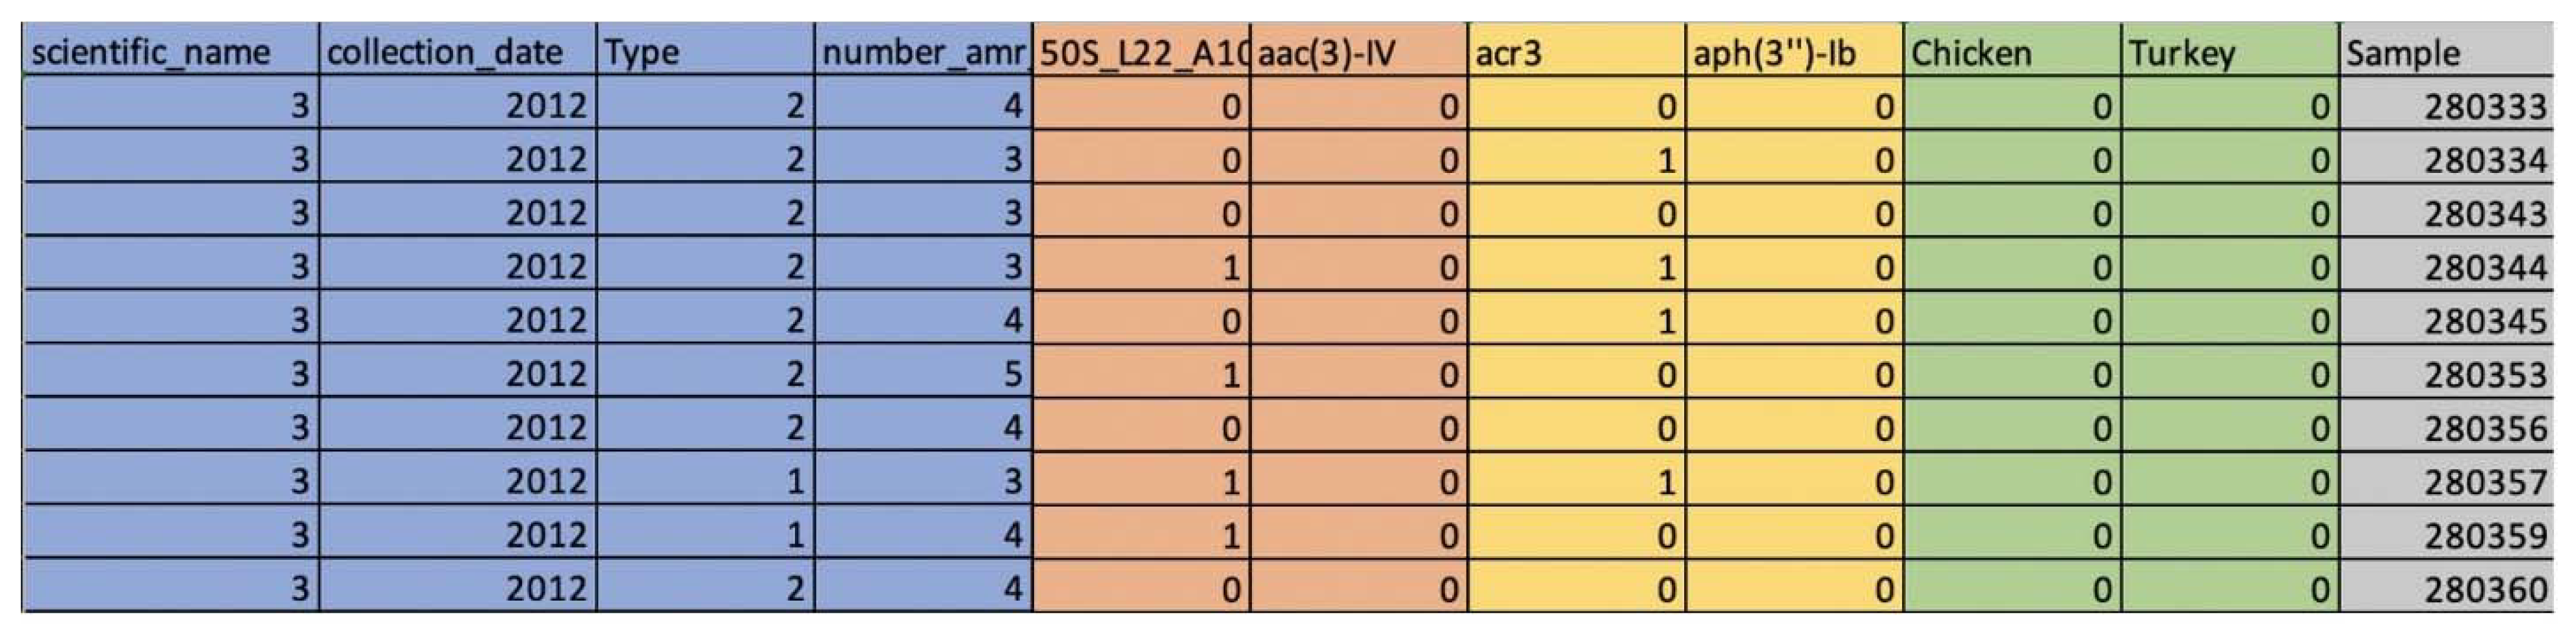
2.1. The Stress Response Gene Data from the NCBI Pathogen Detection Isolates Browser

The gene data were sourced from the National Center for Biotechnology Information (NCBI) Pathogen Detection Isolates Browser. The NPDIB database contains records on the origins of pathogens. The downloaded data for each country were organized in an Excel table with each row corresponding to an isolate sample and each column indicating the pathogen name (represented by an integer in correspondence with a table of listed pathogens), collection year (from 2010 to 2020), source (clinical represented with a “1” and environmental represented with a “2”), number of AMR genes the sample is resistant to, and the stress response genes (detected genes indicated with a “1” and non-detected genes indicated with a “0”). Interested readers can refer to Appendix A Figure A1 for an example of Excel data table. The Excel file was further imported in the R programming platform for further analysis.

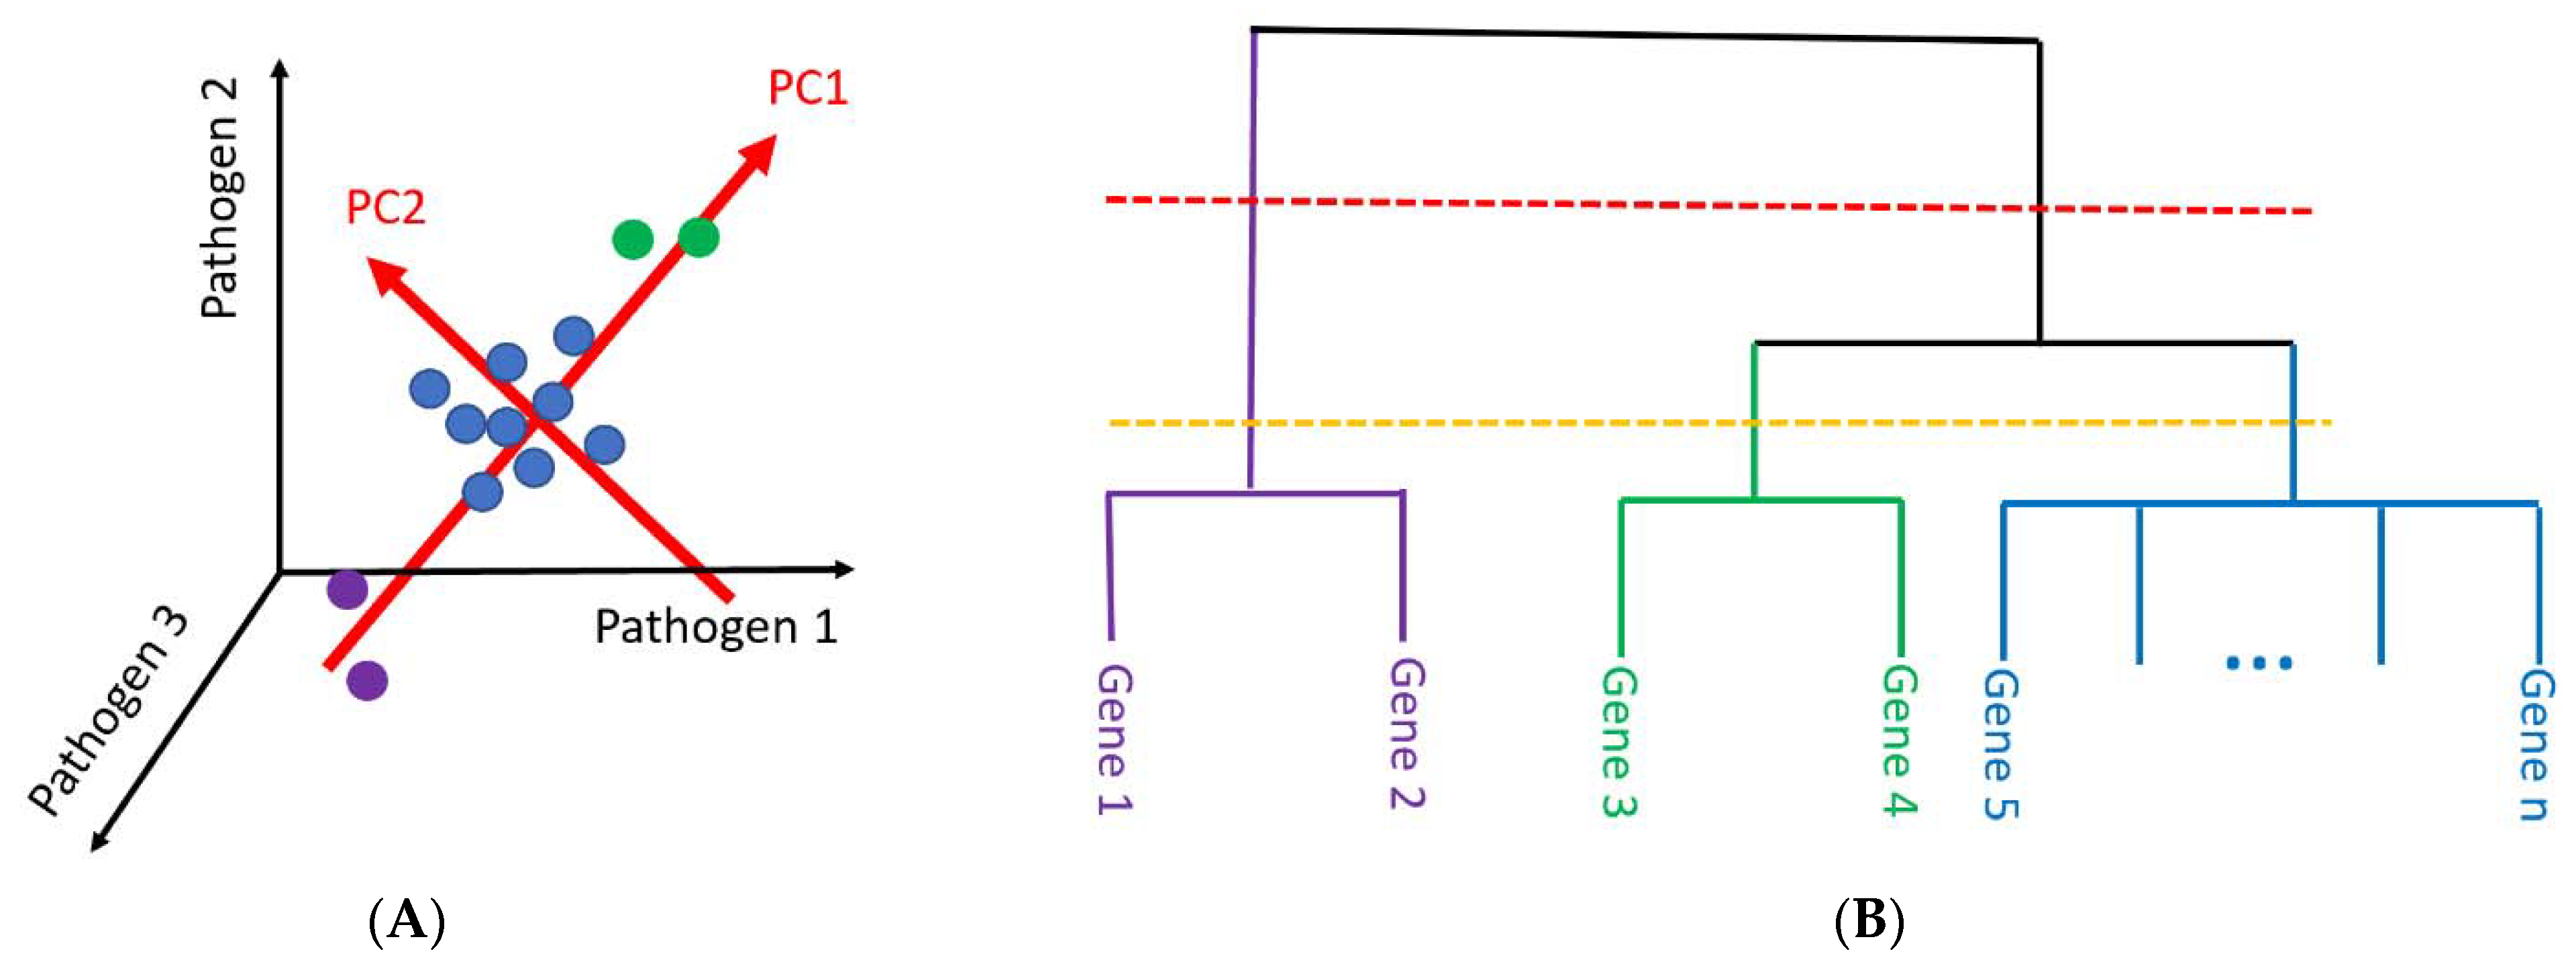
2.2. Principal Component Analysis and Hierarchical Clustering

The data tables vary between thousands of rows (i.e., samples) and about 200 columns (i.e., dimensions) in size for each of the five countries studied. Therefore, it is impossible to neatly represent this high-dimensional data in a two-dimensional space without using dimension-reducing techniques like PCA, which rotates and moves the coordinate plane so that the projections of data points onto two new coordinate directions contain the largest variance (i.e., the largest amount of information). Figure 1 provides an overview of the data analysis procedure implemented in this work to identify the important stress response genes from the dataset. Specifically, a data matrix was constructed so that each row represents one stress response gene and each column stands for a pathogen. The elements in the matrix represent the number of the samples in which the gene in the row was detected in the pathogen in the column (Figure 1A). The high-dimensional data matrix was reduced to a two-dimensional PC1~PC2 space (Figure 1B). The outlier genes were then identified from the PC1~PC2 plots. They generally showed high detection patterns across all pathogens and thus represented important stress response genes.
While outlier genes are shown on the PC1~PC2 plot, PCA is not able to quantitatively determine which genes are outliers. Genes are lumped together in PCA. This makes it challenging to determine the relationship between those genes in the way they are carried by pathogens. In order to address this, hierarchical clustering was used to study the genes projected on the PC1~PC2 plot and further separate them into groups. The set of genes represented with clustering looked like an evolutionary tree with lines that branch out from the top at a single node and end with an element of data (Figure 1B). In a clustering diagram, genes with similar occurrence patterns are grouped together. The vertical distance between genes indicates their relatedness. The important genes are typically located on the top branches and separated from the crowded clusters that contain the lumped bulk genes. The Elbow method was used to identify those important genes from the hierarchical clustering tree: (1) all the genes were regarded as a single cluster at the beginning; (2) one cluster was added at one time when the cutting line was gradually moved down in Figure 1B, and the summary of the variance of individual clusters was calculated; (3) the total variance of all individual clusters reduced sharply for the first few clusters and then decreased gradually afterward. The bending point of the total variance profile indicated the number of clusters for separating the genes. The outlier genes were further validated by their projection on the PC1~PC2 plot. This clustering approach was implemented to identify both the outlier genes and the outlier pathogens that were mainly detected from the historical data for each selected country between 2010 and 2020. It turned out that the outlier genes or pathogens were generally identified when six clusters were obtained from the data.

2.3. Investigating the Occurrence Correlation between the Stress Response Genes and AMR Genes

In order to further study the correlation between the occurrence of stress response and AMR genes detected in isolate samples, the number of stress response genes detected in each sample was plotted against the number of AMR genes in the same sample. The following equation was then used to determine the occurrence correlation between the AMR genes and stress response genes detected in pathogen isolates for each of the five selected country.
Cor _ AMR _ Stress   = N AMR × N Stress | N AMR | × | N Stress |
where NAMR is a vector consisting of the number of AMR genes detected in individual samples, NStress is a similar vector for stress response genes, and Cor_AMR_Stress stands for the correlation of the number of AMR genes and the stress response genes over all the samples for each selected country. The elements were paired in NAMR and NStress for the same samples.

3. Results

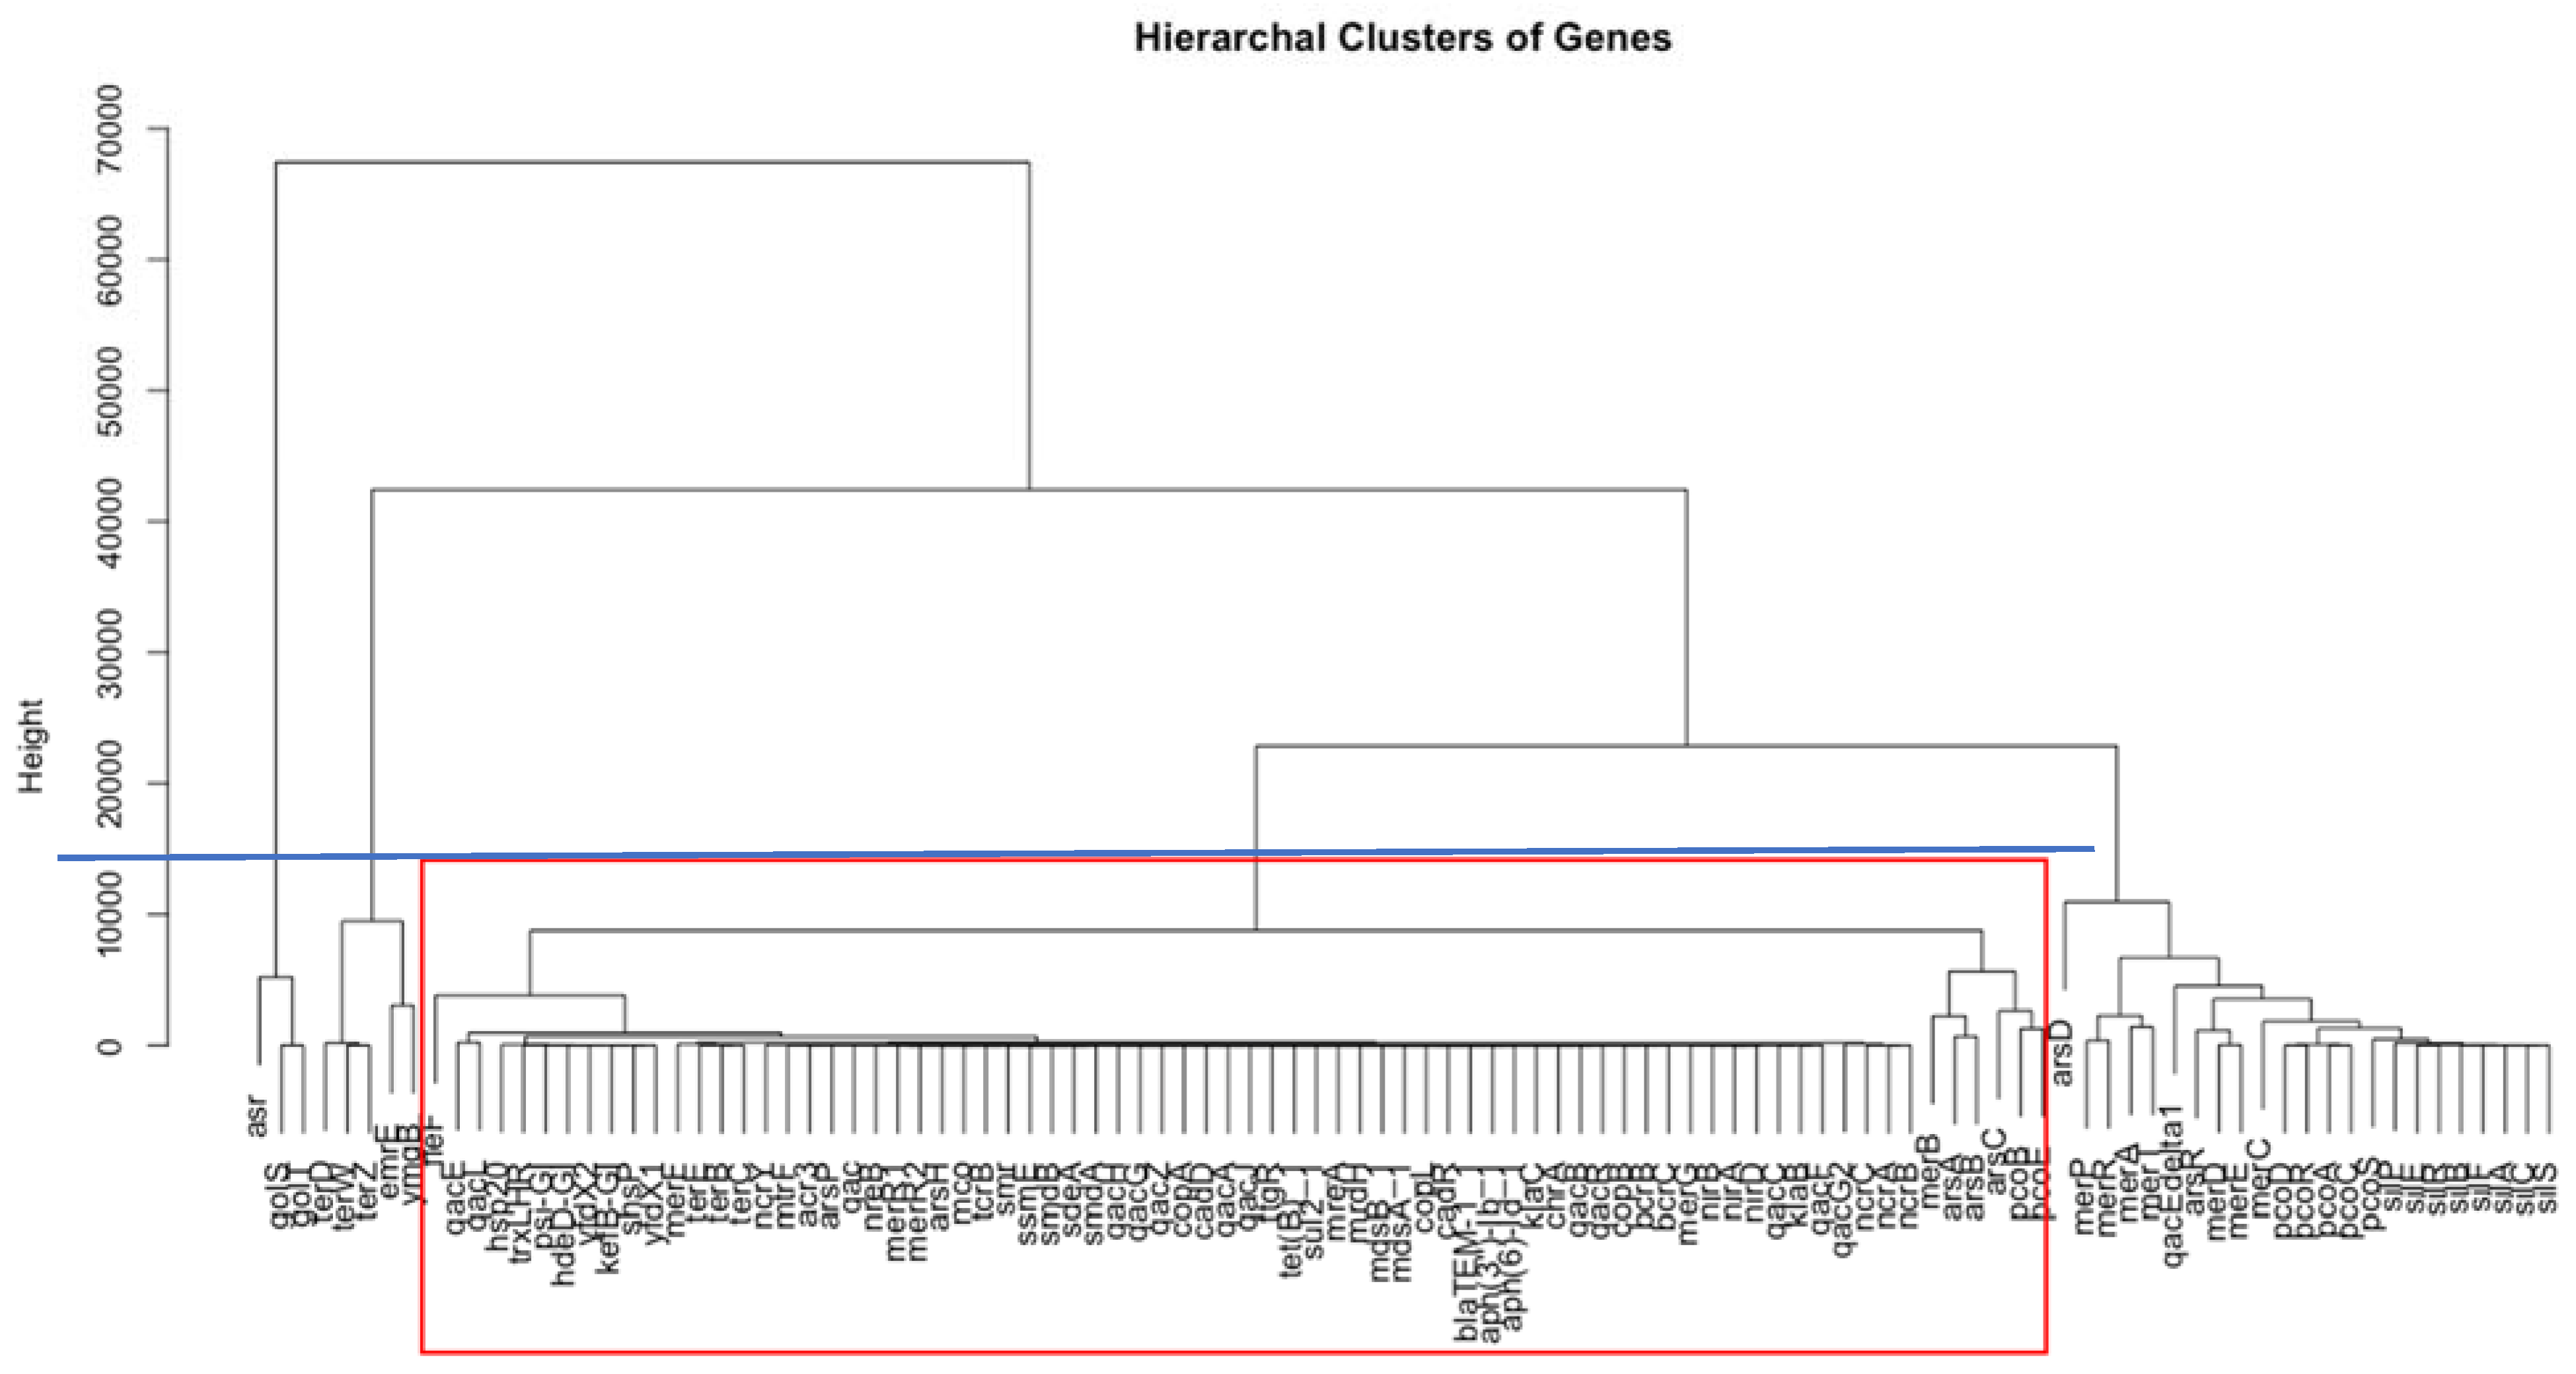
3.1. Identification of Important Stress Response Genes for the Five Countries

The approach, based upon PCA and hierarchical clustering (as described in the Section 2), was performed to identify important stress response genes that were commonly carried by pathogens in each country’s data. Since most of the genes were lumped together in their projects on the PC1~PC2 space, the result of hierarchical clustering was mainly used to identify the outlier (i.e., important) stress response genes. For example, Figure 2 shows the clustering results of the stress response genes for the US data. Many of the stress response genes are grouped together at the same height, which means they were similarly detected in the pathogens in the dataset. On the other hand, outlier genes not included in the biggest cluster were more dissimilar to the other genes and occurred more frequently in the samples. In particular, the stress response genes were generally separated into six clusters and the genes not in the biggest cluster were regarded as outlier genes, which were of high occurrences as important genes (Figure 2). These genes were worthy of further investigation as their related findings may have broader and more useful applications. For a more visual explanation, the important outlier genes are the ones not enclosed by the red rectangle in Figure 2.
While Figure 2 shows the important stress response genes detected from the data for the US, a similar approach was implemented to identify the important stress response genes for the other four countries. The obtained important stress response genes for each country are summarized in Table 1. Notably, seven genes (indicated in green) were shared across all five countries: arsR, asr, merC, merP, merR, merT, and qacdelta1. Of such genes, four belong to the mer operon, responsible for mercury resistance and the encoding of proteins involved in the regulation of Hg binding [22]. The gene arsR belongs to the ars operon, which mediates arsenic resistance [23]. Meanwhile, qacdelta1 and asr were found to be unassociated with any particular operon. The gene qacEdelta1 encodes for an antiseptic-resistance protein [24], while asr regulates an acid shock protein that allows for growth and survival in acidic conditions [25].
Additionally, several stress response genes were found to be unique to individual countries (Table 1). Genes terB, terC, and terE were found to be exclusive to China. These genes belong to the ter operon, which is attributed with tellurite resistance [26]. Similarly, hsp and pcoE were only found in South Africa. Gene hsp encodes for a heat shock protein, while pcoE belongs to the pco operon that allows for copper resistance [27]. Finally, copB, responsible for copper homeostasis and virulence in select pathogens [28], was found only in Australia. In contrast, the US and UK did not have any unique genes.

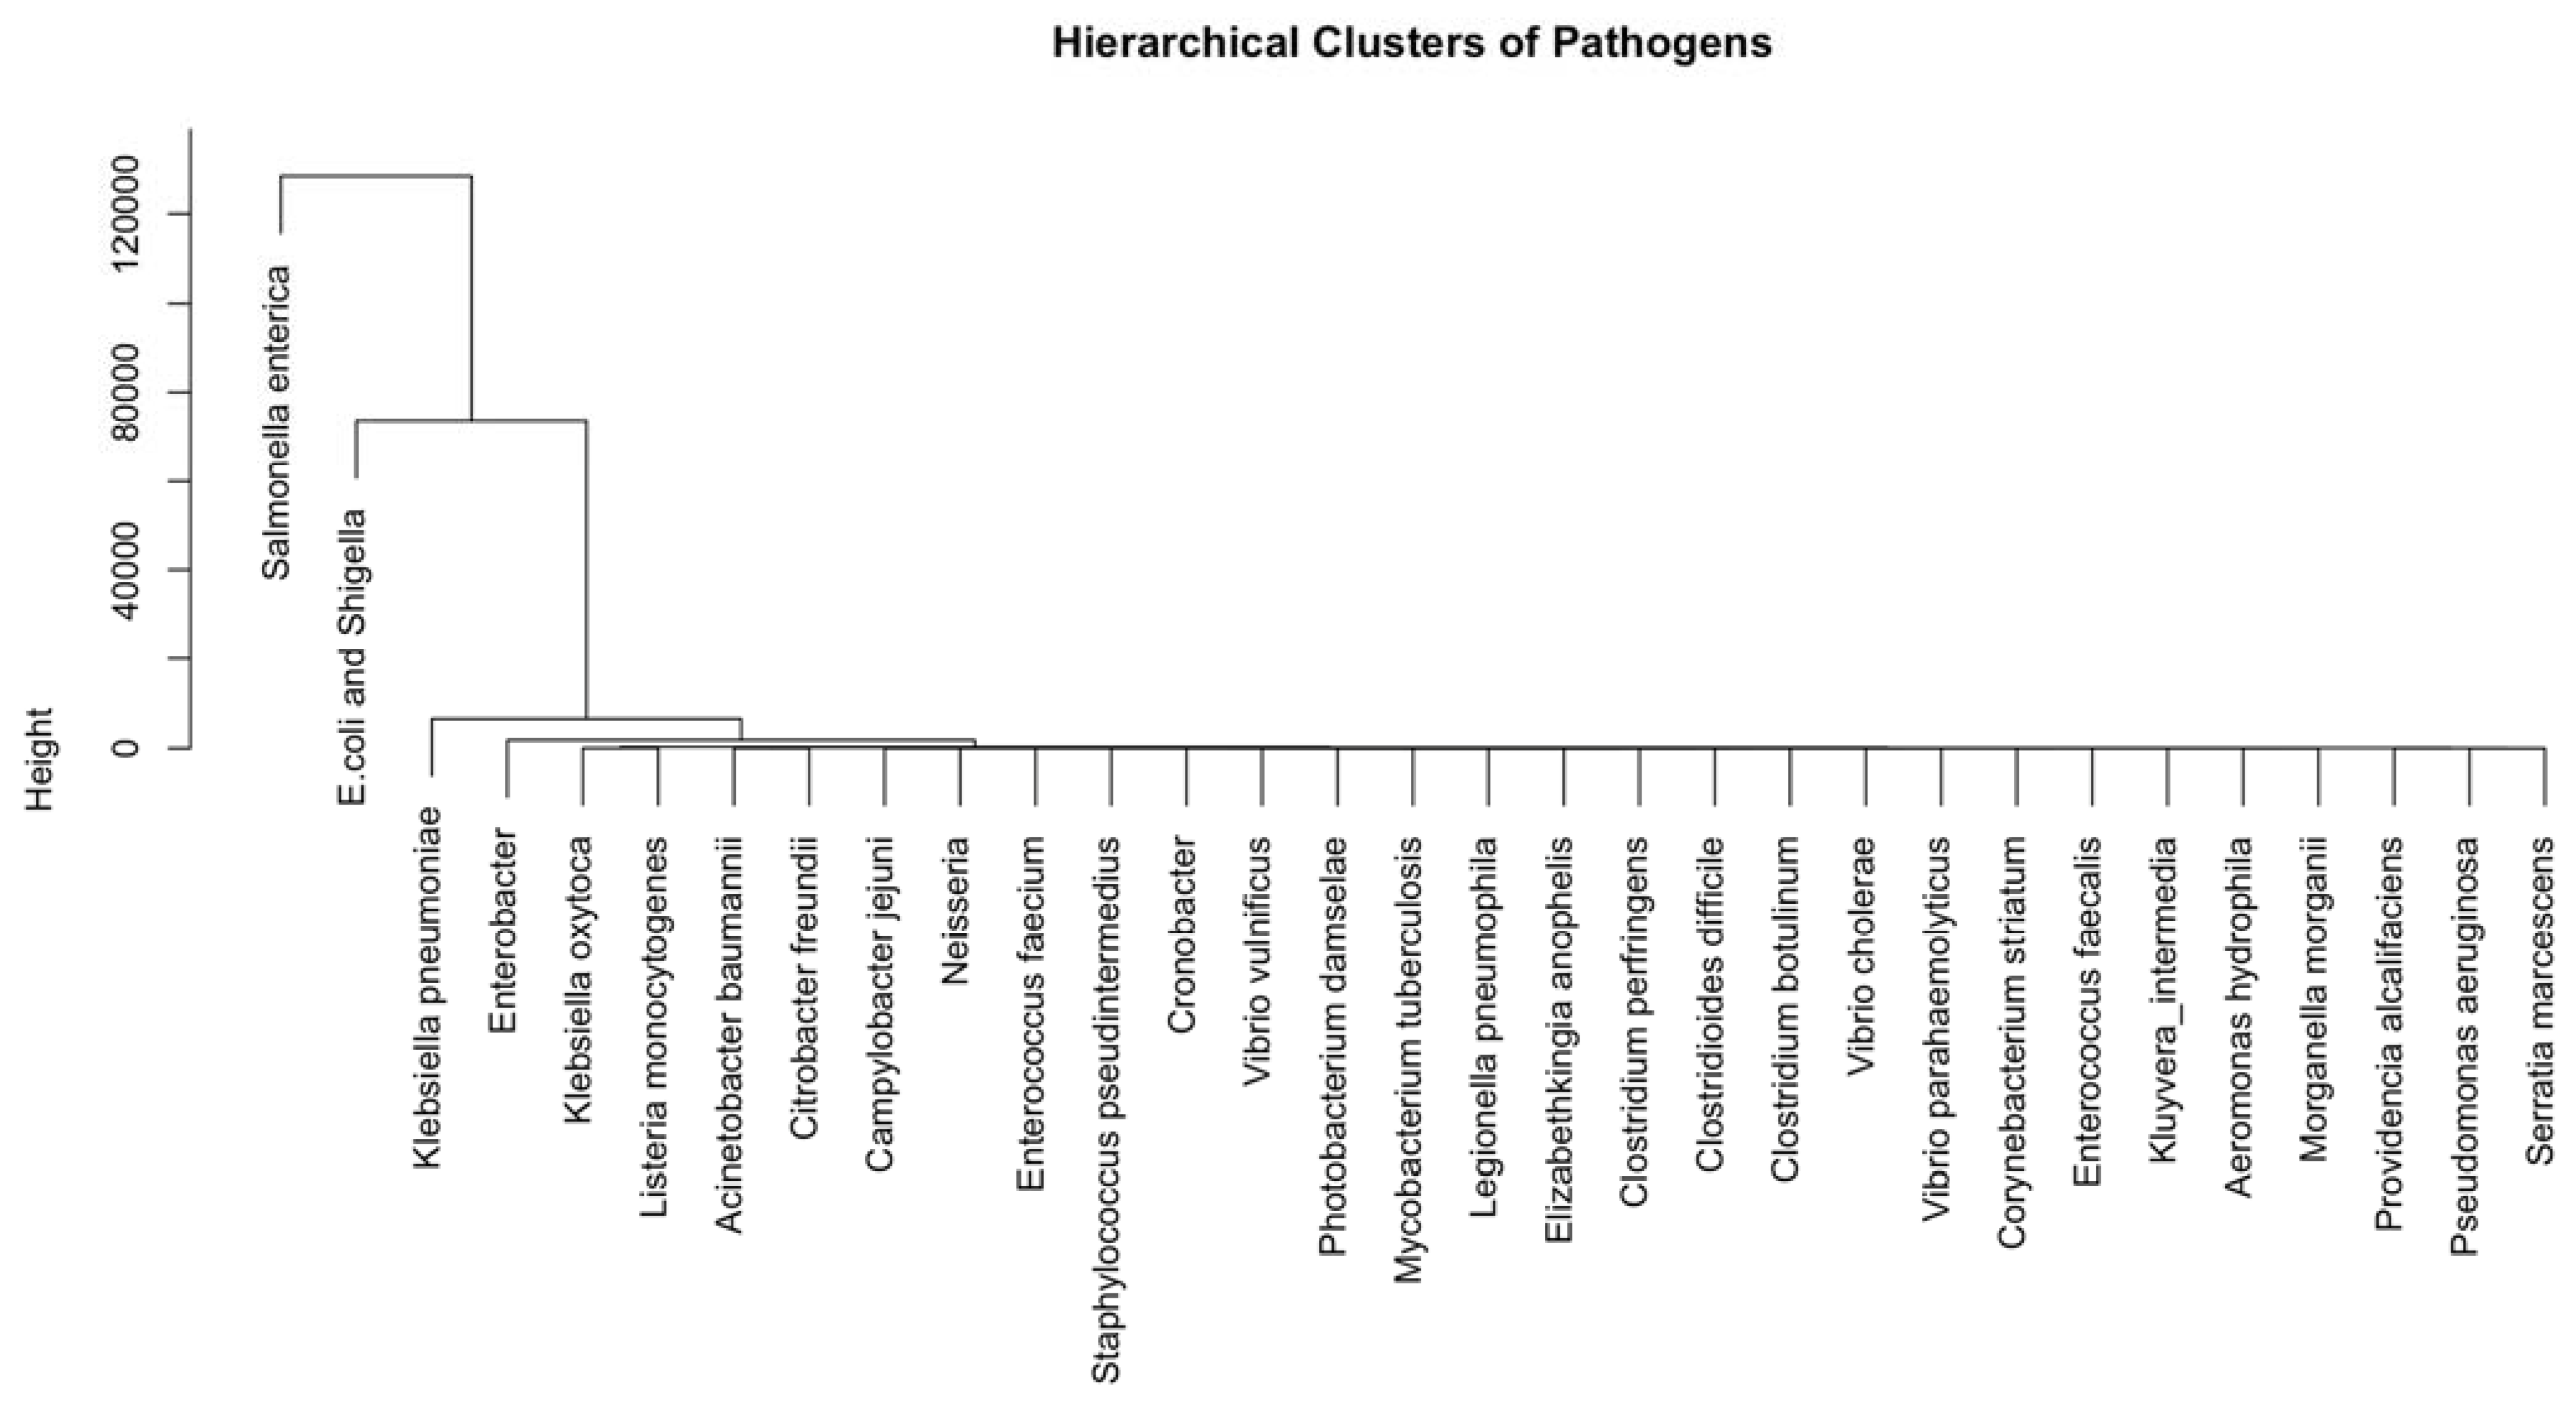
3.2. Identification of Important Stress Response Pathogens for the Five Countries

Similarly to the analysis of important stress response genes shown in the previous subsection, the PCA and hierarchical clustering approach was implemented to identify the major pathogens carrying the stress response genes for each of the selected five countries. The results for the US data are shown in Figure 3 as an example, in which the following five important pathogens were distinguished from the clustering result: E. coli and Shigella, Salmonella enterica, Klebsiella pneumoniae, Enterococcus faecium, and Klebsiella oxytoca. Similarly, important pathogens were identified for each of the other four countries and are summarized in Table 2. Pathogens E.coli and Shigella, Salmonella enterica, and Klebsiella pneumoniae were found to be shared across all five countries. Additionally, Enterobacter (South Africa, China, and Australia), Enterococcus faecium (Australia and the UK), and Klebsiella oxytoca (China and the UK) corresponded to two or more countries. On the other hand, Citrobacter freundii and Serratia marcescens (South Africa), as well as Cronobacter (China), were unique to their respective countries.
On the basis of the important stress response genes in Table 1 and the important pathogens in Table 2, Figure 4 illustrates how those important stress response genes were carried by the important pathogens. The important genes were grouped by their respective operons because genes in the same operon are expressed as one unit. As shown in the figure, seven of the nine important pathogens (E. coli and Shigella, Klebsiella pneumoniae, Salmonella enterica, Citrobacter freundii, Serratia marcescens, Enterobacter, and Klebsiella oxytoca) were attributed to at least one important gene. E. coli and Shigella and Klebsiella pneumoniae were the two pathogens with the greatest number of corresponding genes: E. coli and Shigella were associated with all the important genes except for golS and golT, while Klebsiella pneumoniae was associated with all but golS, golT, asr, emrE, and copB. In terms of noteworthy stress response genes, qacEdelta1 corresponded with all seven of the notable pathogens, and genes in the pco and sil operons were found in six pathogens (all but Klebsiella oxytoca).

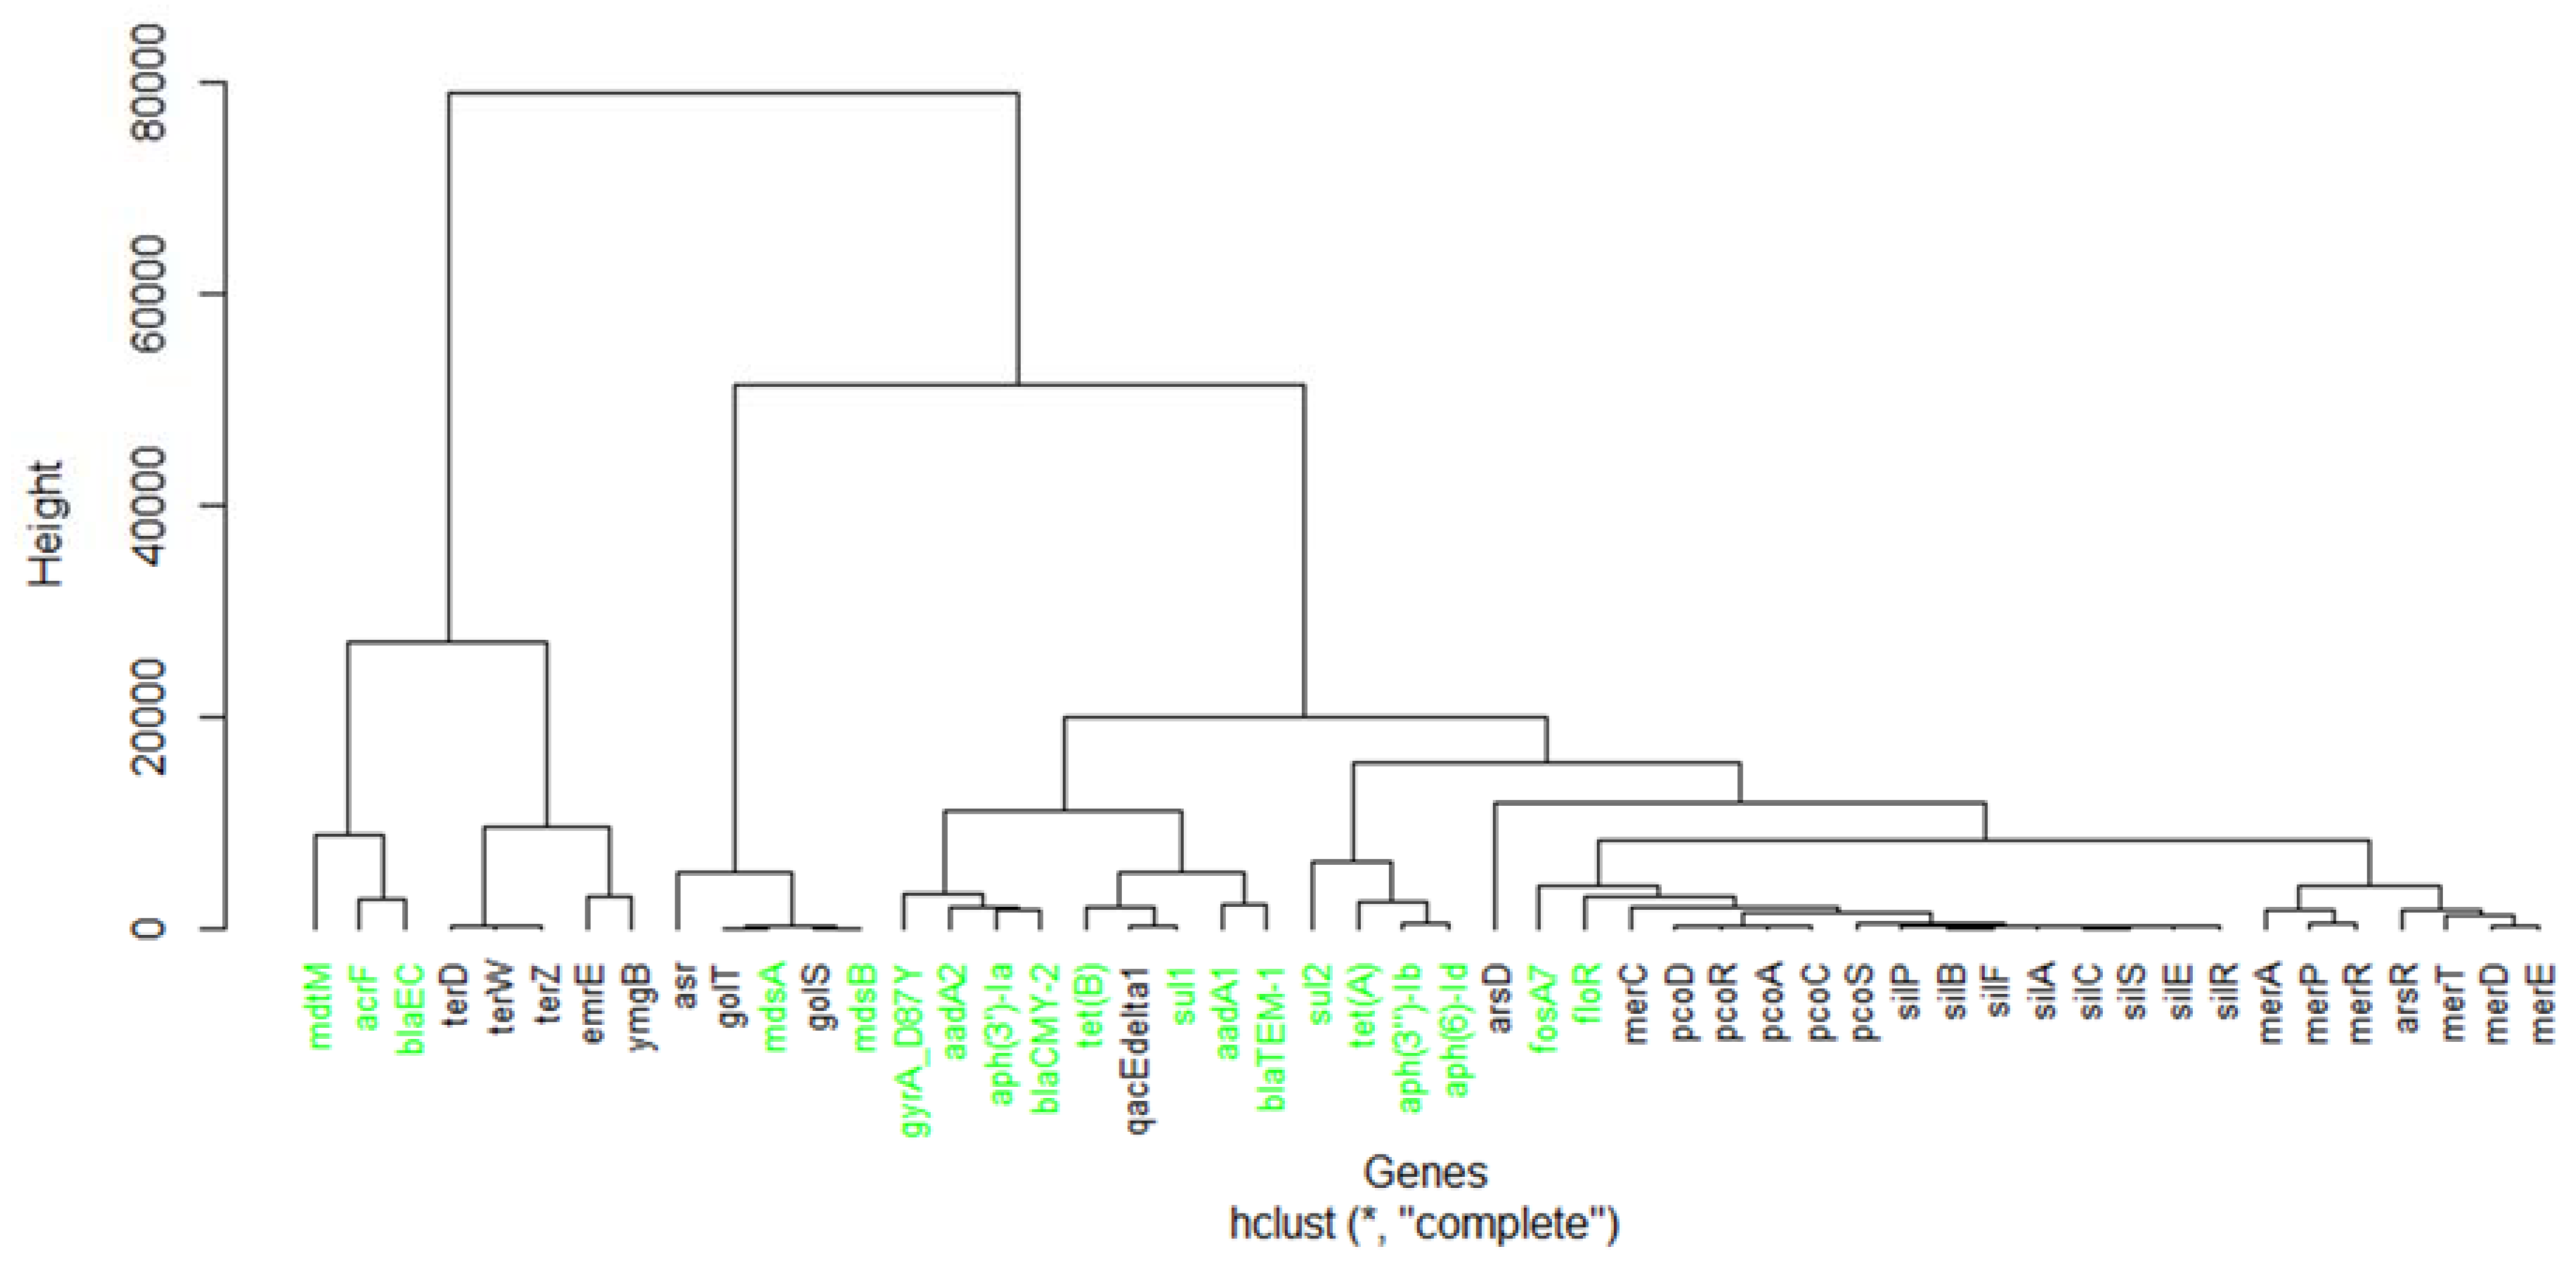
3.3. The Relationship between Stress Response Genes and AMR Genes for Individual Countries

The stress response genes were analyzed with AMR genes using the PCA and clustering approach to investigate the relationship between these two types of genes. The result for the US dataset is shown in Figure 5, in which the AMR genes are marked in green while the stress response genes are in black. It was interesting to see that the same type of genes tended to stay together in the clustering tree. On the other hand, several stress response genes were distributed in the subgroups of AMR genes. For example, golT and golS were located in the same group as AMR genes mdsA and mdsB. In addition, qacEdelta1 and AMR gene sul1 were grouped together. The AMR genes in Figure 5 were taken from References [15,16,17], which identified the important AMR genes from the historical data in the NPDIB database. This work moved one step further from the previous work [15,16,17] by exploring the relationship between stress response genes and the AMR genes.
The connected stress response genes and AMR genes shown in Figure 5 may imply the mechanisms of coordinating the stress response and antimicrobial resistance. The connected stress response genes and AMR genes for each of the five selected countries are summarized in Table 3. Notably, some similar stress response and AMR gene pairs were found in multiple countries (differentiated by color in the table). The previously mentioned grouping of golT, golS, mdsA, and mdsB was found in the US, the UK, and South Africa. Furthermore, qacEdelta1 corresponded with sul1 in the US, China, and Australia. ygmB (stress response) and mdtM (AMR) were also two similar genes found in China and Australia.

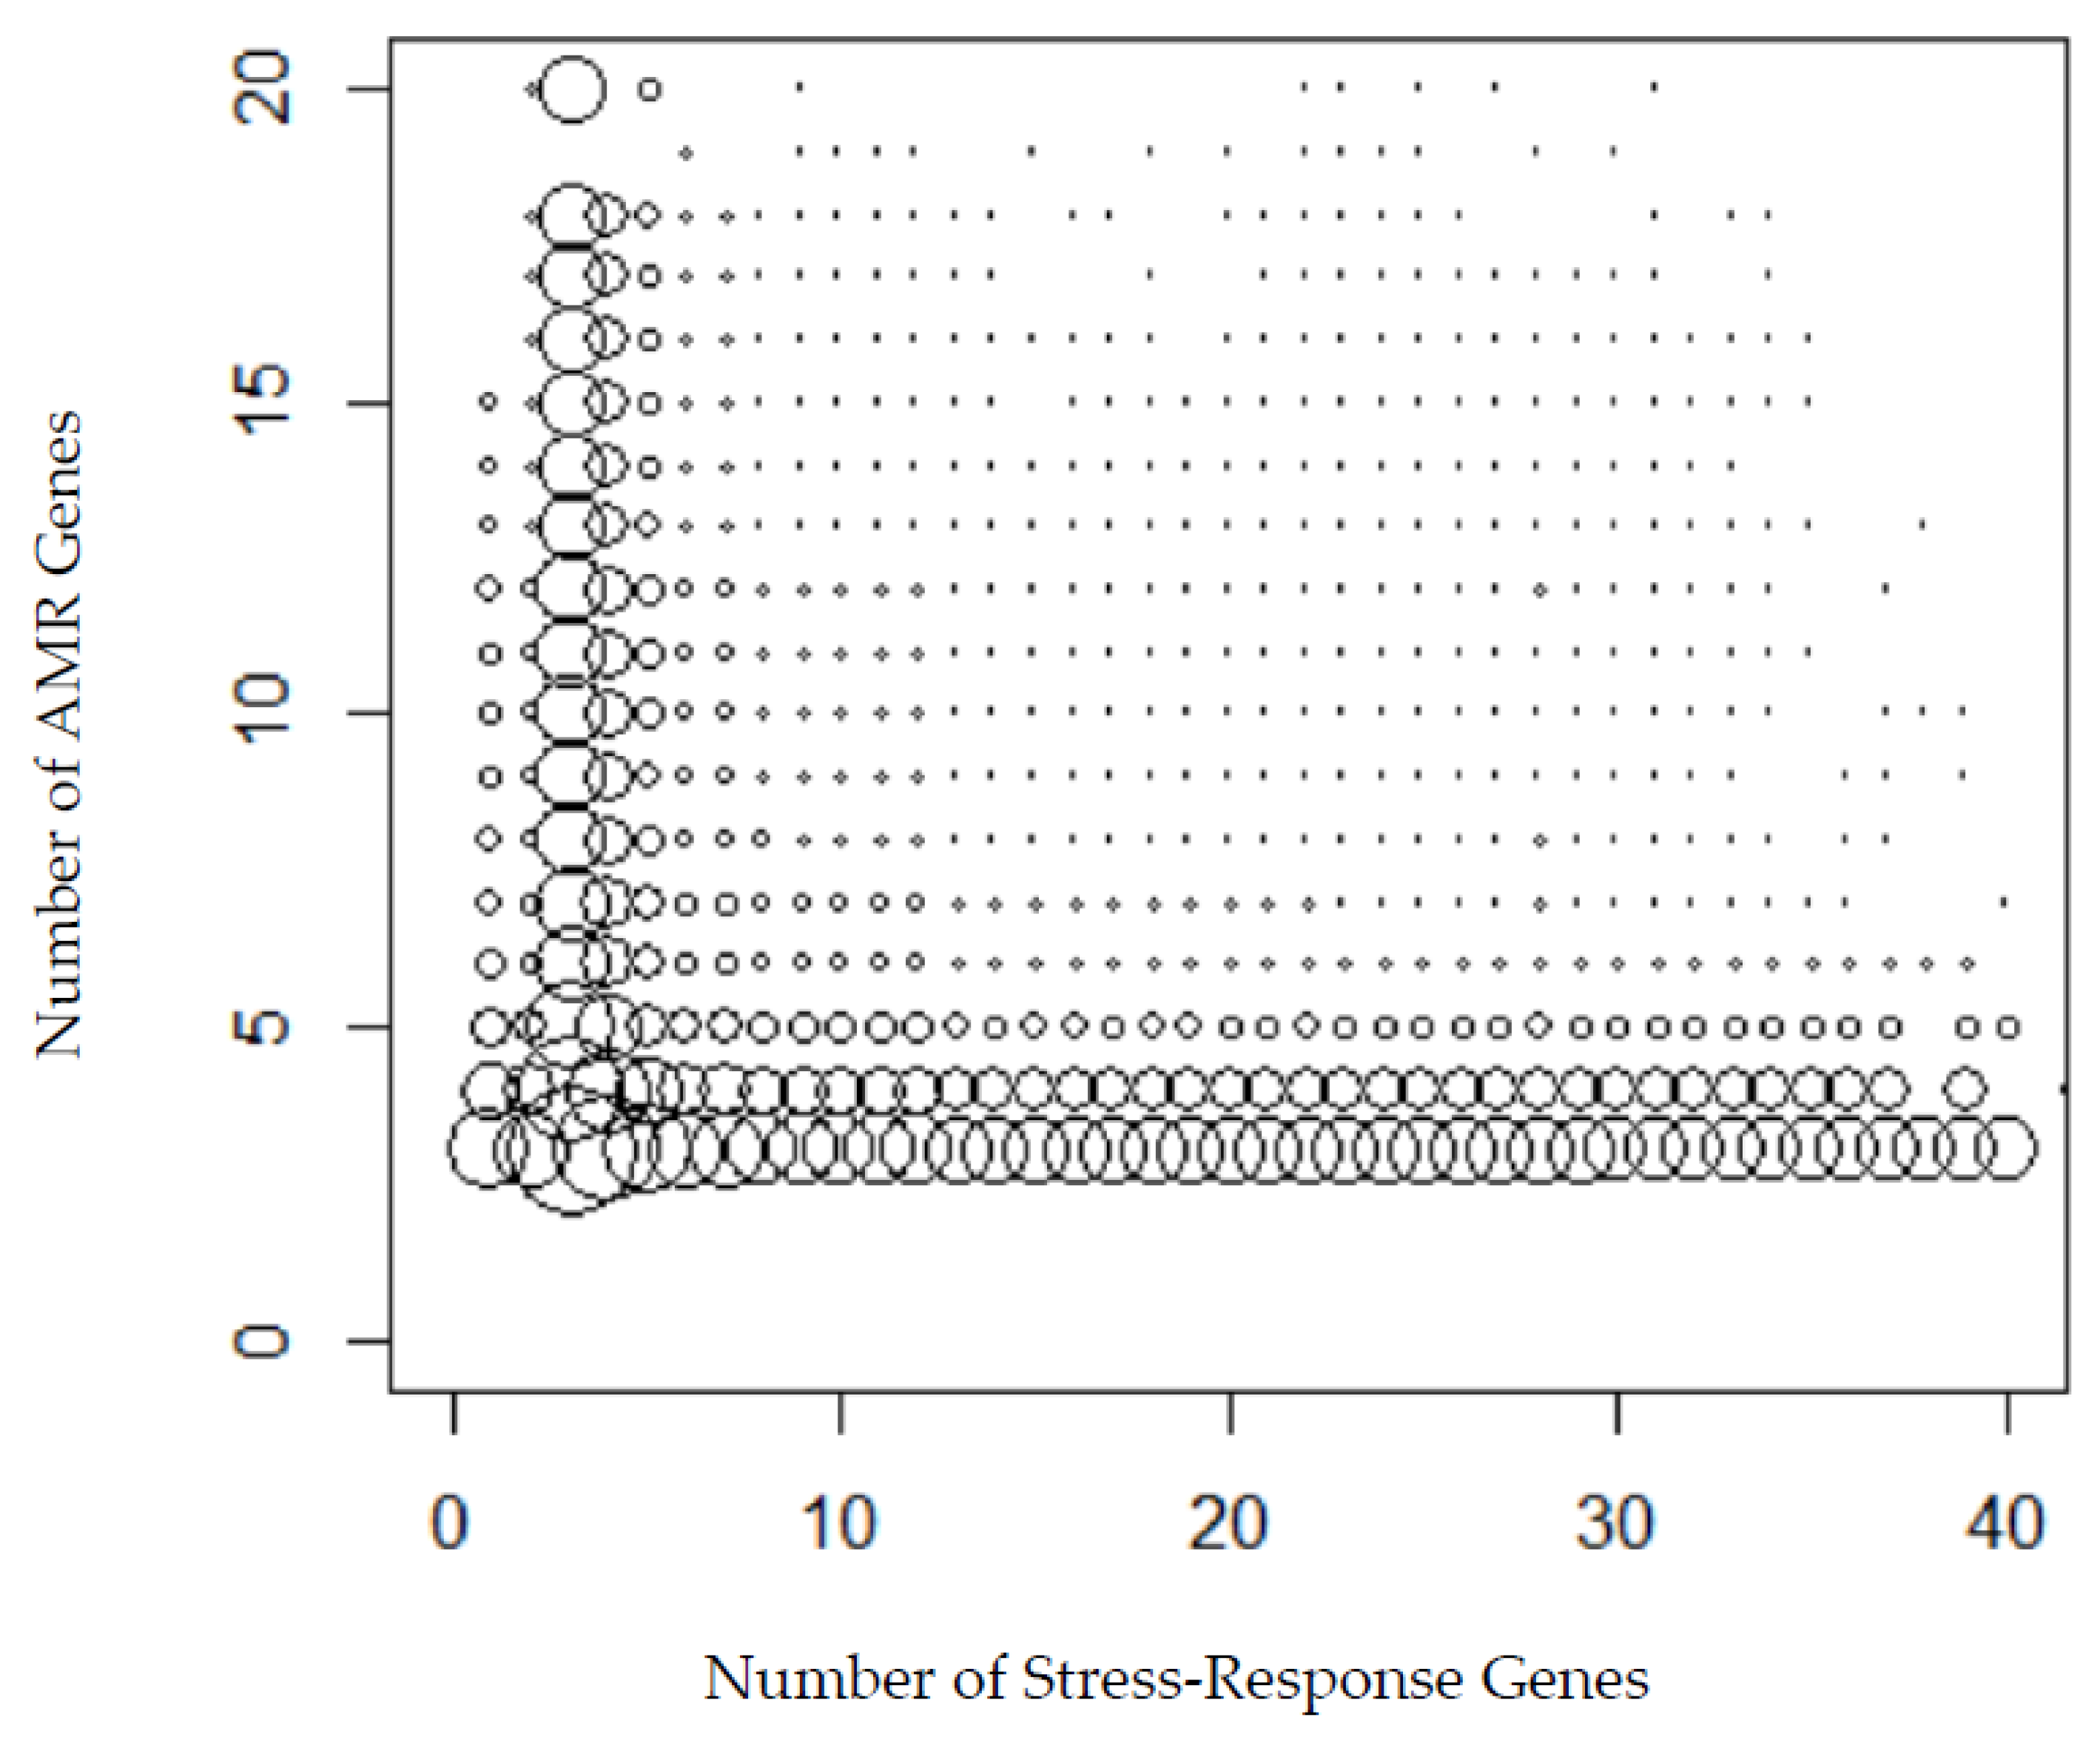
3.4. Comparing the Numbers of Stress Response Genes and AMR Genes in Individual Samples for Each Country

While the previous section was focused on identifying the stress response genes and AMR genes that were grouped in the same clusters, the correlation of the occurrence frequencies of these two types of genes were further studied in this section. In particular, the number of the stress response genes and the number of AMR genes in each sample were quantified for each country. These two numbers were plotted over all the samples for each country (refer to Figure 6 as an example for the US data). Additionally, the correlation coefficient between the occurrence frequencies of these two types of genes was calculated using Equation (1). Our calculations yielded a correlation coefficient of 0.3 in the US data, and Figure 6 displays the frequencies of samples containing various numbers of stress response genes and AMR genes. Among the combinations of various stress response genes and AMR genes, the one containing three AMR genes and three stress response genes was detected in the largest amount of samples (i.e., the largest circle in Figure 6).

4. Discussion

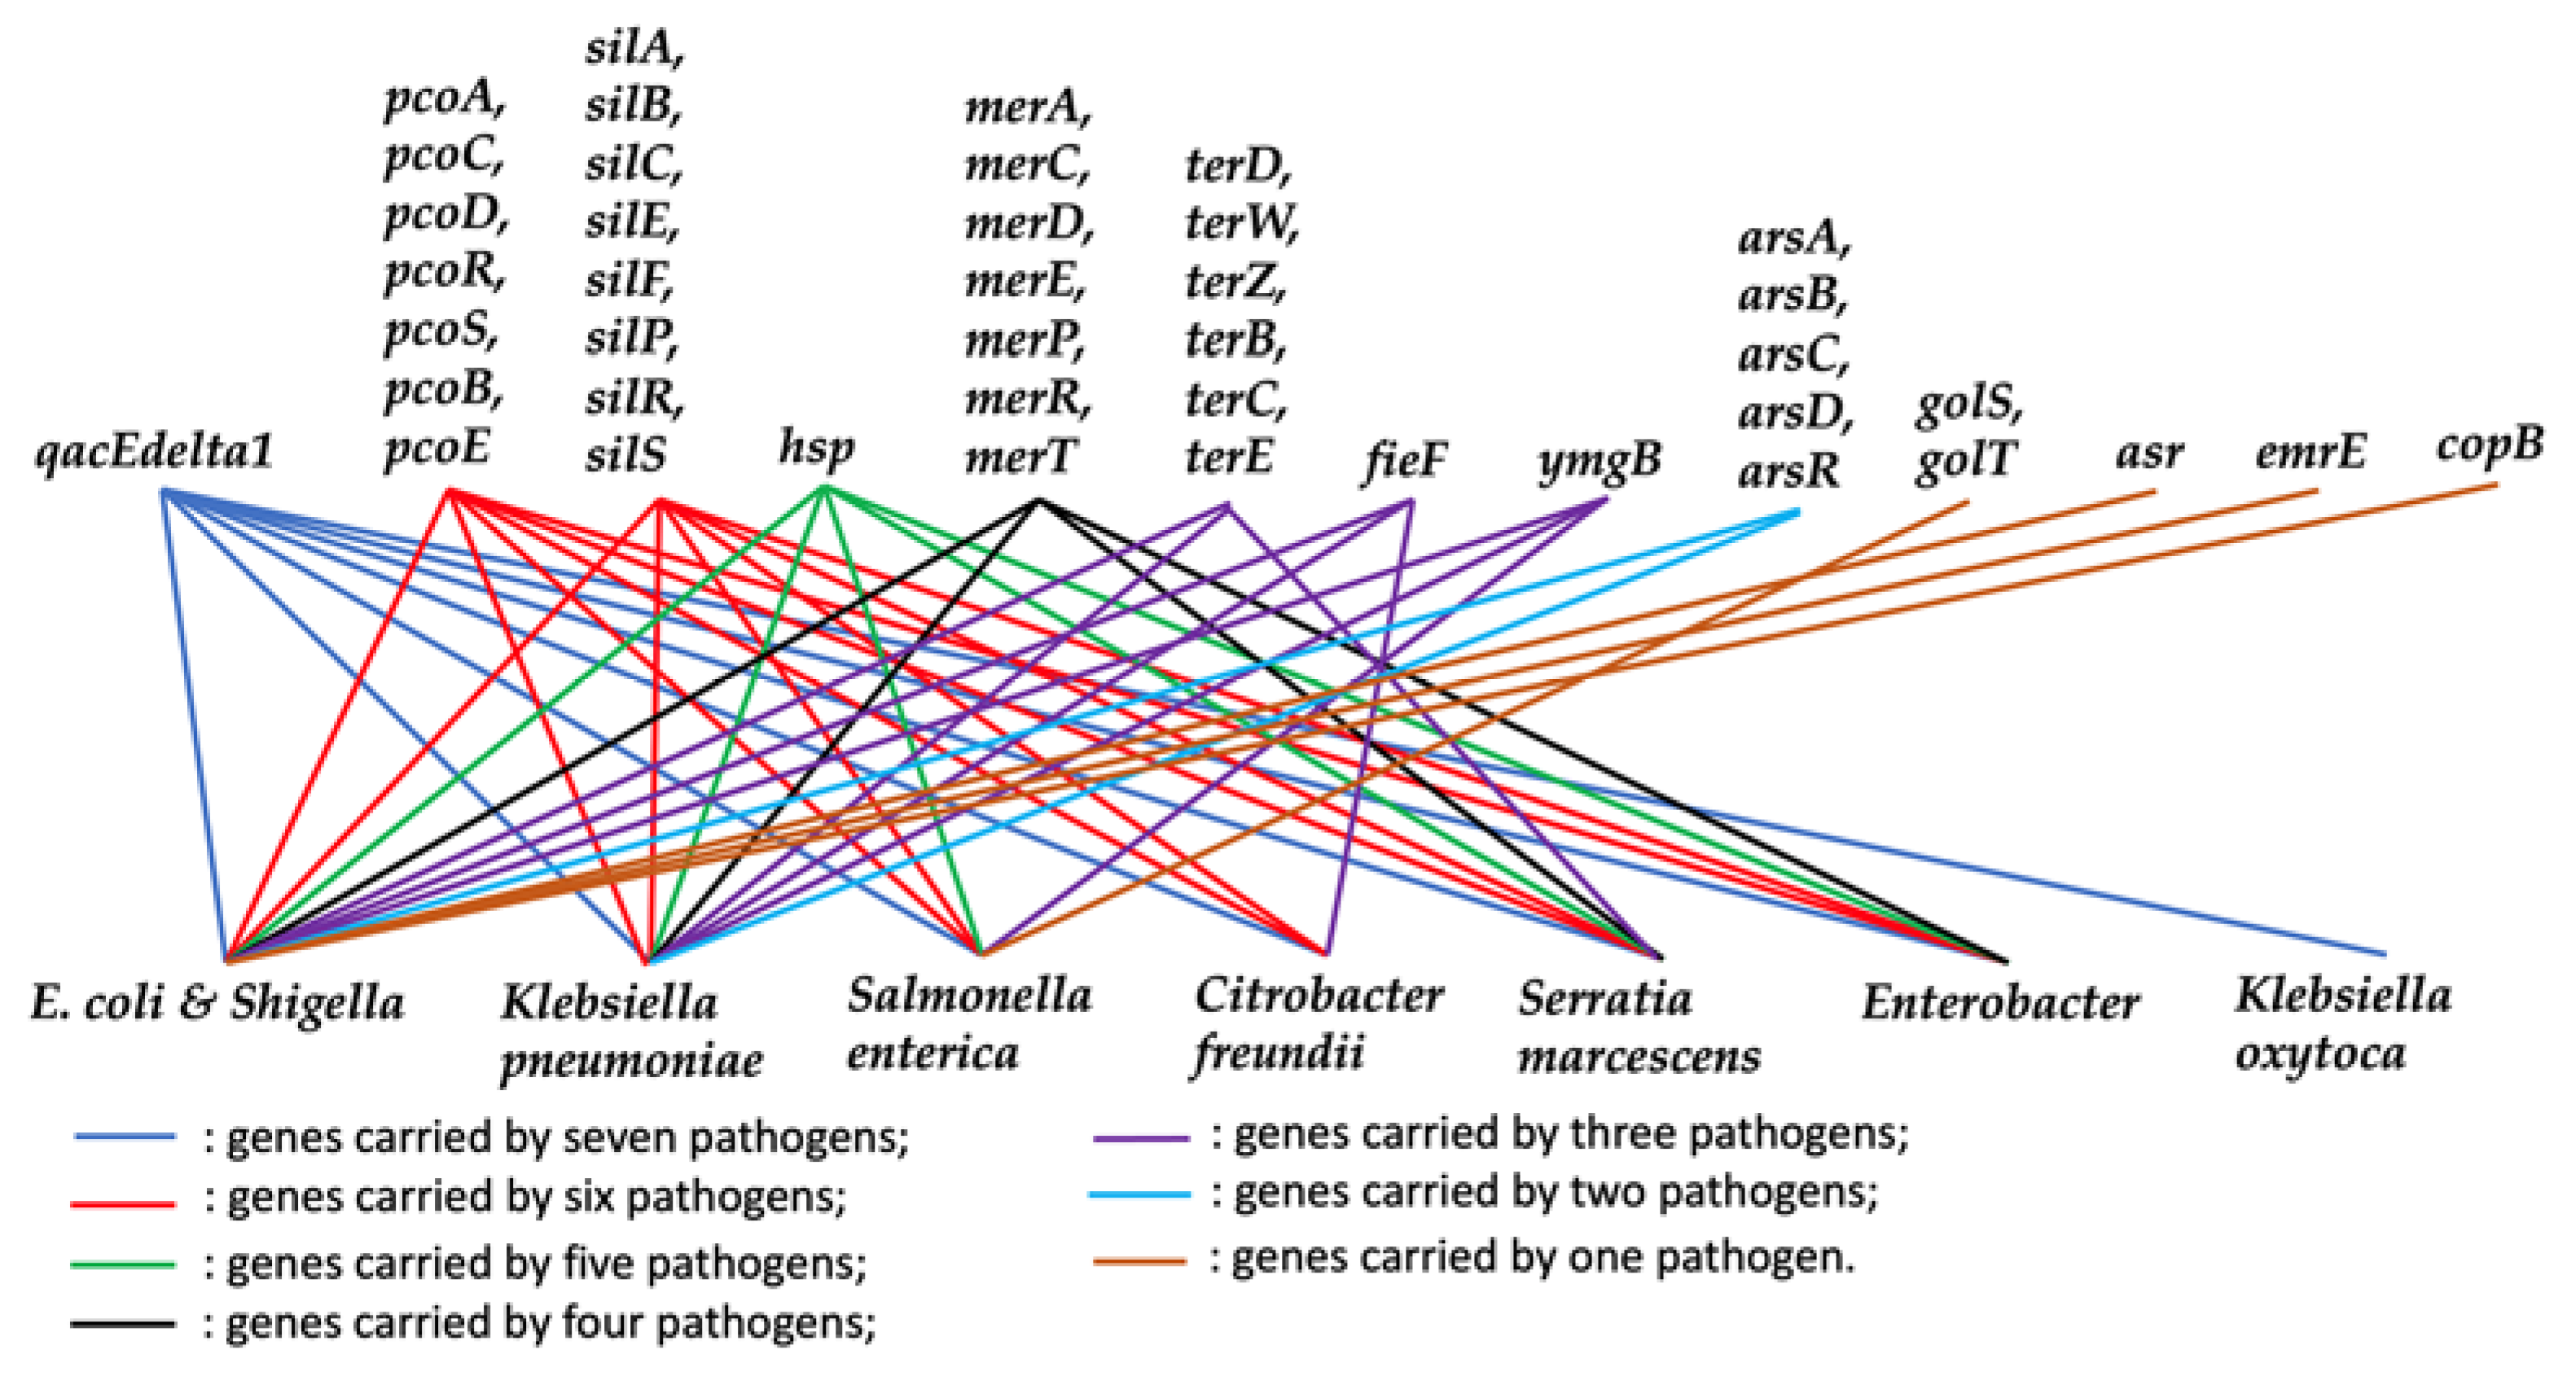
4.1. Significance of Important and Shared Stress Response Genes

The important stress response genes and pathogens carrying those genes have been, for the first time, studied and identified from historical data in the NPDIB database. They are shown in Table 1 and Table 2, while Figure 4 shows how those important stress response genes were carried by the pathogens. The important genes shared across all five countries are arsR, asr, merC, merP, merR, merT, and qacdelta1. Among those important genes, arsR encodes the regulatory protein of arsenical resistance operon [29]. Arsenic is the most prevalent environmental toxic compound causing public health issue [30]. It is not surprising to see that pathogens commonly contain arsR genes to survive arsenic. Differently from arsR, asr is required for pathogens to grow at moderate acidity and induce acid tolerance [31]. The four genes merC, merP, merR, and merT belong to the mer operon. They are carried by mercury-resistant bacteria after extensive evolution. In particular, mercuric mercury placed a pronounced effect on bacteria since the Earth’s oxygenation so that mer operon has evolved from a simple system in geothermal environments to a widely distributed stress response mechanism in pathogens [22]. The stress response gene found to be connected to the greatest number of pathogens was qacEdelta1 [24]. The stress imposed by overused disinfectant is one major driving force for the prevalence of qacEdelta1 in pathogens. For example, qacEdelta1 was found in the wastewater samples in multiple countries [32,33]. Knowledge of these important and commonly shared stress response genes, which facilitate the survival of pathogens under various stresses, can inform future drug development. Drugs created to inhibit them will have broader and more useful applications across different locations and settings. Furthermore, using multiple drugs that attack several stress response genes may result in a decreased reliance on antimicrobials to get rid of pathogens, which could reduce the prevalence of AMR and other harmful impacts of antimicrobial overuse.

4.2. Relationship between Stress Response Genes and AMR Genes

The public perception of antimicrobial resistance is that the overuse of antimicrobials has exacerbated the proliferation of antimicrobial resistance. This is explained by the selection pressure from the misuse of antimicrobials, which imposes microbial mutations and results in the prevalence of AMR genes in the microbial community. While this is observed globally as the number of unnecessary or ineffective antimicrobial prescriptions continues to grow rapidly, the stress response mechanisms may be another factor that facilitates pathogens’ antimicrobial resistance. The results in this work suggests that there may be a co-occurring relationship between those stress response genes and AMR genes (as evidenced by the genes detected together listed in Table 3). For example, stress response genes golT and golS were co-detected with AMR genes mdsA and mdsB in three countries—the US, the UK, and South Africa. This co-occurring relationship of these two types of genes was confirmed in a report in which most Salmonella isolates containing golS gene also carried mdsB and mdsC genes [34]. This can be explained by the fact that the golS gene is a promoter for mdsABC, which encodes AMR multidrug efflux pump [34]. In addition to the golT~golS and mdsB~mdsC group, ymgB and mdtM formed another pairing of a stress response gene (ymgB) and an AMR gene (mdtM) that were commonly carried by multiple countries. Gene ymgB was found to be involved in the regulation of biofilm formation and the resistance of acids [35], while mdtM that encodes a multidrug resistance protein [36] was commonly detected in the best biofilm-forming E. coli isolates [36,37]. This may imply the common co-occurrence of these two genes. Another pairing, comprised of a stress response gene and an AMR gene, was formed by qacEdelta1 and sul1, which were commonly found in the US, China, and Australia. This pair of genes was detected in 94.12% of 136 E. coli isolates [38]. In addition, this pair of genes was commonly detected in Klebsiella pneumoniae [39], Salmonella enterica [40], and other pathogens [41].
While three pairs of stress response genes and AMR genes were mainly discussed above, more pairs are presented in Table 3. Figure 6 shows that co-existence of stress response genes and AMR genes in pathogens is a common phenomenon. In particular, the most common samples in the datasets studied in this work contain three AMR genes and three stress response genes. All these indicate that underling relationships exist between stress response genes and AMR genes. The findings from this work (Table 3) indicates directions for combating antimicrobial resistance. For example, inhibition of the stress response genes in the pair (e.g., golT and golS) may be beneficial to inhibiting the pathogens carrying the AMR genes (e.g., mdsA and mdsB).

4.3. Limitations

This work was based on the NCBI Pathogens Isolates Browser database, which is a valuable source of historical data samples. While rapid technological improvements mean reporting gene occurrences has become easier in many countries over the past few decades, some countries are comparatively lacking in technology to collect extensive samples of pathogen isolates. This raises the possibility that a reduced number of reported gene samples in some countries may be due to a lack of efficient technology instead of a lack of stress response or AMR genes. In addition, because it is nearly impossible to ensure that every single occurrence of a stress response gene was recorded, the samples available from each country are not complete. Therefore, the findings reported in this work are dependent on the data available for the five selected countries. It is suggested to reconduct a similar research ten years later over more countries to get a more comprehensive picture on the relationship between stress response genes and AMR genes. The historical time profiles of the stress response genes were not presented in this work either, because far less samples were collected in the early years in this decade (e.g., in year 2010).
Only the stress response genes and AMR genes were studied in this work, as it was the focus of this study and these genes had been annotated by the NCBI Pathogens Isolates Browser database. It is possible to further study the sequencing data in the database to identify other genes that are related to stress response genes to get a more complete picture on how stress response is involved in other biological pathways or functions in pathogens. In addition, the hierarchical clustering was mainly based upon the detection frequencies of stress response genes across various pathogens. It is possible to cluster the genes according to the location or sources in which the pathogens were detected. That will be another interesting problem for further investigation.

5. Conclusions

While antimicrobial resistance genes from the NCBI Pathogens Isolates Browser have been extensively studied, little work has been done on the stress response genes. In order to address this, the study implemented principal component analysis and hierarchical clustering to identify the important stress response genes for five countries and study the relationship between stress response genes and AMR genes. It turns out that: (1) arsR, asr, merC, merP, merR, merT, and qacdelta1 are the common stress response genes shared by all five countries; (2) pathogens E. coli and Shigella and Klebsiella pneumoniae carried the greatest number of common stress response genes; (3) co-occurrence of stress response genes and AMR genes were found, such as the golT~golS and mdsB~mdsC group, the ymgB and mdtM group, and qacEdelta1 and sul1 group; (4) the samples with three stress response genes and three AMR genes detected had the highest detection frequencies in the data. The findings in this study indicate the stress response genes or mechanisms that may facilitate pathogen’s antimicrobial resistance. The important stress response genes identified in this work may serve as drug targets for further investigation to combat AMR pathogens.

Author Contributions

Q.J. and Z.H. prepared the gene data from the NCBI Pathogens Isolates Browser. The stress response genes and AMR genes for the five countries were analyzed and interpreted by R.P., L.Z., C.D., M.G., R.F., Q.J., and Z.H. All authors contributed to the drafting and editing of the manuscript. All authors have read and agreed to the published version of the manuscript.

Funding

This research received no external funding.

Institutional Review Board Statement

Not applicable.

Informed Consent Statement

Not applicable.

Data Availability Statement

Not applicable.

Conflicts of Interest

The authors declare no conflict of interest.

Appendix A

Figure A1. Example data table from the US data. The shaded blue columns correspond to the scientific names of pathogens, the date of sample collection, the type of pathogen source (clinical represented with a “1” and environmental represented with a “2”), number of AMR genes the sample is resistant to. Additionally, the shaded orange columns indicate whether a specific stress response gene was (“1”) or was not (“0”) detected in the sample. The following yellow columns indicate whether the sample resisted an antimicrobial gene (“1”) or not (“0”). Overall, the number of columns varied depending on the country. KEY: Blue = sample properties (pathogen name, collection year, source (clinical = 1, environmental = 2), # of AMR genes). Orange = whether the stress response gene was detected (1 = was, 0 = was not). Yellow = whether the AMR gene was detected (1 = was, 0 = was not). Green = source of sample. Grey = sample number.
Processes 09 00927 g0a1

References

  1. Scallan, E.; Hoekstra, R.M.; Widdowson, M.A.; Hall, A.J.; Griffin, P.M. Foodborne Illness Acquired in the United States Response. Emerg. Infect. Dis. 2011, 17, 1339–1340. [Google Scholar] [CrossRef]
  2. Boor, K.J. Bacterial stress responses: What doesn’t kill them can make them stronger. PLoS Biol. 2006, 4, 18–20. [Google Scholar] [CrossRef] [PubMed]
  3. Gao, W.; Smith, D.W.; Li, Y. Natural freezing as a wastewater treatment method: E. coli inactivation capacity. Water Res. 2006, 40, 2321–2326. [Google Scholar] [CrossRef] [PubMed]
  4. Weiser, R.S.; Hargiss, C.O. Studies on the Death of Bacteria at Low Temperatures. The Comparative Effects of Crystallization, Vitromelting, and Devitrification on the Mortality of Escherichia-Coli. J. Bacteriol. 1946, 52, 71–79. [Google Scholar] [CrossRef] [PubMed] [Green Version]
  5. Chung, H.J.; Bang, W.; Drake, M.A. Stress response of Escherichia coli. Compr. Rev. Food Sci. Food Saf. 2006, 5, 52–64. [Google Scholar] [CrossRef]
  6. Duhring, S.; Germerodt, S.; Skerka, C.; Zipfel, P.F.; Dandekar, T.; Schuster, S. Host-pathogen interactions between the human innate immune system and Candida albicans—Understanding and modeling defense and evasion strategies. Front. Microbiol. 2015, 6, 625. [Google Scholar] [CrossRef] [Green Version]
  7. National Library of Medicine (US). The NCBI Pathogen Detection Project; NCBI: Bethesda, MD, USA, 2016. [Google Scholar]
  8. Reygaert, W.C. An overview of the antimicrobial resistance mechanisms of bacteria. AIMS Microbiol. 2018, 4, 482–501. [Google Scholar] [CrossRef]
  9. O’Brien, T.F. Emergence, spread, and environmental effect of antimicrobial resistance: How use of an antimicrobial anywhere can increase resistance to any antimicrobial anywhere else. Clin. Infect. Dis. 2002, 34, S78–S84. [Google Scholar] [CrossRef] [Green Version]
  10. Harbottle, H.; Thakur, S.; Zhao, S.; White, D.G. Genetics of antimicrobial resistance. Anim. Biotechnol. 2006, 17, 111–124. [Google Scholar] [CrossRef]
  11. Brazas, M.D.; Hancock, R.E.W. Using microarray gene signatures to elucidate mechanisms of antibiotic action and resistance. Drug Discov. Today 2005, 10, 1245–1252. [Google Scholar] [CrossRef]
  12. Lee, S.; Hinz, A.; Bauerle, E.; Angermeyer, A.; Juhaszova, K.; Kaneko, Y.; Singh, P.K.; Manoil, C. Targeting a bacterial stress response to enhance antibiotic action. Proc. Natl. Acad. Sci. USA 2009, 106, 14570–14575. [Google Scholar] [CrossRef] [PubMed] [Green Version]
  13. Ebinesh, A. Bacterial Stress Response and Cross Resistance to Antibiotics in the Light of Natural Selection. J. Infect. Dis. Immune Ther. 2017, 1, 1. [Google Scholar]
  14. Poole, K. Stress responses as determinants of antimicrobial resistance in Pseudomonas aeruginosa: Multidrug efflux and more. Can. J. Microbiol. 2014, 60, 783–791. [Google Scholar] [CrossRef] [PubMed]
  15. Li, K.; Zheng, J.; Deng, T.; Peng, J.; Daniel, D.; Jia, Q.; Huang, Z.Y. An Analysis of Antimicrobial Resistance of Clinical Pathogens from Historical Samples for Six Countries. Processes 2019, 7, 964. [Google Scholar] [CrossRef] [Green Version]
  16. Yang, K.; Wang, A.; Fu, M.; Wang, A.; Chen, K.; Jia, Q.; Huang, Z.Y. Investigation of Incidents and Trends of Antimicrobial Resistance in Foodborne Pathogens in Eight Countries from Historical Sample Data. Int. J. Environ. Res. Public Health 2020, 17, 472. [Google Scholar] [CrossRef] [Green Version]
  17. Hua, M.G.; Huang, W.L.; Chen, A.; Rehmet, M.; Jin, C.; Huang, Z.Y. Comparison of Antimicrobial Resistance Detected in Environmental and Clinical Isolates from Historical Data for the US. Biomed Res. Int. 2020, 2020. [Google Scholar] [CrossRef]
  18. Kourti, T. Application of latent variable methods to process control and multivariate statistical process control in industry. Int. J. Adapt. Control. 2005, 19, 213–246. [Google Scholar] [CrossRef]
  19. Qin, S.J. Statistical process monitoring: Basics and beyond. J. Chemom. 2003, 17, 480–502. [Google Scholar] [CrossRef]
  20. Bar-Joseph, Z.; Demaine, E.D.; Gifford, D.K.; Srebro, N.; Hamel, A.M.; Jaakkola, T.S. K-ary clustering with optimal leaf ordering for gene expression data. Bioinformatics 2003, 19, 1070–1078. [Google Scholar] [CrossRef] [Green Version]
  21. Wang, X.Z.; Smith, K.; Hyndman, R. Characteristic-based clustering for time series data. Data Min. Knowl. Discov. 2006, 13, 335–364. [Google Scholar] [CrossRef]
  22. Boyd, E.S.; Barkay, T. The mercury resistance operon: From an origin in a geothermal environment to an efficient detoxification machine. Front. Microbiol. 2012, 3, 349. [Google Scholar] [CrossRef] [Green Version]
  23. Butcher, B.G.; Deane, S.M.; Rawlings, D.E. The chromosomal arsenic resistance genes of Thiobacillus ferrooxidans have an unusual arrangement and confer increased arsenic and antimony resistance to Escherichia coli. Appl. Environ. Microbol. 2000, 66, 1826–1833. [Google Scholar] [CrossRef] [PubMed] [Green Version]
  24. Uyaguari-Diaz, M.I.; Croxen, M.A.; Luo, Z.Y.; Cronin, K.I.; Chan, M.; Baticados, W.N.; Nesbitt, M.J.; Li, S.R.; Miller, K.M.; Dooley, D.; et al. Human Activity Determines the Presence of Integron-Associated and Antibiotic Resistance Genes in Southwestern British Columbia. Front. Microbiol. 2018, 9, 852. [Google Scholar] [CrossRef] [PubMed]
  25. Suziedeliene, E.; Suziedelis, K.; Garbenciute, V.; Normark, S. The acid-inducible asr gene in Escherichia coli: Transcriptional control by the phoBR operon. J. Bacteriol. 1999, 181, 2084–2093. [Google Scholar] [CrossRef] [Green Version]
  26. Munoz-Villagran, C.M.; Mendez, K.N.; Cornejo, F.; Figueroa, M.; Undabarrena, A.; Morales, E.H.; Arenas-Salinas, M.; Arenas, F.A.; Castro-Nallar, E.; Vasquez, C.C. Comparative genomic analysis of a new tellurite-resistant Psychrobacter strain isolated from the Antarctic Peninsula. PeerJ 2018, 6, e4402. [Google Scholar] [CrossRef] [PubMed] [Green Version]
  27. Bondarczuk, K.; Piotrowska-Seget, Z. Molecular basis of active copper resistance mechanisms in Gram-negative bacteria. Cell Biol. Toxicol. 2013, 29, 397–405. [Google Scholar] [CrossRef] [PubMed] [Green Version]
  28. Shafeeq, S.; Yesilkaya, H.; Kloosterman, T.G.; Narayanan, G.; Wandel, M.; Andrew, P.W.; Kuipers, O.P.; Morrissey, J.A. The cop operon is required for copper homeostasis and contributes to virulence in Streptococcus pneumoniae. Mol. Microbiol. 2011, 81, 1255–1270. [Google Scholar] [CrossRef] [Green Version]
  29. Wu, J.; Rosen, B.P. The Arsr Protein Is a Trans-Acting Regulatory Protein. Mol. Microbiol. 1991, 5, 1331–1336. [Google Scholar] [CrossRef]
  30. Firrincieli, A.; Presentato, A.; Favoino, G.; Marabottini, R.; Allevato, E.; Stazi, S.R.; Mugnozza, G.S.; Harfouche, A.; Petruccioli, M.; Turner, R.J.; et al. Identification of Resistance Genes and Response to Arsenic in Rhodococcus aetherivorans BCP1. Front. Microbiol. 2019, 10, 888. [Google Scholar] [CrossRef] [Green Version]
  31. Seputiene, V.; Motiejunas, D.; Suziedelis, K.; Tomenius, H.; Normark, S.; Melefors, O.; Suziedeliene, E. Molecular characterization of the acid-inducible asr gene of Escherichia coli and its role in acid stress response. J. Bacteriol. 2003, 185, 2475–2484. [Google Scholar] [CrossRef] [Green Version]
  32. Parnanen, K.M.M.; Narciso-da-Rocha, C.; Kneis, D.; Berendonk, T.U.; Cacace, D.; Do, T.T.; Elpers, C.; Fatta-Kassinos, D.; Henriques, I.; Jaeger, T.; et al. Antibiotic resistance in European wastewater treatment plants mirrors the pattern of clinical antibiotic resistance prevalence. Sci. Adv. 2019, 5, eaau9124. [Google Scholar] [CrossRef] [Green Version]
  33. Surleac, M.; Barbu, I.C.; Paraschiv, S.; Popa, L.I.; Gheorghe, I.; Marutescu, L.; Popa, M.; Sarbu, I.; Talapan, D.; Nita, M.; et al. Whole genome sequencing snapshot of multi-drug resistant Klebsiella pneumoniae strains from hospitals and receiving wastewater treatment plants in Southern Romania. PLoS ONE 2020, 15, e0228079. [Google Scholar] [CrossRef] [PubMed] [Green Version]
  34. Pontel, L.B.; Audero, M.E.; Espariz, M.; Checa, S.K.; Soncini, F.C. GolS controls the response to gold by the hierarchical induction of Salmonella-specific genes that include a CBA efflux-coding operon. Mol. Microbiol. 2007, 66, 814–825. [Google Scholar] [CrossRef] [PubMed]
  35. Lee, J.; Page, R.; Garcia-Contreras, R.; Palermino, J.M.; Zhang, X.S.; Doshi, O.; Wood, T.K.; Peti, W. Structure and function of the Escherichia coli protein YmgB: A protein critical for biofilm formation and acid-resistance. J. Mol. Biol. 2007, 373, 11–26. [Google Scholar] [CrossRef]
  36. Nishino, K.; Yamaguchi, A. Analysis of a complete library of putative drug transporter genes in Escherichia coli. J. Bacteriol. 2001, 183, 5803–5812. [Google Scholar] [CrossRef] [PubMed] [Green Version]
  37. Ranjith, K.; Arunasri, K.; Reddy, G.S.; Adicherla, H.; Sharma, S.; Shivaji, S. Global gene expression in Escherichia coli, isolated from the diseased ocular surface of the human eye with a potential to form biofilm. Gut Pathog. 2017, 9, 15. [Google Scholar] [CrossRef] [PubMed] [Green Version]
  38. Han, D.; Huang, J.; Shang, Z.; Xu, R.; Lou, Y.; Chen, X. Co-existence of resistance genes and their association with the genetic marker of integrons among multi-resistant Escherichia coli isolates. Acta Microbiol. Sin. 2011, 51, 458–467. [Google Scholar]
  39. Okade, H.; Nakagawa, S.; Sakagami, T.; Hisada, H.; Nomura, N.; Mitsuyama, J.; Yamagishi, Y.; Mikamo, H. Characterization of plasmid-mediated quinolone resistance determinants in Klebsiella pneumoniae and Escherichia coli from Tokai, Japan. J. Infect. Chemother. 2014, 20, 778–783. [Google Scholar] [CrossRef]
  40. Chiu, C.H.; Chen, H.L.; Kao, L.S.; Yang, C.Y.; Chu, C.; Doublet, B.; Praud, K.; Cloeckaert, A. Variant Salmonella genomic island 1 antibiotic resistance gene clusters in Salmonella enterica serovar Derby isolates from humans in Taiwan. J. Antimicrob. Chemother. 2007, 59, 325–326. [Google Scholar] [CrossRef]
  41. Moura, A.; Araujo, S.; Alves, M.S.; Henriques, I.; Pereira, A.; Correia, A.C.M. The contribution of Escherichia coli from human and animal sources to the integron gene pool in coastal waters. Front. Microbiol. 2014, 5, 419. [Google Scholar] [CrossRef]
Figure 1. The schematic description of the procedure for identifying the outlier (i.e., important) genes from the dataset: (A) the high-dimensional space is reduced to the two dimensional PC1~PC2 space with principal component analysis (PC1―principal component 1; PC2―principal component 2); (B) genes are clustered into different groups with hierarchical clustering―two clusters (by the red-dashed line) or three clusters (by the orange-dashed line) or other numbers of clusters (not further clusters shown here due to the space constraint). The optimal number of clusters was determined by the bending point in the plot of the sum of the total variance of within individual clusters.
Processes 09 00927 g001
Figure 2. The hierarchical clustering result of stress response genes from the US historical data. Six clusters were obtained when the clustering tree was cut at the height indicated by the blue line. The genes not enclosed by the RED rectangle were regarded as the outlier genes that are highly detected in the pathogens with stress response.
Processes 09 00927 g002
Figure 3. The hierarchical clustering result for pathogens carrying stress response genes in the US.
Processes 09 00927 g003
Figure 4. The important stress response genes carried by the important pathogens.
Processes 09 00927 g004
Figure 5. The hierarchical clustering tree for stress and AMR genes from the US. Black text represents stress response genes and green text represents AMR genes.
Processes 09 00927 g005
Figure 6. The number of samples (i.e., frequency) containing the number of stress response genes shown in the x-axis and the number of AMR genes shown in the y-axis. The size of the circle is proportional to the number of samples in the US data (a larger circle meaning a larger number of samples containing that many stress response and AMR genes).
Processes 09 00927 g006
Table 1. Important stress response genes identified for individual countries (marked by the shading).
GenesUSUKChinaSouth AfricaAustralia
arsA
arsB
arsC
arsD
arsR
asr
copB
emrE
fieF
golS
golT
hsp
merA
merC
merD
merE
merP
merR
merT
pcoA
pcoB
pcoC
pcoD
pcoE
pcoR
pcoS
qacEdelta1
silA
silB
silC
silE
silF
silP
silR
silS
terB
terC
terD
terE
terW
terZ
ymgB
Table 2. Major pathogens carrying stress response genes across all five countries (marked by the shading).
South AfricaChinaAustraliaUKUS
E. coli and Shigella
Salmonella enterica
Klebsiella pneumoniae
Enterobacter
Enterococcus faecium
Klebsiella oxytoca
Citrobacter freundii
Cronobacter
Serratia marcescens
Table 3. The stress and AMR genes that were connected in the hierarchical tree from each country. The pairs of stress response and AMR genes that were detected in multiple countries are marked in colors.
CountriesStress Response GenesAMR Genes
The USgolT, golSmdsA, mdsB
qacEdelta1sul1
The UKgolT, golSmdsA, mdsB
emrEacrF
ygmBemrD
fiefsat2
arsRtet(A)
ChinaymgBmdtM
emrEgyrA_s83L
pcoAoqxA
qacEdelta1sul1
South AfricagolS, golTmdsA, mdsB
hsp20, arsA, arsB, arsRaac(3)-lla
arsC, pcoB, pcoC, pcoD, pcoR, silScatB3
AustraliaymgBmdtM
copBaac()-l, msr(C), eat(A)
terD, terW, terZcyaA_S352T
merC, merP, merTblaCTX-M-15, gyrA_D87N
qacEdelta1sul1
Publisher’s Note: MDPI stays neutral with regard to jurisdictional claims in published maps and institutional affiliations.

