Article

A Method to Reduce Steam Consumption of ECF Bleaching Based on Operation Optimizing

1
College of Light Industry and Food Engineering, Guangxi University, Nanning 530004, China
2
Guangxi Key Lab of Clean Pulp & Papermaking and Pollution Control, Nanning 530004, China
3
Shandong Century Sunshine Paper Group Co., Ltd., Weifang 262400, China
4
Guangxi Bossco Environmental Protection Technology Co., Ltd., Nanning 530007, China
*
Author to whom correspondence should be addressed.
Processes 2021, 9(6), 928; https://doi.org/10.3390/pr9060928
Submission received: 26 April 2021 / Revised: 16 May 2021 / Accepted: 20 May 2021 / Published: 25 May 2021
(This article belongs to the Special Issue Energy Conservation and Emission Reduction in Process Industry)

Abstract

:
Development of paper industry has been restricted by resources, energy and environment deeply; further reducing energy consumption becomes an urgent problem to be solved. In this paper, the calculating model of steam consumption in bleaching process is established under the premise of ensuring product quality and controlling bleaching cost. Then, an optimization model for minimizing steam consumption is constructed. Compared with before optimization, the steam consumption of the optimized bleaching system reduced by 19.48% (0.5014 t/adt) at a loss of 0.11% brightness (0.1 ISO%) and 5.17% viscosity (33 mL/g). The amount of chemicals should be increased to ensure the quality of the pulp while decreasing the bleaching temperature to reduce steam consumption, the cost of bleaching pulp has decreased by 1.62% (3.19 USD/adt) after optimization. The verification experiments showed all the pulp quality indices can meet the requirements of bleached pulp.

1. Introduction

The global paper industry has developed rapidly in recent years, the production of global paper and paperboard reached 404 million tons in 2019, an increase of 25% compared with 2000 [1], as one of the most energy-intensive industries, paper industry consumed 6% of the global industrial energy [2]. As the prices of raw materials and energy have risen sharply, labor costs increased in the past decade, development of paper industry has been restricted by resources, energy and environment deeply. How to improve the energy efficiency and reduce energy consumption has become the research focus of relevant workers [3,4]. The massive consumption of energy is accompanied by the increase in the cost of pulp production. In the era of active price changes of chemicals and energy, pulp mills should constantly adjust the amount of materials and energy to balance the process model to determine the most cost-effective operation scheme [5].
Some research focused on energy consumption in pulp and paper mills have been done in the past decades. Energy saving potential can be found out by conducting an energy audit, energy efficiency would be improved by retrofitting of equipment or technologies in the pulp mills [6,7,8]. Kong et al. determined nine energy-efficiency improvement opportunities based on an energy audit and calculation of energy and carbon indicators for a paper mill in China, which can reduce the energy consumption of paper machines by about 8–11% [9]. Costa et al. proposed three ways to add absorption heat pump in the production process of kraft pulp to improve the energy efficiency and production efficiency of pulp mill [10]. Akterian et al. improved the energy efficiency and reduced the steam consumption by selecting the surface roughness of the steam ejector that met the conditions [11]. Goortani et al. have integrated the cogeneration device into the processing of kraft pulp, which can recover 23% of the internal energy and has significant economic advantages [12]. The above method of reducing steam consumption through equipment transformation in pulp mills have achieved remarkable results, but retrofitting is needed, which requires several years to repay the cost of factory transformation. Certainly, some workers also reduced the consumption of steam in the bleaching process by adding potassium persulfate (K2S2O8), enzymes or improving the bleaching process [13,14,15]. Kermani et al. developed an optimization method based on mixed integer linear programming (MILP) to maximize the recovery of internal heat in paper mills and reduce the consumption of heat energy [16]. Through the installation process optimization control system, three large-scale bleached chemical wood pulp mills in Brazil can timely know the changes of pulp Kappa number, brightness and residual chemicals in the process, and further reduce the chemical consumption and bleaching cost [17]. Ji et al. used reMIND software and commercial optimization software CPLEX to simulate and initially optimize the pulp and paper mill and reduce the cost to the minimum [18]. Chew et al. developed an optimization model to optimize the brown stock washing system (BSWS) resource saving in pulp and paper mills, and achieved significant savings in energy and water [19]. Skals et al. reduced energy consumption in bleaching by adding the enzyme treatment [15]. The above studies have proved that it is feasible to reduce steam energy consumption by optimizing the operation process, while there is little research on reducing energy consumption from the bleaching system.
In view of the above-mentioned problems, the paper hopes to establish a systematically mathematical model of the bleaching system to reduce the energy consumption of the bleaching process. Relevant models of the bleaching process established in our previous research are the basis of this study, such as pulp quality models measured by brightness, viscosity and Kappa number [20], and correlation between chlorine dioxide bleaching and components of pulp [21]. Additionally, results from this past work are employed to develop mathematical relationships between the operating conditions, e.g., the amount of chemicals, bleaching temperature and energy consumption. Elemental chlorine free bleaching (ECF) bleaching has advantages in brightness, strength and cost of bleached pulp, so the market share of ECF bleached pulp is about 90–95% [22]. We selected a typical ECF bleaching process (D0EpPD1) as a case study. By utilizing this model, pulp quality and energy consumption can be predicted the whole bleaching process and optimized to minimize energy consumption while the pulp quality changes within a certain range.

2. Methodology

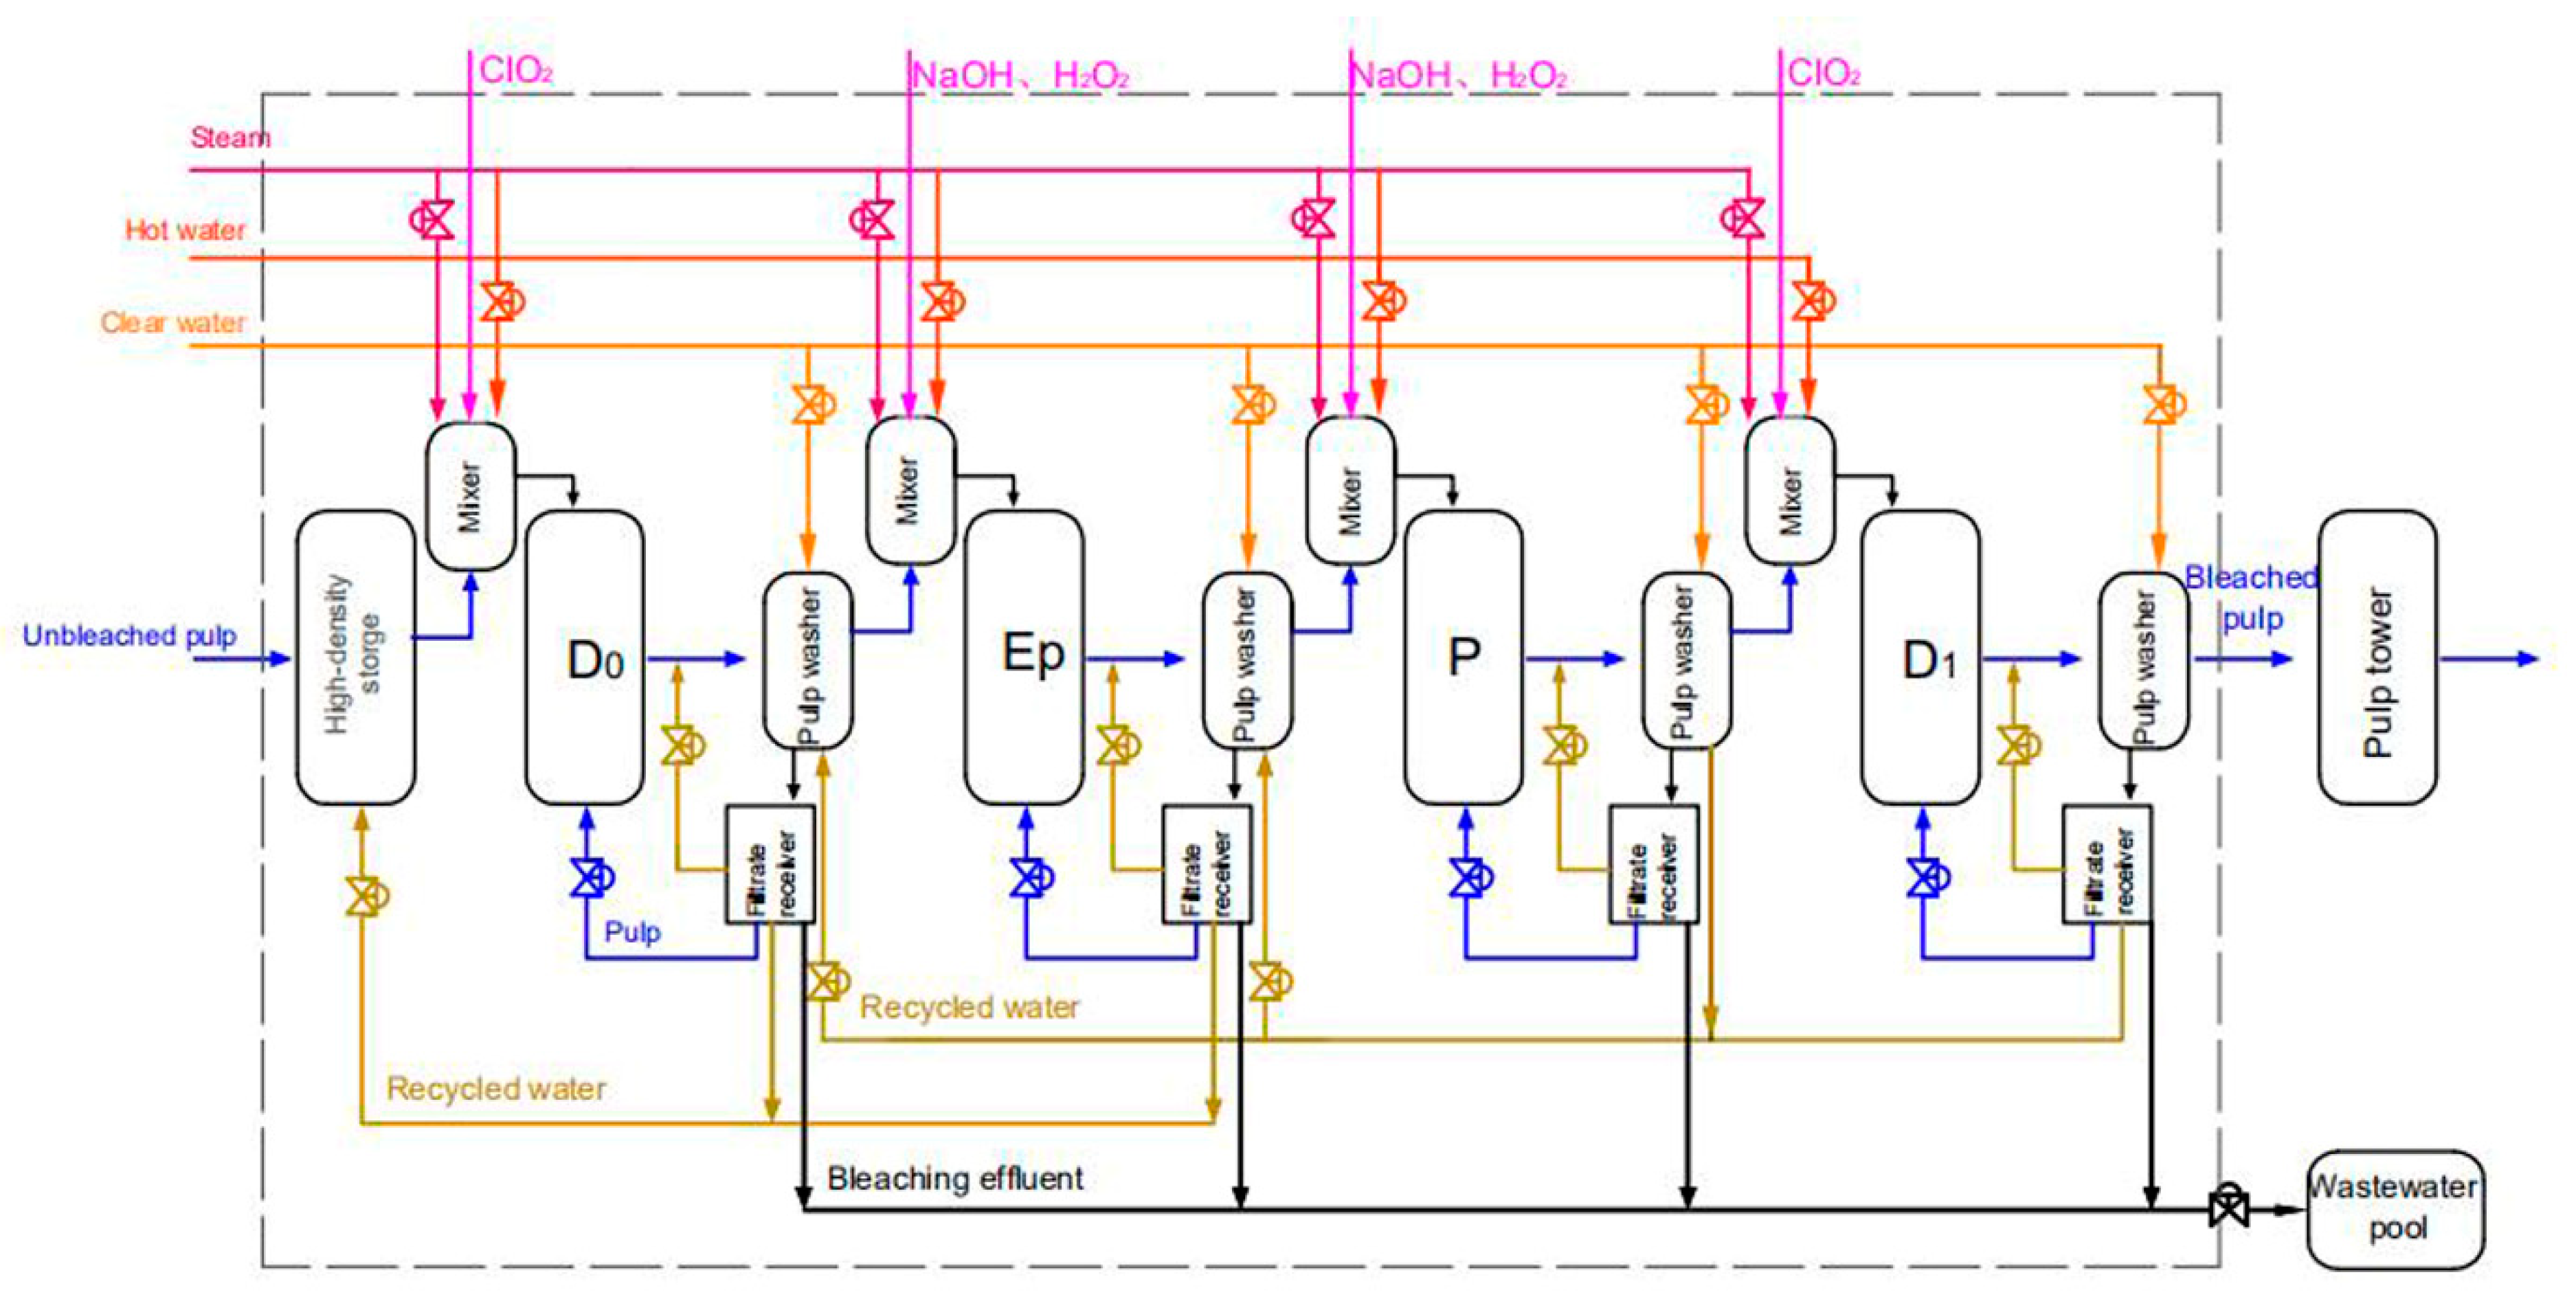
2.1. System Configuration of Typical Bleaching Process

As shown in Figure 1, chlorine dioxide (ClO2), hydrogen peroxide (H2O2) and sodium hydroxide (NaOH) were added during bleaching to destroy the chromogenic group of lignin and improve the brightness of pulp. Meanwhile, the reaction temperature was controlled to promote the reaction [23,24,25,26,27]. It can be seen from Figure 1 that pulp should be heated by steam to a set temperature before entering the bleaching tower, therefore, steam consumption is mainly affected by bleaching temperature and pulp yield. The quality of pulp after bleaching is not only affected by bleaching temperature, but also by chemical dosages and bleaching time. According to our previous work, the brightness of pulp increases as the dosage of chemicals increases, and the brightness of pulp decreases when the bleaching temperature declines [20,21,28].

2.2. Experiments

The bleaching experiments were carried out on an unbleached eucalyptus kraft pulp from Guangxi Hong Yuan Co., Ltd. (Fangchenggang, China). Chlorine dioxide was supplied by Guangxi Yongkai Sugar Paper Co., Ltd. (Nanning, China). Sodium hydroxide, hydrogen peroxide and sulfuric acid were supplied by Guangxi Nanning Rongyi Experimental Equipment Co., Ltd. (Nanning, China). The initial conditions of pulp were: brightness 35.38% ISO, viscosity 1087 mL/g and Kappa number 19.39 mL/g.
In the experiments, pulp and the bleaching reagent were added to a sealed bag for bleaching. Bleaching temperature was controlled by water and the pulp was kneaded every 15 min. Six levels of single factor experiments were performed for chemical dosage and bleaching temperature. The testing methods of pulp quality involved in the experiment are shown in Table 1. Data for pulp and effluent quality were fitted to equations using the IBM SPSS Statistics 23 software (IBM Corp., New York, NY, USA). Optimal operating conditions for pulp quality and steam consumption were determined to use MATLAB 2018 software (MathWorks Corp., Natick, MA, USA).

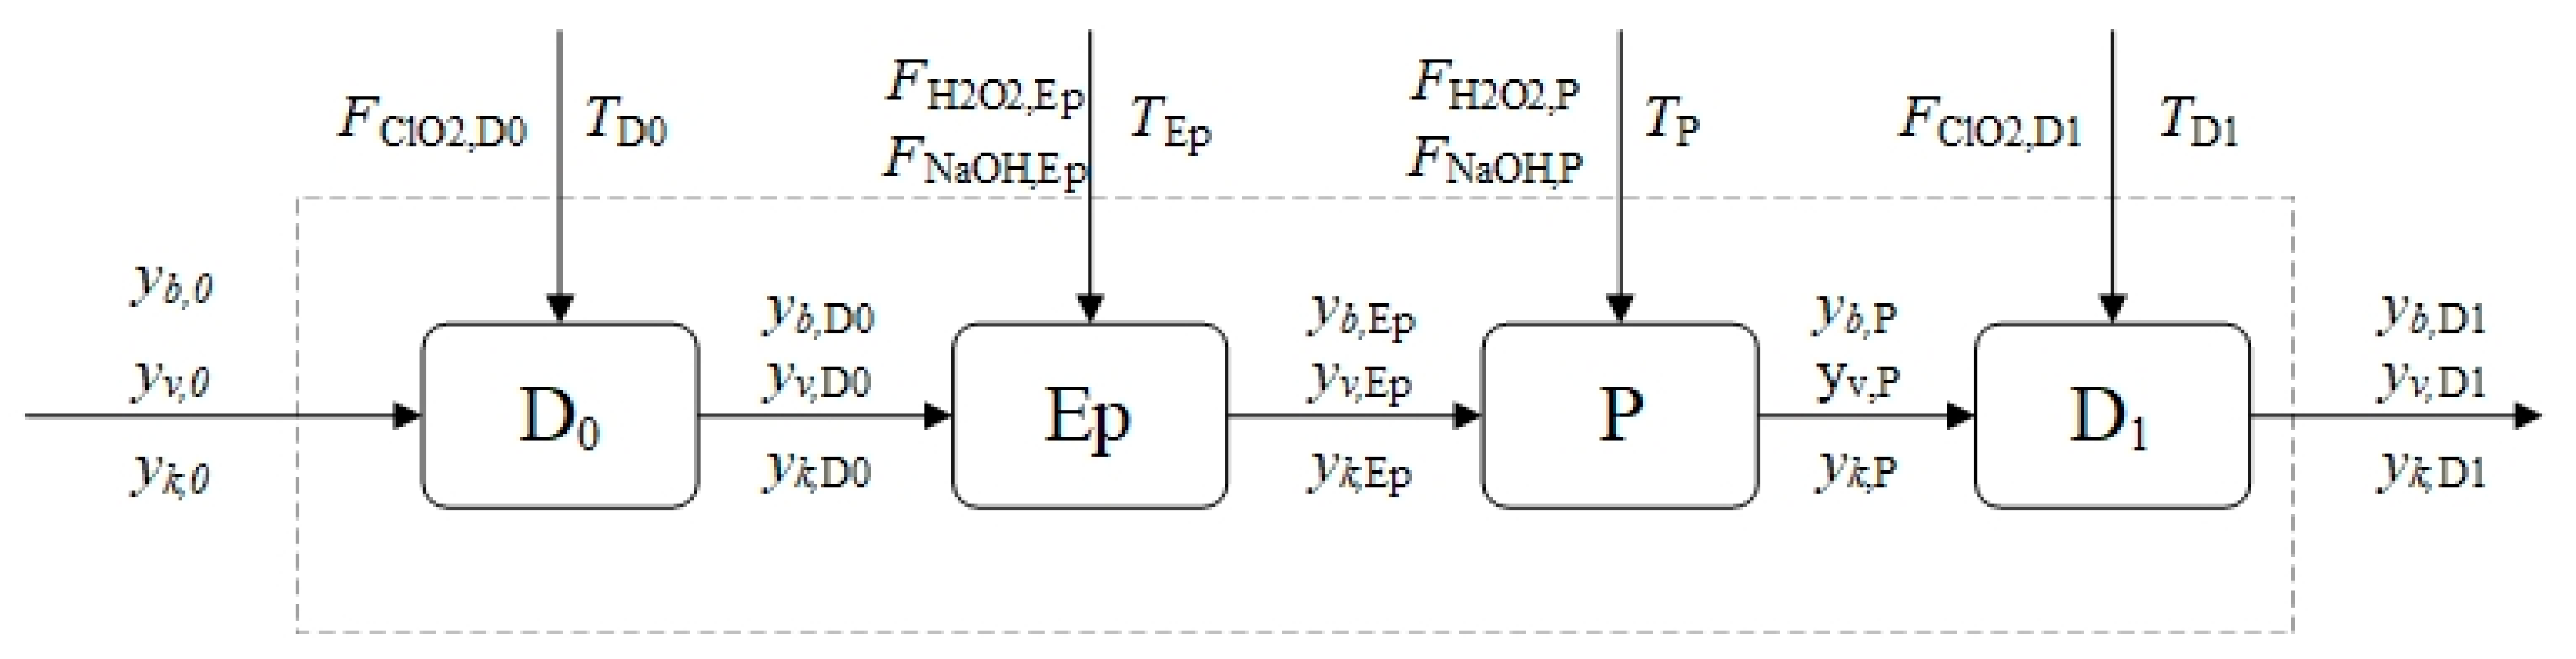
2.3. Optimization Model for the Bleaching System

Objective function and constraint conditions should be fixed to establish the optimization model. The objective function should be the minimal steam consumption because the objective of this study is to reduce steam consumption of bleaching. Pulp quality (brightness, viscosity and Kappa number), bleaching cost and the range of independent variables should be considered as the constraint conditions.

2.3.1. Objective Function

The energy consumed in the bleaching process includes steam and electricity. Electricity is used to maintain the running of pulping equipment, and steam is used to increase the bleaching temperature. It is assumed that all the steam in the bleaching process is used for heating the pulp. So, steam consumption of the whole bleaching system is the sum of the steam used to heat the pulp in each stage, as expressed by Equation (1).
E tot = i = 1 N E i
here, Etot and Ei are the steam consumption of the entire bleaching system and stage i, respectively, ton/h; N is the number of bleaching stages. According to the law of conservation of energy, the steam consumption of each stage can be obtained by dividing the energy required to provide each stage of slurry temperature increase by the latent heat of steam. The calculation equation of a single bleaching stage can be expressed by Equation (2) [28].
E i = m p d p [ c f + c w ( 1 C p , i ) C p , i ] [ i = i + 1 N ( 1 l i ) ] ( I s c w T out , i ) ( T out , i T in )
here, mp is the yield of bleached pulp; t/h; dp is the dryness of air-dried pulp and dp = 90%; cf (1.423) and cw (4.187) are the specific heat of the fiber and water respectively, kJ/(kg*K) [28]. Cp = 10%, the concentration of the pulp; Tout,i is the bleaching temperature of stage i, °C; Tin (25) is the temperature of pulp entering the bleaching tower, °C; li is the ratio of cellulose degradation in stage i, %; Is is the steam enthalpy, Is = 2855.5 kJ/kg (at 0.5 MPa, 200 °C).This paper focuses on minimizing the steam consumption, so the objectives function of optimization model (F(x)) can be expressed by Equation (10) according to Equations (1) and (2).
M i n F ( x ) = M i n E t o t = M i n i = i + 1 N m p d p [ c f + c w ( 1 C p , i ) C p , i ] [ i = i + 1 N ( 1 l i ) ] ( I s c w T out , i ) ( T out , i T in )
According to Equations (2) and (3), it can be seen that when the number of bleaching stages, pulp concentration (Cp,i) and initial bleaching pulp temperature (Tin) are determined, the steam consumption of the bleaching process is mainly affected by the bleaching temperature. From our previous research, it can be found that the bleaching temperature will affect the brightness, viscosity and the cost of bleaching [20,21,28].

2.3.2. Constraints

It is only reasonable to reduce steam consumption under the premise of ensuring pulp quality without increasing bleaching cost. Therefore, pulp quality models and the calculation model of bleaching cost should be established as the constraints of the optimization model.
The four successive stages of bleaching (D0, EP, P and D1) are shown in Figure 2, the initial quality indices of the pulp are designated as brightness yb,0, viscosity yv,0, Kappa number yk,0. The operating conditions of each stage (chemical dosage) are designated as FClO2,D0, FH2O2,Ep, FNaOH,Ep, FH2O2,P, FNaOH,P and FClO2, D1; bleaching temperature are designated as TD0, TEp, TP and TD1. Quality indices leaving one stage are the inputs to the subsequent stage. Pulp quality after the D1 stage is the final quality of the entire system. It is set according to the requirements of papermaking or commercial pulp.
The relationship between the input and output of the quality indicators can be expressed by Equations (4)–(6) shown below:
y b , D 1 = y b , 0 + f b ( F ClO 2 , D 0 , T D 0 ) + f b ( F H 2 O 2 , Ep , T Ep , F NaOH , Ep ) + f b ( F H 2 O 2 , P , T P , F NaOH , P ) + f b ( F ClO 2 , D 1 , T D 1 )
y v , D 1 = y v , 0 f v ( F ClO 2 , D 0 , T D 0 ) f v ( F H 2 O 2 , Ep , T Ep , F NaOH , Ep ) f v ( F H 2 O 2 , P , T P , F NaOH , P ) f v ( F ClO 2 , D 1 , T D 1 )
y b , D 1 = y b , 0 + f b ( F ClO 2 , D 0 , T D 0 ) + f b ( F H 2 O 2 , Ep , T Ep , F NaOH , Ep ) + f b ( F H 2 O 2 , P , T P , F NaOH , P ) + f b ( F ClO 2 , D 1 , T D 1 )
here, fb, fv and fk are the functions between brightness, viscosity, Kappa number and operating conditions of each bleaching stage respectively, which can be obtained by data fitting based on a large number of single factor experiments on each stage. Considering the Kappa number after bleaching is small and it is difficult to judge the end point of titration, which causes the analysis result unstable, the Kappa number is not considered in the optimization model but involved in the analysis and subsequent experimental verification. Here, bleaching temperatures TD0, TEp, TP and TD1 equal to Tout,i in Equation (3) when i = 1, 2, 3 and 4, respectively. So, quality indices of bleached pulp will change as bleaching temperature varies. The pulp quality after bleaching should be met the requirements of commercial pulp or subsequent paper production whatever the optimizing operation selected, as expressed by inequalities (7) and (8).
y b , D 1 y b , set
y v , D 1 y v , set
here, yb,set and yv,set are desired values of pulp brightness and viscosity after bleaching respectively.
The production cost of bleaching is impacted by the amount of chemicals and the bleaching temperature according to the previous analysis [29]. Ignoring the variations of electricity consumption, washing water consumption and wastewater treatment price. Since the entire bleaching process consists of four stages, the production cost (Ctot, USD/adt) of bleached air-dried pulp can be calculated by adding up the bleaching cost of each stage and dividing the yield of air-dried pulp after bleaching, as shown in Equation (9).
C tot = i = 1 N C c , i + i = 1 N C s , i m p
where Cc,i and Cs,i are the cost of chemicals and steam in stage i respectively, USD/adt. The total cost of steam and the total cost of chemicals in stage i can be calculated by Equations (10) and (11) respectively.
i = 1 N C s , i = E tot P s
C c , i = j = 1 k m c , j , i P c , j , i
here, Ps is the price of steam, USD/t; Pc,j,i is the price of chemical j in stage i, USD/t; mc,j,i is the mass flow of chemical j in stage i, t/adt, which can be calculated as follows.
m c , j , i = F c , j , i m p d p i = i + 1 N ( 1 l i )
where Fc,j,i is the dosage of chemical j in stage i, %. Here, when i = 1, j = 1, Fc,j,i stands for FClO2,D0; when i = 2, j = 2 and 3, Fc,j,i stands for FH2O2,Ep and FNaOH,Ep,, respectively; when i = 3, j = 2 and 3, Fc,j,i stands for FH2O2,P and FNaOH,P, respectively; when i = 4, j = 1, Fc,j,i stands for FClO2,D1.
The cost of bleaching after optimization should not increase compared with that before optimization, as expressed as follows.
C tot C tot , set
here, Ctot,set is the operating cost before optimization.
Moreover, the operating variables should be changed in the reasonable ranges [30]. These constraints can be expressed as follows.
{ T min , i T i T max , i 0 F ClO 2 , D 0 F max , ClO 2 0 F ClO 2 , D 1 F max , ClO 2 F min , ClO 2 F ClO 2 , D 0 + F ClO 2 , D 1 F max , ClO 2 0 F H 2 O 2 , Ep F max , H 2 O 2 0 F H 2 O 2 , P F max , H 2 O 2 F min , H 2 O 2 F H 2 O 2 , Ep + F H 2 O 2 , P F max , H 2 O 2 0 F NaOH , Ep F max , NaOH 0 F NaOH , P F max , NaOH F min , NaOH F NaOH , Ep + F NaOH , P F max , NaOH
The variables are defined as follows:
Fmin,ClO2, Fmax,ClO2, Fmin,NaOH, Fmax,NaOH, Fmin,H2O2 and Fmax,H2O2: the minimum and maximum total dosage of ClO2, NaOH and H2O2 respectively.
Tmin,i and Tmax,i: the minimum and maximum bleaching temperature.
The function “fminimax” of MATLAB optimization toolbox was employed to solve the optimization because it is a single-objective nonlinear optimization problem. Typical values for these parameters in an industrial bleach plant were determined from a bleaching workshop and information from pulp suppliers, prices and specifications of the chemicals, steam involved is selected based on a Chinese chemical website, as shown in Table 2.

3. Results and Discussion

As mentioned above, ensuring pulp quality is the premise to optimal operation. To ensure the feasibility of the optimization results, it is necessary to verify the correlation of the quality model. Pulp quality, bleaching cost and steam consumption are compared before and after optimization. Additionally, the optimized results are verified and analyzed by carrying out validation experiments and analyze the advantages and reasons of the optimization scheme.

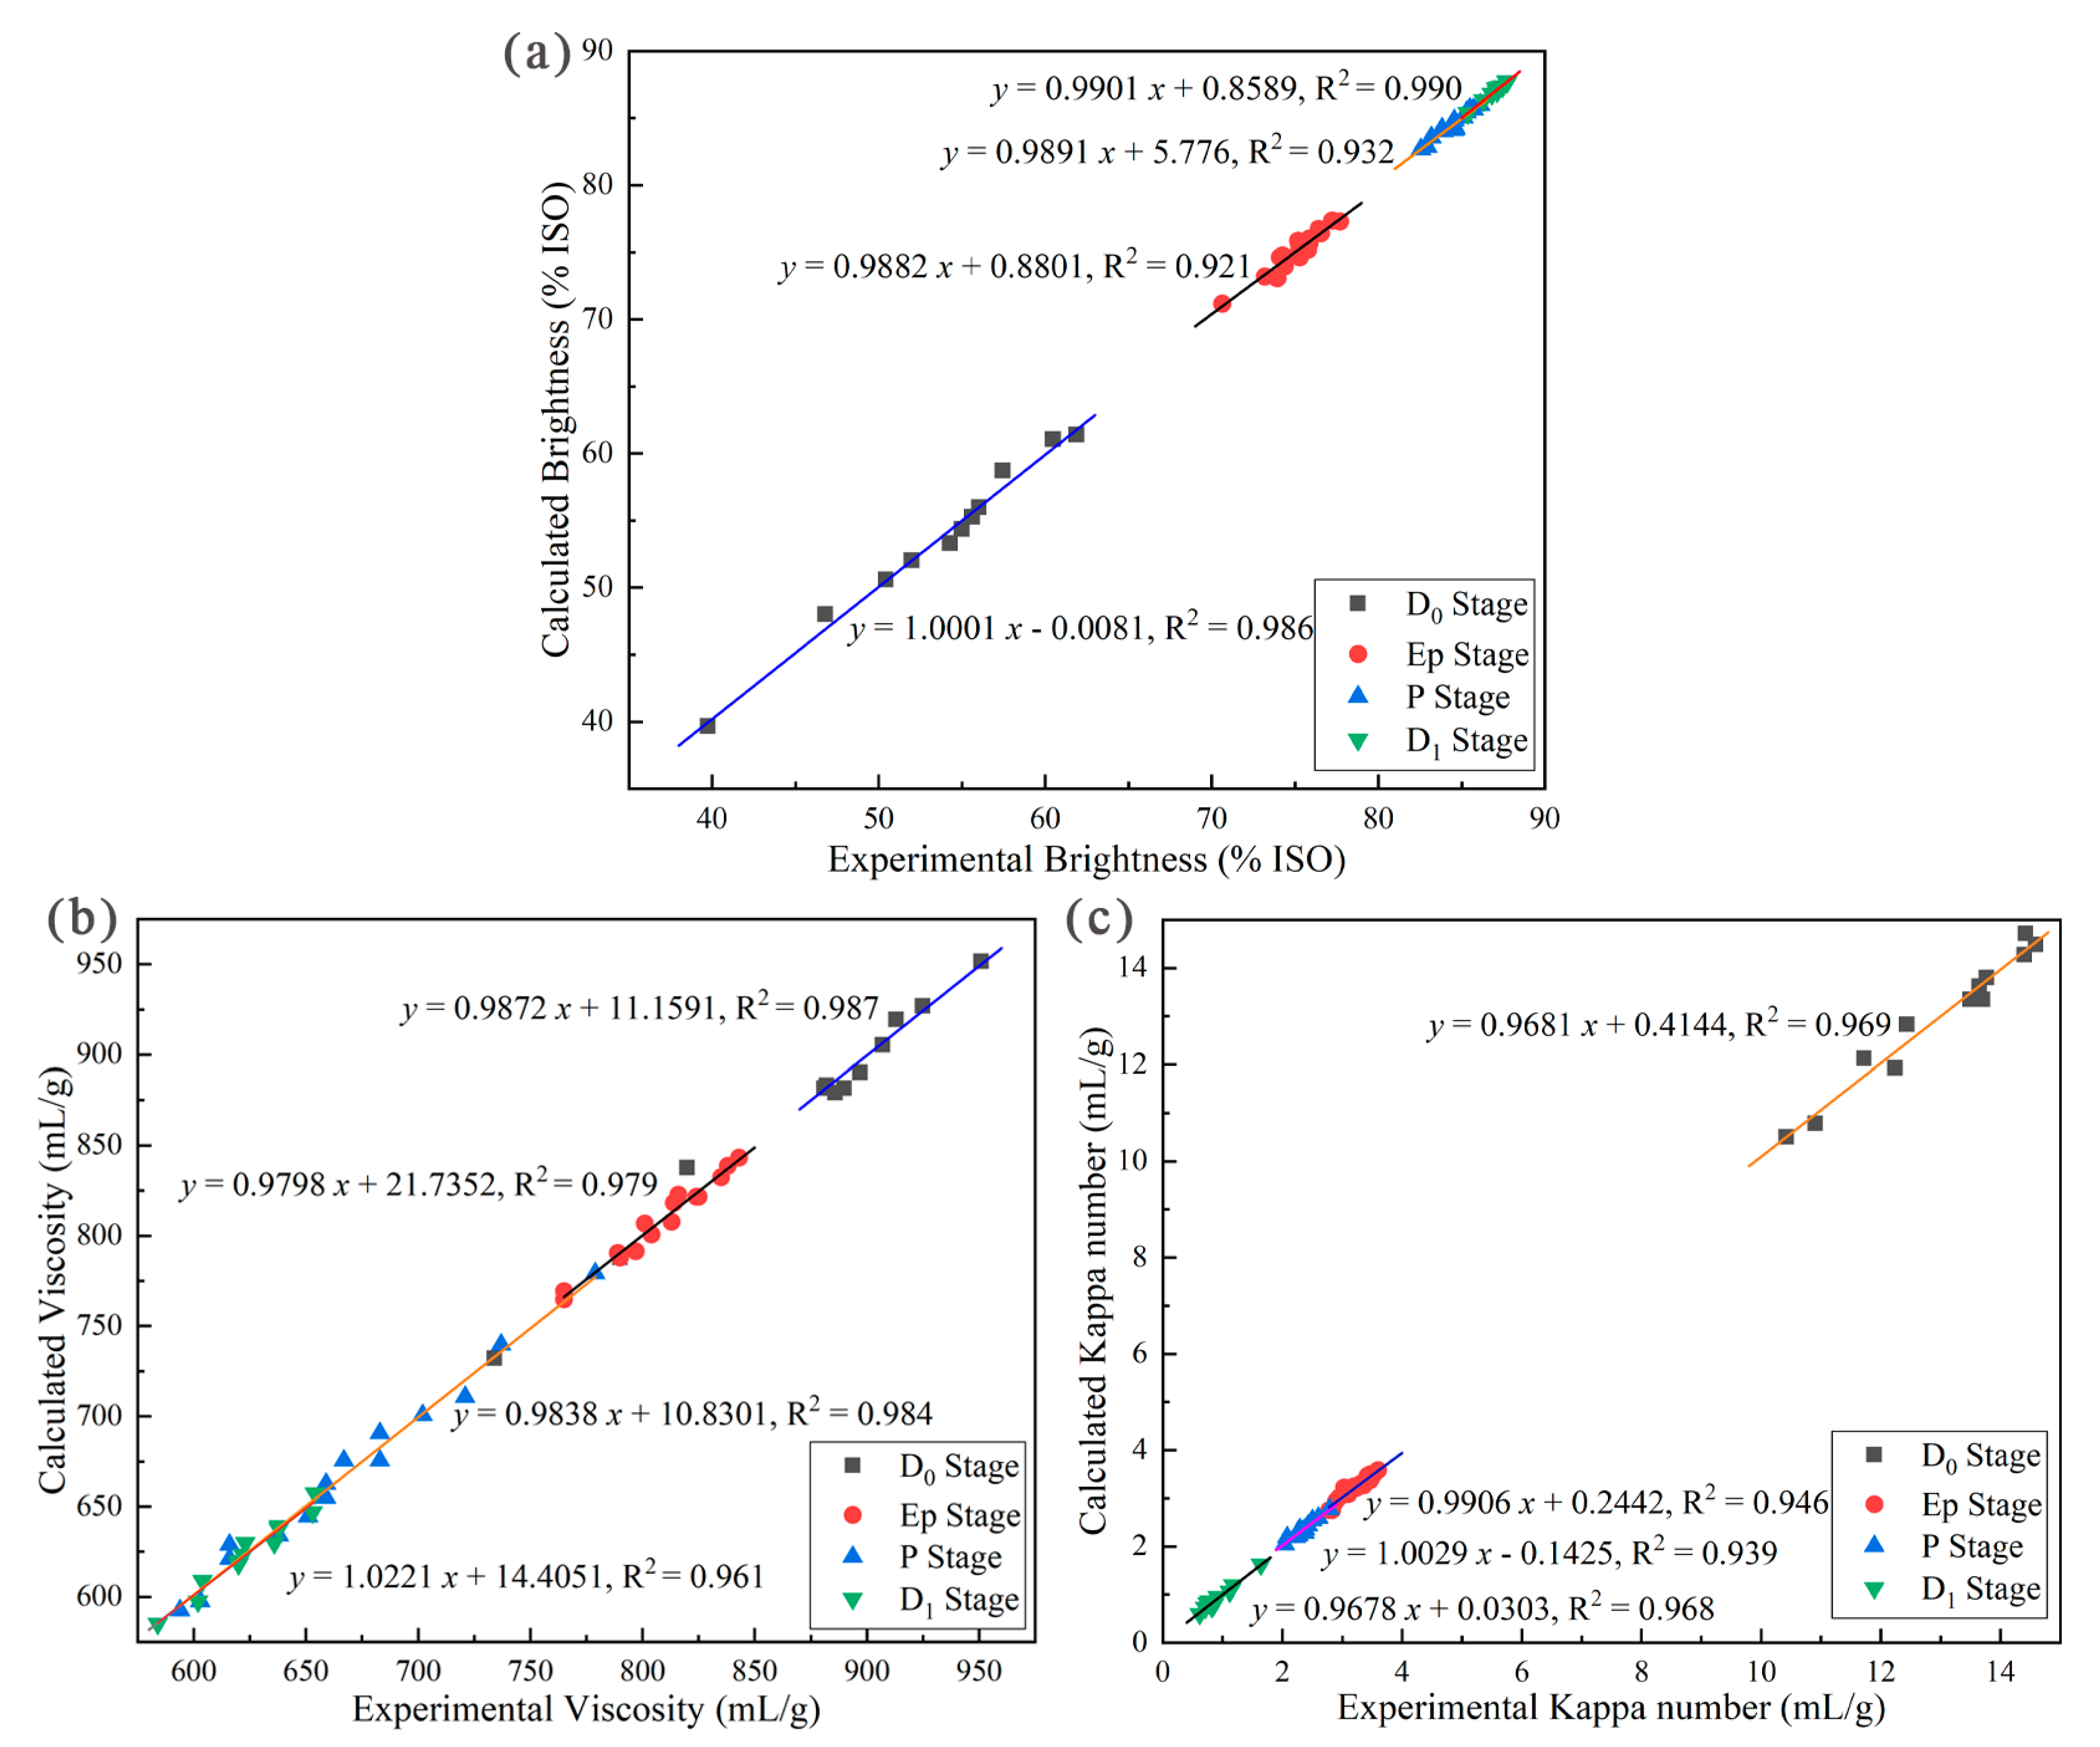
3.1. Calculating Models of Pulp Quality and Construction of Optimization

fb, fv and fk in Equations (4)–(6) were obtained based on a certain amount of experimental data through the fitting analysis of experimental data, as shown in Table 3. Based on the obtained initial value of pulp brightness, the amount of bleaching chemicals and the bleaching temperature of each stage. Combining equations in Equations (4)–(6) can calculate the quality indices of the bleached pulp.
In order to verify the accuracy of the model, experimentally determined values of brightness, viscosity and Kappa number were compared to predicted brightness under the same conditions, as shown in Figure 3.
Figure 3 shows the relationship between the calculated and experimental value of the pulp quality of each bleaching stage. The figures show the linear fitting of the pulp quality of each bleaching stage. The results show that the slope of linear fitting is close to 1, and the R2 of the fitted straight lines are all greater than 0.92, which indicates that the relative error between the calculated and experimental value of pulp quality is small, which also indicates that the calculation model of pulp quality shown in Table 3 can simulate the experimental results well.
By combining Equations (1)–(3) and Table 3, we can get the mathematical models of the pulp quality indicators (brightness, viscosity and Kappa number) after four stages of bleaching. Using these mathematical models of pulp quality, we determined some of the constraints of the optimal model of the bleaching system.

3.2. Comparison before and after Optimization

The ultimate objective of this study is to minimize steam consumption, the requirements of pulp quality (brightness, viscosity and Kappa number) should be met at the same time. This optimization results were obtained using the “fmincon” of MATLAB. The detail operating conditions are presented in Table 4.
Table 4 shows that the pulp quality indices after optimization (brightness 87.78% ISO) and viscosity (638 mL/g) met the constraints. Steam consumption from each stage decreased as shown in Table 4. These are summarized below:
D0 stage: 0.0714 t/adt when the dosage of ClO2 increased from 2.7% to 3.2%, bleaching temperature reduced by 5 °C.
Ep stage: 0.0712 t/adt by increasing the dosage of H2O2 and NaOH increased and reducing the bleaching temperature.
P stage: 0.1389 t/adt was reduced by reducing the dosage of hydrogen peroxide, bleaching temperature and the dosage of NaOH increased from 1.5% to 1.84%;
D1 stage: 0.2199 t/adt by reducing the dosage of ClO2 and the bleaching temperature.
The steam consumption, chemical cost and bleaching cost of each section are calculated according to Equations (4)–(9) and the operating conditions in Table 4, and the results are shown in Table 5.
From Table 5, we can see that the bleaching cost of pulp before and after optimization changed from 196.35 to 193.16 USD/adt, and the bleaching cost was reduced by 1.62%. In this case, the steam consumption during bleaching changed from 2.5731 to 2.0717 t/adt, which decreased by 19.48%. The optimized results showed that the steam consumption of each stage decreased in varying degrees, but the bleaching cost of pulp increased in the D0 and Ep stage. Combined with Table 4 and Table 5, it was found that the amount of chlorine dioxide in the D0 stage increased from 2.7% to 3.2%, while the cost of chemicals increased by 11.28 USD/adt, and the bleaching temperature decreased to reduce steam consumption, resulting in a decrease in steam consumption and an increase in bleaching cost. After optimization, the amount of H2O2 and NaOH in Ep stage increased to improve the quality of pulp, and the cost of chemicals increased by 5.40 USD/adt. At the same time, in order to reduce steam consumption, the bleaching temperature was reduced, so there was also a phenomenon of reduced steam consumption and increased bleaching cost. In the P and D1 stage, the dosage of chemicals and bleaching temperature decreased, so the steam consumption and bleaching cost in the two stages decreased. The reason why these two stages of pulp quality can be maintained is that in the bleaching process of the first two stages, the quality of pulp is improved compared with that before optimization, and the operation conditions of the latter two stages are not so intense, which can also ensure the quality of pulp to meet the requirements.
Table 4 and Table 5 show that the optimized operating conditions significantly increase the amount of chemicals to ensure the quality of pulp without increasing the bleaching cost, and reduce the bleaching temperature as much as possible to reduce steam consumption. Even if the cost of bleaching in the first two stages increases, the cost of bleaching can be reduced by regulating the operating conditions in the latter two stages.

3.3. Verification of Experimental Results

In order to confirm the practicability and accuracy of the optimization model, a series of verification experiments were carried out based on the optimized operating conditions given in Table 4. The experimental and calculated values of the system optimization were shown in Table 6.
It can be seen from Table 6 that the calculated and experimental values of pulp brightness after bleaching are 87.78% ISO and 87.22% ISO, respectively. The calculated and experimental values of pulp brightness were greater than 87% ISO. The calculated and experimental values of pulp viscosity after bleaching were 581 mL/g and 605 mL/g, respectively, and the calculated and experimental values of pulp viscosity were greater than 560 mL/g. Compared with Table 2 and Table 6, it can be found that the brightness and viscosity of the optimized pulp were in line with the constraints of the optimization model. Additionally, the previous calculation also shows that the optimization scheme could not only reduce the steam consumption of bleaching, but also reduce the cost of bleaching. The optimization scheme shown in this article provides a new idea for us to optimize the bleaching process.

4. Conclusions

In this paper, the optimization model of four-stage ECF bleaching to reduce steam consumption was established, and the bleaching cost and steam consumption were reduced on the premise of ensuring the quality of pulp. The following conclusions were drawn:
(1)
An accurate mathematical model for the quality of four-stage ECF bleaching process was developed that enables optimization of the bleach plant to reduce steam by 19.48% at a loss of 0.11% brightness and 5.17% viscosity.
(2)
Increasing the amount of chemicals to ensure the quality of the pulp and reducing the bleaching temperature to reduce steam consumption and the cost of bleaching pulp has decreased by 1.62% (3.19 USD/adt) after optimization.
As can be seen from the presented analysis results of optimization model, pulp quality indices, bleaching cost and steam consumption can be predicted, simultaneously. These calculation models can be the basis for the following multiobjective optimization of pulp quality, environmental impacts and bleaching cost in the bleaching process. It can also provide a theoretical basis for the intelligent manufacturing of the bleaching process in the future. However, due to the lack of on-line sensors and some parameters can only be obtained by off-line experiments, a small number of experiments will affect the fitting accuracy of the models and affect the prediction results ultimately. As the developments of online sensors, processing technology of big data and industrial internet technology, a lot of data can be collected online, more accurate prediction results can be obtained and the bleaching process will become more intelligent.

Author Contributions

S.C.: Methodology, investigation, formal analysis, writing—original draft. Z.M.: Resources, investigation, data curation. J.L.: Investigation, data curation, validation. J.Y.: Investigation, resources. Y.Y.: Conceptualization, writing—review and editing, supervision. L.Z.: Investigation, resources. All authors have read and agreed to the published version of the manuscript.

Funding

This work was supported the Natural Science Foundation of Guangxi Province (grant number 2018JJA160015, 2020JJA160061) and the Opening Project of National Enterprise Technology Center of Guangxi Bossco Environmental Protection Technology Co., Ltd (Nanning, China) which grant number is GXU-BFY-2020-031.

Institutional Review Board Statement

Not applicable.

Informed Consent Statement

Not applicable.

Data Availability Statement

Not applicable.

Conflicts of Interest

The authors declare no conflict of interest.

References

  1. Foresstat, F. Forest Products Production, Import and Export Statistics [EB/OL]. Available online: http://www.fao.org/forestry/statistics/80938/zn/ (accessed on 22 May 2021).
  2. Kong, L.; Zhao, J.; Li, J.; Lou, R.; Zhang, Y. Evaluating energy efficiency improvement of pulp and paper production: Case study from factory level. J. Clean. Prod. 2020, 277, 124018. [Google Scholar] [CrossRef]
  3. Fracaro, G.; Vakkilainen, E.; Hamaguchi, M.; De Souza, S.N.M. Energy Efficiency in the Brazilian Pulp and Paper Industry. Energies 2012, 5, 3550–3572. [Google Scholar] [CrossRef]
  4. Fleiter, T.; Fehrenbach, D.; Worrell, E.; Eichhammer, W. Energy efficiency in the German pulp and paper industry—A model-based assessment of saving potentials. Energy 2012, 40, 84–99. [Google Scholar] [CrossRef]
  5. Hart, P.W. The chemical versus energy cost tug of war: A pulp mill perspective. Tappi J. 2011, 10, 37–42. [Google Scholar] [CrossRef]
  6. Gong, Z.-X.; Stanovský, J.; Mujumdar, A.S. Energy Audit of a Fiberboard Drying Production Line Using Simprosys Software. Dry. Technol. 2011, 29, 408–418. [Google Scholar] [CrossRef]
  7. Afshar, P.; Brown, M.; Austin, P.; Wang, H.; Breikin, T.; Maciejowski, J. Sequential modelling of thermal energy: New potential for energy optimisation in papermaking. Appl. Energy 2012, 89, 97–105. [Google Scholar] [CrossRef]
  8. Klugman, S.; Karlsson, M.; Moshfegh, B. A Scandinavian chemical wood pulp mill. Part 1. Energy audit aiming at efficiency measures. Appl. Energy 2007, 84, 326–339. [Google Scholar] [CrossRef]
  9. Kong, L.; Price, L.; Hasanbeigi, A.; Liu, H.; Li, J. Potential for reducing paper mill energy use and carbon dioxide emissions through plant-wide energy audits: A case study in China. Appl. Energy 2013, 102, 1334–1342. [Google Scholar] [CrossRef] [Green Version]
  10. Costa, A.; Bakhtiari, B.; Schuster, S.; Paris, J. Integration of absorption heat pumps in a Kraft pulp process for enhanced energy efficiency. Energy 2009, 34, 254–260. [Google Scholar] [CrossRef]
  11. Akterian, S. Improving the energy efficiency of traditional multi-stage steam-jet-ejector vacuum systems for deodorizing edible oils. Procedia Food Sci. 2011, 1, 1785–1791. [Google Scholar] [CrossRef] [Green Version]
  12. Goortani, B.M.; Mateos-Espejel, E.; Paris, J. Integration of a cogeneration unit into a kraft pulping process. Appl. Therm. Eng. 2010, 30, 2724–2729. [Google Scholar] [CrossRef]
  13. Inamdar, U.Y.; Pervez, N.; Navik, R.G.; Peng, X.; Cai, Y. Low-temperature bleaching of cotton fabric by activated peroxide system. Emerg. Mater. Res. 2017, 6, 387–395. [Google Scholar] [CrossRef]
  14. Liu, P.; Yang, G.; Chen, J.; Zhang, K. Improving properties of poplar apmp by modified pulping process. In Proceedings of the 16th International Symposium on Wood, Fibre and Pulping Chemistry, Tianjin, China, 8–10 June 2011; pp. 549–552. [Google Scholar]
  15. Skals, P.B.; Krabek, A.; Nielsen, P.H.; Wenzel, H. Environmental assessment of enzyme assisted processing in pulp and paper industry. Int. J. Life Cycle Assess. 2007, 13, 124–132. [Google Scholar] [CrossRef]
  16. Kermani, M.; Périn-Levasseur, Z.; Benali, M.; Savulescu, L.; Maréchal, F. An Improved Linear Programming Approach for Simultaneous Optimization of Water and Energy. Comput. Aided Chem. Eng. 2014, 33, 1561–1566. [Google Scholar]
  17. Bengwei, C. The Experience of Brazilian Pulp Mills in Reducing Chemical Use and Production Costs. Pap. Biomater. 2009, 12, 10. [Google Scholar]
  18. Ji, X.; Lundgren, J.; Wang, C.; Dahl, J.; Grip, C. Process Simulation and Energy Optimization for the Pulp and Paper Mill. In Proceedings of the 13th International Conference on Process Integration, Modelling and Optimisation for Energy Saving and Pollution Reduction, Prague, Czech Republic, 28 August–1 September 2010; pp. 283–288. [Google Scholar] [CrossRef]
  19. Chew, I.M.L.; Foo, D.C.Y.; Bonhivers, J.-C.; Stuart, P.; Alva-Argaez, A.; Savulescu, L.E. A model-based approach for simultaneous water and energy reduction in a pulp and paper mill. Appl. Therm. Eng. 2013, 51, 393–400. [Google Scholar] [CrossRef]
  20. Ma, Z.; Zhong, P.; Li, J.; Yin, Y. Soft Sensor Model of Adsorbable Organic Halogen Based on Bleached Pulp Quality Indices. Bioresources 2020, 15, 62–77. [Google Scholar] [CrossRef]
  21. Ma, Z.; Chen, S.; Yin, Y.; Lu, X.; Zhou, Y.; Lin, T. Prediction models of pulp components based on the quality indices in bleaching process. Environ. Dev. Sustain. 2021, 23, 4043–4060. [Google Scholar] [CrossRef]
  22. De Assis, T.; Perrin, J.; Jameel, H.; Phillips, R.; Lachenal, D.; Kirkman, A.; Gonzalez, R. Techno-economic analysis of ECF bleaching and TCF bleaching for a bleached eucalyptus kraft pulp mill. TAPPI J. 2017, 16, 583–595. [Google Scholar] [CrossRef]
  23. Anttila, A.-K.; Pirttilä, A.M.; Häggman, H.; Harju, A.; Venäläinen, M.; Haapala, A.; Holmbom, B.; Julkunen-Tiitto, R. Condensed conifer tannins as antifungal agents in liquid culture. Holzforschung 2013, 67, 825–832. [Google Scholar] [CrossRef]
  24. Shi, L.; Ge, J.; Nie, S.; Qin, C.; Yao, S. Effect of lignin structure on adsorbable organic halogens formation in chlorine dioxide bleaching. R. Soc. Open Sci. 2019, 6, 182024. [Google Scholar] [CrossRef] [PubMed]
  25. Liu, W.; Zhou, S.; Qi, X.; Pu, J. Preparation of acetate-grade dissolving pulp from eucalyptus by processes including alkaline pretreatment and combined post-treatments with xylanase and alkali. TAPPI J. 2013, 12, 19–24. [Google Scholar] [CrossRef]
  26. Camargo, S.K.D.C.A.; Ventorim, G.; Camargo, B.S.; de Carvalho, A.C.K.; de Lima, S.L.R.; de Almeida, F.A.P. Ultraviolet Resonance Raman Spectroscopy Analysis of Carbonyl Groups Present after Different Bleaching Stages for Various Bleach Sequences. Bioresources 2019, 14, 1915–1927. [Google Scholar] [CrossRef]
  27. Senior, D.J.; Hamilton, J.; Froass, P.M.; Ragauskas, A.J.; Sealey, J.E. Interaction of hydrogen peroxide and chlorine dioxide stages in ECF bleaching. TAPPI J. 1998, 81, 170–178. [Google Scholar]
  28. Yin, Y.; Song, X.; Li, C.; Nie, S. A Method for Integrated Optimization of Chlorine Dioxide Delignification of Bagasse Pulp. Bioresources 2017, 13, 1065–1074. [Google Scholar] [CrossRef]
  29. Brogdon, B.N. Optimization of elemental chlorine-free bleaching for a softwood kraft pulp part 2: Economic analysis of chemical and steam consumption. TAPPI J. 2010, 9, 47–53. [Google Scholar] [CrossRef]
  30. Zhan, H. Pulping Principle and Engineering; China Light Industry Press: Beijing, China, 2009. [Google Scholar]
Figure 1. Schematic diagram of a typical bleaching system (D0EpPD1).
Processes 09 00928 g001
Figure 2. Bleaching process block diagram of pulp quality.
Processes 09 00928 g002
Figure 3. The relationship between the calculated and experimental value of brightness (a), viscosity (b) and Kappa number (c).
Processes 09 00928 g003
Table 1. The test methods of pulp quality.
Items of TestingProcedure
Pulp brightnessTAPPI T 525 om-92, Diffuse brightness of paper, paperboard and pulp (d/0)-ultraviolet level C
ViscosityTAPPI T 230 om-94, Viscosity of pulp (capillary viscometer method)
Kappa numberTAPPI T 236 cm-85, Kappa number of pulp
Table 2. Main model parameters and variables determined from analysis.
Parameters or CoefficientsUnitValueRef.
Ctot,setUSD/t196.35Calculated a
yb,set% ISO87practice
yv,setmL/g560practice
Fmin,ClO2%0.5practice
Fmax,ClO2%5.5practice
Fmin,NaOH%2practice
Fmax,NaOH%5practice
Fmin,H2O2%1practice
Fmax,H2O2%2.5practice
Tmin,i°C50practice
Tmax,i°C95practice
ClO2USD/t2289.31market price b
H2O2USD/t221.30market price c
NaOHUSD/t351.03market price d
SteamUSD/t30.52market price e
a Calculated based on the specific experimental conditions in practice as follows: D0 stage: Chlorine dioxide charge 2.7%, bleaching temperature 60 °C; Ep stage: Hydrogen peroxide charge 0.5%, bleaching temperature 60 °C, sodium hydroxide charge 1.55%; P Stage: hydrogen peroxide charge 2.5%, bleaching temperature 90 °C, sodium hydroxide charge 1.5%; D1 stage: chlorine dioxide charge 1.2%, bleaching temperature 75 °C. b Prices are fixed based on a Chinese chemical website, Content: 99%. c Content: 35%. d Content: 99%. e 0.5 MPa, 200 °C.
Table 3. Calculating equation of pulp quality after bleaching.
IndicesBleaching StageCoefficient TermsValueBleaching StageCoefficient TermsValueBleaching StageCoefficient TermsValueBleaching StageCoefficient TermsValue
Brightness
Equation (1)
D0FClO2,D02−1.0035EpFH2O2,Ep20.1004PFH2O2,P2−0.0167D1FClO2,D130.6363
FClO2,D010.7731FH2O2,Ep−0.0556FH2O2,P0.7260FClO2,D12−4.0951
TD02−9.23 × 10⁻⁴TEp2−0.0017TP2−2.7 × 10⁻⁴FClO2,D18.1039
TD00.2095TEp−0.3394TP0.0425TD13−1.42 × 10⁻⁵
Constant−12.0261FNaOH,Ep2−0.1992FNaOH,P2−0.2644TD120.0021
FNaOH,Ep1.8507FNaOH,P2.0625TD1−0.0298
Constant2.3820Constant3.9807Constant−5.5561
Viscosity
Equation (2)
D0FClO2,D022.9615EpFH2O2,Ep22.9116PFH2O2,P22.6843D1FClO2,D121.4707
FClO2,D024.9307FH2O2,Ep−7.0139FH2O2,P4.5250FClO2,D115.8511
TD02−0.0317TEp2−9.15 × 10⁻⁴TP20.0310TD126.67 × 10−3
TD04.3676TEp1.1752TP−1.7520TD11.7185
Constant−31.1279FNaOH,Ep28.3159FNaOH,P22.6150Constant−28.3679
FNaOH,Ep−0.3813FNaOH,P2.4339
Constant−20.5277Constant17.1899
Kappa number
Equation (3)
D0FClO2,D030.0311EpFH2O2,Ep20.0137PFH2O2,P30.0269D1FClO2,D130.3853
FClO2,D02−0.1024FH2O2,Ep0.0419FH2O2,P2−0.2723FClO2,D12−2.5246
FClO2,D0−1.2345TEp2−1.29 × 10⁻⁴FH2O2,P0.8097FClO2,D15.2546
TD03−2.39 × 10⁻⁵TEp0.0234TP39.23 × 10−6TD12−9.57 × 10⁻⁵
TD025.5 × 10−3FNaOH,Ep20.1156TP2−2.03 × 10⁻³TD10.0227
TD0−0.4399FNaOH,Ep−0.1168TP0.1518Constant−2.9081
Constant21.2392Constant1.3073FNaOH,P34.78 × 10−3
FNaOH,P2−0.0831
FNaOH,P0.2417
Constant−3.6030
Table 4. Operating condition comparison before and after optimization.
Bleaching StageParameterBefore OptimizationAfter Optimization
D0Chlorine dioxide dosage (%)2.73.2
Bleaching temperature (°C)6055
Brightness (% ISO)55.556.27
Viscosity (mL/g)885863
Steam consumption (t/adt)0.47680.4054
EpHydrogen peroxide dosage (%)0.50.73
Bleaching temperature (°C)6055
Sodium hydroxide dosage (%)1.552.78
Brightness (% ISO)74.475.89
Viscosity (mL/g)824762
Steam consumption (t/adt)0.47580.4046
PHydrogen peroxide dosage (%)2.52
Bleaching temperature (°C)9081.1
Sodium hydroxide dosage (%)1.51.84
Brightness (% ISO)84.3985.82
Viscosity (mL/g)714651
Steam consumption (t/adt)0.92670.7878
D1Chlorine dioxide dosage (%)1.21.09
Bleaching temperature (°C)7560
Brightness (% ISO)87.3287.78
Viscosity (mL/g)638581
Steam consumption (t/adt)0.69380.4739
Table 5. Comparison results before and after optimization.
Bleaching StageParameterBefore OptimizationAfter Optimization
D0Steam consumption (t/adt)0.47680.4054
Chemical cost (USD/adt)60.9172.19
Bleaching cost (USD/adt)76.5685.50
EpSteam consumption (t/adt)0.47580.4046
Chemical cost (USD/adt)8.2813.68
Bleaching cost (USD/adt)23.6126.88
PSteam consumption (t/adt)0.92670.7878
Chemical cost (USD/adt)19.8017.96
Bleaching cost (USD/adt)49.1242.90
D1Steam consumption (t/adt)0.69380.4739
Chemical cost (USD/adt)25.4823.14
Bleaching cost (USD/adt)47.0437.88
Table 6. Experimental and calculated values based on results of optimization.
Bleaching StageParameterCalculated ValueExperimental Value
D0Brightness (% ISO)56.2757.62
Viscosity (mL/g)863868
EpBrightness (% ISO)75.8975.45
Viscosity (mL/g)762793
PBrightness (% ISO)85.8284.75
Viscosity (mL/g)651701
D1Brightness (% ISO)87.7887.22
Viscosity (mL/g)581605
Publisher’s Note: MDPI stays neutral with regard to jurisdictional claims in published maps and institutional affiliations.

