Article

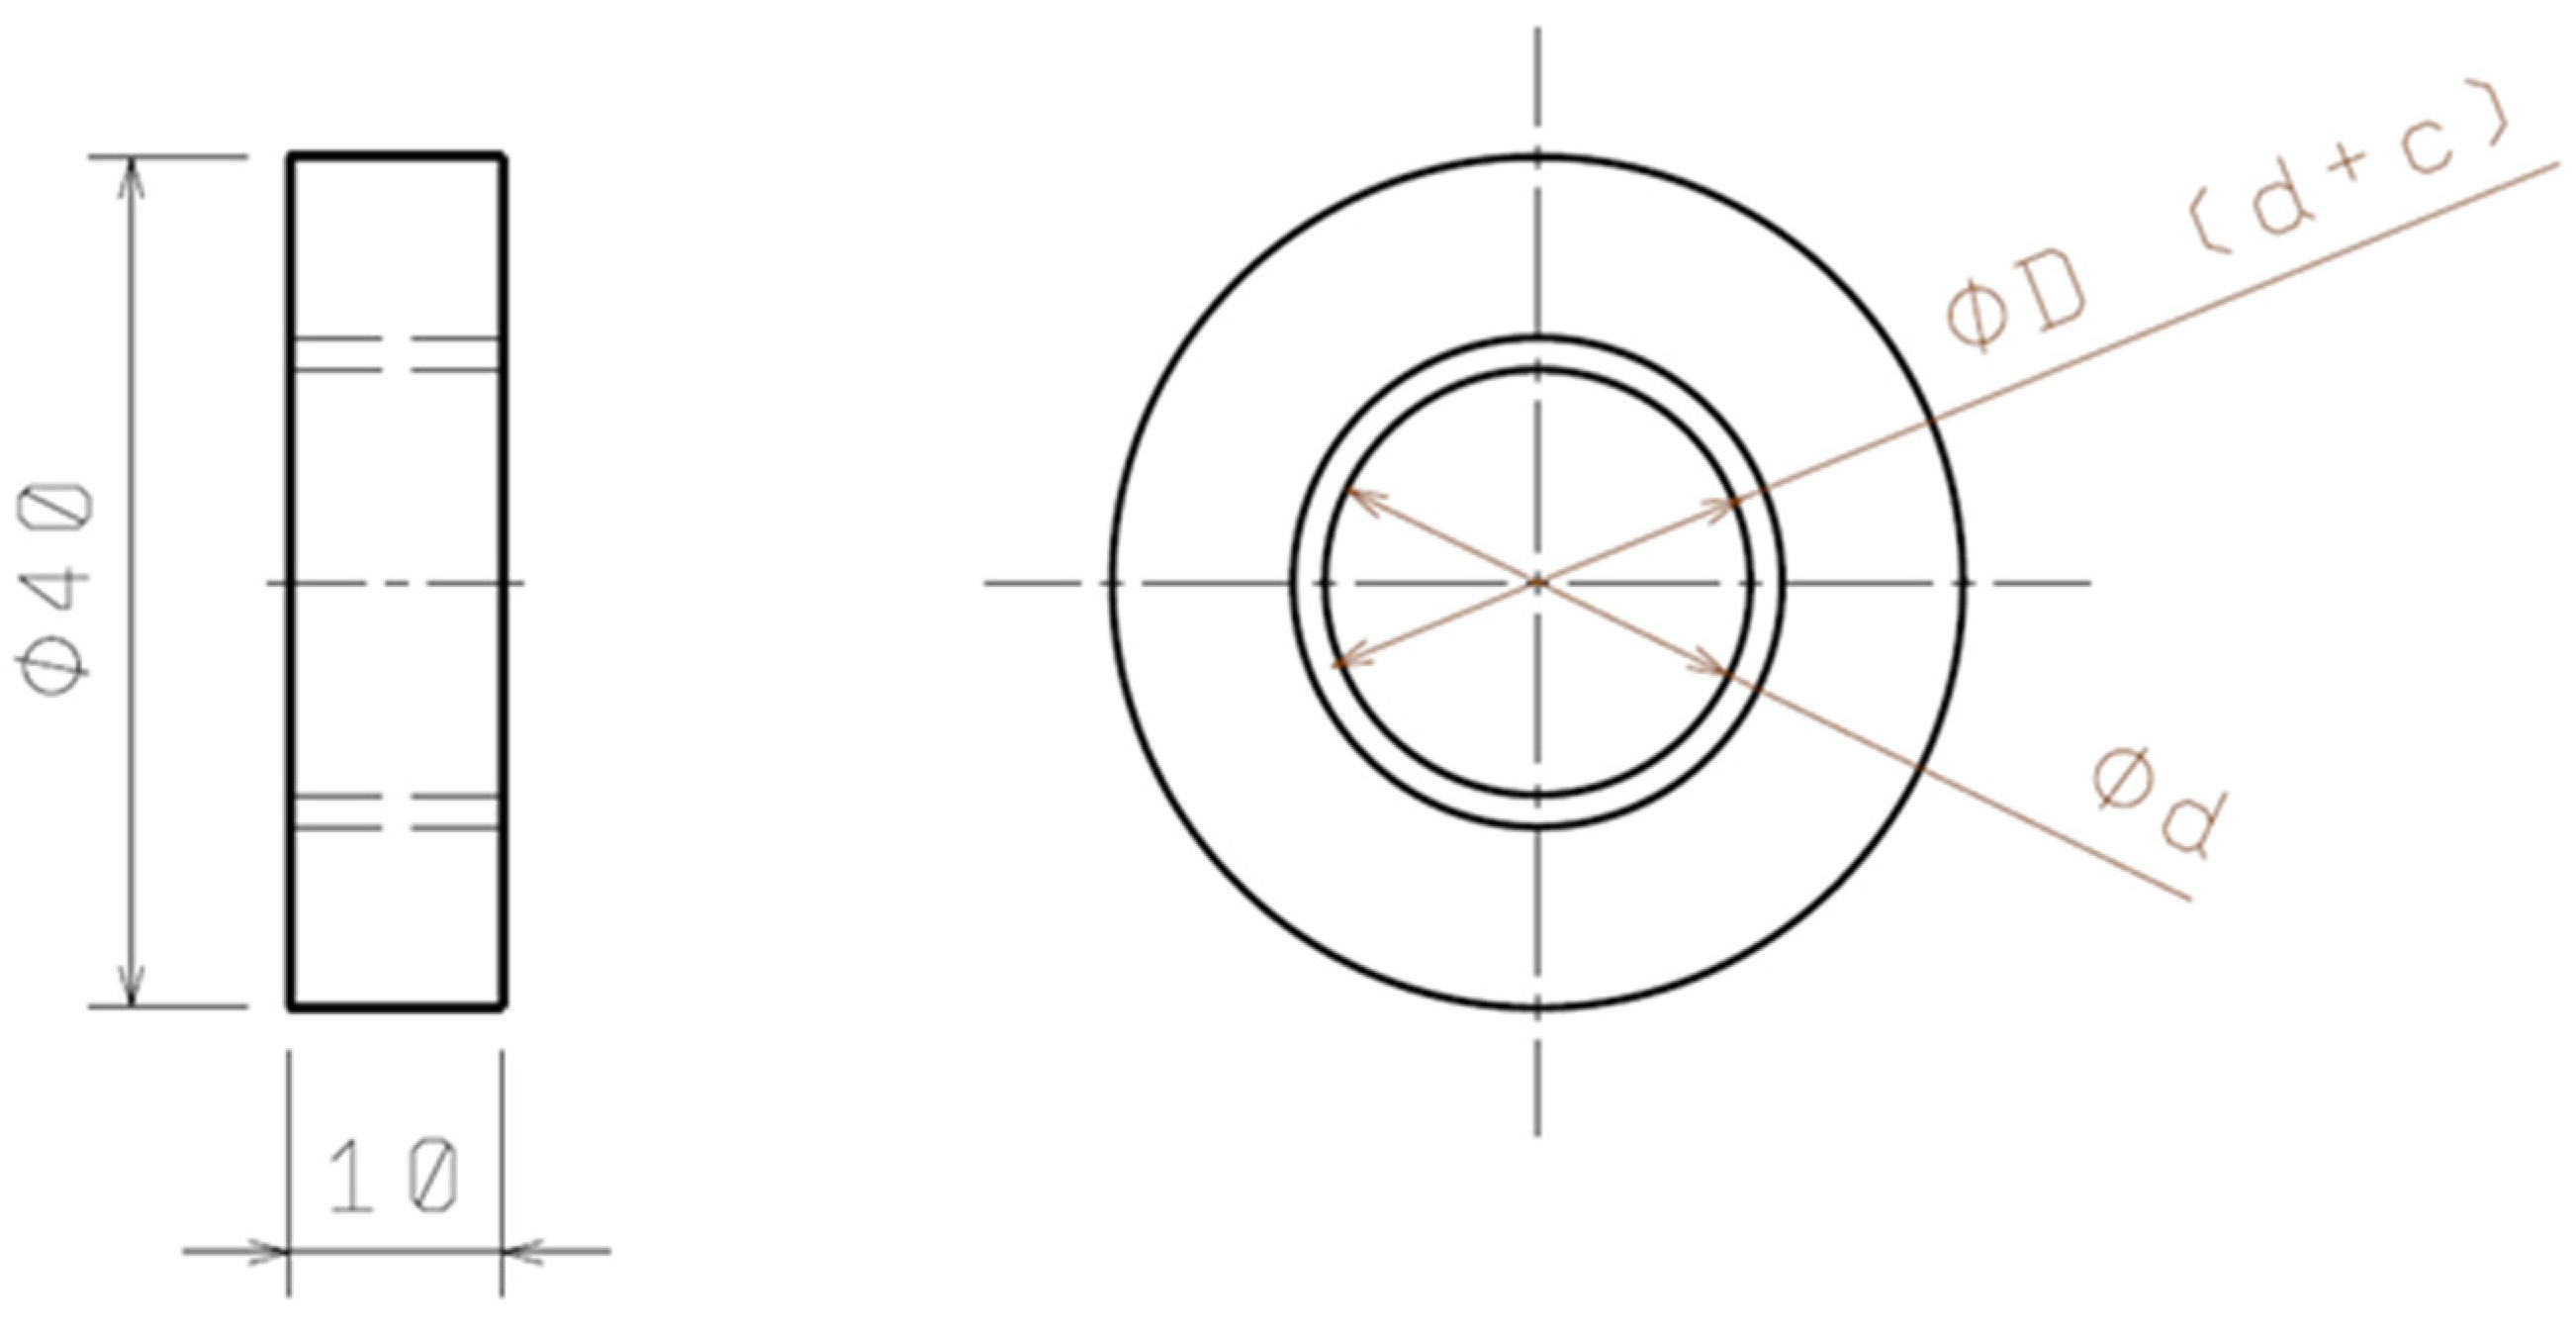
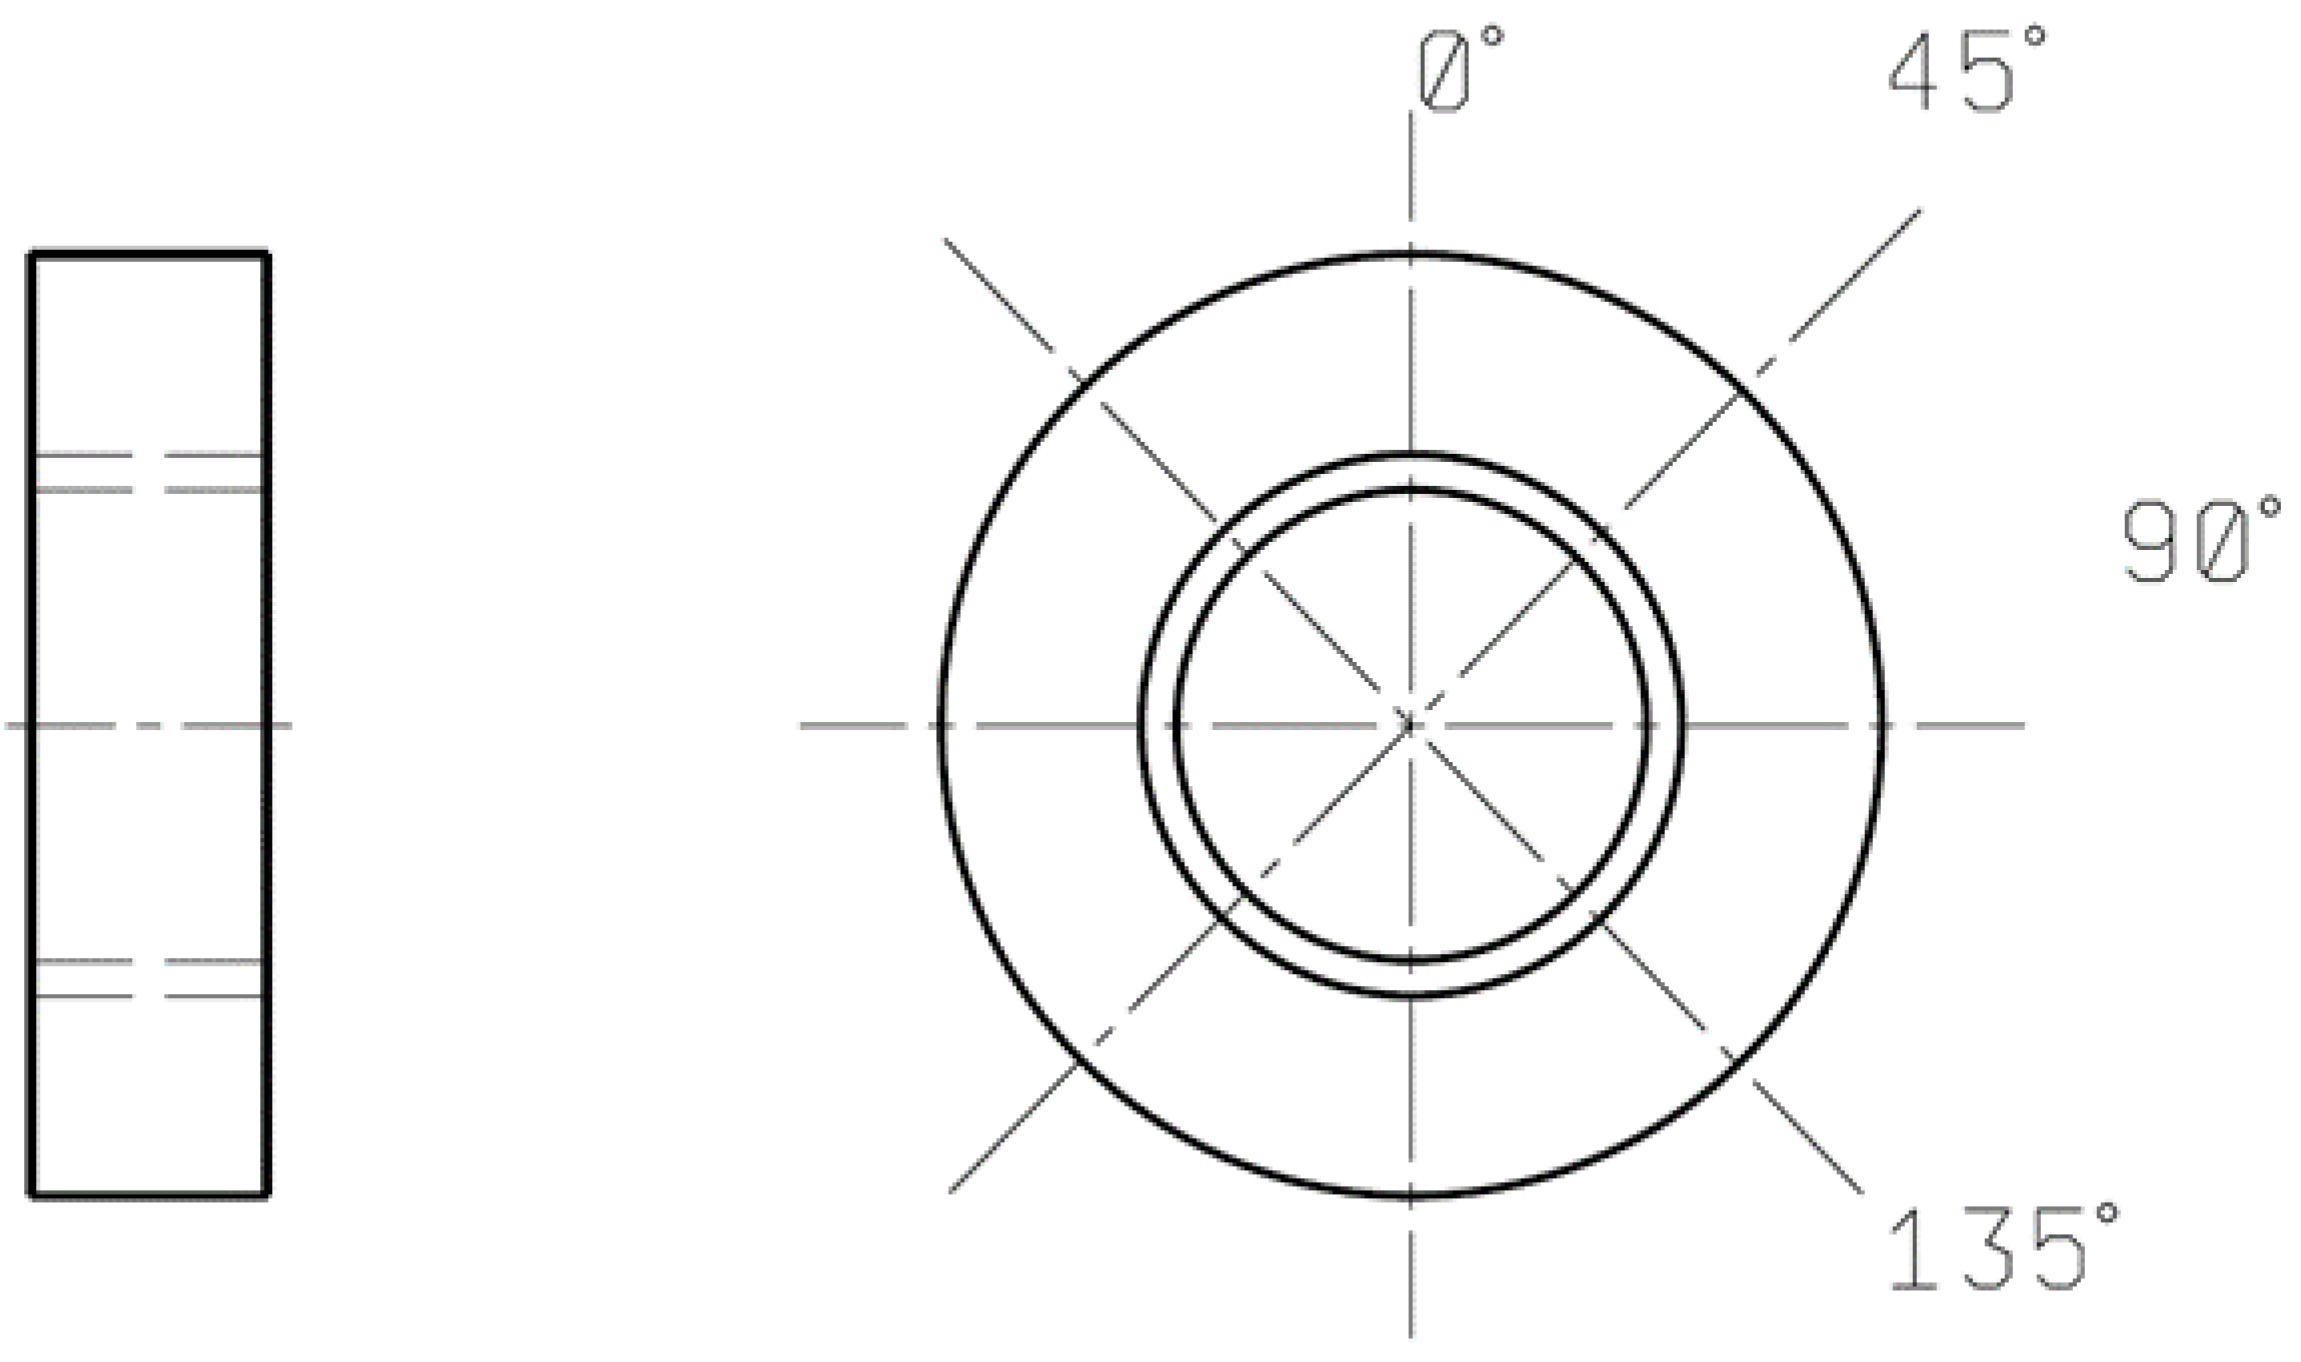
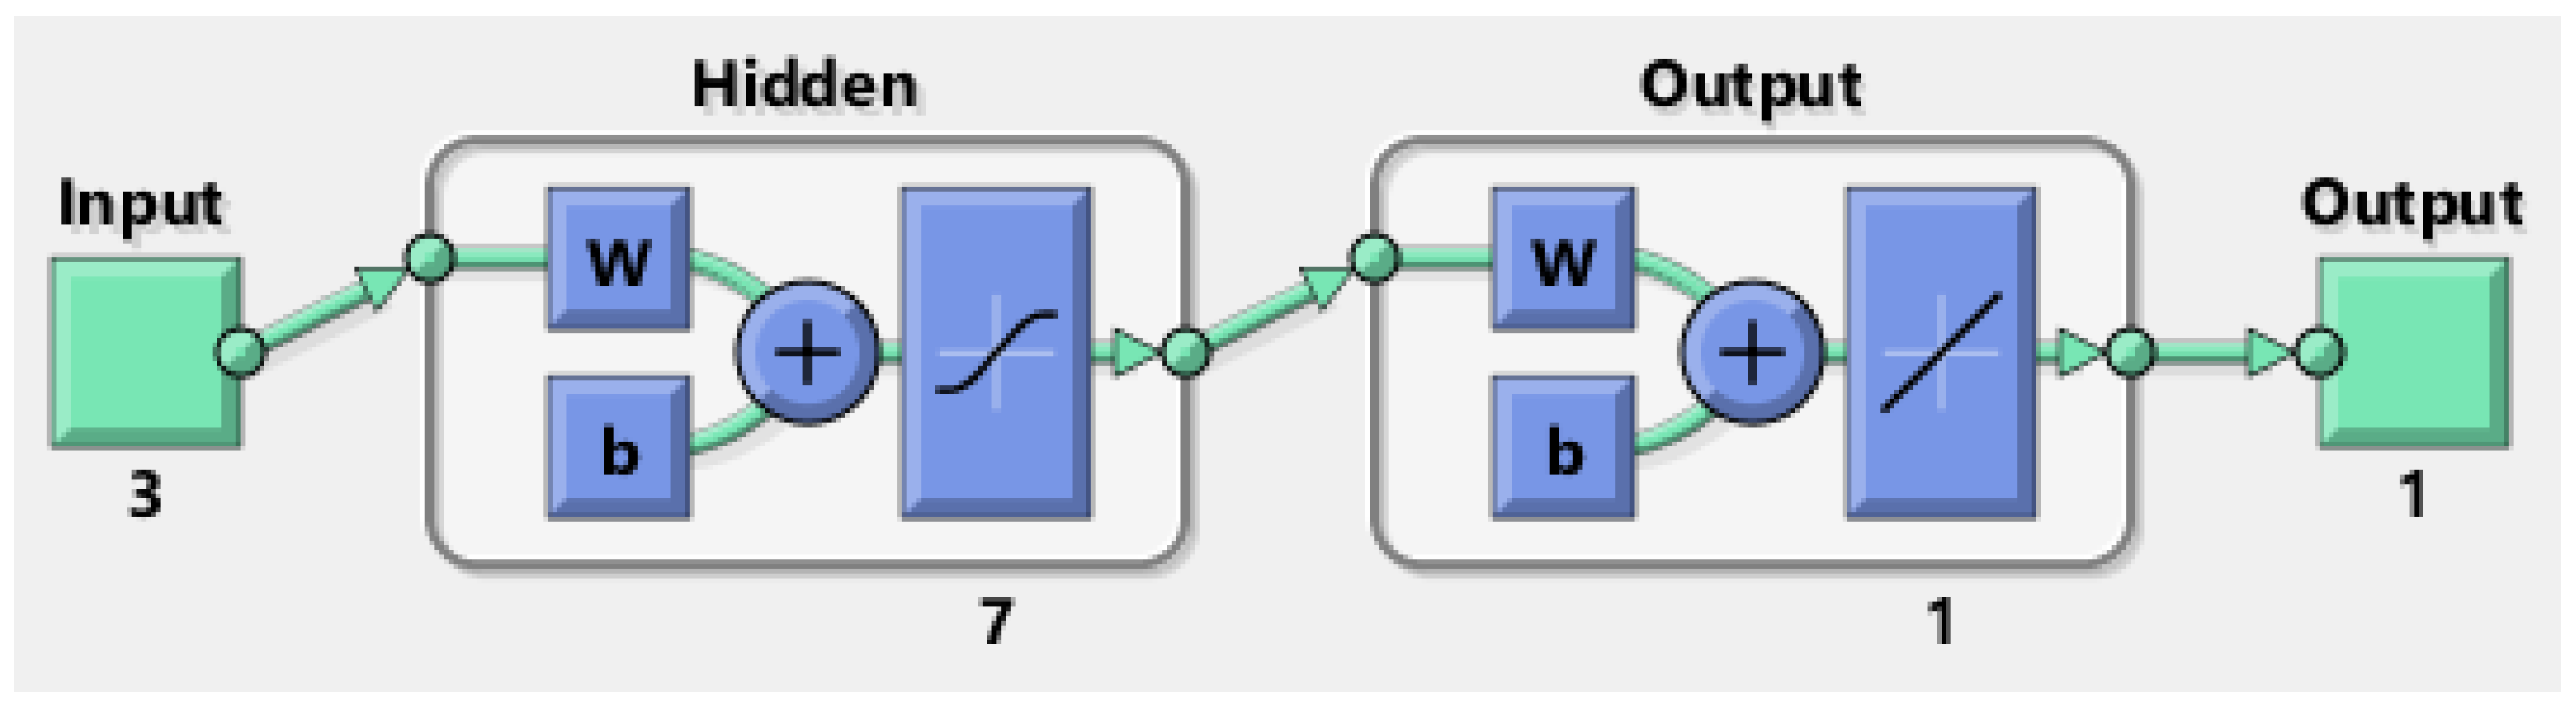
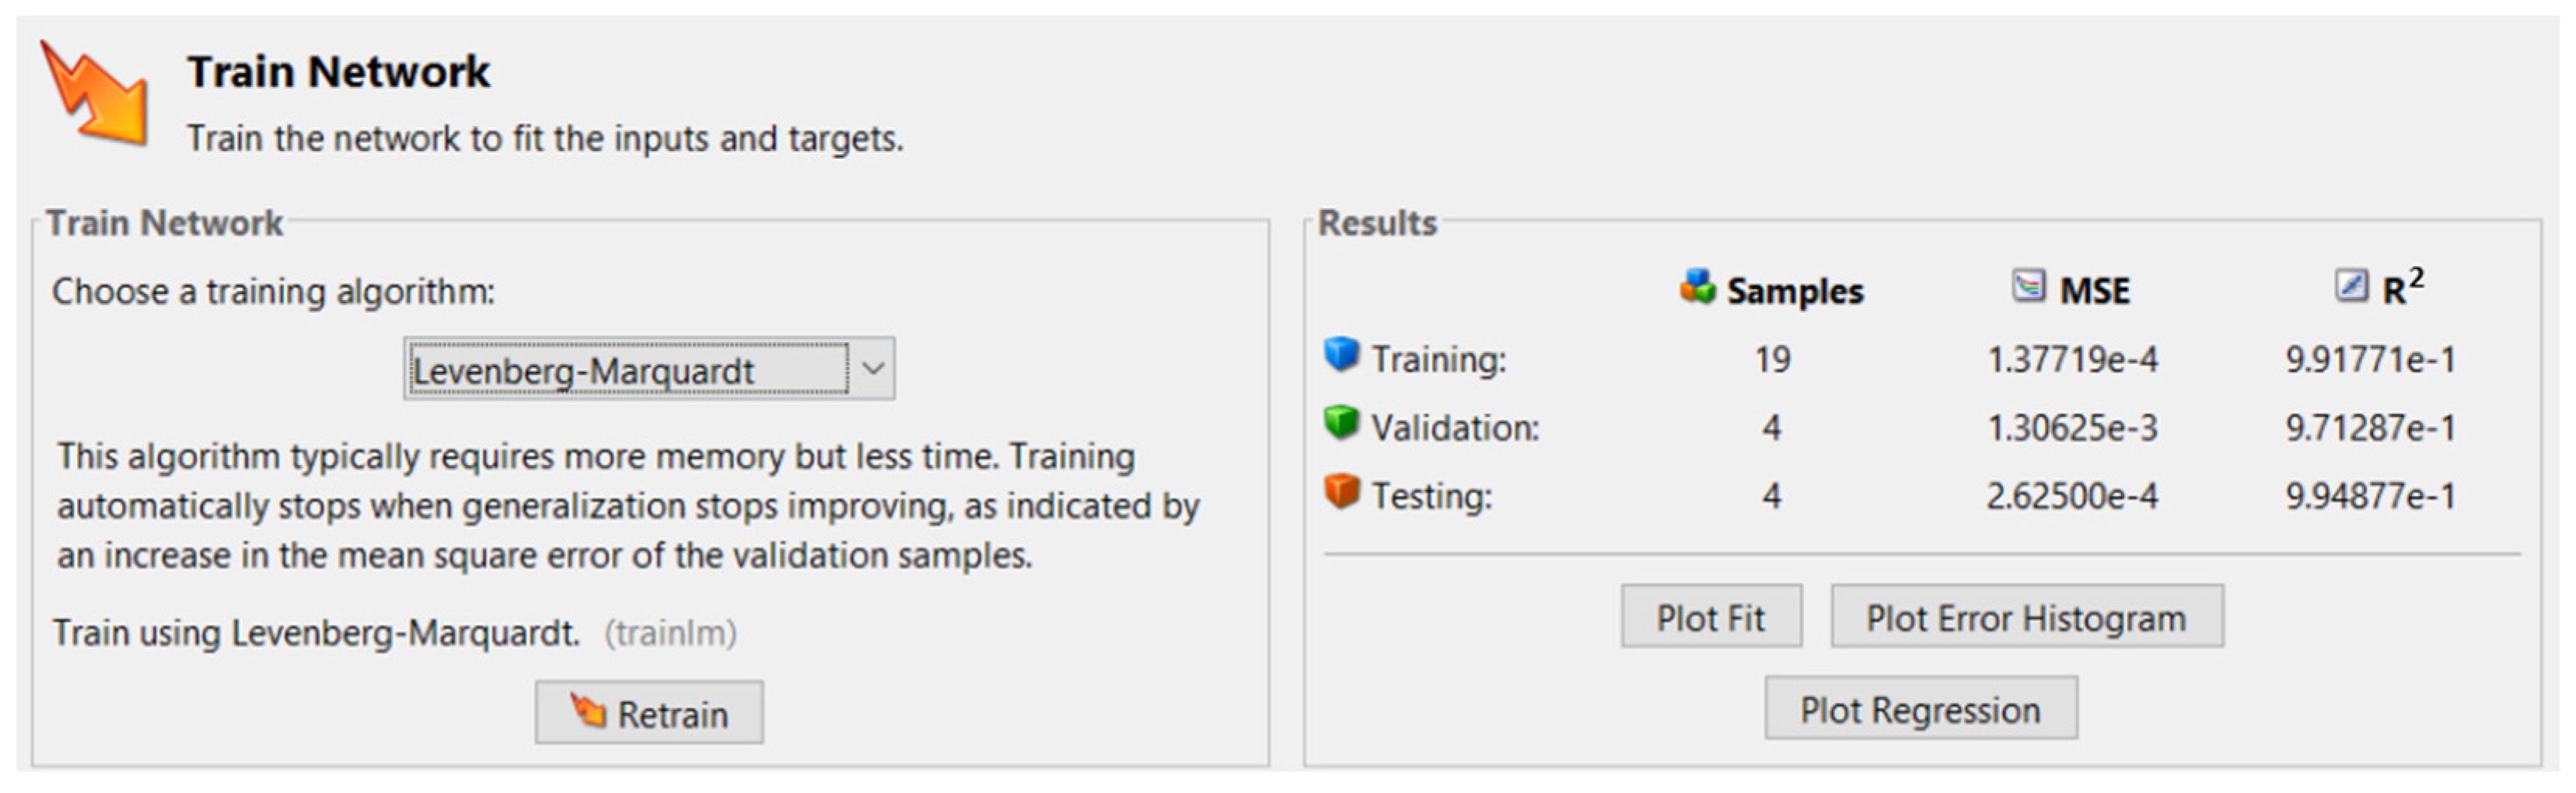
A New Approach to Optimize the Relative Clearance for Cylindrical Joints Manufactured by FDM 3D Printing Using a Hybrid Genetic Algorithm Artificial Neural Network and Rational Function

Department of Manufacturing and Industrial Management, University of Piteşti, 1 Târgul din Vale Street, 110040 Pitesti, Romania
*
Author to whom correspondence should be addressed.
Processes 2021, 9(6), 925; https://doi.org/10.3390/pr9060925
Submission received: 23 April 2021 / Revised: 11 May 2021 / Accepted: 22 May 2021 / Published: 25 May 2021

Abstract

:
Nowadays, FDM technology permits obtaining functional prototypes or even end parts. The process parameters, such as layer thickness, building orientation, fill density, type of support, etc., have great influence on the quality, functionality and behavior of the obtained parts during their lifetime. In this paper, we present a study concerning the possibilities of obtaining certain values for clearance in revolute joints of non-assembly mechanisms manufactured by FDM 3D Printing. To ensure the functioning of the assembly, one must know the relationship between the imposed and measured clearances by taking into account the significant input data. One way is to use the automat learning method with an artificial neuronal network (ANN). The data necessary for the training, testing, and validation of ANN were experimentally obtained, using a complete L 27 Taguchi experimental plan. A total of 27 samples were printed with different values of the following parameters: the infill density, the imposed clearance between the shaft and the hole, and the layer thickness. ANN architecture corresponds to the Hecht–Kolmogorov theorem. Genetic algorithms (GA) were used for the optimization of the output. The Neural Network Toolbox from MATLAB was used for training the network and a hybrid tool genetic algorithm artificial neural network (GA-ANN) was used to minimize the value of the absolute relative clearance (arc). The minimum value of the absolute relative clearance established by GA-ANN was 0.0385788. This value was validated experimentally, with a relative difference of 4%. We also introduced a rational function to approximate the correlation between the input and output parameters. This function fulfills some frontier conditions resulted from practice. In addition, the function may be used to establish the designed clearance in order to obtain an imposed one.

1. Introduction

The technology of rapid prototyping has rapidly evolved and has found use in many industries, such as the automotive industry, aerospace, electronics, and medicine, to create prototype products and complex mechanisms [1,2]. Parts with shapes that are difficult or even impossible to be manufactured by conventional technologies are easily obtained by 3D printing. However, rapid prototyping technologies do not represent a general solution for any product-manufacturing problem. Aside from its advantages as a safe and simple technology, including the freedom in design, wide range of materials, affordable price, and ease of use, FDM also has some disadvantages, such as poor accuracy for small parts and fine details when the parts are manufactured as an assembly. In the case of 3D printing non-assembly mechanisms, the process parameters and assembly clearances must be chosen accordingly [3,4,5]. It is currently possible to create a wide range of mechanisms using additive manufacturing (AM), ranging from the traditional types of multi-part mechanisms to non-assembly mechanisms [5]. There are some disadvantages of non-assembly mechanisms. In designing the traditional mechanism, the choice in material and the production process may be optimized for each part, as they are all separately manufactured. For non-assembly mechanisms, all parts are manufactured, using the same process and often using the same material. Usually, one or more post-processing steps are required, such as removing the backing material or polishing the surfaces. In particular, removing the backing can be a long, time-consuming process.
Non-assembly mechanisms must be functional. This has led to the shift from design to fabrication and assembly to design for additive manufacturing (DFAM) [6,7,8,9,10,11,12]. In this case, the main objective of the design activity is no longer to ensure the assembly of the mechanisms but to ensure the functionality of non-assembly mechanisms. Research in the field of DFAM has focused mostly on the design of the shape of the parts, which has led to the obtaining of some topologically optimized models. However, as fully functional assemblies requiring few or no assembly operations can be manufactured through AM, DFAM methodologies are needed to address the design of the assembly [6,7].
The tolerance and clearance analysis can predict the effects of part deviations on the assembly characteristics [13,14,15]. It has been shown that the clearance and materials play a key role in the design of non-assembly mechanisms. Ensuring the functionality of the product depends on the choice of clearance between the elements of the assembly. The clearance depends on the required joint performance and print resolution, i.e., it must be small enough to ensure the performance of the joint (avoiding instability, vibration etc.) but large enough to prevent the welding of components during the manufacturing process [6,16,17,18].
Depending on the geometries of the parts, the values of the clearances necessary for the functionality of the non-assembly mechanism are different. The recommended values are as follows: 0.2 mm using an Object Eden 350 V machine [18], 0.2 mm and 0.05 mm (with additional changes in the shape of the assembly) by using FDM [19], and 0.4 mm by using a Stratasys F370 machine [3].
New methodologies have been developed to ensure the functionality of the non-assembly mechanisms through a statistical analysis of tolerance by considering geometric deviations and clearance [1,3,6,20,21]. The methodology presented in [1] was applied on an eight-bar non-assembly mechanism. The clearance of the kinematic joints was set at a value equal to 0.4 mm. The validation of the methodology was performed by applying it to an eight-bar planar mechanism. Another developed methodology allows non-assembly mechanisms to be arranged automatically, minimizing the support material quantity and printing time. The integration of CAD software allows automatic optimization by taking into account a pre-selected machine. The method was applied to a 3RRR planar mechanism and it turned out that optimizing the orientation of individual moving parts could significantly reduce printing time and support material quantity [21]. In [20] is presented a novel methodology for the statistical tolerance analysis of non-assembly mechanism motion with consideration of joint clearance.
The methodology proposed in [6] aims to design products the components of which are at their minimum dimensions; the methodology consists of three main steps:
-
Functional analysis, which is designed to describe the functionality of the product and to understand both the relationships between the product and its environment, as well as the relationships between components;
-
Detailing the control structures of the components;
-
Designing the geometries of the parts.
The accuracy of the parts influences the functionality of the assembly [22]. There are currently no recommendations regarding the accuracy of individual parts or non-assembly mechanisms obtained by FDM because it is strongly influenced by the machine used for the manufacturing process; moreover, there are only predictive empirical models obtained under certain conditions. Thus, tolerances may be established considering the process parameters. These empirical models automatically learn the relationship between input and output quantities based on a previously collected training dataset, usually experimentally [23,24,25,26,27,28,29].
The neural networks must be trained with known experimental data. The experimental data used for the training of the networks must be representative. During the training phase, sufficient knowledge must be transferred to the neural network in order to estimate the output data so that they can also be used in those cases in which the artificial neural network has not been directly trained. There is no single way in which one can determine how much data are needed to train a neural network. In the literature are presented some approaches that consider the training of the artificial neural network, using experimental plans (factorial or otherwise) [30,31].
The configuration of a neural network can take a long time, the trial–error method having to be used to find the artificial neural network for a given problem [32].
The chosen input parameters must be significant. Preliminary experiments are performed for this purpose. Thus, to identify the relationship between the input and output data, preliminary studies are performed, through which the samples printed by FDM are measured to establish the dimensional accuracy. Subsequently, the results are evaluated in order to analyze their influence on the geometric accuracy of FDM printed parts.
Frequently, the chosen input parameters are layer thickness, raster angle, air gap, raster width, build orientation, number of contours, contour width, and printing speed [26].
It is difficult to adjust the parameters of the AM process because they may exert a major influence on the printed parts and the performance of subsequent products. It is also very difficult to establish a relationship between the input and output parameters by using traditional numerical and analytical models. Currently, the method of machine learning using neural networks is a valid way to perform complex model recognition and regression analysis, without the need to build and solve mathematical models. The neural network is the most widely used model due to the large dataset currently available, strong computing power, and sophisticated algorithm architecture [33,34].
Significant process parameters (layer thickness, building orientation, fill density, and the number of contours) are optimized in order to increase the dimensional accuracy of the parts obtained by (FDM). Hybrid statistical tools, such as the response surface method (RSM), artificial neural network (ANN), and artificial neural network genetic algorithm (ANN-GA) in MATLAB, are used for training and optimization. Mathematical models have been established, which allow the establishment of an indirect correlation between different FDM process parameters and dimensional accuracies. The developed models were experimentally validated [24,25].
In this paper, empirical predictive models are presented, using an artificial neural network and genetic algorithm for determining the clearance joint of non-assembly mechanisms manufactured by FDM based on the chosen process parameters and the clearance initially imposed. Subsequently, this information can be used to know the value of the clearance that must be imposed in order to obtain the required clearance.
A novel approach presented in this paper consists in the application of a hybrid tool genetic algorithm artificial neural network (GA-ANN) to minimize the value of the absolute relative clearance of a joint of a non-assembly mechanism obtained on an M200 Zortrax 3D printer.
Another approach presented in this paper is using a rational function depending on certain parameters and which has the properties that it asymptotically tends to the imposed clearance when the last one is enough large, vanishes for small values of imposed clearance, and has a null slope at a critical value at which the obtained clearance start to increase from the zero value.

2. Materials and Methods

The study on the influence of design and process parameters on the quality of the assembly of pieces manufactured by FDM 3D Printing was conducted with the aid of non-assembly parts.
The samples for the tests were designed using Catia V5 software and were realized by the FDM 3D printer Zortrax M200, using Z-ABS material. The shape and dimensions of the sample are presented in Figure 1.
The experimentation methodology was designed to achieve the influence of input parameters on the measured clearance that was calculated from the difference in the dimensions of the pieces realized by 3D printing.
In order to realize pieces by FDM, the following values were used: for the parameter infill density, three values, namely, 60% (low density), 80% (high density), and 100% (solid); and for the layer thickness, the values between 0.14 and 0.29 mm (also three values). In the case of the second input parameter, the Catia V5R19 software was used to design a cylindrical non-assembly fit with a nominal size of 20   mm . To obtain different values for the clearance, the diameter of the incorporated piece (shaft type) was kept constant at a value of 20 mm, and the diameter of the incorporating piece (hole type) was varied, being designed at a value equal to 20 mm plus the value of the imposed clearance. By design, the pieces were positioned in such a way that during their manufacturing process, the imposed clearance was uniformly distributed in any direction. A variation of the imposed clearance between 0.8 and 2.0 mm was desired; hence, the dimensions of the samples are those shown in Table 1.
Each input parameter (infill density, imposed clearance, and layer thickness) was varied over three levels, and their values are shown in Table 2.
The experimental plan used in this paper was the Taguchi type 33 one, so 27 experiments were conducted.
After the 3D-printing process, each sample was measured in several directions corresponding to the angles equal to 0°, 45°, 90°, and 135°, the measurements were repeated several times and the results were averaged, as shown in Figure 2. Each sample was measured using a Zeiss Contura G3 coordinate measuring machine (with an accuracy of 1 μm) and CALIPSO software. Because the accuracy of 0.1 mm was used for the imposed clearance, it was considered that the accuracy for the measured clearance is equal to 0.01 mm.
A genetic algorithm (GA) is used to evaluate a given objective function, using a random population within a specified range for the input parameters.
Based on the data presented in Table 3, an ANN was trained, using the input and output data sets as follows: an input matrix (27 × 3) and an output vector (27 × 1). The Neural Network Toolbox of MATLAB was used.
A multilayer perceptron (MLP) based on feed-forward ANN was used to construct the predictive model. The network consists of an input layer, a hidden layer, and an output layer. The inputs for ANN were the infill density, imposed clearance between the shaft and the hole, and layer thickness.
The output is the absolute relative clearance (arc) defined as a ratio presented in Equation (1).
arc = | real   clearance clearance clearance | ,
The connections between inputs, hidden layer, and output were transposed into weights (w) and biases (b), which are considered parameters of the artificial neural network.
The sigmoid tangent function was chosen for the activation of the ANN, and the type of the network was feedforward backpropagation. For the training of the ANN, 70% of the datasets were selected; 15% datasets were used for testing and another 15% for validation.
A value toward zero of the correlation coefficient indicates that there is no relationship between the inputs and outputs, and a value very close to 1 indicates a very good correlation.
The already trained network was used as an objective function by GA, which seeks to minimize the objective function.
The intervals for the three input parameters were [0.6; 0.8; 0.14] and [1; 2; 0.29].
The architecture of the network used in this study consisted of the following: three input neurons, corresponding to the input parameters; one output neuron, corresponding to the output parameter; and seven neurons on the hidden layer, empirically chosen, shown in Figure 3.
Using the “Levenberg–Marquardt” backpropagation algorithm, the ANN was trained. The training process is an iterative one. For this study, 7 iterations were performed for the training of the network.
At the end of the training process, in the window “Train Network” the values for R2 and the MSE (mean square error) are displayed, shown in Figure 4.

3. Mathematical Modeling

The mathematical modeling of the clearance as a function of the imposed clearance (further on denoted by x), layer thickness (further on denoted by y), and infill density (further on denoted by z) requires the selection of a candidate function that depends on three variables.
Usually, this function is selected as a polynomial one, a higher degree of the polynomial implying a higher precision. The coefficients of the selected polynomial are obtained by using the least squares method. The significant problems with such a polynomial function are at least the following: (i) the values of this function may be negative in some intervals; (ii) the function does not linearly tend to infinite when the imposed clearance tends to infinite; (iii) the clearance starts to grow from zero when the imposed clearance increases over a limit; and (iv) the slope of clearance has to be zero at that critical value when the clearance starts to have non-zero values. Practically, when the imposed clearance is sufficiently great, the resulted clearance is approximately equal to the first one. Moreover, if the imposed clearance is small enough, the obtained clearance is equal to zero. Considering these remarks, it results that the candidate function must not be a polynomial in the variable x .
As candidate function, we choose the following simple one:
f ( x , y , z ) = ( x x 0 ) 2 x + b × ( a 22 y 2 z 2 + a 21 y 2 z + a 20 y 2 + a 12 y z 2 + a 11 y z + a 10 y + a 02 z 2 + a 01 z + a 00 )   ,
where x 0 is the minimum value of the imposed clearance under which the obtained clearance is zero, while b , a 22 , a 21 , a 20 , a 12 , a 11 , a 10 , a 02 , a 01 , a 00 are the parameters which must be determined. The expression of the function f ( x , y , z ) given by Equation (2) is valid if and only if x x 0 ; otherwise, we put f ( x , y , z ) = 0 .
One may observe the following:
lim x f ( x , y , z ) x = a 22 y 2 z 2 + a 21 y 2 z + a 20 y 2 + a 12 y z 2 + a 11 y z + a 10 y + a 02 z 2 + a 01 z + a 00 ,
that is, this limit does not depend on x , and the following is true:
lim x x 0 f ( x , y , z ) = 0 ,
lim x x 0 f ( x , y , z ) x = 0 .
The parameters of the function f ( x , y , z ) will be determined using the least square method. To do that, we define the error function by the following expression:
E = i = 1 n [ f ( x i , y i , z i ) v i ] 2 ,
in which n is the number of experiments, x i , y i and z i are the values used in each experiment, while v i is the real values obtained in the experiment, i = 1 ,   n ¯ .
Let us denote by h 1 ( x ) and h 2 ( y , z ) the following functions:
h 1 ( x ) = ( x x 0 ) 2 ( x + b ) ,
h 2 ( y , z ) = a 22 y 2 z 2 + a 21 y 2 z + a 20 y 2 + a 12 y z 2 + a 11 y z + a 10 y + a 02 z 2 + a 01 z + a 00 ,
which implies f ( x , y , z ) = h 1 ( x ) h 2 ( y , z ) .
One may write the following:
E p = 2 i = 1 n [ f ( x i , y i , z i ) v i ] f ( x i , y i , z i ) p ,
where p is a generic parameter. It results as follows:
E b = 2 i = 1 n [ f ( x i , y i , z i ) v i ] ( x i x 0 ) 2 ( x i + b ) 2 h 2 ( y i , z i ) ,
E a j k = 2 i = 1 n [ f ( x i , y i , z i ) v i ] ( x i x 0 ) 2 x i + b y i j z i k ,
and the system given by the least square method and which must be solved reads as follows:
{ E b = 0 , E a j k = 0 ,
that is a nonlinear system of ten equations with ten unknowns.
We denote by F ( x , y , z ) the vector function given by the following:
F ( x , y , z ) = [ E b E a 22 E a 00 ] T ,
our system becoming F ( x , y , z ) = 0 , while the function F ( x , y , z ) has ten components.
The system is solved using the gradient method for which the vector of the ten unknowns at a certain step p + 1 has the following expression:
x ( p + 1 ) = x ( p ) 2 λ p J T ( x ( p ) ) F ( x ( p ) ) ,
where
2 λ p = F ( x ( p ) ) , J ( x ( p ) ) J T ( x ( p ) ) F ( x ( p ) ) J ( x ( p ) ) J T ( x ( p ) ) F ( x ( p ) ) , J ( x ( p ) ) J T ( x ( p ) ) F ( x ( p ) ) ,
and J is the following Jacobi matrix:
J = [ F 1 b F 1 a 22 F 1 a 00 F 2 b F 2 a 22 F 2 a 00 F 10 b F 10 a 22 F 10 a 00 ] .
Moreover, we have the following:
2 E b 2 = 4 i = 1 n [ f ( x i , y i , z i ) v i ] ( x i x 0 ) 2 ( x i + b ) 3 h 2 ( y i , z i ) + 2 i = 1 n ( x i x 0 ) 4 ( x i + b ) 4 h 2 2 ( y i , z i ) ,
2 E b a j k = 2 E a j k b = 2 i = 1 n ( x i x 0 ) 4 ( x i + b ) 3 y i j z i k h 2 ( y i , z i ) 2 i = 1 n [ f ( x i , y i , z i ) v i ] ( x i x 0 ) 2 ( x i + b ) 2 y i j z i k ,
2 E a j k a l m = 2 E a l m a j k = 2 i = 1 n ( x i x 0 ) 4 ( x i + b ) 2 y i j + l z i k + m .
The iterative process stops when x ( p + 1 ) x ( p ) < ε , with ε = 10 3 , the norm of a matrix A with m lines and n column being given by the following:
A = i = 1 m j = 1 n | a i j | 2 .

4. Results and Discussion

The training process was validated when a value of overall R2 (0.985) was obtained. Figure 5 presents the values of R2 of training, testing, validation, and the value of the overall R2.
The iterative process was stopped when the validated MSE started to increase as shown in the mean square error plotted in Figure 6. The best obtained validation performance was 0.0013063 at epoch 7.
The values of the specific GA parameters were the following: population size = 10, crossover fraction, crossover probability = 0.8, uniform mutation, mutation probability = 0.01. After 52 iterations, the optimized conditions were obtained, shown in Figure 7. The value for absolute relative clearance (arc) was 0.0385788 for the following values of the input parameters: 0.737 for the infill density, 1.674 for the imposed clearance, and the value of 0.209 for the layer thickness as shown in Table 4.
In order to verify and validate the results obtained by GA, a new sample was realized with the following parameters (which can be chosen on the 3D printer, with values close to the optimal ones): 0.7 for the infill density, 1.7 for the imposed clearance and the value of 0.19 for the layer thickness. In this situation, the measured value for absolute relative clearance (arcM) was 0.041 for an estimated value for absolute relative clearance (arcE) with rained network equal to 0.0394. The relative difference between arcM and arcE, arc M arc E arc M 100 , was about 4%.
Using the expression (Equation (2)) for the function f , one gets the following values presented in Table 5.

5. Conclusions

This paper presents the influence of design parameters on the geometrical parameter, that is, the absolute relative clearance in the revolute joints of the non-assembly mechanisms manufactured by FDM 3D Printing.
The methods used in this paper are the method of automat learning with the aid of the artificial neural network and the construction of a simple rational function, which links the following input parameters: imposed clearance, layer thickness, and infill density to the output parameter (absolute relative clearance):
  • Using the hybrid tool GA-ANN, the minimum value for absolute relative clearance (arc) was 0.0385788, obtained for the following values of the input parameters: 0.737 for the infill density, 1.674 for the imposed clearance, and 0.209 for the layer thickness. This value was validated experimentally with a relative difference of 4%.
  • Using the rational function, one obtains the following best values: 0.725 mm for the clearance, 0.28 for the layer thickness, and 0.9 for the infill density when x 0 = 0 , the imposed clearance being equal to 0.8 mm; for x 0 = 0.3 the best choice is defined by 1.860 mm for the clearance, 0.28 for the layer thickness and 0.9 for the infill density, the imposed clearance being equal to 2.0 mm.
  • The rational function may also offer the values of the input parameter when a certain clearance is required. For instance, if one requires a clearance equal to 1.1 mm, assuming that x 0 = 0 , then one may select the following values: 1.6 mm for the imposed clearance, 0.15 for the layer thickness, and 0.6 for the infill density, the obtained clearance being equal to 1.101 mm.
  • Similarly, for x 0 = 0.3 and a required clearance equal to 1.6 mm, the selected values are as follows: 1.8 mm for the imposed clearance, 0.28 for the layer thickness, and 0.8 for the infill density, while the obtained clearance reads 1.591 mm.
Using the artificial intelligence tools, ANN and the GA-ANN hybrid instrument, it was possible to train an artificial neural network able to establish the absolute relative clearance values for different values of the input parameters, being useful in designing of the revolute joints of the non-assembly mechanisms manufactured by FDM 3D Printing, from Z-ABS.

Author Contributions

D.-C.A., D.M.I. and A.D.R. conceptualization, D.M.I. and A.D.R. methodology, D.-C.A. and N.-D.S. software 3D models, D.-C.A., D.M.I., A.D.R. and N.-D.S. data analysis and writing the paper. N.-D.S. review and editing. All authors have read and agreed to the published version of the manuscript.

Funding

This work was supported by a grant of the Romanian Ministry of Research and Innovation, CCCDI-UEFISCDI, project number PN-III-P1-1.2-PCCDI-2017-0224/77PCCDI/2018 within PNCDI III.

Institutional Review Board Statement

Not applicable.

Informed Consent Statement

Not applicable.

Data Availability Statement

Not applicable.

Acknowledgments

The support of the Romanian Ministry of Research and Innovation by the Grant CCCDI-UEFISCDI, project number PN-III-P1-1.2-PCCDI-2017-0224/77PCCDI/2018 within PNCDI III is gratefully acknowledged.

Conflicts of Interest

The authors declare no conflict of interest.

References

  1. Bikas, H.; Stavropoulos, P.; Chryssolouris, G. Additive manufacturing methods and modeling approaches: A critical review. Int. J. Adv. Manuf. Technol. 2016, 83, 389–405. [Google Scholar] [CrossRef] [Green Version]
  2. Horn, T.J.; Harrysson, O.L.A. Overview of current additive manufacturing technologies and selected applications. Sci. Prog. 2012, 95, 255–282. [Google Scholar] [CrossRef] [PubMed]
  3. Schaechtl, P.; Schleich, B.; Wartzack, S. Statistical tolerance analysis of 3d-printed non-assembly mechanisms in motion using empirical predictive models. Appl. Sci. 2021, 11, 1860. [Google Scholar] [CrossRef]
  4. Cuellar, J.S.; Smit, G.; Plettenburg, D.; Zadpoor, A. Additive manufacturing of non-assembly mechanisms. Addit. Manuf. 2018, 21, 150–158. [Google Scholar] [CrossRef]
  5. Lussenburg, K.; Sakes, A.; Breedveld, P. Design of non-assembly mechanisms: A state-of-the-art review. Addit. Manuf. 2021, 39. [Google Scholar] [CrossRef]
  6. Sossou, G.; Demoly, F.; Montavon, G.; Gomes, S. An additive manufacturing oriented design approach to mechanical assemblies. J. Comput. Des. Eng. 2018, 5, 3–18. [Google Scholar] [CrossRef]
  7. Li, S.; Xin, Y.; Yu, Y.; Wang, Y. Design for additive manufacturing: A force-flow perspective. Mater. Des. 2021, 204, 109664. [Google Scholar] [CrossRef]
  8. Reichwein, J.; Vogel, S.; Schork, S.; Kirchner, E. On the Applicability of Agile Development Methods to Design for Additive Manufacturing. Procedia CIRP 2020, 91, 653–658. [Google Scholar] [CrossRef]
  9. Wang, Z.; Zhang, Y.; Bernard, A. A Constructive Solid Geometry-based Generative Design Method for Additive Manufacturing. Addit. Manuf. 2021, 41, 101952. [Google Scholar] [CrossRef]
  10. Thompson, M.K.; Moroni, G.; Vaneker, T.; Fadel, G.; Campbell, R.I.; Gibson, I.; Bernard, A.; Schulz, J.; Graf, P.; Ahuja, B.; et al. Design for Additive Manufacturing: Trends, opportunities, considerations, and constraints. CIRP Ann. Manuf. Technol. 2016, 65, 737–760. [Google Scholar] [CrossRef] [Green Version]
  11. Laverne, F.; Segonds, F.; Anwer, N.; Le Coq, M. Assembly based methods to support product innovation in design for additive manufacturing: An exploratory case study. J. Mech. Des. Trans. ASME 2015, 137, 1–8. [Google Scholar] [CrossRef]
  12. Hällgren, S.; Pejryd, L.; Ekengren, J. (Re)Design for Additive Manufacturing. Procedia CIRP 2016, 50, 246–251. [Google Scholar] [CrossRef] [Green Version]
  13. Schleich, B.; Wartzack, S. A Quantitative Comparison of Tolerance Analysis Approaches for Rigid Mechanical Assemblies. Procedia CIRP 2016, 43, 172–177. [Google Scholar] [CrossRef] [Green Version]
  14. Polini, W. To model joints with clearance for tolerance analysis. Proc. Inst. Mech. Eng. Part B J. Eng. Manuf. 2014, 228, 1689–1700. [Google Scholar] [CrossRef]
  15. Zou, R.; Xia, Y.; Liu, S.; Hu, P.; Hou, W.; Hu, Q.; Shan, C. Isotropic and anisotropic elasticity and yielding of 3D printed material. Compos. Part B Eng. 2016, 99, 506–513. [Google Scholar] [CrossRef]
  16. Stuppy, J.; Meerkamm, H. Tolerance analysis of mechanisms taking into account joints with clearance and elastic deformations. In Proceedings of the DS 58-5: Proceedings of ICED 09, the 17th International Conference on Engineering Design, Palo Alto, CA, USA, 24–27 August 2009; Volume 5, pp. 489–500. [Google Scholar]
  17. Tian, Q.; Flores, P.; Lankarani, H.M. A comprehensive survey of the analytical, numerical and experimental methodologies for dynamics of multibody mechanical systems with clearance or imperfect joints. Mech. Mach. Theory 2018, 122, 1–57. [Google Scholar] [CrossRef]
  18. Chen, Y.; Chen, Z. Major factors in rapid prototyping of mechanisms. Key Eng. Mater. 2010, 443, 516–521. [Google Scholar] [CrossRef]
  19. Paraskevoudis, K.; Karayannis, P.; Koumoulos, E.P. Real-Time 3D Printing Remote Defect Detection (Stringing) with Computer Vision and Artificial Intelligence. Processes 2020, 8, 1464. [Google Scholar] [CrossRef]
  20. Schaechtl, P.; Hallmann, M.; Schleich, B.; Wartzack, S. Tolerance Analysis of Additively Manufactured Non-assembly Mechanisms considering Joint Clearance. Procedia CIRP 2020, 92, 27–32. [Google Scholar] [CrossRef]
  21. Hallmann, M.; Goetz, S.; Schleich, B.; Wartzack, S. Optimization of build time and support material quantity for the additive manufacturing of non-assembly mechanisms. Procedia CIRP 2019, 84, 271–276. [Google Scholar] [CrossRef]
  22. Schleich, B.; Wartzack, S. Evaluation of geometric tolerances and generation of variational part representatives for tolerance analysis. Int. J. Adv. Manuf. Technol. 2015, 79, 959–983. [Google Scholar] [CrossRef]
  23. Yu, D.; Guo, J.; Zhao, Q.; Hong, J. Prediction of the dynamic performance for the deployable mechanism in assembly based on optimized neural network. Procedia CIRP 2020, 97, 348–353. [Google Scholar] [CrossRef]
  24. Deswal, S.; Narang, R.; Chhabra, D. Modeling and parametric optimization of FDM 3D printing process using hybrid techniques for enhancing dimensional preciseness. Int. J. Interact. Des. Manuf. 2019, 13, 1197–1214. [Google Scholar] [CrossRef]
  25. Yadav, D.; Chhabra, D.; Kumar Garg, R.; Ahlawat, A.; Phogat, A. Optimization of FDM 3D printing process parameters for multi-material using artificial neural network. Mater. Today Proc. 2020, 21, 1583–1591. [Google Scholar] [CrossRef]
  26. Jaisingh Sheoran, A.; Kumar, H. Fused Deposition modeling process parameters optimization and effect on mechanical properties and part quality: Review and reflection on present research. Mater. Today Proc. 2020, 21, 1659–1672. [Google Scholar] [CrossRef]
  27. Sood, A.K.; Ohdar, R.K.; Mahapatra, S.S. Experimental investigation and empirical modelling of FDM process for compressive strength improvement. J. Adv. Res. 2012, 3, 81–90. [Google Scholar] [CrossRef] [Green Version]
  28. Wei, X.H.; Tian, Y.; Joneja, A. A study on revolute joints in 3d-printed non- assembly mechanisms. Rapid Prototyping J. 2016, 22, 901–933. [Google Scholar] [CrossRef]
  29. Rong-Ji, W.; Xin-Hua, L.; Qing-Ding, W.; Lingling, W. Optimizing process parameters for selective laser sintering based on neural network and genetic algorithm. Int. J. Adv. Manuf. Technol. 2009, 42, 1035–1042. [Google Scholar] [CrossRef]
  30. Chang, C.C.; Chang, T.Y.P.; Xu, Y.G.; To, W.M. Selection of training samples for model updating using neural networks. J. Sound Vib. 2002, 249, 867–883. [Google Scholar] [CrossRef]
  31. Di Angelo, L.; Di Stefano, P. A neural network-based build time estimator for layer manufactured objects. Int. J. Adv. Manuf. Technol. 2011, 57, 215–224. [Google Scholar] [CrossRef]
  32. Munguía, J.; Ciurana, J.; Riba, C. Neural-network-based model for build-time estimation in selective laser sintering. Proc. Inst. Mech. Eng. Part B J. Eng. Manuf. 2009, 223, 995–1003. [Google Scholar] [CrossRef]
  33. Qi, X.; Chen, G.; Li, Y.; Cheng, X.; Li, C. Applying Neural-Network-Based Machine Learning to Additive Manufacturing: Current Applications, Challenges, and Future Perspectives. Engineering 2019, 5, 721–729. [Google Scholar] [CrossRef]
  34. Walter, M.; Sprügel, T.; Wartzack, S. Tolerance analysis of systems in motion taking into account interactions between deviations. Proc. Inst. Mech. Eng. Part B J. Eng. Manuf. 2013, 227, 709–719. [Google Scholar] [CrossRef] [Green Version]
Figure 1. The test sample.
Processes 09 00925 g001
Figure 2. The measurement scheme.
Processes 09 00925 g002
Figure 3. ANN’s architecture used in this study.
Processes 09 00925 g003
Figure 4. The training process results.
Processes 09 00925 g004
Figure 5. The ANN regression plot.
Processes 09 00925 g005
Figure 6. The mean square error plot.
Processes 09 00925 g006
Figure 7. The convergence of the GA-ANN.
Processes 09 00925 g007
Table 1. Dimensions of the designed samples.
NoImposed Clearance
c, (mm)
Shaft Diameter
d, (mm)
Hole Diameter
D, (mm)
1.0.820.020.8
2.1.220.021.2
3.220.022.0
Table 2. The input parameters.
Input ParametersLevel 1Level 2Level 3
Infill density0.60.81.0
Imposed clearance0.81.22.0
Layer thickness0.140.190.29
Table 3. The dataset for the experiment.
NoInfill DensityImposed ClearanceLayer ThicknessObtained ClearanceAbsolute Relative Clearance
1.0.80.80.140.510.36
2.0.80.80.140.50.38
3.0.80.80.140.490.39
4.0.81.20.190.870.28
5.0.81.20.190.930.23
6.0.81.20.190.880.27
7.0.820.291.760.12
8.0.820.291.80.10
9.0.820.291.820.09
10.0.60.80.190.770.04
11.0.60.80.190.760.05
12.0.60.80.190.770.04
13.0.61.20.291.080.10
14.0.61.20.291.130.06
15.0.61.20.291.10.08
16.0.620.141.920.04
17.0.620.141.870.06
18.0.620.141.90.05
19.10.80.290.730.09
20.10.80.290.740.08
21.10.80.290.730.09
22.11.20.140.920.23
23.11.20.140.970.19
24.11.20.140.990.18
25.120.191.730.14
26.120.191.70.15
27.120.191.680.16
Table 4. The minimum value for absolute relative clearance obtained using GA.
Infill DensityImposed ClearanceLayer ThicknessAbsolute Relative Clearance
0.7371.6740.2090.0385788
Table 5. The values of the coefficients in Equation (2).
Coefficientsx0 = 0x0 = 0.3
b0.0054190.013969
a220.0116750.017520
a210.0145450.021629
a200.0186590.027441
a120.0515530.077296
a110.0645780.096064
a100.1085440.169484
a020.2239720.320087
a010.3138810.0466653
a000.4166500.615799
Publisher’s Note: MDPI stays neutral with regard to jurisdictional claims in published maps and institutional affiliations.

