Article

A Modeling Application for GHG Fluxes Estimates in Betel Nuts Plantations in Taiwan

1
Council for Agricultural Research and Economics (CREA), Center of Engineering and Agro-Food Processing, 00015 Monterotondo, Italy
2
Master’s Program of Green Energy Science and Technology, Feng Chia University, Taichung 407802, Taiwan
3
General Education Center, Feng Chia University, Taichung 407802, Taiwan
4
National Research Council, Institute on Atmospheric Pollution (CNR-IIA), 00015 Montelibretti, Italy
5
GIS Research Center, Feng Chia University, Taichung 407802, Taiwan
*
Authors to whom correspondence should be addressed.
Processes 2021, 9(5), 895; https://doi.org/10.3390/pr9050895
Submission received: 30 March 2021 / Revised: 6 May 2021 / Accepted: 14 May 2021 / Published: 19 May 2021
(This article belongs to the Special Issue Advanced Technologies in Biohydrogen and Bioprocesses)

Abstract

:
Perennial woody crops could have a positive impact on carbon balance, absorbing carbon during growing season and storing it for several years, whereas annual crops do not have this particular effect. Usually, techniques for GHG (greenhouse gases) flux measurements have limited spatial representativeness, with some difficulties to extend leaf measurements to field scale. Models, especially if supported by remote sensing data, allow for upscaling the monitoring of these fluxes. The aim of this work was to evaluate the carbon fluxes (gross primary production, GPP; net ecosystem production, NEP) of the betel nut cultivars in Taiwan by a vegetation photosynthesis model (VPM). The model permitted estimating seasonal dynamics of GPP in a moist tropical evergreen forest. These plantations are very common in Taiwan and their role could be significant in environmental and development policies even though, until now, the consumption of the fruit of this tree is at the center of controversy due to their use and effects on the population. To obtain estimates of carbon fluxes on a large area that would appreciate its spatial variability, a model based on physiological processes was used. This model incorporated a series of procedures and monthly mean meteorological data, light use efficiency, and satellite enhanced vegetation index (EVI) were used as inputs. An additional purpose of this work was to compare the carbon uptake of different cultivars in Taiwan and Italy. Using a different model, always based on light use efficiency, a similar project was carried on Italian vineyards, with other climate conditions and different agricultural practices.

1. Introduction

In the last decades, the interest about the role of agriculture in climate changes raised considerably. The increase of atmospheric carbon dioxide due to anthropogenic emissions and the associated global warming are partly counterbalanced by active carbon sequestration by terrestrial vegetation [1]. Quantitative assessment of carbon sequestration at a local to regional scale represents basic information for recommending and evaluating policies and management decisions [2].
To better understand the regional pattern and largely quantify the GHG dynamics, we used process-based models that included climate and plant physiology data and provided a tool to assess carbon sink under varying environments and spatial scales. To achieve this goal, we integrated a modeling and remote sensing approach. The process-based models provide an interesting way to analyze the absorption capacity of a large area in variable environmental conditions and over a range of different spatial scales [3]. Satellite remote sensing represents a tool that can potentially upscale the spatial range provided by punctual measures. Due to the limited coverage of the ground measurements, the interest in remote sensing use for the estimation of GPP is increasing [4,5]. Many models based on remote sensing application have been proposed to quantify the GPP; as they are simple, most of them are linear and efficient [6,7,8]. Remote sensing GPP models are grouped in four principal categories: light use efficiency (LUE) [9,10], vegetation index (VI) driven [11,12], process-based [7], and machine learning models [13,14].
The approach of LUE models, introduced by Monteith [15], is based on the light use efficiency (LUE), which expresses the conversion efficiency of photosynthetically active radiation absorbed (aPAR) in gross primary production (GPP), assuming a linear dependence of GPP from aPAR, reduced by environmental stresses [16].
Many published studies focused on roles of forests, but a perennial woody crop can also contribute to carbon sequestration [10]. After the Kyoto Protocol, in the wake of the CO2 quotas market—providing calculation of GHG emissions for each country and emission credits trade deriving from projects on absorption or, more generally, reduction of climate-changing gases—the number of studies investigating cultivars with a potential of atmospheric carbon sequestration is growing [17,18].
This study focused on betel nuts plantations in Taiwan because they are widely spread in this country and under controversy for their role in human wellness and related bioethical implications [19,20]. Another usually neglected aspect of that issue is the role of these plantations in gas exchanges due to their eco-physiological processes. Arboreal plants are able to absorb significant amounts of CO2 and, in most cases, to fix the carbon in their tissues for many years, leading to a substantial removal of the atmospheric CO2, mostly dependent on the growth phase and management [21,22].
An approach able to estimate the role of betel nuts in the carbon cycle at a regional scale could surely help in the definition of ethical blind spots related to these plantations. Because a lot of betel nuts plantations can already be observed all over the country, we might as well understand their potential in every aspect, to lead policies and decisions in the best direction. The government and institutions already attempted to curb betel nut cultivation, distribution, and sales.
Thus, the dual purpose of this study was to apply a model trying to estimate gas exchanges and carbon fixation of tree cultivars, such as betel nuts, and to propose data and information useful to policy makers in decisional processes.

2. Materials and Methods
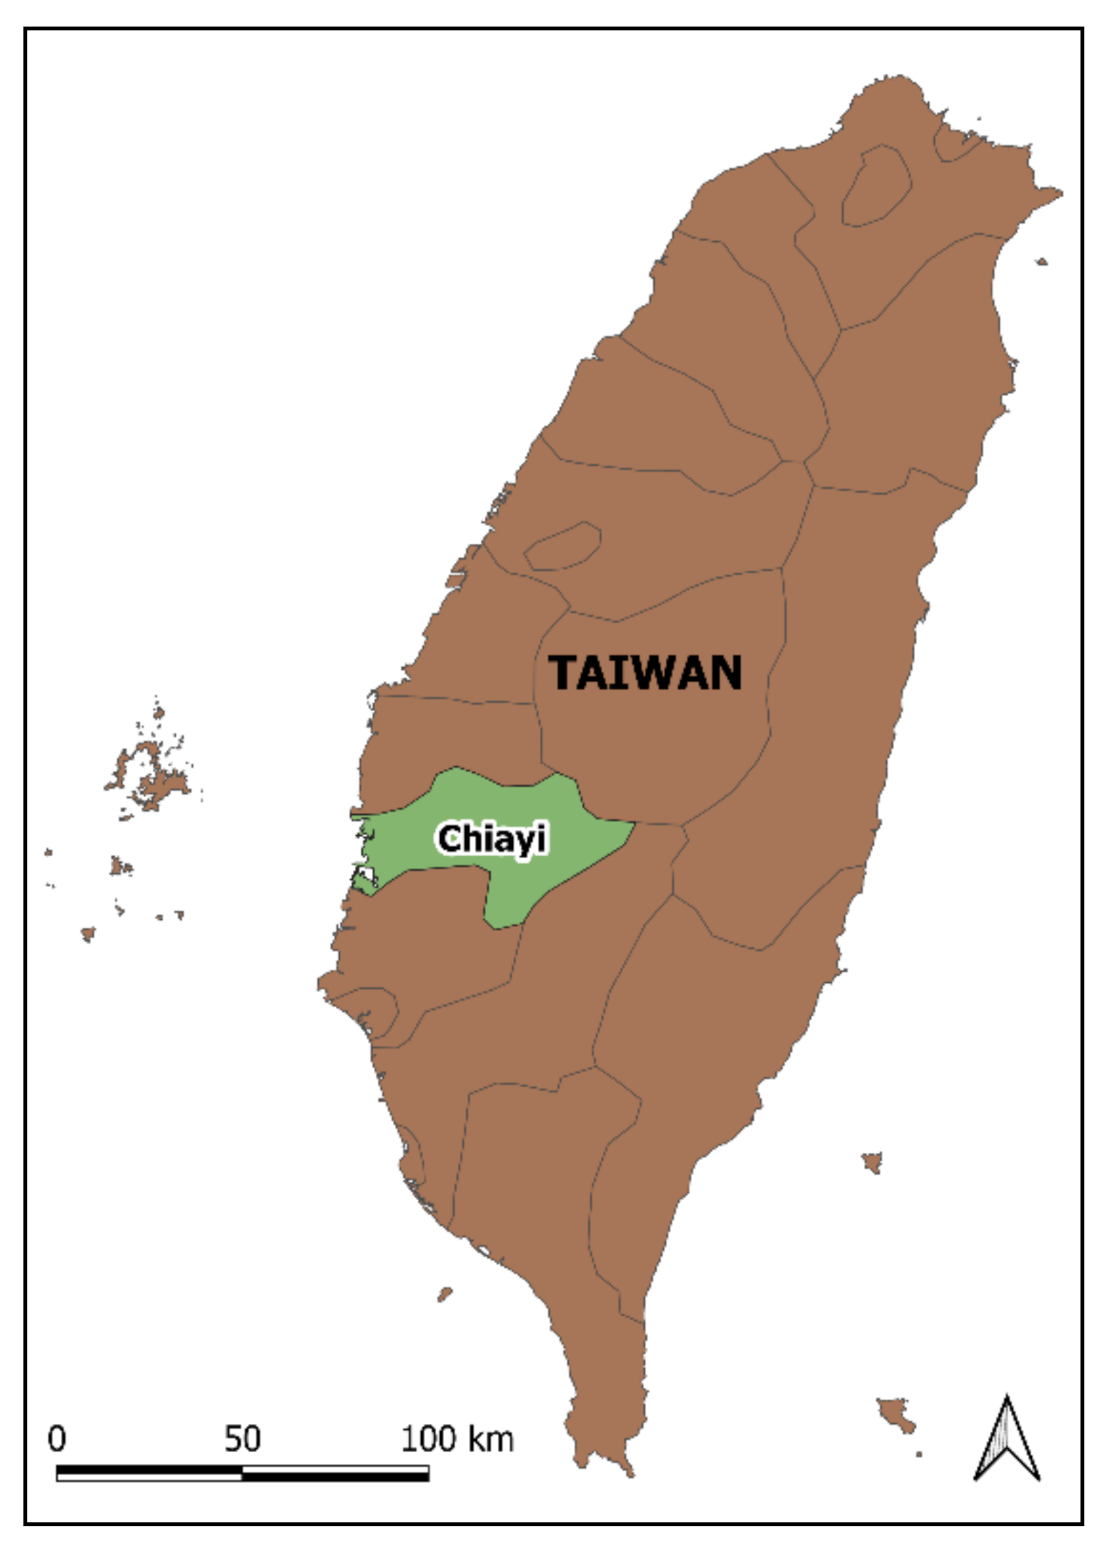
2.1. Study Area

A member of the Palm family, the betel nut or areca nut, known scientifically as Areca catechu, is a relative of the coconut (Cocos nucifera). Betel nut palms thrive in tropical and subtropical areas and are less tolerant of the cooler climatic conditions that may be sustained by other palms. The betel nut palm is widely cultivated in India, Bangladesh, Sri Lanka, Indonesia, and on numerous islands in the Western Pacific. Betel nut palms produce flowers which transform into nuts. The flowers are bunched in a cluster called an inflorescence. A palm can start producing inflorescences between the fourth and seventh year of age. The inflorescence appears after the dropping of a frond (leaf). A new inflorescence may appear after each frond dropping or at irregular intervals, for an average of three to four inflorescences per year. Two to three inflorescences, at different stages of development, can be found on a single palm. This plant is sensitive to moisture deficit and usually grows where the rainfall reaches annual values from 750 to 4500 mm [23]. A betel nuts plantation area of 533.23 ha was detected in the Chiayi County in Taiwan (Figure 1) and a shapefile was created (extension: 197801.65, 2595425.94: 217659.41, 2605386.36; EPSG:3826-TWD97/TM2 zone 121). The examined period was from 1 January to 28 February 2018; this choice was mostly driven by the kind of model used and by the unavailability of clear Landsat 8 Satellite images. Meteorological data, such as temperature and solar radiation, were taken from the Taiwan Central Weather Bureau website https://www.cwb.gov.tw/eng/ (accessed on 17 May 2021). Eleven stations in Taiwan had available data for radiation in the chosen period, while twenty stations were considered for temperature; the meteorological data were interpolated and made continuous on the interested area by the triangular irregular net (TIN) algorithm. The meteorological parameters are summarized in Table 1.
Calculations were developed in Python environment using GDAL library and QGIS. All meteorological values were spatialized to arrays with 30 m resolution, covering the whole studied area.

2.2. VPM Model

A VPM model was developed to estimate the gross primary production (GPP) in a seasonally moist tropical evergreen forest [10]. This model took advantages of additional spectral bands (e.g., blue and shortwave infrared—SWIR) that were available from advanced optical sensors present on the Landsat 8 satellite. The selection of images was mostly influenced by the quality related to atmospheric conditions; only images without clouds were considered. The clearest images were used for the model application. They were dated 15 and 24 January, 25 February and 13 March. The Landsat 8 bands useful for the calculations of indices were band 2 (blue: 0.452–0.512 μm), band 4 (red: 0.636–0.673 μm), band 5 (NIR: 0.851–0.879 μm), and band 6 (SWIR: 1.566–1.651 μm). From these bands, were calculated some spectral indices useful in the model calculations, such as enhanced vegetation index (EVI) used for vegetation detection (Equation (1)) and land surface water index (LWSI, Equation (2)) sensitive to vegetation water content [16].
EVI = 2.5 × ρ nir ρ red ρ nir + 6 × ρ red 7.5 × ρ blue + 1
LSWI = ρ nir ρ swir ρ nir + ρ swir
VPM is based on the light use efficiency (LUE) approach, which estimates the conversion efficiency of absorbed photosynthetically active radiation (FAPAR) into gross primary production (GPP, Equation (3)) and assumes a linear dependence of GPP on FAPAR, reduced by environmental constraints.
GPP =   ε g × FAPAR PAV × PAR  
where:
  • FAPAR PAV is the fraction of photosynthetic active radiation (PAR) absorbed by plants [10] ( FAPAR PAR = a × EVI )
  • ε g is the light use efficiency (μmol CO2/μmol PAR), which can be described as follows (Equation (4)):
ε g = ε 0 × T scalar × W scalar × P scalar
where:
  • ε 0 is the maximum light use efficiency [16]
  • Tscalar, Wscalar, and Pscalar are the down-regulation scalars for the effect of temperature, water, and leaf phenology [16]
For validation purposes, we decided to use evapotranspiration values and considered them strictly correlated to GPP. Because of the lack of evapotranspiration observations, we calculated them using indications in the FAO-56 report [24], beginning from the evaporation observations obtained from the class A evaporimeter of the Taiwan Central Weather Bureau. Considering the carbon that vegetation releases to the atmosphere through respiration and decomposition, the net ecosystem production can be calculated as follows (Equation (5)):
N E P = G P P R e s p i r a t i o n
where the respiration was calculated using the T&P&LAI model [25].

3. Results

Figure 2 shows the January GPP spatial variability in the Chiayi County area. During the three months when detection proceeded, the mean GPP per square meter considerably changed. As we can see in Table 1, March GPP values were higher than the ones in January and February, when daytime was shorter and solar radiation less intense. If the model had considered the entire surface, the GPP could have reached 1466.42 tons in January, 1517.23 tons in February and 2718.61 tons in March. Because a light use efficiency model was used, as expected, the most important driving factor was the solar radiation, which increased, as did the GPP (Table 2). Even though the GPP and radiation mean values changed so closely, when a linear model was applied to these variables, it did not show a strong correlation between them (R2 = 0.06).
The lack of correlation could be explained by the high variability introduced by the remote sensing data, such as EVI. In Table 1, the coefficients of variation (CV) for GPP, EVI, and radiation were reported; focusing on Figure 3a, it can be noticed that the GPP trend and variability strictly followed those of EVI, with R2 = 0.67. However, when we considered the radiation absorbed by vegetation, calculated like in [26], using EVI instead of NDVI, it was possible to see a relation with GPP. In fact, like GPP, the absorbed radiation depended on vegetation intensity and its light processing efficiency [27]; GPP increased exponentially when absorbed radiation increased (Figure 3b), while when we used a logarithmic scale for GPP, a satisfactory linear relationship was confirmed by an R2 of 0.47 (Figure 3c).
The model validation was highly problematic; in fact, data regarding gas exchanges directly measured in the field were completely absent. To overcome this lack of data, we took advantage of the close coupling of photosynthesis with H2O fluxes and used evapotranspiration to evaluate the performance of the VPM model (Figure 3d). In this case, too, the high variability, due to the remote sensing inputs, prevented us from noticing a strong correlation, showing a very slight positive correlation with R2 = 0.17.
The GPP represents the whole amount of C absorbed by a plant without considering the CO2 released through the plant and soil respiration. To better outline the carbon cycle and the permanent amount of carbon stored in vegetation, NEP must also be considered. The net storage is sensitively reduced to less than a half of GPP (Table 1).
When we considered also the plant respiration, we observed NEP average values of 135.93 ± 28.81 gC m−2 month−1 in January, 141.10 ± 29.45 gC m−2 month−1 in February, and 255.31 ± 50.68 gC m−2 month−1 in March. For the whole area, we recorded 670.05 tC month−1 in January, 695.87 tC month−1 in February, and 1259.14 tC month−1 in March.
These output data were distinguished by high variability, probably also due to the lack of a dense network of weather stations. The need for a spatial interpolation was unavoidable; therefore, approximation of variables, such as temperature and radiation measured in the few stations present on the territory, could strongly affect the results of these models. Furthermore, models always try to represent and simplify complex environmental phenomena, such as the gas exchanges between vegetation and atmosphere; in fact, VPM does not consider the laws of physics behind the turbulent dynamics of the air over the canopy boundary layer. Finally, it should be said that, usually, exponential laws can better describe environmental phenomena, but in this case, an easier linear equation was used. In fact, as mentioned before, the relation between GPP and absorbed solar radiation showed an exponential trend. For these reasons, this study represents the first step of a wide scale C cycle estimation, able to give the magnitude order of C fluxes, starting from the only open-source data available.
A similar study was carried out for grapevine in Italy, with different validation data and, obviously, different results. The comparison of the two cultivars in the two countries was interesting albeit limited. Studies that consider tropical and temperate species are often complicated because they compare different growth forms and different climates [28,29]. These climate differences are reflected also in the vegetation phenology, as growth cycles of temperate vegetation are generally associated with temperature, whereas growth cycles of tropical vegetation tend to be associated with precipitation [30,31].
The choice to study different months of the year was driven by the radiation efficiency use models applied for the GPP and NEP calculation. The periods, from January to March in Taiwan and from June to July in Italy, represent the most cloudless seasons and the time frame with more solar radiation available even though the light duration differs considerably.
Furthermore, NEP represented 45% of GPP in Taiwan, while in Italy, NEP was 36% of GPP (Table 3). This result showed that for vineyards in Italy the respiration rate was much greater than the photosynthesis rate. This could be explained by different plant behaviors due to different moisture conditions. Italian summer is usually characterized by drought, so plants close their stomata during the day, limiting water losses and evapotranspiration but also photosynthesis and C uptake; while at night, they open the stomata, allowing evapotranspiration and respiration [32].
Another difference was the distribution of the cultivars. Usually, betel nuts occupy small areas with high fragmentation patterns and require steep versants, while vineyards are characterized by bigger expansions on gentler slopes [33]. These different patterns can influence the vegetation reflectance detected by a satellite. The Lansat 8 satellite requires a minimal area of 900 m2 for sufficient data resolution, while betel nuts can occupy also very small areas. The Sentinel 2 satellite’s resolution of 10 m turned out to be excellent for vineyards reflectance detection; in fact, in this study, there was no need to detect every single grape plant because calculations were carried on cultivar scale and the aim was to evaluate the gas exchanges of the whole vineyards, which included also the grassy inter-rows. The cultivar management is also different: In vineyards, farmers can choose to leave grassy inter-rows or not, changing the CO2 absorption pattern. The pesticides usage also distinguishes the wine grapes cultivation.

4. Discussion

In this study, the application of a VPM model turned out to be advantageous for a tropical cultivar such as betel nuts, inasmuch these kinds of models take advantages of additional spectral bands available from advanced optical sensors. They need input data such as the enhanced vegetation index (EVI [34]), land surface water index (LSWI [10]), air temperature, and PAR. In tropical environments, where precipitation is the most important driving factor for plant growth, it is essential to use LSWI, which is sensitive to the total amount of liquid water in vegetation and its soil background [35]. Furthermore, the quantitative relations between the vegetation indices (EVI and NDVI) and the CO2 flux data clearly demonstrated the improvement of EVI over NDVI, in terms of the phase and magnitude of photosynthesis [10]. Time series of EVI and LSWI may provide valuable insights into the processes (e.g., growing season length and water stress) that regulate forests and carbon exchange in cultivars. Another advantage of the proposed method is that LUE models have been frequently used and are based on a simple and practical conceptual algorithm [36], also permitting comparisons between different environments.
Deepening this kind of research can help policy makers and companies to make production processes more sustainable as well as to find new horizons for business making. Strengthening the role of finance in an efficient economy that also achieves environmental and social objectives is one of the goals set in many international agreements. With an action plan on sustainable finance, which provides for the creation of a unified system to provide clarity and guidance on what to consider as sustainable and useful for mitigating climate change, a more sustainable and responsible society can be promoted as well as a low-carbon economy. Confidence in climate objectives and the use of sustainable finance to tackle climate change are fundamental. Bringing sustainable financial instruments closer to businesses, the private sector will contribute to raising global awareness of climate change. An international emissions trading system is an instrument featured in the Kyoto Protocol to the Framework Convention on Climate Change, designed to reduce emissions of greenhouse gases among major industrial countries. For example, Europe established, in 2003, an emission trading scheme (ETS) intended as a test designed to help its member states transition to a system that would lead to compliance with their Kyoto Protocol commitments. The ETS covers CO2 emissions from big industrial entities in the electricity, heat, and energy-intensive sectors. Carbon prices vary in different ETS markets and across time [37]; however, they are about 5–17 US Dollars/ton CO2.
Every single government could better enforce emission laws and requirements for big companies, requesting reports about emissions first, promoting projects to balance emissions that could involve local people in plantation management, increasing social welfare and richness in those country areas where there is greater poverty and fewer job opportunities. On the other side, big companies could use light use efficiency models to better understand, in preliminary design phases, the amount of carbon that could be absorbed by vegetation in sustainable projects. The advantages of defining a change mitigation strategy for companies go far beyond reducing emissions; companies able to assess and understand the opportunities related to climate will be able to make better long-term decisions, seizing this as a real business opportunity.

5. Conclusions

Although this study did not want to provide a definitive solution for the estimation of CO2 flows, it presented an excellent tool to evaluate primary production variability on a regional scale and the role of woody cultivars in atmospheric CO2 absorption. In fact, in the context of global change, the knowledge of the interaction between vegetation and atmosphere is essential to obtain a greater and wider territory value perception, and consequently to its management optimization with regard to environmental enhancement as well as production.
The comparison of the cultivars in the two countries was interesting albeit limited. Studies that consider tropical and temperate species are often complicated by comparisons of different growth forms and different climates [27]. These climate differences are also reflected in vegetation phenology: growth cycles in temperate vegetation are generally associated with temperature, whereas growth cycles in tropical vegetation tend to be associated with precipitation [28,29].
Nevertheless, the data obtained with our model represent a starting point for understanding the eco-physiological behavior of betel nuts plantations. In fact, with more accurate validations from field measured data and thanks to the use of an unmanned aerial vehicle able to provide remote sensing data with higher spatial and temporal resolution, it will be possible to precisely validate the model and obtain realistic data for entire regions.

Author Contributions

Conceptualization, C.-Y.C. and F.P.; methodology, A.P.; software, A.P.; validation, M.-L.Y., C.-T.W. and Y.-C.L.; formal analysis, C.-T.W.; investigation, A.P.; resources, C.-Y.C. And M.-L.Y.; data curation, A.P.; writing—original draft preparation, A.P.; writing—review and editing, A.P. and C.-Y.C.; visualization, F.P.; supervision, C.-Y.C. And F.P.; project administration, C.-T.W. and Y.-C.L.; funding acquisition, C.-Y.C. And M.-L.Y.; All authors have read and agreed to the published version of the manuscript.

Funding

This research was financially supported by the Ministry of Science and Technology, Taiwan (MOST 109-2625-M-035-001) and the Taiwan Experience Education Program (TEEP), MOE.

Data Availability Statement

Publicly available datasets were analyzed in this study. This data can be found here: https://www.cwb.gov.tw/eng/ (accessed on 17 May 2021).

Acknowledgments

Institute of Green Products, Feng Chia University is greatly acknowledged to assist with the experiments and provide materials.

Conflicts of Interest

The authors declare no conflict of interest.

References

  1. Magnani, F.; Mencuccini, M.; Borghetti, M.; Berbigier, P.; Berninger, F.; Delzon, S.; Grelle, A.; Hari, P.; Jarvis, P.G.; Kolari, P.; et al. The Human Footprint in the Carbon Cycle of Temperate and Boreal Forests. Nature 2007, 447, 849–851. [Google Scholar] [CrossRef]
  2. Jarraud, M.; Steiner, A. Summary for Policymakers; Cambridge University Press: Cambridge, UK, 2012. [Google Scholar] [CrossRef]
  3. Landsberg, J.; Coops, N. Modeling Forest Productivity across Large Areas and Long Periods. Nat. Res. Model. 1999, 12, 383–411. [Google Scholar] [CrossRef]
  4. Behrenfeld, M.J.; Randerson, J.T.; McClain, C.R.; Feldman, G.C.; Los, S.O.; Tucker, C.J.; Falkowski, P.G.; Field, C.B.; Frouin, R.; Esaias, W.E.; et al. Biospheric Primary Production during an ENSO Transition. Science 2001, 291, 2594–2597. [Google Scholar] [CrossRef] [PubMed] [Green Version]
  5. Machwitz, M.; Gessner, U.; Conrad, C.; Falk, U.; Richters, J.; Dech, S. Modelling the Gross Primary Productivity of West Africa with the Regional Biomass Model RBM+, Using Optimized 250m MODIS FPAR and Fractional Vegetation Cover Information. Int. J. Appl. Earth Obs. Geoinf. 2015, 43, 177–194. [Google Scholar] [CrossRef]
  6. Yuan, W.; Liu, S.; Zhou, G.; Zhou, G.; Tieszen, L.L.; Baldocchi, D.; Bernhofer, C.; Gholz, H.; Goldstein, A.H.; Goulden, M.L.; et al. Deriving a Light Use Efficiency Model from Eddy Covariance Flux Data for Predicting Daily Gross Primary Production across Biomes. Agric. For. Meteorol. 2007, 143, 189–207. [Google Scholar] [CrossRef] [Green Version]
  7. Ryu, Y.; Baldocchi, D.D.; Kobayashi, H.; van Ingen, C.; Li, J.; Black, T.A.; Beringer, J.; van Gorsel, E.; Knohl, A.; Law, B.E.; et al. Integration of MODIS Land and Atmosphere Products with a Coupled-Process Model to Estimate Gross Primary Productivity and Evapotranspiration from 1 Km to Global Scales. Glob. Biogeochem. Cycles 2011, 25. [Google Scholar] [CrossRef] [Green Version]
  8. Running, S.W.; Nemani, R.R.; Heinsch, F.A.; Zhao, M.; Reeves, M.; Hashimoto, H. A Continuous Satellite-Derived Measure of Global Terrestrial Primary Production. Bioscience 2004, 54, 547–560. [Google Scholar] [CrossRef]
  9. Veroustraete, F. On the Use of a Simple Deciduous Forest Model for the Interpretation of Climate Change Effects at the Level of Carbon Dynamics. Ecol. Modell. 1994, 75–76, 221–237. [Google Scholar] [CrossRef]
  10. Xiao, X.; Zhang, Q.; Braswell, B.; Urbanski, S.; Boles, S.; Wofsy, S.; Moore, B.; Ojima, D. Modeling Gross Primary Production of Temperate Deciduous Broadleaf Forest Using Satellite Images and Climate Data. Remote Sens. Environ. 2004, 91, 256–270. [Google Scholar] [CrossRef]
  11. Gitelson, A.A.; Viña, A.; Verma, S.B.; Rundquist, D.C.; Arkebauer, T.J.; Keydan, G.; Leavitt, B.; Ciganda, V.; Burba, G.G.; Suyker, A.E. Relationship between Gross Primary Production and Chlorophyll Content in Crops: Implications for the Synoptic Monitoring of Vegetation Productivity. J. Geophys. Res. Atmos. 2006, 111. [Google Scholar] [CrossRef] [Green Version]
  12. Sims, D.A.; Rahman, A.F.; Cordova, V.D.; El-Masri, B.Z.; Baldocchi, D.D.; Bolstad, P.V.; Flanagan, L.B.; Goldstein, A.H.; Hollinger, D.Y.; Misson, L.; et al. A New Model of Gross Primary Productivity for North American Ecosystems Based Solely on the Enhanced Vegetation Index and Land Surface Temperature from MODIS. Remote Sens. Environ. 2008, 112, 1633–1646. [Google Scholar] [CrossRef]
  13. Liu, S.; Zhuang, Q.; He, Y.; Noormets, A.; Chen, J.; Gu, L. Evaluating Atmospheric CO2 Effects on Gross Primary Productivity and Net Ecosystem Exchanges of Terrestrial Ecosystems in the Conterminous United States Using the AmeriFlux Data and an Artificial Neural Network Approach. Agric. For. Meteorol. 2016, 220, 38–49. [Google Scholar] [CrossRef] [Green Version]
  14. Jung, M.; Reichstein, M.; Margolis, H.A.; Cescatti, A.; Richardson, A.D.; Arain, M.A.; Arneth, A.; Bernhofer, C.; Bonal, D.; Chen, J.; et al. Global Patterns of Land-Atmosphere Fluxes of Carbon Dioxide, Latent Heat, and Sensible Heat Derived from Eddy Covariance, Satellite, and Meteorological Observations. J. Geophys. Res. Biogeosci. 2011, 116. [Google Scholar] [CrossRef] [Green Version]
  15. Monteith, J.L. Solar Radiation and Productivity in Tropical Ecosystems. J. Appl. Ecol. 1972, 9, 747–766. [Google Scholar] [CrossRef] [Green Version]
  16. Xiao, X.; Hollinger, D.; Aber, J.; Goltz, M.; Davidson, E.A.; Zhang, Q.; Moore, B. Satellite-Based Modeling of Gross Primary Production in an Evergreen Needleleaf Forest. Remote Sens. Environ. 2004, 89, 519–534. [Google Scholar] [CrossRef]
  17. De Oliveira, G.; Brunsell, N.A.; Crews, T.E.; DeHaan, L.R.; Vico, G. Carbon and Water Relations in Perennial Kernza (Thinopyrum Intermedium): An Overview. Plant Sci. 2020, 295, 110279. [Google Scholar] [CrossRef] [PubMed]
  18. Toensmeier, E. The Carbon Farming Solution: A Global Toolkit of Perennial Crops and Regenerative Agriculture Practices for Climate Change Mitigation and Food Security; Chelsea Green Publishing: White River Junction, VT, USA, 2016. [Google Scholar]
  19. Brunori, E.; Farina, R.; Biasi, R. Sustainable Viticulture: The Carbon-Sink Function of the Vineyard Agro-Ecosystem. Agric. Ecosyst. Environ. 2016, 223, 10–21. [Google Scholar] [CrossRef]
  20. Tham, J.; Sem, G.; Sit, E.; Tai, M.C. A Scientific and Socioeconomic Review of Betel Nut Use in Taiwan with Bioethical Reflections. Asian Bioeth. Rev. 2017, 9, 401–414. [Google Scholar] [CrossRef]
  21. Tham, J.; Sem, G.; Sit, E.; Tai, M.C. The Ethics of Betel Nut Consumption in Taiwan. J. Med. Ethics 2017, 43, 739–740. [Google Scholar] [CrossRef]
  22. Fan, J.; McConkey, B.G.; Liang, B.C.; Angers, D.A.; Janzen, H.H.; Kröbel, R.; Cerkowniak, D.D.; Smith, W.N. Increasing Crop Yields and Root Input Make Canadian Farmland a Large Carbon Sink. Geoderma 2019, 336, 49–58. [Google Scholar] [CrossRef]
  23. Artero, V.T.; Santos, V.M. Betel-Nut Palm Care. Guam Cooperative Extension. 2000, pp. 1–9. Available online: http://hdl.handle.net/10524/48578 (accessed on 17 May 2021).
  24. Allen, R.G.; Pereira, L.S.; Raes, D.; Smith, M.; Ab, W. Crop Evapotranspiration: Guidelines for Computing Crop Water Requirements; FAO Irrigation and Drainage Paper 56; Food and Agriculture Organization of the United Nations: Rome, Italfy, 1998; 300p, Available online: http://www.fao.org/docrep/X0490E/x0490e00.htm (accessed on 17 May 2021).
  25. Reichstein, M.; Rey, A.; Freibauer, A.; Tenhunen, J.; Valentini, R.; Banza, J.; Casals, P.; Cheng, Y.; Grünzweig, J.M.; Irvine, J.; et al. Modeling Temporal and Large-Scale Spatial Variability of Soil Respiration from Soil Water Availability, Temperature and Vegetation Productivity Indices. Glob. Biogeochem. Cycles 2003, 17. [Google Scholar] [CrossRef]
  26. Nolè, A.; Law, B.E.; Magnani, F.; Matteucci, G.; Ferrara, A.; Ripullone, F.; Borghetti, M. Application of the 3-PGS Model to Assess Carbon Accumulation in Forest Ecosystems at a Regional Level. Can. J. For. Res. 2009, 39, 1647–1661. [Google Scholar] [CrossRef]
  27. Gallo, K.P.; McNab, A.L.; Karl, T.R.; Brown, J.F.; Hood, J.J.; Tarpley, J.D. The Use of NOAA AVHRR Data for Assessment of the Urban Heat Island Effect. J. Appl. Meteorol. 1993, 32, 899–908. [Google Scholar] [CrossRef] [Green Version]
  28. Cunningham, S.C.; Read, J. Comparison of Temperate and Tropical Rainforest Tree Species: Photosynthetic Responses to Growth Temperature. Oecologia 2002, 133, 112–119. [Google Scholar] [CrossRef]
  29. Franks, P.J.; Farquhar, G.D. A Relationship between Humidity Response, Growth Form and Photosynthetic Operating Point in C3 Plants. Plant. Cell Environ. 1999, 22, 1337–1349. [Google Scholar] [CrossRef]
  30. Lechowicz, M.J. Seasonality of Flowering and Fruiting in Temperate Forest Trees. Can. J. Bot. 1995, 73, 175–182. [Google Scholar] [CrossRef]
  31. Reich, P. Phenology of Tropical Forests: Patterns, Causes, and Consequences. Can. J. Bot. 1995, 73, 164–174. [Google Scholar] [CrossRef]
  32. Claverie, E.; Meunier, F.; Javaux, M.; Sadok, W. Increased Contribution of Wheat Nocturnal Transpiration to Daily Water Use under Drought. Physiol. Plant. 2018, 162, 290–300. [Google Scholar] [CrossRef]
  33. Novara, A.; Minacapilli, M.; Santoro, A.; Rodrigo-Comino, J.; Carrubba, A.; Sarno, M.; Venezia, G.; Gristina, L. Real Cover Crops Contribution to Soil Organic Carbon Sequestration in Sloping Vineyard. Sci. Total Environ. 2019, 652, 300–306. [Google Scholar] [CrossRef] [PubMed]
  34. Huete, A.; Didan, K.; Miura, T.; Rodriguez, E.P.; Gao, X.; Ferreira, L.G. Overview of the Radiometric and Biophysical Performance of the MODIS Vegetation Indices. Remote Sens. Environ. 2002, 83, 195–213. [Google Scholar] [CrossRef]
  35. Chandrasekar, K.; Sesha Sai, M.V.R.; Roy, P.S.; Dwevedi, R.S. Land Surface Water Index (LSWI) Response to Rainfall and NDVI Using the MODIS Vegetation Index Product. Int. J. Remote Sens. 2010, 31, 3987–4005. [Google Scholar] [CrossRef]
  36. Sun, Z.; Wang, X.; Zhang, X.; Tani, H.; Guo, E.; Yin, S.; Zhang, T. Evaluating and Comparing Remote Sensing Terrestrial GPP Models for Their Response to Climate Variability and CO2 Trends. Sci. Total Environ. 2019, 668, 696–713. [Google Scholar] [CrossRef] [PubMed]
  37. Lin, B.; Jia, Z. Impacts of Carbon Price Level in Carbon Emission Trading Market. Appl. Energy 2019, 239, 157–170. [Google Scholar] [CrossRef]
Figure 1. The Chiayi County in Taiwan.
Processes 09 00895 g001
Figure 2. The betel nuts GPP spatial variability in the area of Chiayi County, Taiwan.
Processes 09 00895 g002
Figure 3. Representation of the GPP variability as a function of EVI (a), absorbed radiation (b,c), and evapotranspiration (d).
Processes 09 00895 g003
Table 1. Meteorological parameters of the Chiayi County.
Temperature (°C)Precipitation (mm)Radiation
(MJ m−2 month−1)
Relative Humidity
(%)
Monthly MeanMonthly MeanDaily MeanMonthly MeanMonthly Mean
January14.57144.024.64298.9481.6
February13.9666.142.36326.6281.21
Table 2. GPP, NEP, EVI, and Solar radiation means and variation coefficients during the detection period in Taiwan.
GPP
(gC m−2 month−1)
NEP
(gC m−2 month−1)
EVISolar Radiation
(MJ m−2)
January297.34 ± 62.55135.86 ± 28.810.47 ± 0.09298.94 ± 14.62
February307.7 ± 63.66141.10 ± 29.450.48 ± 0.08326.62 ± 5.52
March551.24 ± 108.83255.31 ± 50.680.49 ± 0.07498.60 ± 17.98
Variation
coefficient
20%20%16%3%
Table 3. GPP and NEP mean values in Taiwan and Italy.
TaiwanItaly
GPP
(gC m−2 month−1)
NEP
(gC m−2 month−1)
NEP
(%)
GPP
(gC m−2 month−1)
NEP
(gC m−2 month−1)
NEP
(%)
319.05145.2745219.080.436
Publisher’s Note: MDPI stays neutral with regard to jurisdictional claims in published maps and institutional affiliations.

