Article

Using Graphene-Based Grease as a Heat Conduction Material for Hectowatt-Level LEDs: A Natural Convection Experiment

Department of Refrigeration, Air Conditioning and Energy Engineering, National Chin-Yi University of Technology, No.57, Sec. 2, Zhongshan Rd., Taiping Dist., Taichung 411030, Taiwan
*
Author to whom correspondence should be addressed.
Processes 2021, 9(5), 847; https://doi.org/10.3390/pr9050847
Submission received: 18 March 2021 / Revised: 24 April 2021 / Accepted: 8 May 2021 / Published: 12 May 2021
(This article belongs to the Special Issue Advanced Technologies in Biohydrogen and Bioprocesses)

Abstract

:
In this study, a self-adjusting concentration of graphene thermal grease was developed to reduce the contact surface thermal resistance of 50 W light-emitting diodes (LEDs). The purpose was to identify an important type of heat conduction material with a high thermal conductivity coefficient, which can be applied to the contact surface of various high-heat sources or concentrated heat sources to achieve seamless heat transfer with an extremely low thermal resistance state. The contact heat conduction material conductivity reached the highest K value of 13.4 W/m·K with a 15 wt.% self-adjusting concentration of graphene grease. This material could continuously achieve a completely uniform and rapid thermal diffusion of heat energy. Therefore, we performed an analysis of chip-on-board light-emitting diodes (LEDs) with a highly concentrated heat source, which showed excellent heat dissipation under natural convection heat transfer. As such, this study achieved the natural convection mechanism and a heat sink volume thermal performance capacity of 473,750 mm3 for LEDs under 50 W, but those over 50 W require an enhanced forced convection solution and a heat sink volume thermal performance capacity between 473,750 mm3 and 947,500 mm3. If the heat source dissipation reaches 100 W, the volume capacity must be at least 947,500 mm3 for lighting equipment applications. In the experimental study, we also verified and analyzed the research data, including an analysis of the measured data, grease component wt.%, heat sink material selection, increase in heat sink volume, heat transfer path, and contact surface, a discrimination analysis of infrared thermal images, and an analysis of flow visualization, which were conducted to ensure quantitative and qualitative improvement, provide a mechanism for judging the technical performance, and provide research results to enable discussion.

1. Introduction

Light-emitting diode (LED) devices are an important energy-efficient, energy-saving, and safe light sources in use in the 21st century. The light source changes from blue to white light through phosphor, breaking through the conversion efficiency of traditional low-efficiency light sources and turning into low-energy, low-pollution, long-life, green energy, and diverse light sources. The importance and effectiveness of the thermal conductivity property of graphene grease stem from its suitability for the preparation of synthetic thermal interface materials (TIMs), as it increases heat transfer and reduces contact thermal resistance. The development of thermal interface materials with high thermal conductivity is very important for the thermal management and packaging of electronic equipment. The synthesis and the application of mineral oil-based non-curing thermal grease are more important. The measurement of thermal conductivity is based on the mixture of multilayer graphene as a filler. Graphene thermal grease shows unique heat penetration properties. The performance of thermal grease is also based on the commercial application. In terms of thermal conductivity, the performance of a non-curing graphene TIM is better than that of a general commercial thermal pad. To consider the latest progress in graphene application, Bidsorkhi et al. [1] discussed electronic thermal management in this field and presented a cost-effective lightweight 3D porous graphene-based aerogel for EM wave absorption, constituted by a polyvinylidene fluoride (PVDF) polymer matrix filled with graphene nanoplatelets (GNPs), showing that the thermal, electrical, and mechanical properties of the aerogel can be tuned through proper selection of the processing temperature, controlled at either 65 °C or 85 °C. The produced GNP-filled aerogels were characterized by exceptional EM properties, allowing the production of absorbers with 9.2 GHz and 6.4 GHz qualified bandwidths with reflection coefficients below −10 dB and −20 dB, respectively. Depending on the process parameters, the possibility of obtaining water-repellent aerogel composites was shown, thus preventing their EM and thermal properties from being affected by environmental humidity and allowing the realization of an EM absorber with a stable response. Liang et al. [2] utilized reduced graphene oxide (RGO) as a substrate, and a three-dimensional (3D) hetero-structured reduced graphene oxide–hexagonal boron nitride (RGO-hBN) stacking material was constructed by self-assembly of hBN nanosheets on the surface of the RGO with the assistance of silicone thermal grease as a binder. Compared with hBN nanosheets, 3D RGO-hBN more selectively improves the thermal conductivity properties of silicone thermal grease, which is attributed to the introduction of graphene and its phonon-matching structural characteristics. RGO-hBN/silicone thermal grease with lower viscosity exhibits higher thermal conductivity, lower thermal resistance, and a better thermal management capability than hBN/silicone thermal grease at the same filler content. It is feasible to develop polymer-based thermal interface materials with good thermal transport performance for heat removal for modern electronics by utilizing graphene-supported hBN as the filler at low loading levels. Mohamed et al. [3] studied the possibility to employ multiwalled carbon nanotubes (MWCNTs) and graphene nanosheets (GNS) as additives for lubricants. Calcium grease (CG), without chemical modification, was selected as the base for the study. Hybrid calcium nano grease (HCNG) compositions with different percentages of MWCNT/GNS (0.5, 1, 2, and 3 wt.%) in a ratio of 1:1 were prepared, and their rheological and tribological properties were investigated. The microstructures of the prepared nano greases and nano-additives were characterized using state-of-the-art equipment. The results showed that, by adding MWCNT/GNS, the CG exhibited a considerable reduction in friction and wear. As the nano-additives were increased, the tribological performance and the rheological properties improved. A consistent NG was obtained with 2 wt.% additives. The shear stress, viscosity, and dropping point temperature increased with the amount of nano-additives, while there was no effect on the work penetration. Naghibi et al. [4] provided the synthesis and thermal conductivity measurements of non-curing thermal paste, i.e., grease, based on mineral oil with a mixture of graphene and few-layer graphene flakes as the fillers. The graphene thermal paste exhibited a distinctive thermal percolation threshold, with the thermal conductivity revealing a sublinear dependence on the filler loading. This behavior contrasts with the thermal conductivity of curing graphene TIMs, based on epoxy, where superlinear dependence on the filler loading is observed. The performance of the thermal paste was benchmarked against top-of-the-line commercial thermal pastes. The non-curing graphene TIMs outperformed the best commercial pastes in terms of thermal conductivity, at a substantially lower filler concentration of ϕ = 27 vol.%. Phuong et al. [5] improved the thermal conductivity of silicone thermal grease without deteriorating its conformability via exploitation of the outstanding thermal conductivity and mechanical flexibility/ductility of graphene materials. Silicone thermal greases containing GNPs were prepared using the high-energy ball milling process. SEM images proved that the GNPs were well dispersed in the base grease. The thermal conductivity of the thermal greases was investigated and presented. The GNPs were efficient for thermal conductivity enhancement of the thermal grease. The highest thermal conductivity enhancement of up to 59% was obtained with the grease containing 0.75 vol.% GNPs. The enhancement could be attributed to the high thermal conductivity of GNPs, the good compatibility, and the uniform dispersion of GNPs in the thermal grease. The thermal conductivity of the thermal grease with a higher GNP concentration of 1 vol.% was decreased due to the formation of GNP clusters. The thermal conductivity enhancement of the thermal grease concerns the Rk between GNPs and the grease matrix. The best way to improve the thermal conductivity of thermal grease is to reduce the Rk. Yu et al. [6] prepared and studied two kinds of silicone grease containing graphene nanoplatelets or reduced graphene oxide, and their thermophysical properties were investigated. When the volume fraction was 1%, the reduced graphene oxide was the most effective additive to enhance the heat transfer properties of silicone, and the graphene nanoplatelets were slightly inferior to the former. Meanwhile, when the concentration was enhanced, the viscosity of the silicone grease containing reduced graphene oxide became very large due to its rich pore structure. Graphene nanoplatelets are efficient for enhancing the thermal conductivity of silicone grease, and they provided a thermal conductivity enhancement up to a certain load. This experimental result is in excellent agreement with a recently developed theoretical model analyzing the thermal conductivity of isotropic composites containing randomly embedded GNPs, and it validates that graphene is an effective thermally conductive filler that gives grease high thermal conductivity with low filler content. Junaid et al. [7] developed light emissions from graphene-based active materials that can provide an application platform for the development of two-dimensional (2D), flexible, thin, and robust light-emitting sources. The exceptional structure of Dirac’s electrons in graphene and massless fermions, and the linear dispersion relationship with ultra-wideband plasmon and tunable surface polarities allow numerous applications in optoelectronics and plasmonics. Recent developments in graphene-based light-emitting devices have been evaluated in different aspects, such as thermal emission, electroluminescence, and plasmon-assisted emission. Theoretical investigations along with experimental demonstrations in the development of graphene-based light-emitting devices have also been reviewed and discussed. Moreover, graphene-based light-emitting devices have also been addressed from the perspective of future applications, such as optical modulators, optical interconnects, and optical sensing. Chang et al. [8] developed ultra-thin graphene with a 2D atomic arrangement that has special physical properties such as low resistivity, which shows excellent electrical properties. Furthermore, this type of graphene has excellent mechanical strength, thermal conductivity, high transmittance, and flexibility. Hsiao et al. [9] enhanced the surface emissivity and molecular fan coating on heat dissipation units, which can decrease the equilibrium junction temperature while functioning as a dielectric layer with a high breakdown voltage. The heat dissipation performance of the molecular fan coating applied on LED devices showed that the coated 50 W LEDs provided enhanced cooling of 20% at constant light brightness. Kim et al. [10] provided an LED module at a stable temperature, in which the heat dissipation of the coated LED module was increased by 8–16% compared to that without a coating, and the thermal conductivity was increased by 3% after adding graphene. Kang et al. [11] fabricated core–shell LEDs of InGaN/GaN with a conical array using a transparent conduction electrode with highly uniform multilayer graphene. This novel electrode showed excellent optical, structural, performance, and conduction properties. In the study of Yin et al. [12], a graphene film was transferred to the LED substrate surface; the experimental results showed that the LED junction temperature of the device with a graphene film transferred to the alumina ceramic substrate surface was approximately 2.2 °C lower. The thermal resistance was low with a value of 3.11 K/W compared with that of a normal device. Thus, a graphene film can improve the thermal conductivity ability of an alumina ceramic substrate. Lay et al. [13] provided a graphene nanoplatelet coating used as a functionalized surface to enhance the evaporation rate of micro-spray cooling for LEDs. The enhancement of evaporation led to an enormous temperature reduction of 61.3 °C. The performance of the LEDs was greatly enhanced, as a maximum increase in illuminance of 25% was achieved. Kim et al. [14] studied nano greases that were made by adding carbon nanotubes and graphene to thermal grease to enhance heat dissipation. The researchers found that the thermal conductivities of the carbon nanotube grease and the graphene grease increased to 16% at 0.75 wt.% of the nanoparticles compared with pure thermal grease. The cooling performances of the LED packages with applied carbon nanotube paste and graphene grease were enhanced by the LED chip, which reduced the temperatures to 7.5 °C and 5.5 °C at 0.75 wt.% of nanoparticles. Colaco et al. [15] developed a prototype design that includes configuration and placement of a 36 W multichip LED package, RGBW, and single-die amber LEDs in a 5 × 3 array on a heat sink. The temperature of 72 °C at the LED chip base plate was reduced to 32.1 °C through heat dissipation on the fin heat sink surface to improve the longevity of the multicolor-based LED luminaire. Kim et al. [16] showed that a composite with 3 wt.% graphene oxide (GO) had the highest storage modulus and glass transition temperature. The thermal conductivities of the composites with graphene-based filters were enhanced compared with those that had no fillers. The 3 wt.% GO/epoxy composite had the highest thermal conductivity, which was nearly twice that of the neat epoxy resin. Ding [17] developed an automatic control cooling system for high-power LEDs that detects the temperature of the LED substrate, fin, and environment to control the wind speed of a fan, thereby effectively reducing the node temperature and substrate temperature of the LEDs. Lin et al. [18] presented a new evaluation method of thermal resistance of LED packages. This was based on the electrical test method and time constant theory. Under natural convection, a radiator is used to calculate the temperature difference and thermal transient response from node to shell and measure the thermal resistance of the LED package. Wang et al. [19] examined the performance of a straight-fin aluminum and an aluminum sink with a heat pipe using a numerical simulation. The results showed that the heat dissipation effect can be enhanced by increasing the height of the sink and the number of fins. By using a heat pipe sink, the average junction temperature of LEDs was reduced to 8 °C compared with that of a straight-fin aluminum sink. Janicki et al. [20] investigated the importance of accurate measurement of thermal resistance for node temperature in LEDs. According to different power consumption and cooling conditions, LED temperature data were recorded and plotted. Furthermore, different welding methods were used to determine the thermal resistance connected to the shell. Kang et al. [21] prepared nano thermal grease by mixing copper nano powder, which is used as a heat transfer medium in thermal grease; in this type of thermal conduction material, the silicon oil thermal conductivity was improved by 4.5 W/m·K over the silicon base, and the upward trend of thermal conductivity increased steadily up to a maximum of 10–15 vol.%.

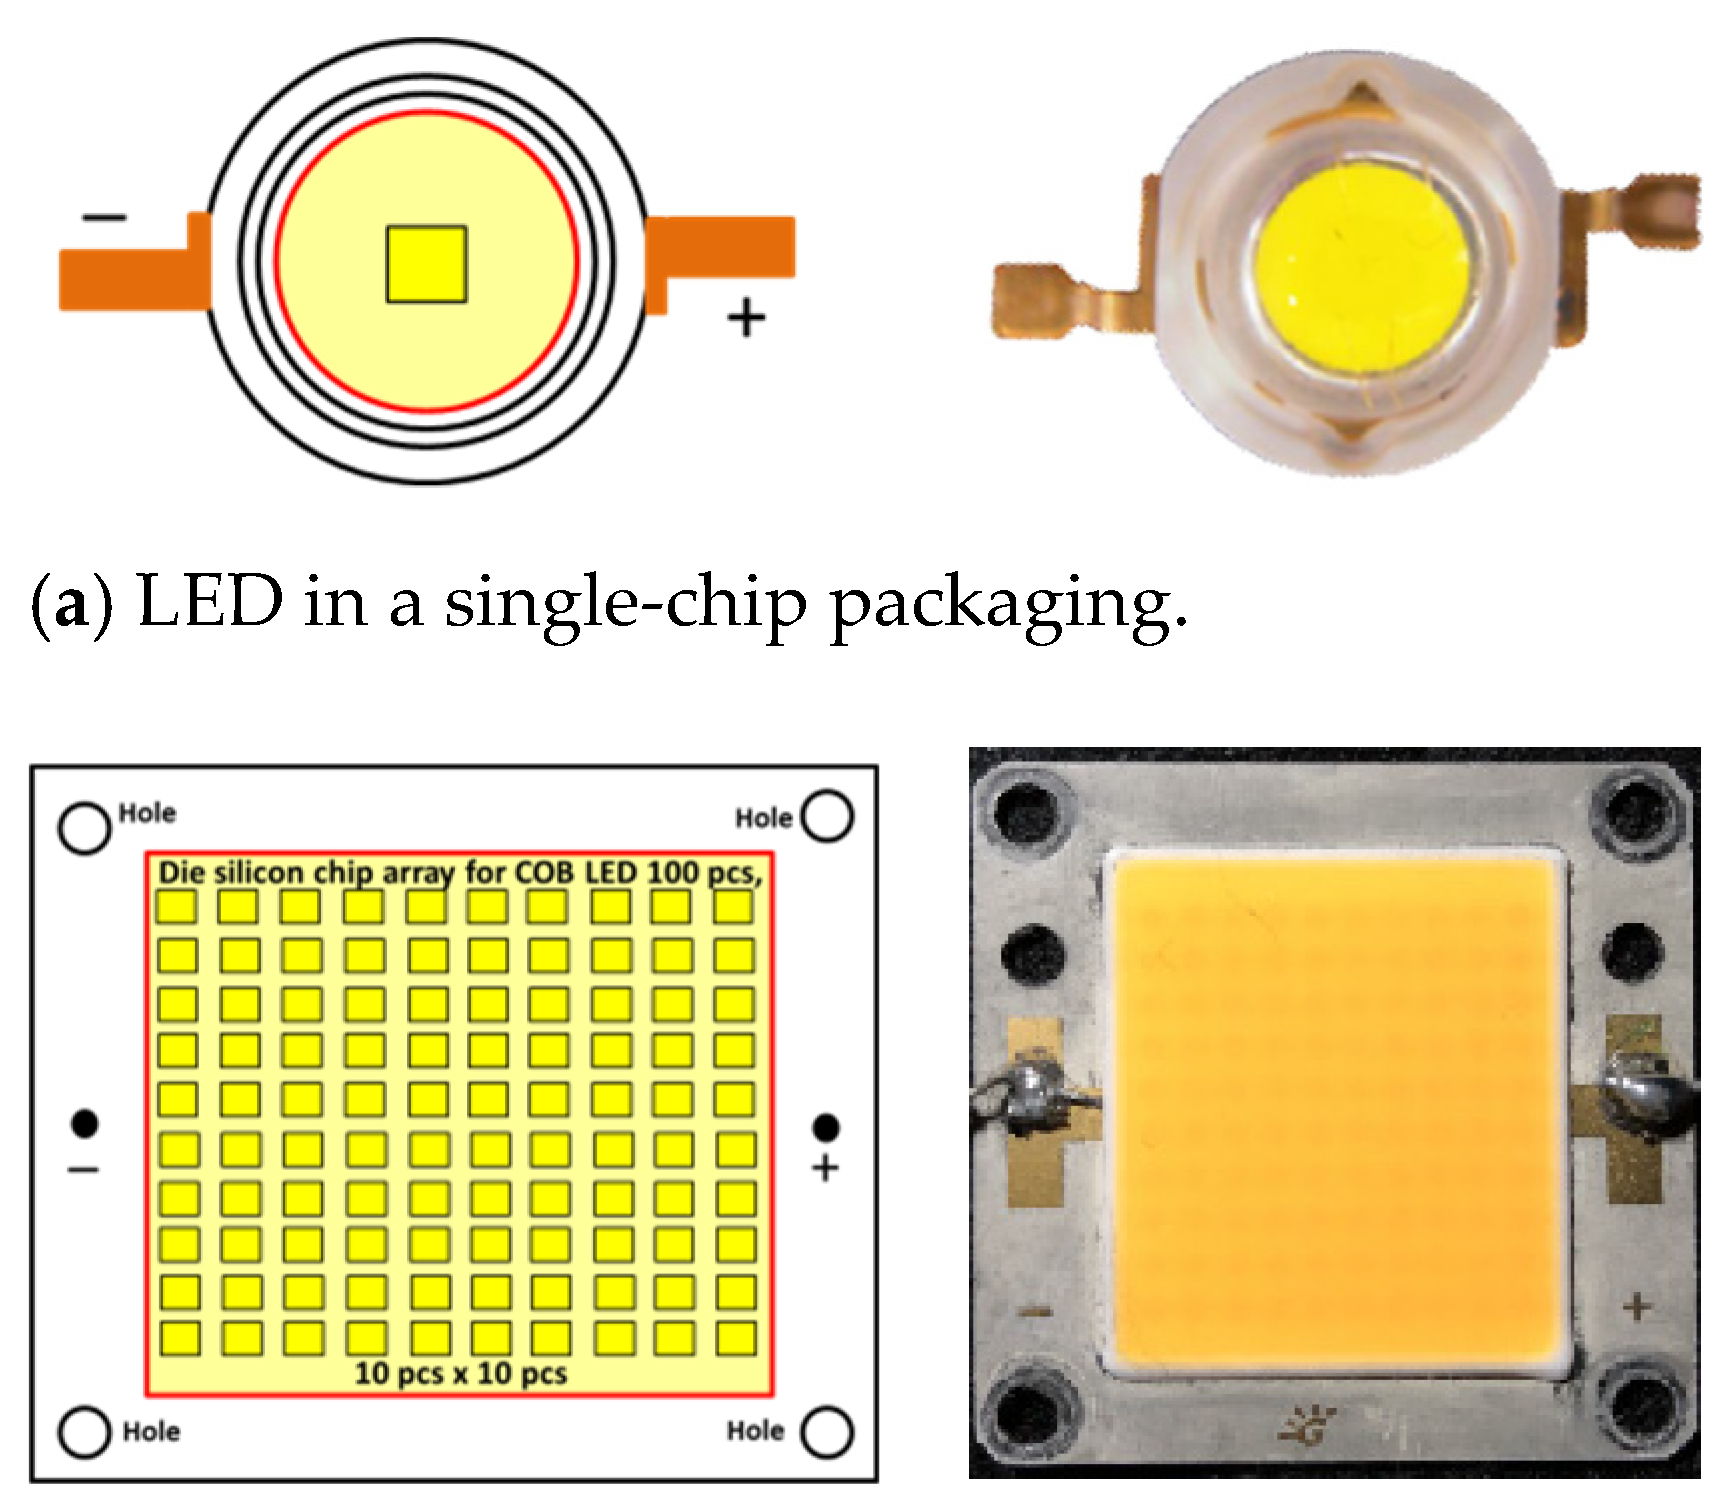
2. Single-Chip and Chip-on-Board LEDs

Single-chip LEDs come in a single InGaN/GaN SiC chip packaging, as shown in Figure 1a. Chip-on-board LEDs come in a multichip InGaN/GaN package, as shown in Figure 1b. The principle of luminescence is the same because of the direct conversion of electrical energy into light and heat energy. The positive and negative ends of the semiconductor (type III–V) are applied with a forward bias voltage. The electron and hole charges are combined, and the remaining energy is released in the form of photons when the current flows through. According to the different material wavelengths, the photons can generate the wavelength of blue light, and the light particles can produce white light through phosphor. The chip-on-board LED is a type of integrated circuit packaging mode in which chips are directly stacked on a circuit board or substrate and then sealed immediately after wiring. The chip-on-board packaging combines three basic processes: chip adhesion, wire connection, and application of glue sealing technology, as shown in Table 1.

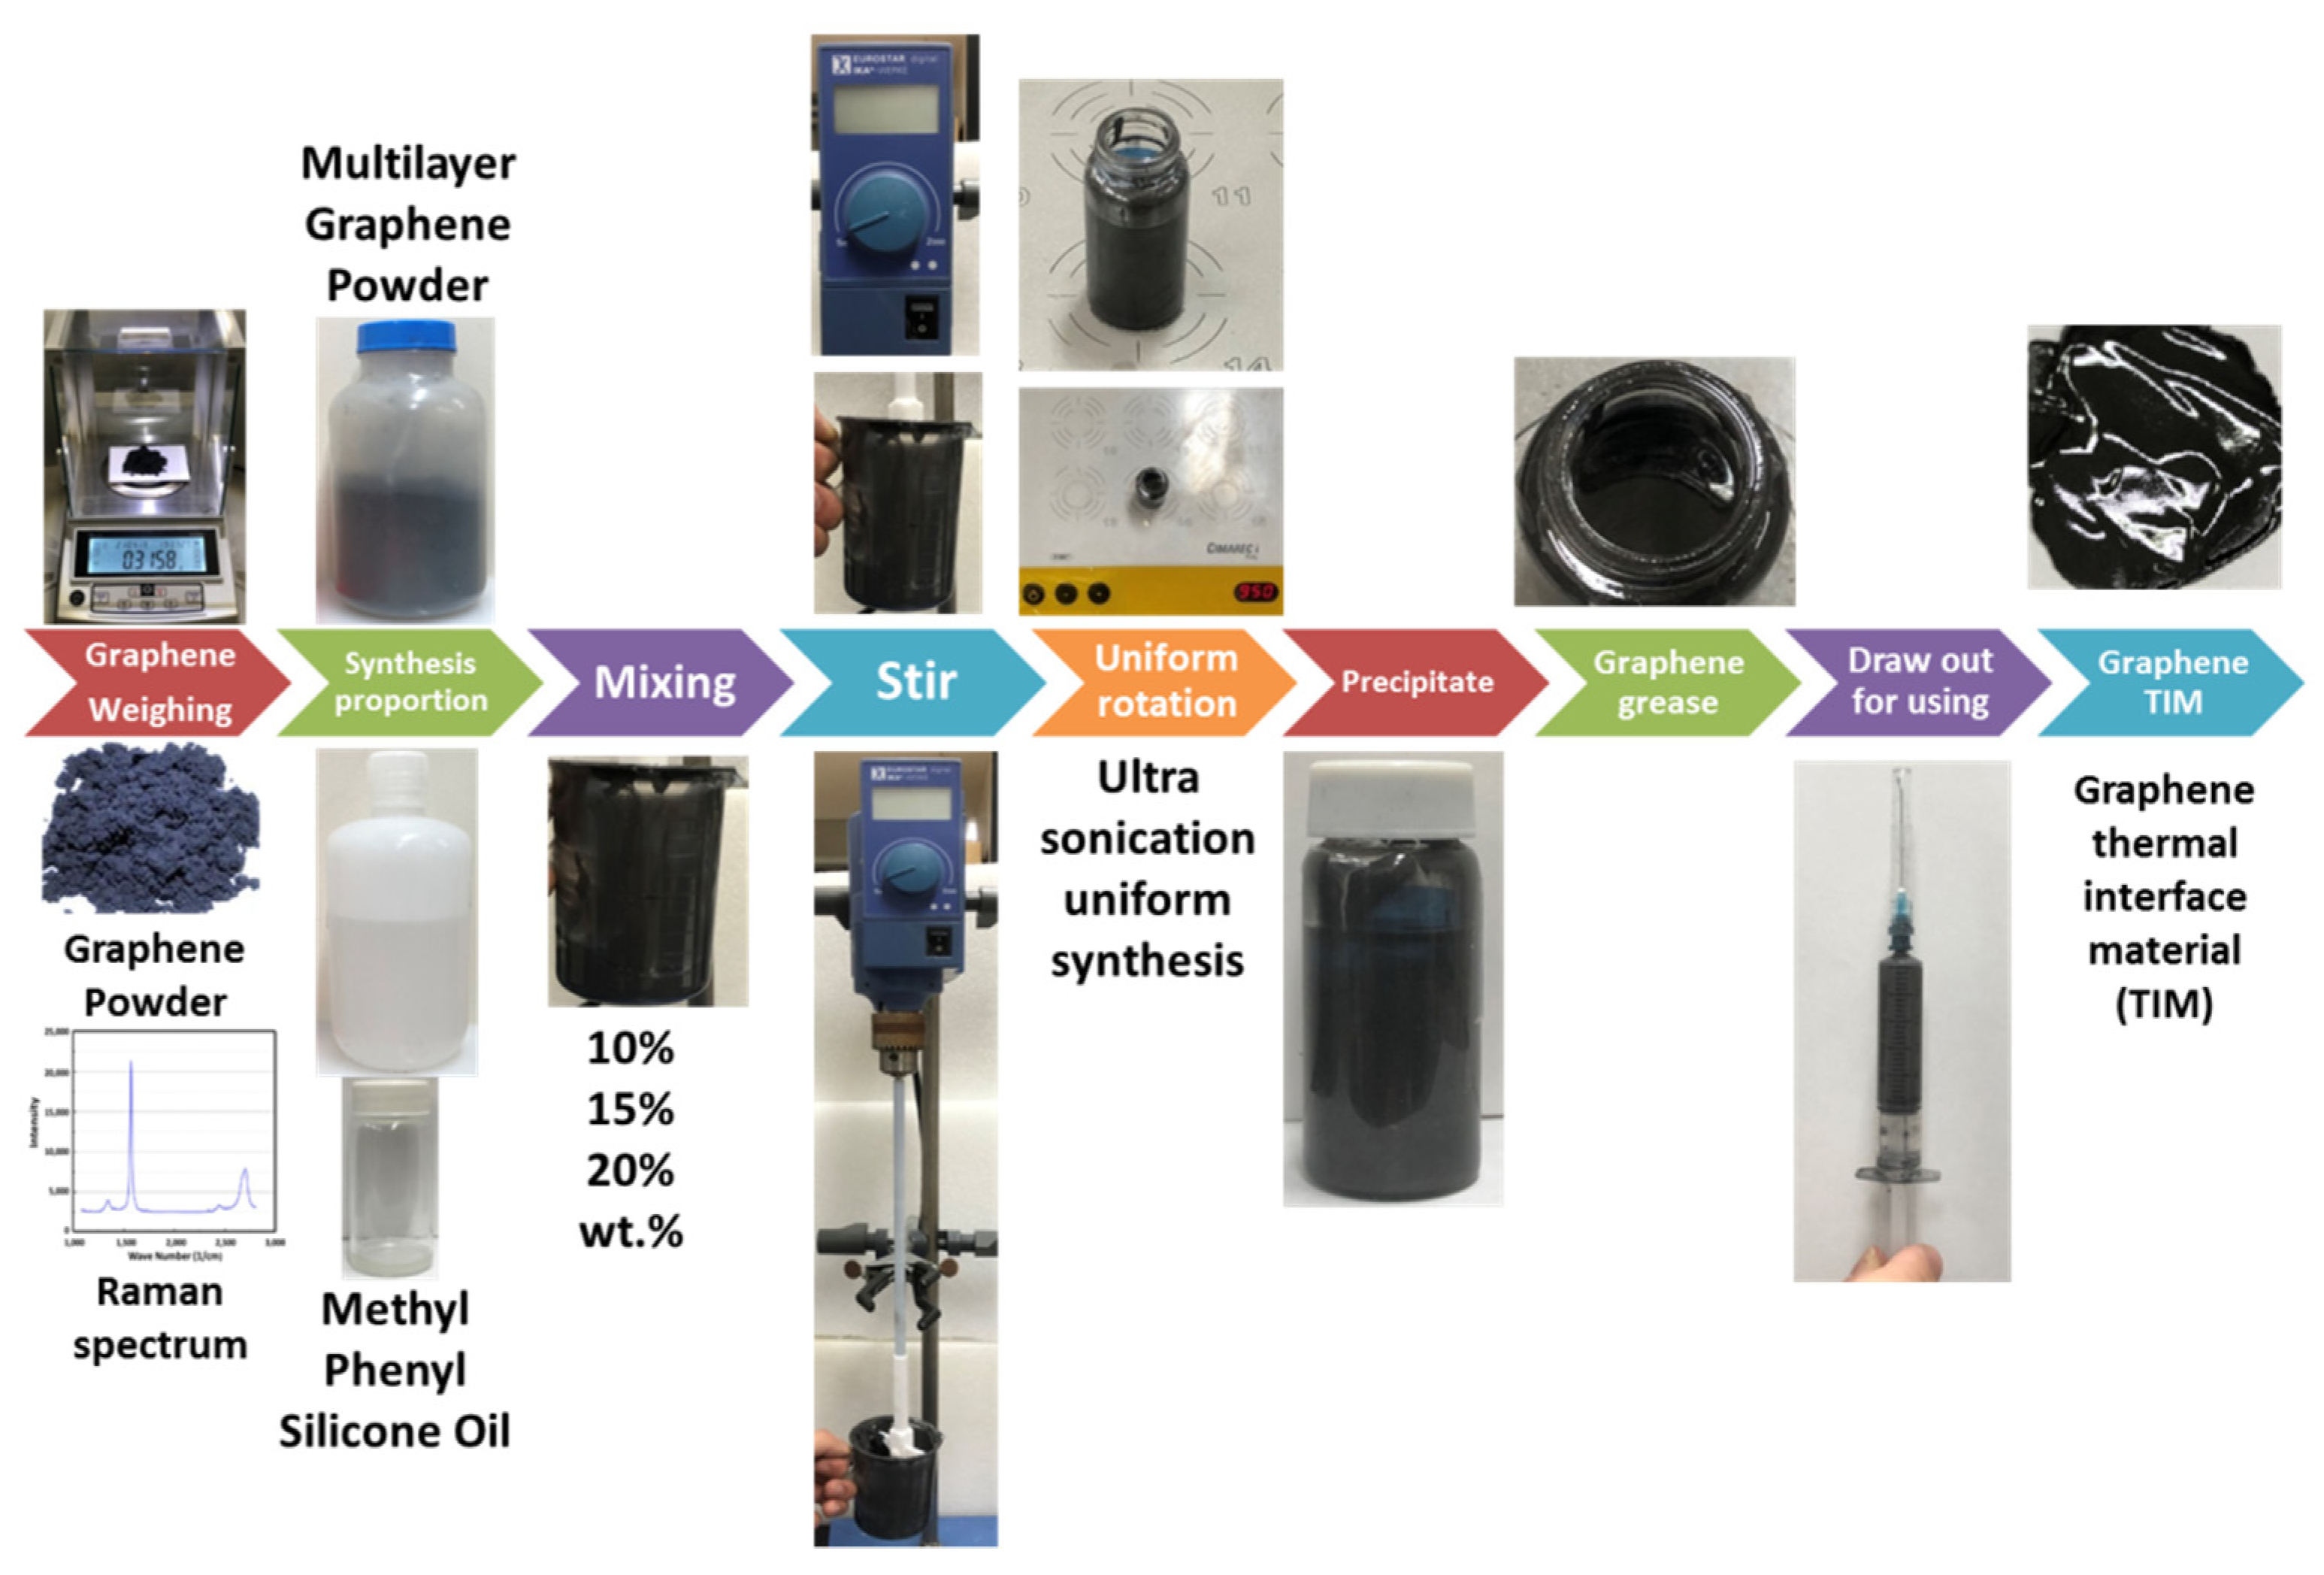
3. Graphene Powder and Graphene Thermal Grease

To improve heat dissipation in the natural convection heat transfer of multichip chip-on-board LEDs, a graphene powder (multilayer) material was prepared using graphene with high thermal conductivity. Its material characteristics included good stability, high thermal conductivity, good heat resistance, and good electrical insulation. Furthermore, this material’s high thermal conductivity can be used to produce thermal grease. The relationship between the wavelength and the strength of the material was understood by analyzing the Raman spectrum specification of graphene.
The experimental synthesis of graphene thermal grease was conducted as shown in Figure 2. The high-temperature methyl phenyl silicone oil used had the following parameters: molecular formula, (C7H8OSi)n; density, 1.102 g/mL at 25 °C; vapor density, >1 kg/m3 (versus air); vapor pressure, <5 mmHg at 25 °C. It was modulated into graphene thermal grease to form a contact surface conductivity material. Various concentrations of graphene thermal grease were mixed in the range of 10, 15, and 20 wt.%, which were evenly applied as the thermal interface material between the chip-on-board LED substrate and the fin heat sink. A type T thermocouple wire was pressed onto the contact interface, and then the chip-on-board LED was locked and attached to the heat sink using a torque wrench tool for experimental testing.

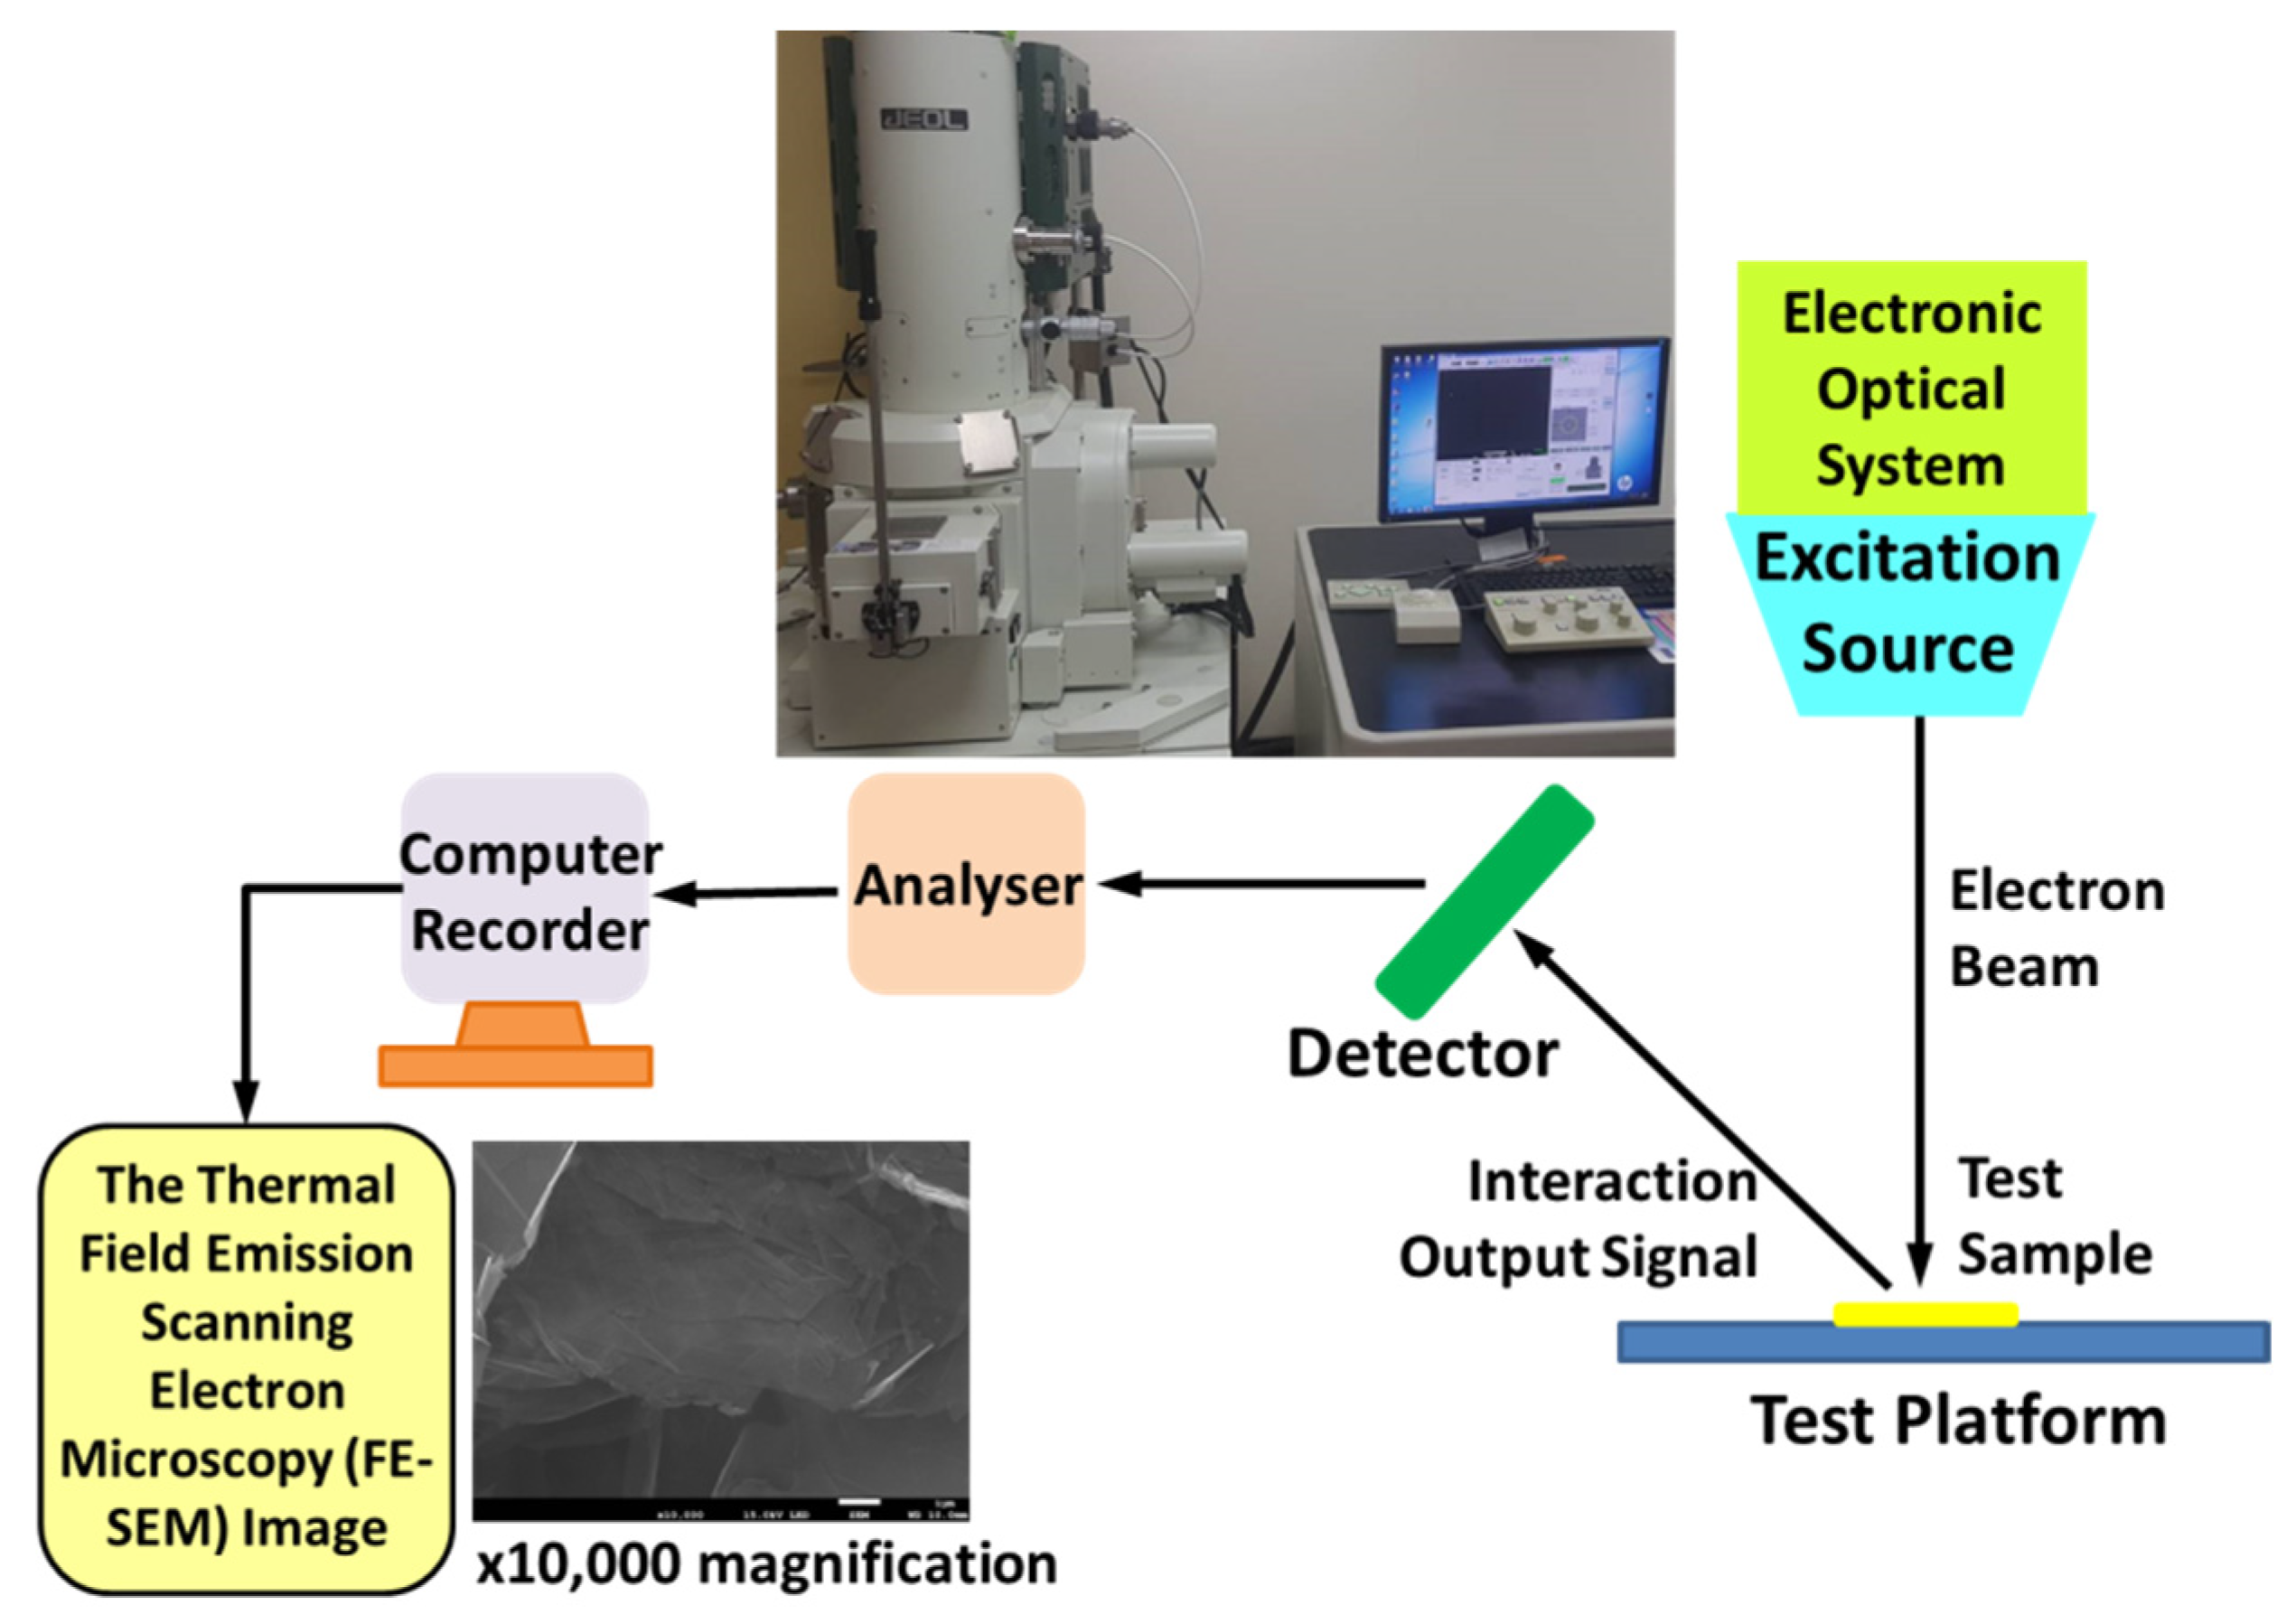
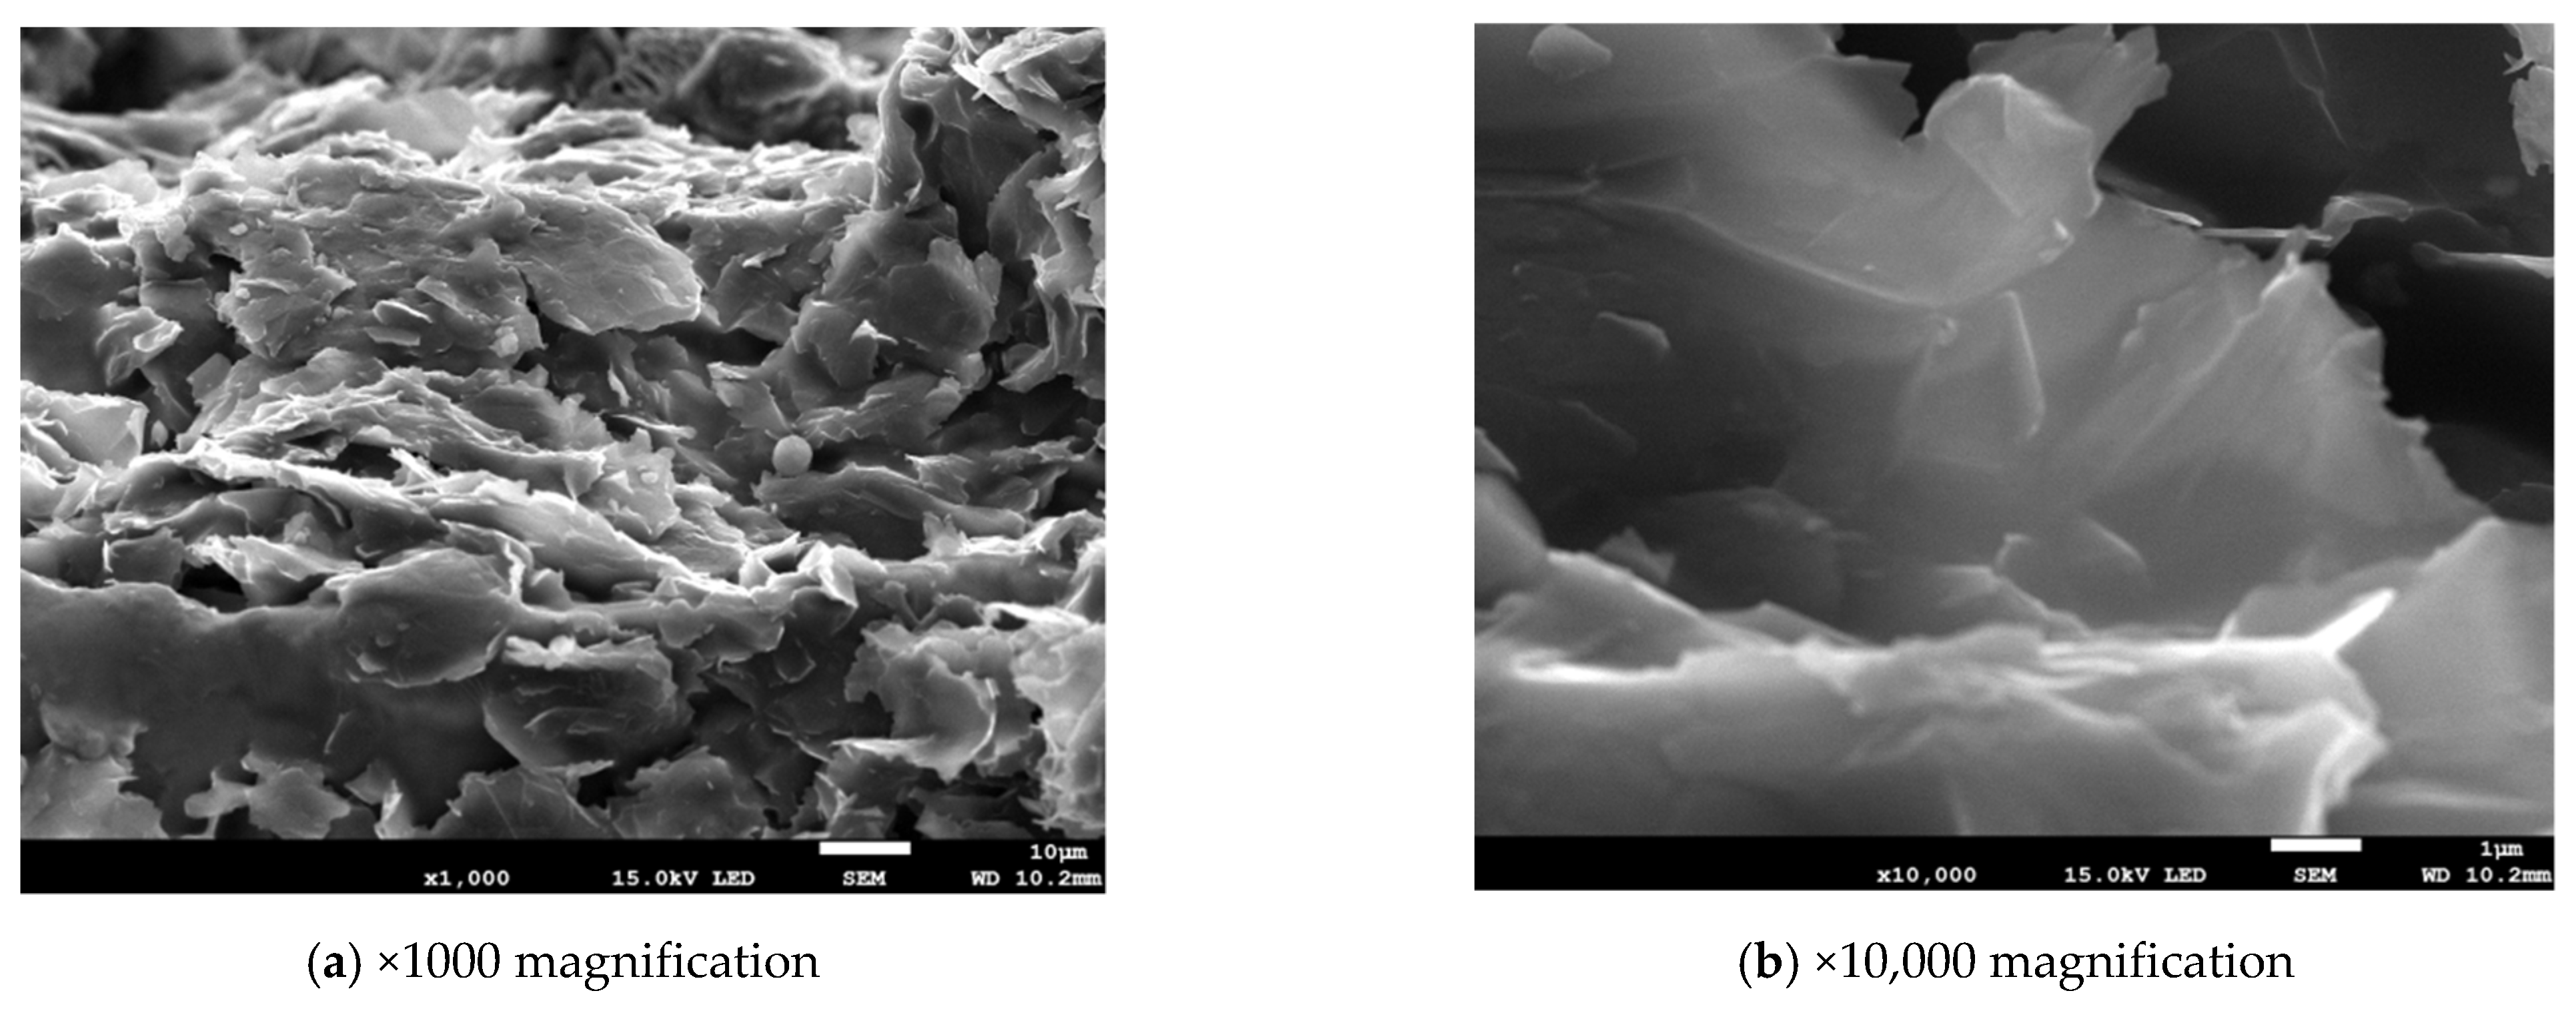
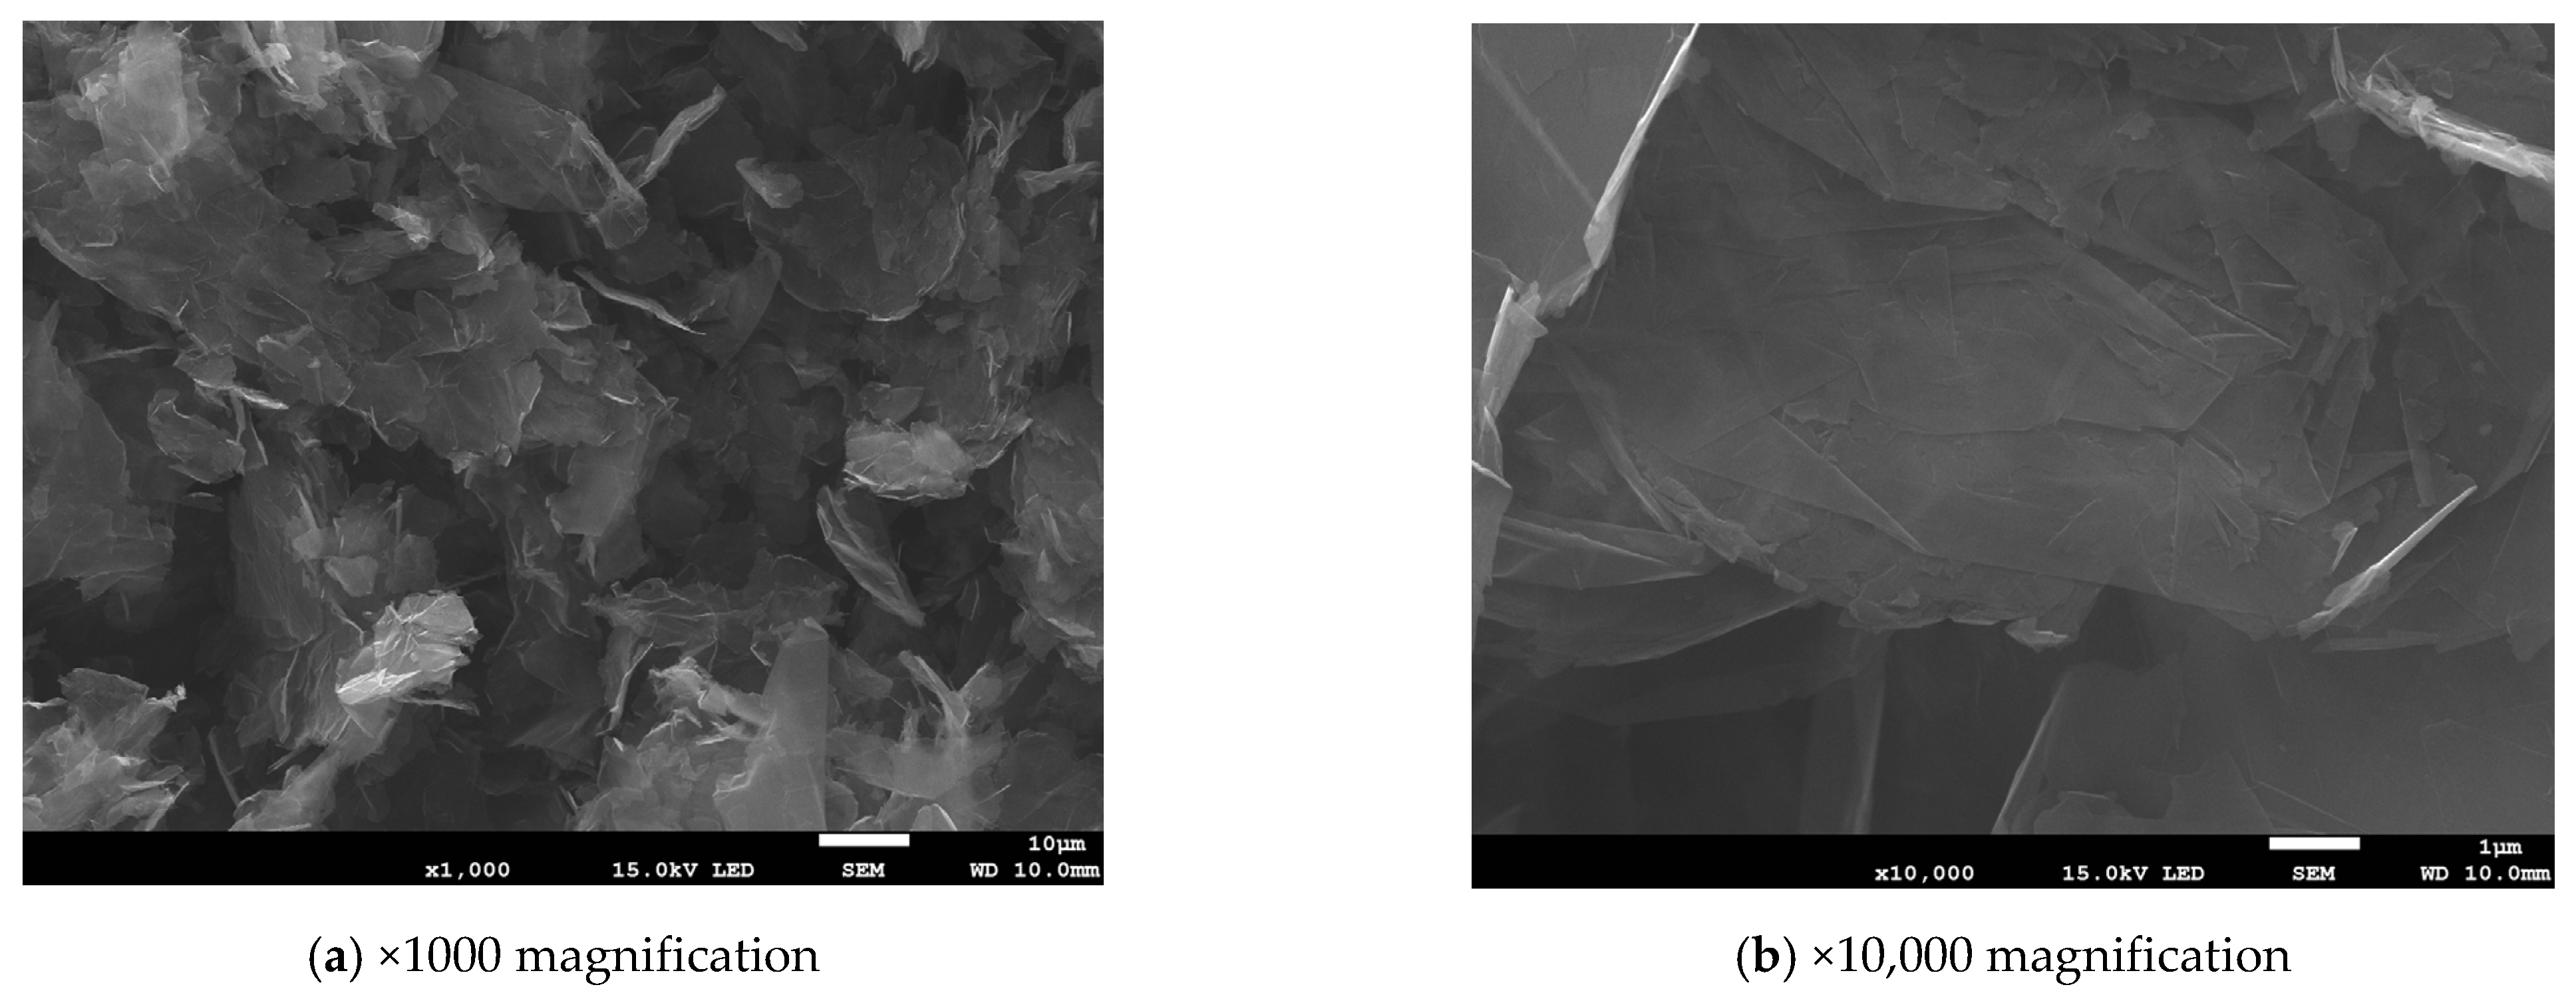
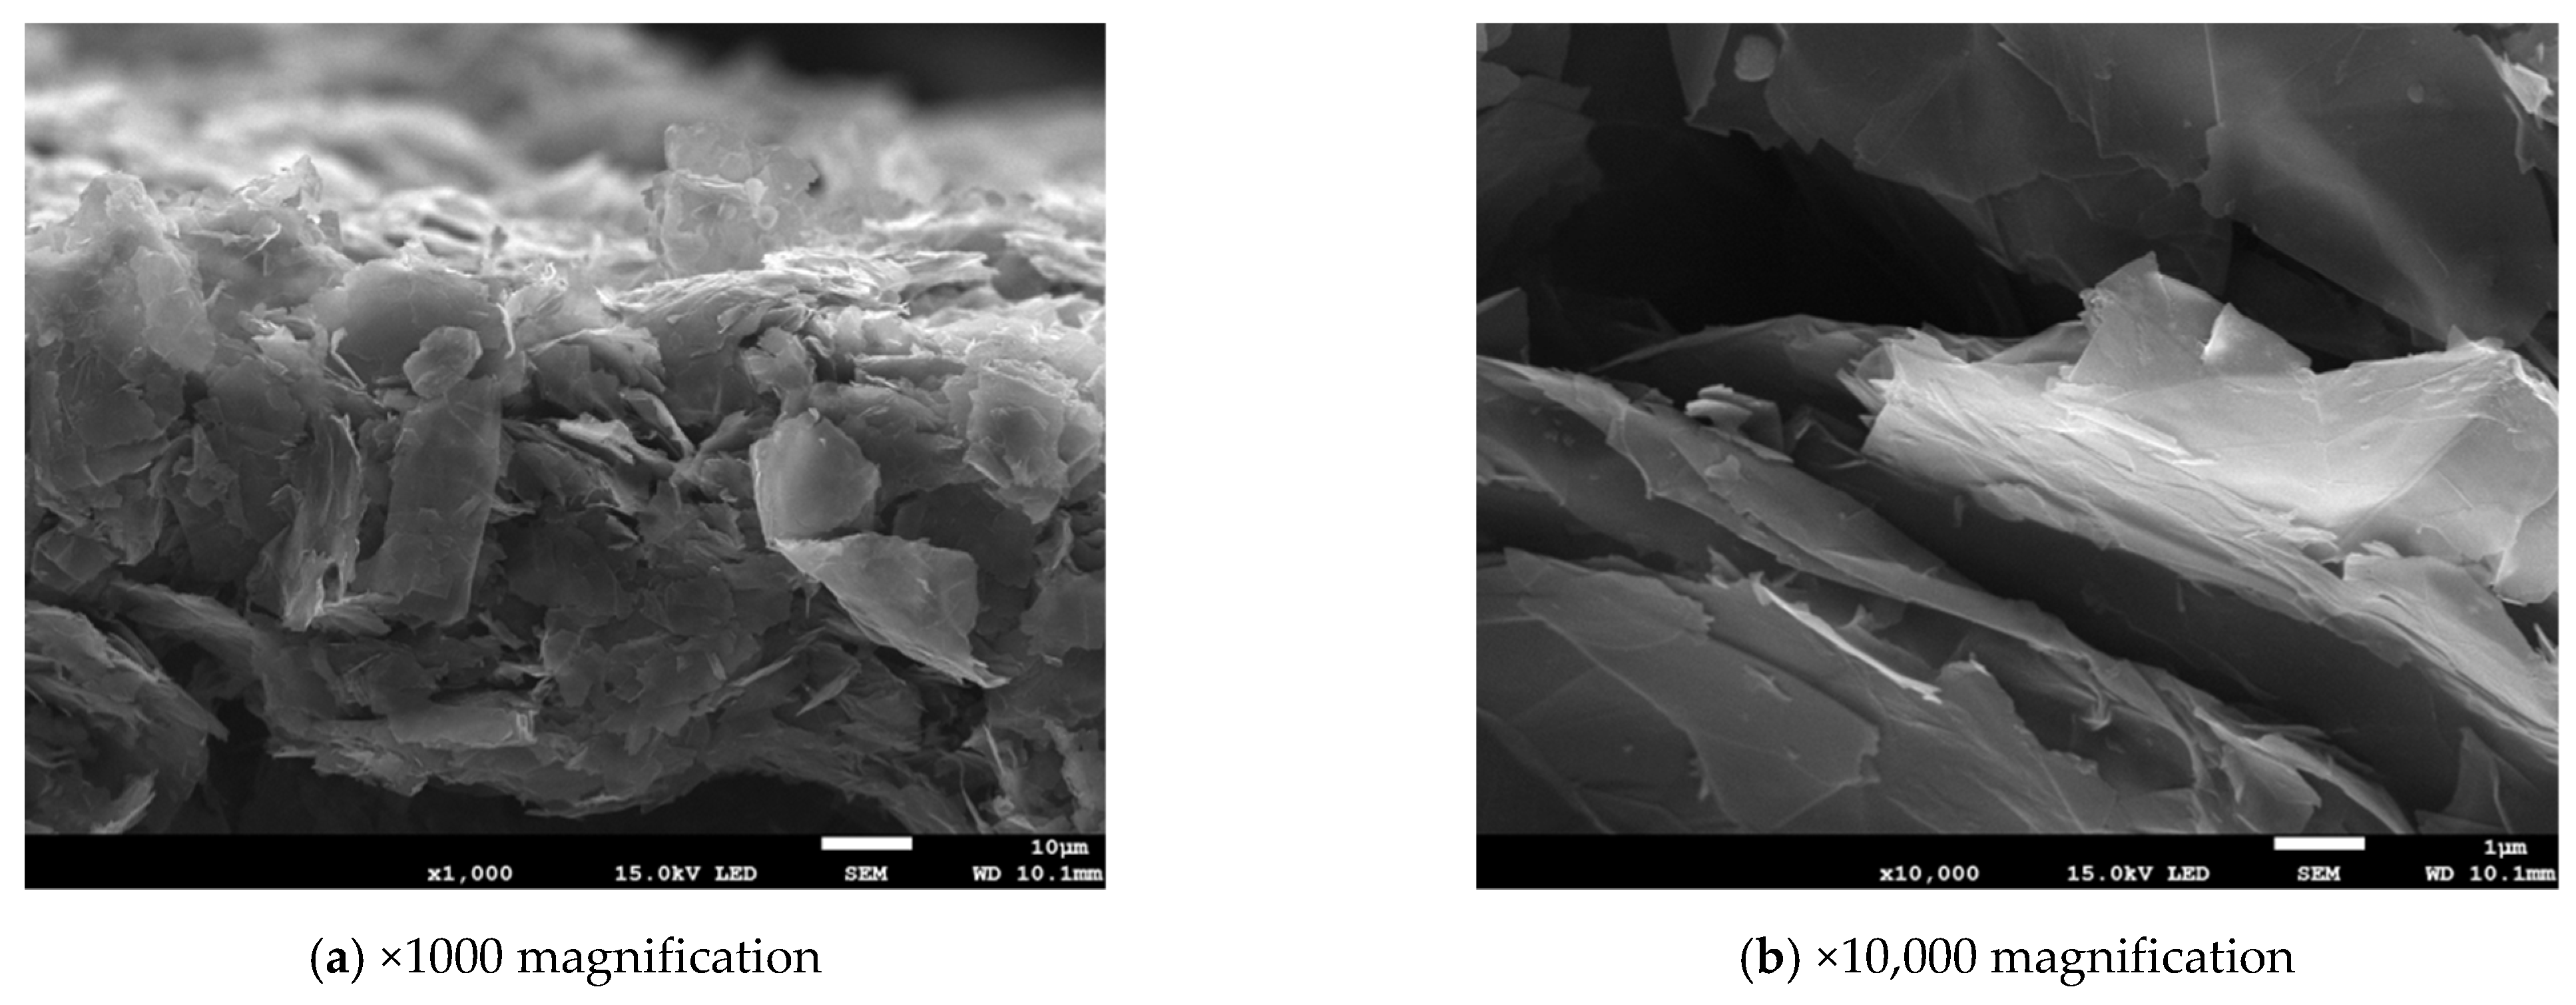
4. Thermal FE-SEM Images for Graphene Compositions

With the development of materials science, thermal FE-SEM has been increasingly used to study the microstructure and properties of materials. SEM is mainly used to observe the surface morphology of objects, and its test sample is relatively simple, with a resolution on the nanometer scale. Observing the surface morphology of materials is easy and can be widely conducted. In this operation, an electron cavity generates a high-energy electron beam via thermal dissociation or the field emission principle. After passing through the electromagnetic lens, the electron beam can be focused on the test sample. A scanning coil is used to deflect the electron beam and scan the surface of the test sample in 2D space. When the electron beam interacts with the test sample, various signals are generated, such as secondary electrons, backscattered electrons, absorption electrons, and characteristic X-rays. In general, a thermal FE-SEM detection system is mainly used for secondary electron and backscattered electron imaging. These signals can be imaged and observed after amplification. Thermal FE-SEM is an important analytical tool in the field of material microstructure analysis that combines high-magnification image observation with an energy-dispersive spectroscopy system, making it appropriate for analyzing materials in this research.
In this study, a JEOL JSM-7100F FE-SEM was used to produce images of the sample surface by scanning it with a focused electron beam. This thermal FE-SEM had the following specifications: resolution (sample dependent), 1.2 nm at 30 kV and 3.0 nm at 1 kV; magnification, ×10 to ×1,000,000; accelerating voltage, 0.2 kV to 30 kV; probe current, 200 nA maximum; electron gun type, in-lens thermal electron gun; objective lens type, conical; specimen stage, five-axis motor controlled specimen stage; XY-direction, 70 mm to 50 mm; Z-direction, 3 mm to 41 mm; tilt, −5 to +70 degrees; rotation, 360 degrees. The test sample can be observed in high-vacuum or low-vacuum, wet conditions, at a wide range of low or high temperatures, as shown in Figure 3.
The microstructure of the graphene grease was observed using the thermal FE-SEM, and the basic detection steps were as follows:
(1)
The graphene thermal grease was coated on a metal surface such as copper, aluminum, or stainless steel. As the temperature of the thermal FE-SEM scanning was between 150 °C and 180 °C, a metal material could be used as the test sample coating substrate.
(2)
The graphene thermal grease was applied on the surface of the test metal sample and baked until it was dry, oil-free, and water-free to avoid damaging the thermal FE-SEM lens equipment due to excessive oil and water evaporation.
(3)
The test example was placed in a platinum coating machine, and vacuum operation was started (10−3 torr). The upper cover of the machine was filled with a minute quantity (<0.01 g) of platinum powder. During the vacuum process, the platinum powder was naturally sprayed on the test example. After being in vacuum for 30 to 40 min, the platinum coating machine ceased operation, and the test sample was taken to the FE-SEM machine for SEM analysis to display the results of FE-SEM and so that the microstructure could be clearly seen.
(4)
The samples of coated graphene grease were placed under the electron microscope to observe their composition and structure and examine the possible average thickness of the material at a microscale.
The thermal FE-SEM image compositions for 10% graphene grease at ×1000 and ×10,000 magnification are shown in Figure 4. The thermal FE-SEM image compositions for 15% graphene grease at ×1000 and ×10,000 magnification are shown in Figure 5. The thermal FE-SEM image compositions for 20% graphene grease at ×1000 and ×10,000 magnification are shown in Figure 6. The results of FE-SEM show that the grease-like structure of the graphene thermal material is composed of flakes, some of which are stacked flakes, which shows that the original material of graphene is multilayer graphene, and it maintains the combination of flakes and multilayer after the methyl phenyl silicone oil is added and the fused ratio is 15 wt.%. The results show that the shape of the wt.% graphene thermal grease is a flat sheet and also has the closest contact, which reduces the heat transfer resistance and enables very good heat dissipation. The shape of the 10 and 20 wt.% graphene thermal greases presents irregular sheet stacking in all directions, which creates micropores, increases the heat resistance, and causes temperature increases, not heat dissipation.

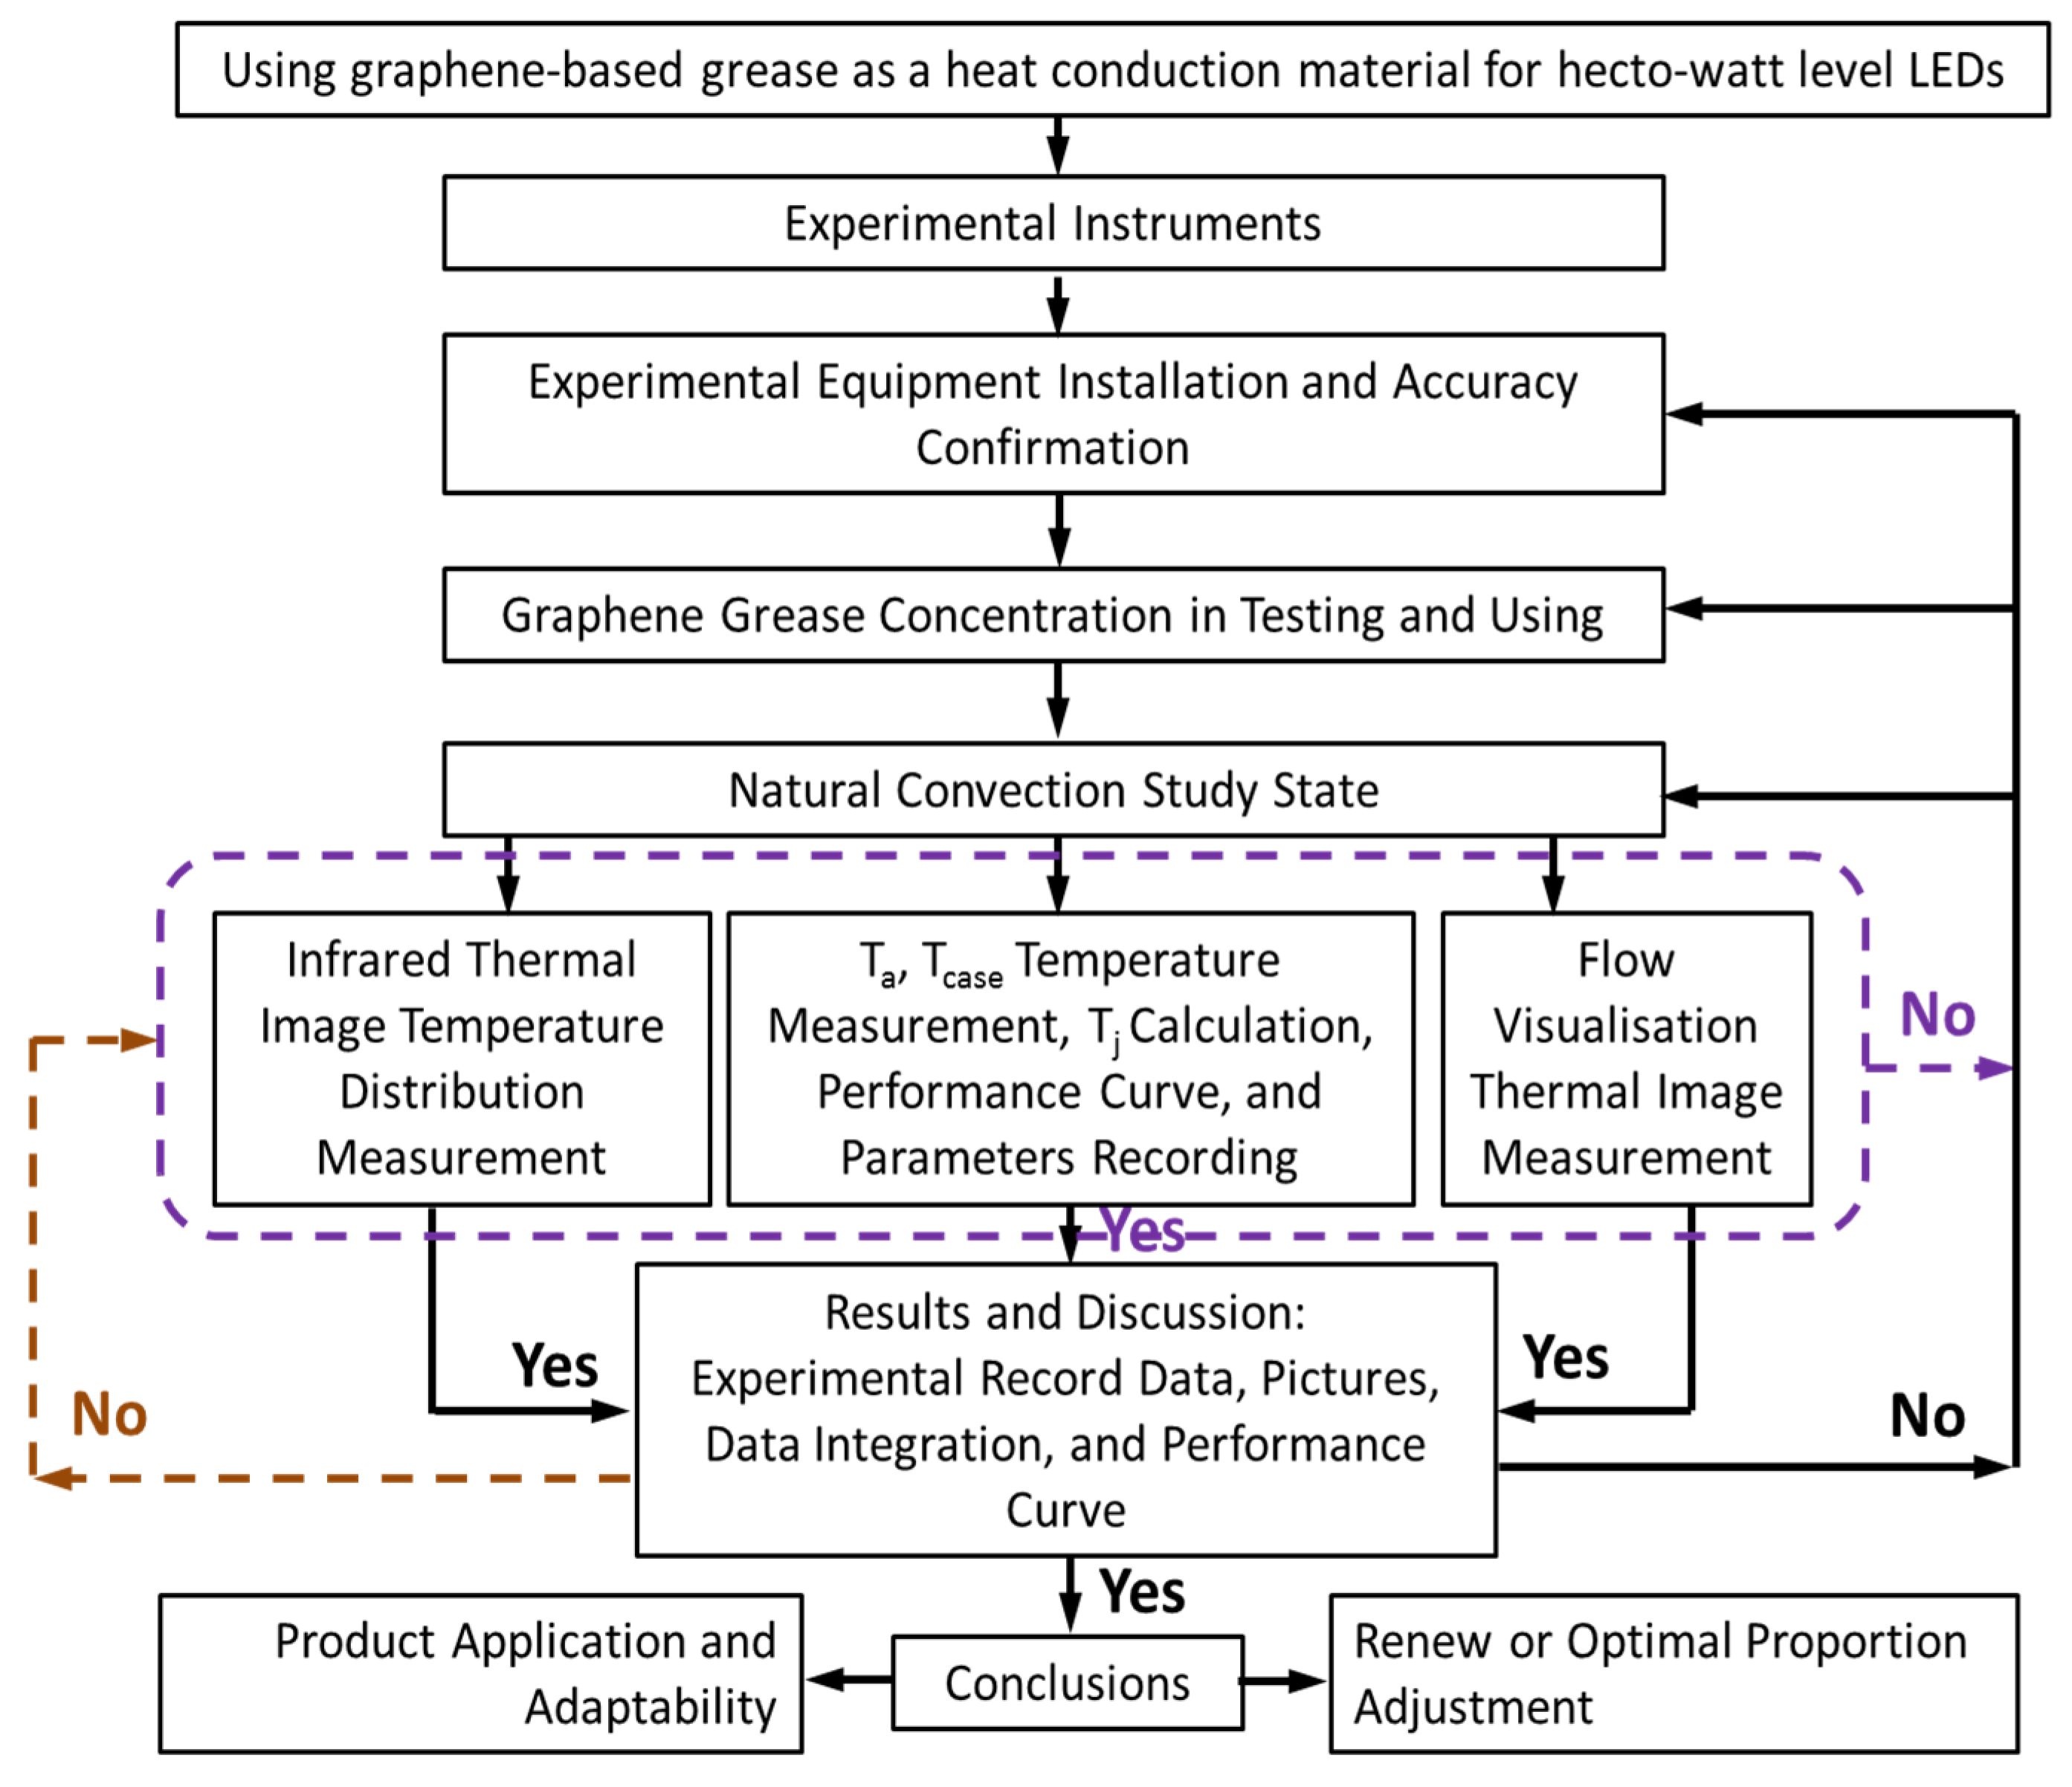
5. Experimental Research Process and Procedure

This experiment aimed to study the natural convection heat transfer from a chip-on-board LED to a fin heat sink and the convection in air. A flowchart of the experimental measurement procedure for natural convection study conditions is shown in Figure 7. The verification process of the natural convection heat transfer experiment was as follows: various concentrations of graphene thermal grease were prepared at concentrations between 10 and 30 wt.%. The grease was evenly applied to the contact surface interface between a chip-on-board LED substrate and a fin heat sink. A type T thermocouple wire was pressed on the interface, and then the LED was locked to the fin heat sink using a torsion wrench. Finally, the optimal concentration of graphene thermal grease was selected for subsequent experiments. The chip-on-board LED and heat sink were placed in the natural environmental convection control chamber of the LED. Then, three type T thermocouple wires were connected to measure the temperatures of the chip-on-board LED contact surface (Tcase) and heat sink (Tf) and the chamber ambient temperature (Ta). The other end of the wires was connected to a GL840 data recorder for real-time temperature monitoring. The recording frequency was once every 2 s.
To connect the positive and negative ends of the chip-on-board LED to the power supply, we adjusted the testing power to 50 W and monitored the voltage and current to maintain the normally fixed input and output power data. Particular attention was paid to the temperature of Tcase to prevent overheating and burning. At the beginning of the experiment, the chip-on-board LED was switched on, the power was adjusted to 50 W, and the recording time was set to 8000 s. Data on the various concentrations of graphene thermal grease were measured, including Tcase, Tf, and Ta. Tj was calculated and a performance curve was drawn for comparison and explanation. The best concentration wt.% of graphene thermal grease with a good heat dissipation effect was found for subsequent experiments.
After identifying the graphene thermal grease with the best heat dissipation effect, it was placed in the LED environment-controlled convection chamber with a chip-on-board LED module. The 8000 s experiment was then conducted. The temperature display value and the measured value of the thermal imager were verified, and the results of the thermal temperature field are described. In the process of thermal flow field shooting, a laser light sheet was used to project the wavelength of green light, which was radiated to the natural environmental control chamber. Smoke was sprayed into the chamber in a timely manner to form a flow field of thermal smoke. Then, a digital camera was used to photograph the heat flow distribution. Flow visualization and analysis of the natural convection heat flow field were conducted. In this study, the empirical correction formula for calculating the chip-bonding temperature Tj was as follows:
T j , cal . = T case + W loss × T j , spec . T case T ambient W spec . × W act . W spec . .
In this study, we used a direct experimental measurement approach to perform temperature verification. Self-adjusting concentrations of 10, 15, and 20 wt.% graphene thermal grease were formulated. The thermal conductivity of the contact surface was measured, and the thermal performance results were compared. A direct contact test between the heat source of the contact surface and the interface material of the LEDs was used to verify the effect of the concentration. The experimental parameters used were Tcase, Tjunction, Theat sink fin, Tambient, voltage, and current; the flow field effect of thermal buoyancy, thermal boundary layer movement flow visualization, and thermal diffusion behavior were compared, and the thermal conductivity of the contact surface was calculated.
In addition, the structure and composition of the graphene thermal materials at varying FE-SEM magnifications were studied, and the thermal conductivity K values of the 10, 15, and 20 wt.% graphene thermal greases were calculated using Fourier’s law applied to one-dimensional heat conduction.
Q cond . = KA dT dx + dT dy + dT dz .
As the graphene thermal grease refers to vertical Z-direction conduction, the K value was only calculated for the different percentages of Z-direction conductivity of 10, 15, and 20% wt.%, and the plane diffusion heat transfer in the X- and Y-directions followed the original material data of graphene, having a high plane diffusion heat transfer capacity. The calculation of the K value is discussed in Section 7.5.
Q conduction = K A z   d T d z ,
K W m   K = Q cond . A z × dz dT = Q cond . A × LED   thickness   +   graphene   thermal   interface   material   thickness   +   heat   sink   thickness T heat   sink   fin T case ,
where Q is the real LED heating output power (W), A is the area of LED contact graphene thermal conductivity interface material (m2), dT is ΔT (Theat sink fin − Tcase), where the temperature difference is negative (K), and dz is the LED thickness + graphene thermal interface material thickness + heat sink thickness (m).

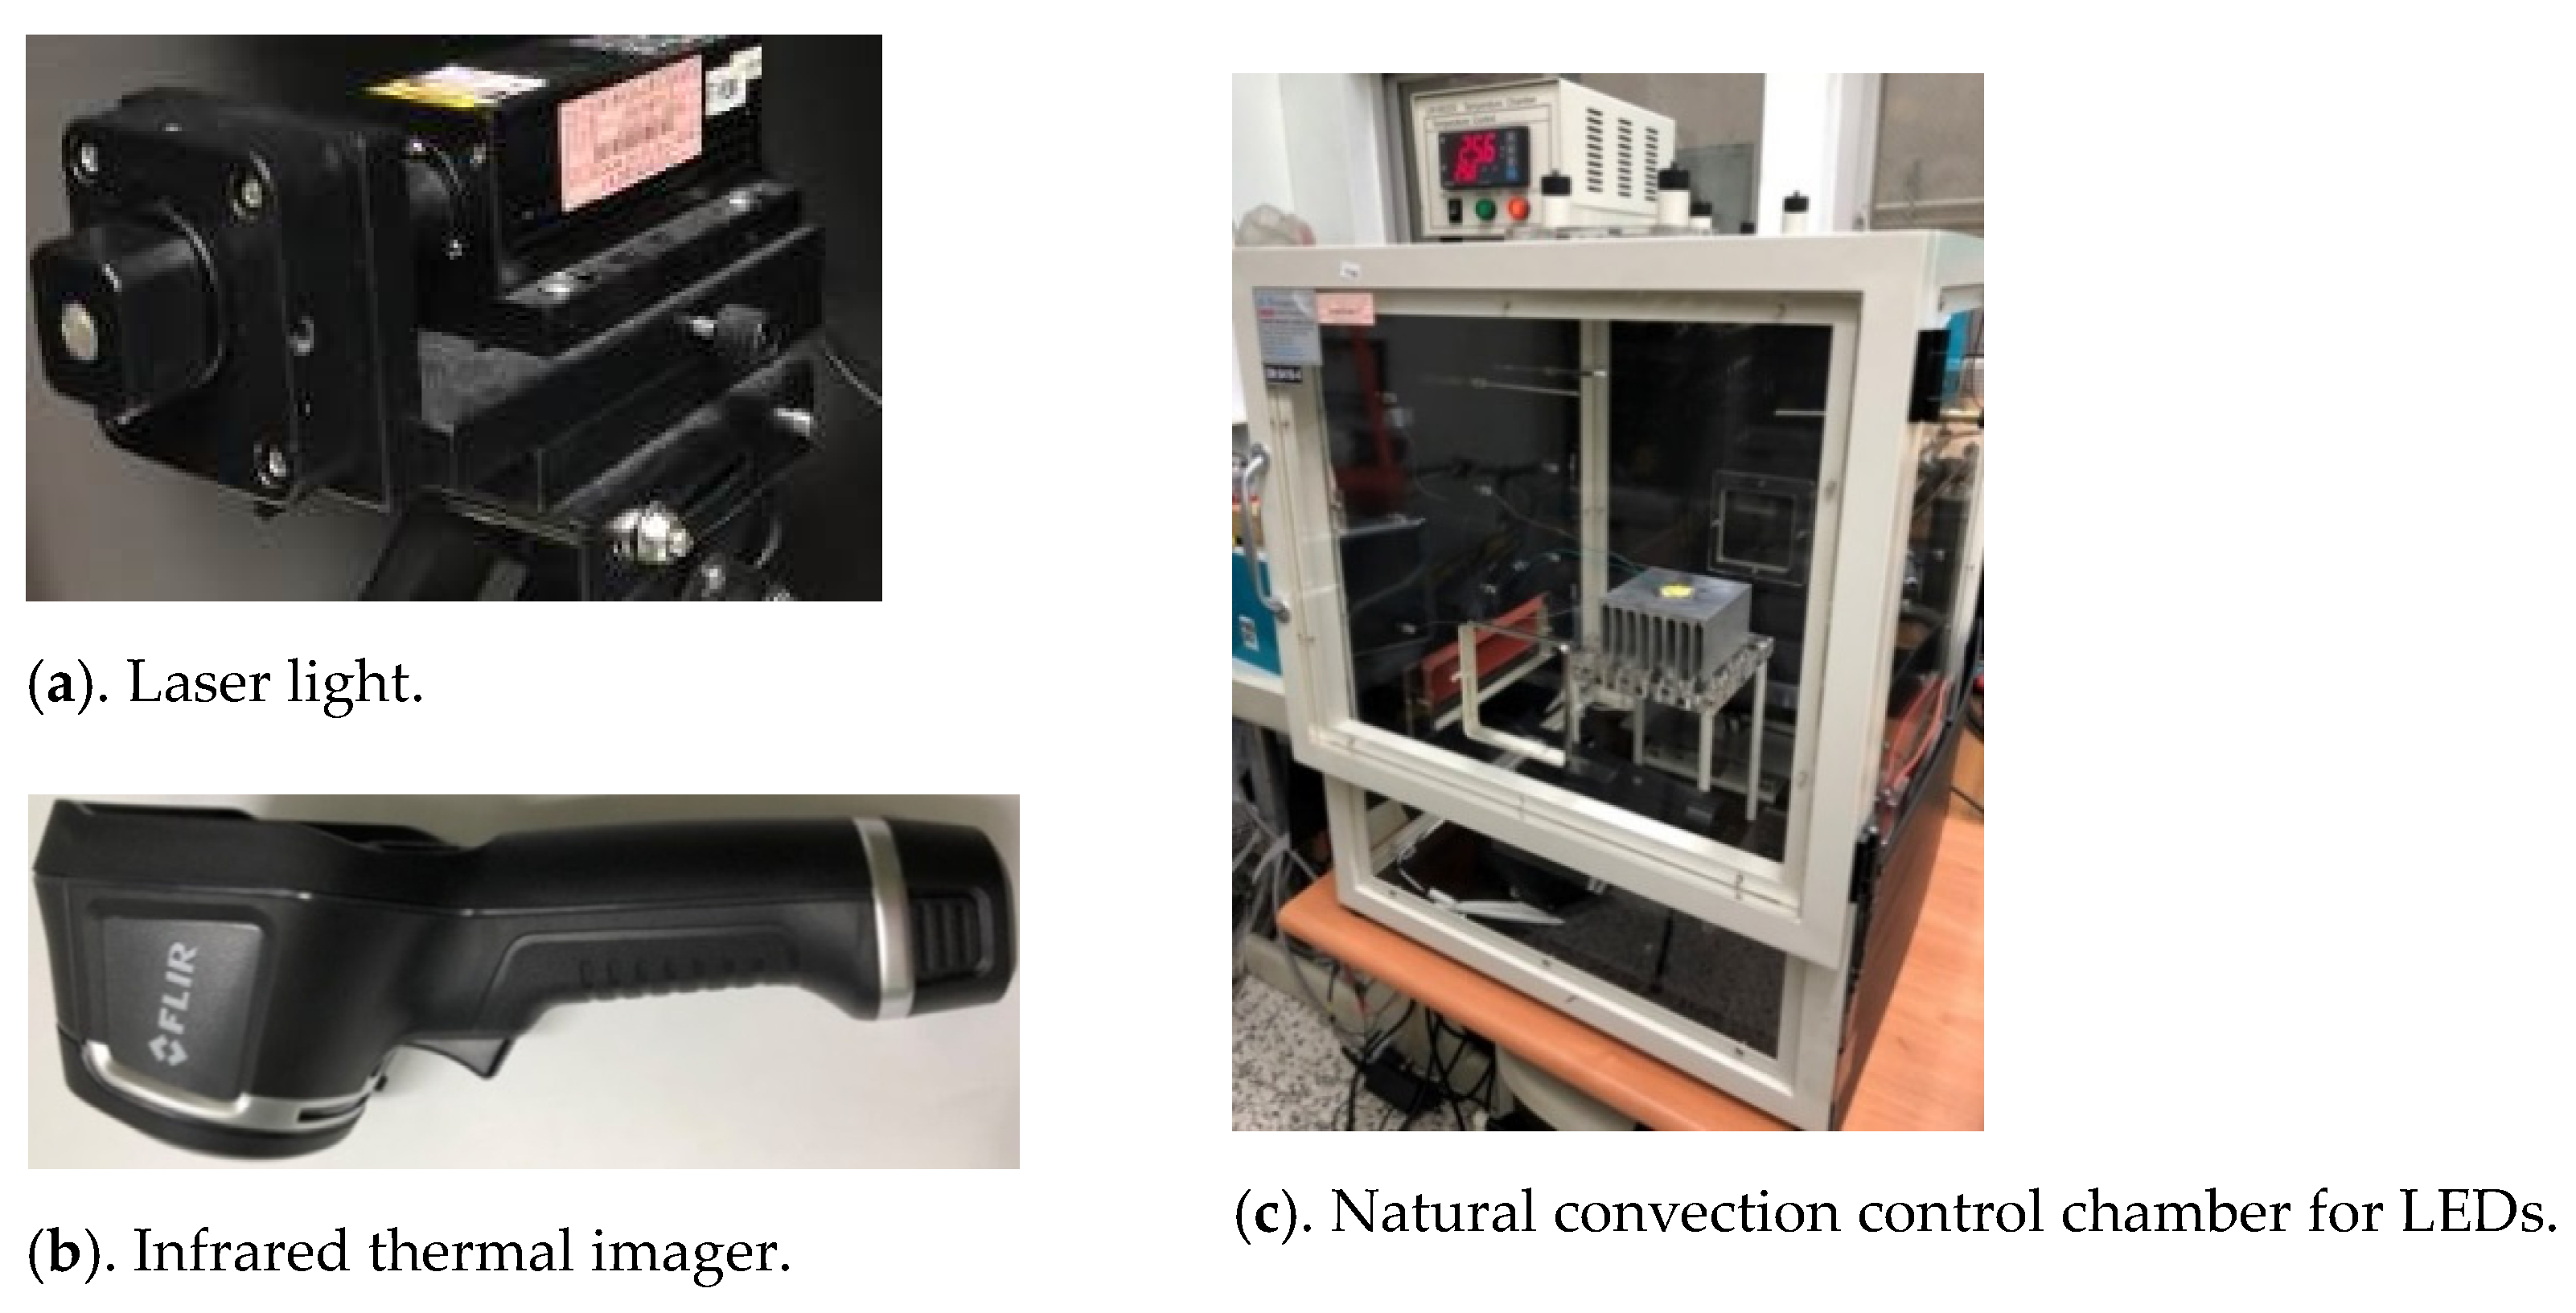
6. Thermal Experimental Equipment

The equipment used in this study included a green laser light (output power: 300 mW; laser beam: ψ2.5 mm; wavelength: 532 nm, as shown in Figure 8a), a digital camera (full HD 1080 P and 24.72 million pixels), DC power supply (voltage: 0–80 V; current: 0–40.5 A; power output: 1080 W), a data acquisition system (GL840-M, 20 channels, 20–100 V), an infrared thermal imager (measuring range: −20 °C–+250 °C; pixels: 80 × 60, as shown in Figure 8b), a type T thermocouple (temperature range: −270 °C–+370 °C), and a natural environmental convection control chamber (temperature: <70 °C; input power: AC 220 V/60 Hz). The equipment was used to measure the natural convection of LEDs and conduct natural convection cooling experiments and flow visualization.
Many holes were on the surface of the natural convection chamber to sustain airflow. Adjustable air vents were on the upper surface to ensure that external cold air could enter. Hot air diffused from the top to the outside to form a natural convection chamber with a wind speed of less than 0.3 m/s. The natural convection control chamber’s size was 560 (W) × 560 (D) × 680 mm (H), as shown in Figure 8c.

7. Results and Discussion

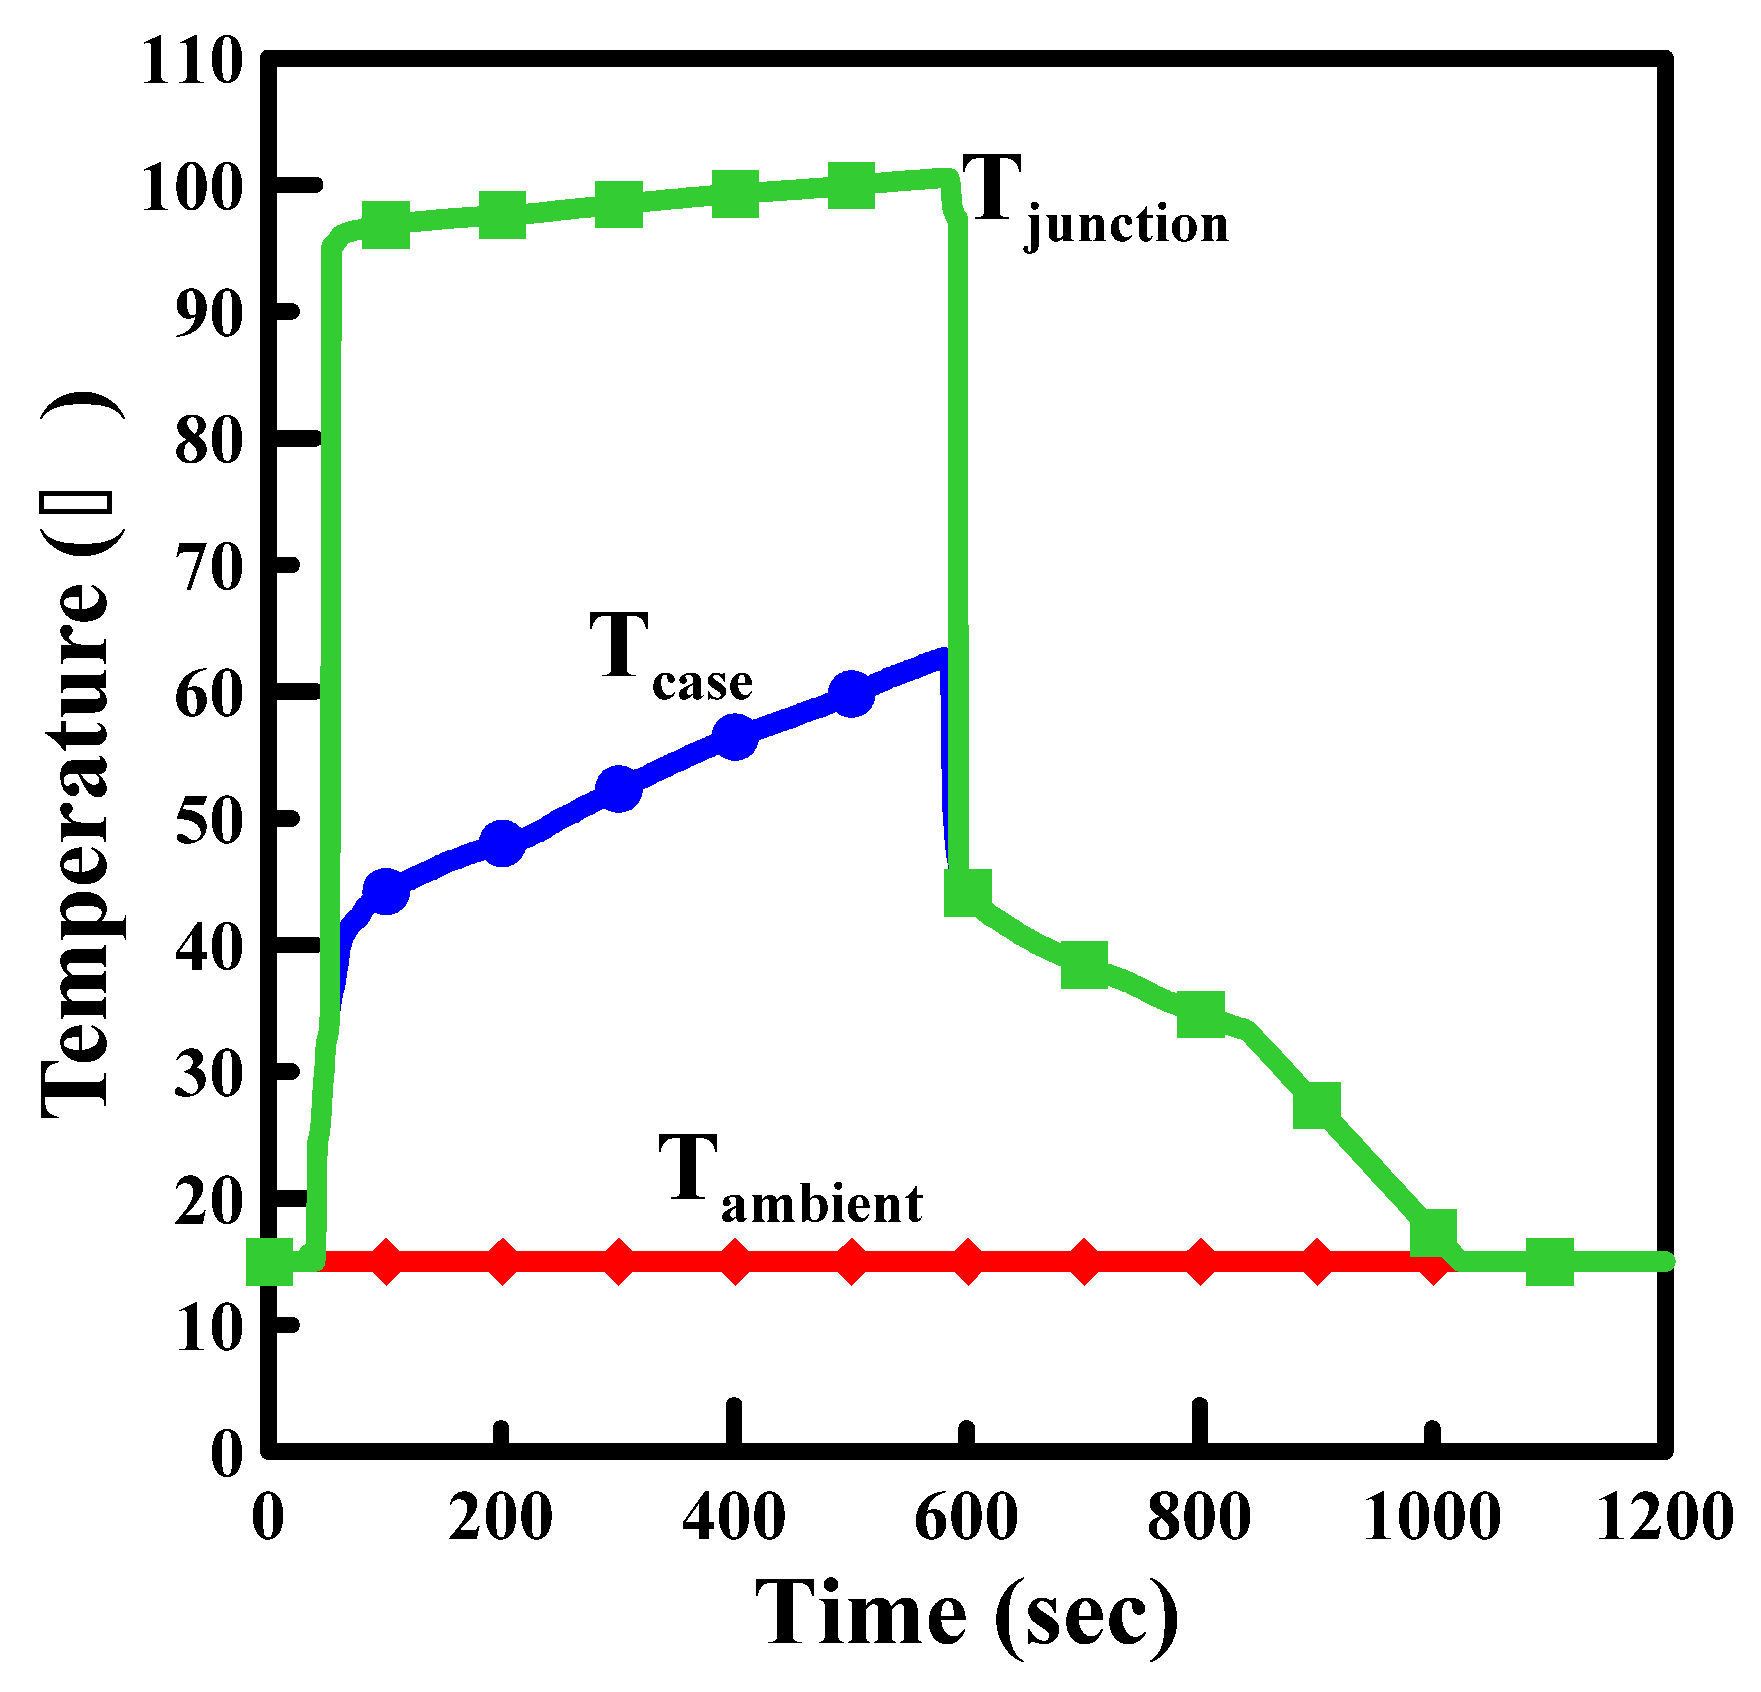
7.1. Natural Convection Control Chamber for Chip-on-Board LEDs

In this study, a chip-on-board LED of 50–100 W was tested under natural convection in an environment-controlled room. The ambient temperature was initially set at 15 °C, the relative humidity was 60% RH, and the average ambient air velocity was less than 0.3 m/s. An aluminum extrusion heat sink was used, graphene thermal grease was used as the surface contact conductivity material, and the chip-on-board LED operated 600 s after start-up. The Tcase temperature continued to rise close to 70 °C, and the chip-bonding temperature Tj was close to 125 °C. If the temperature continued to rise, it would exceed the specification design temperature value (Tcase < 75 °C spec.), as well as avoid chip-bonding temperature damage (Tj < 125 °C spec.), and immediately turn off the chip-on-board LED, as shown in Figure 9. To further test whether the 50–100 W chip-on-board LED can operate for a long time under natural convection, we gradually reduced the temperature of the environmentally controlled room from 15 °C to −10 °C. Tcase also gradually decreased with Ta, and its light source gradually became unstable until it was extinguished.

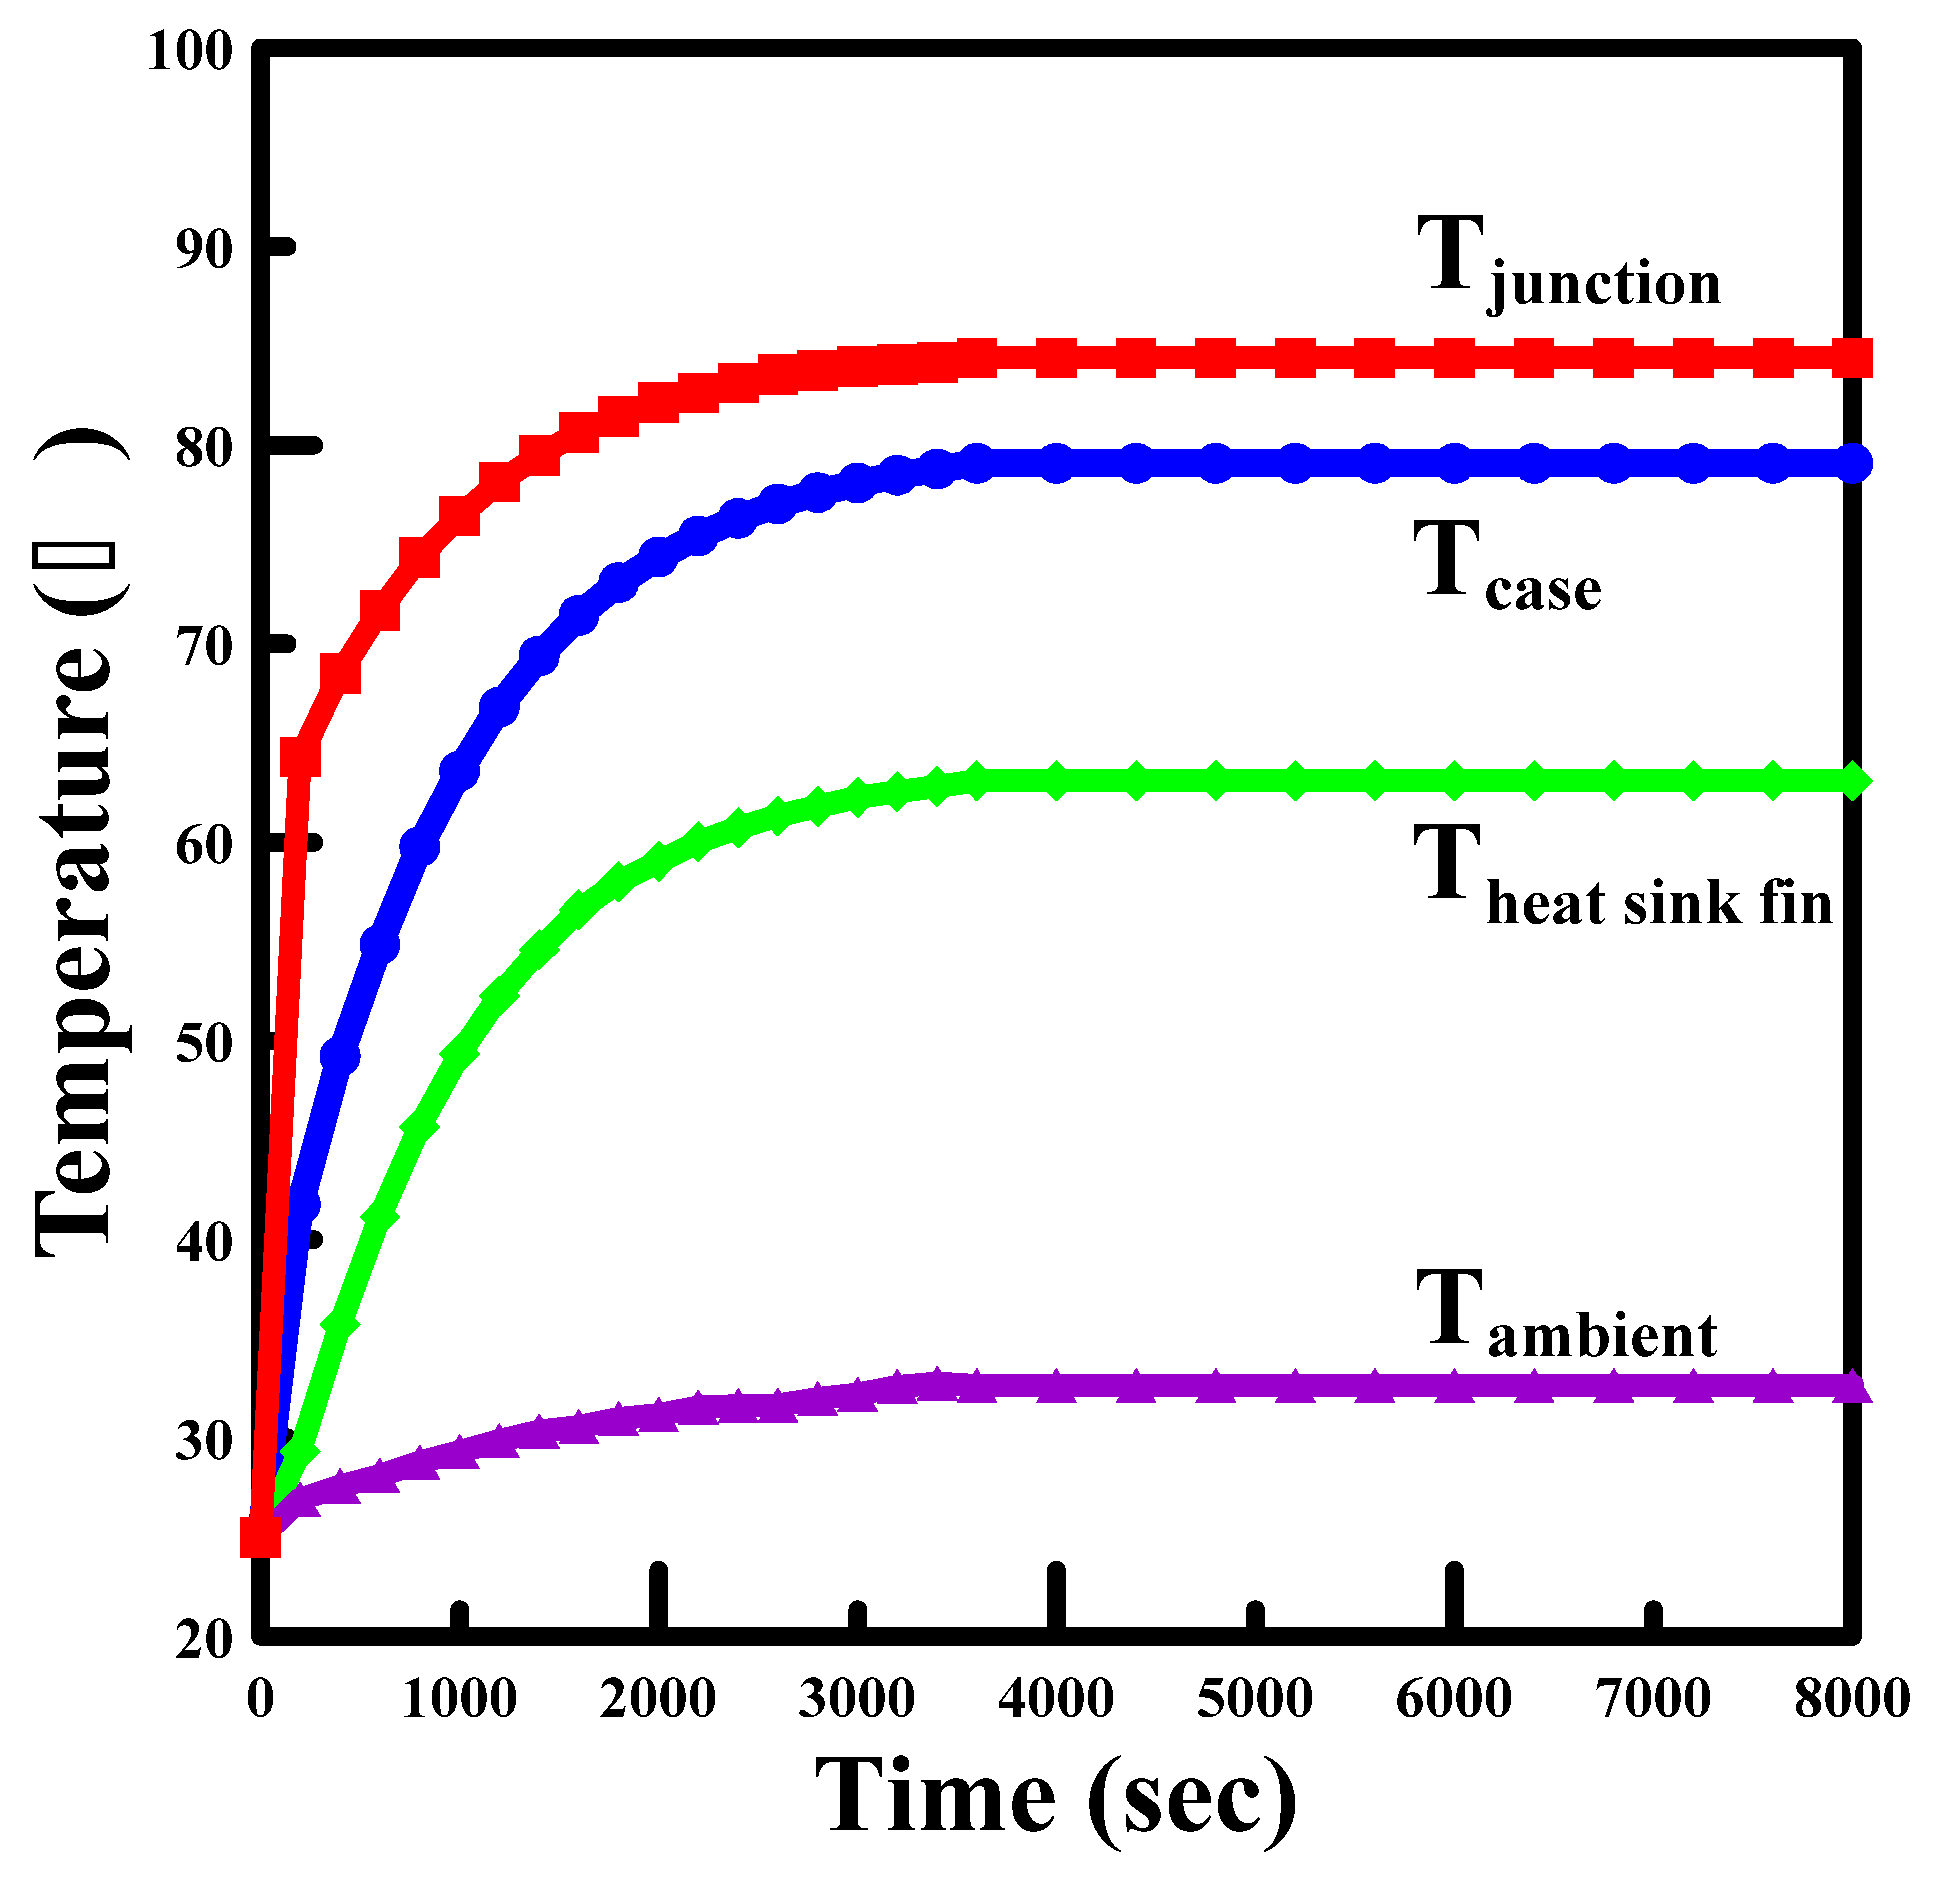
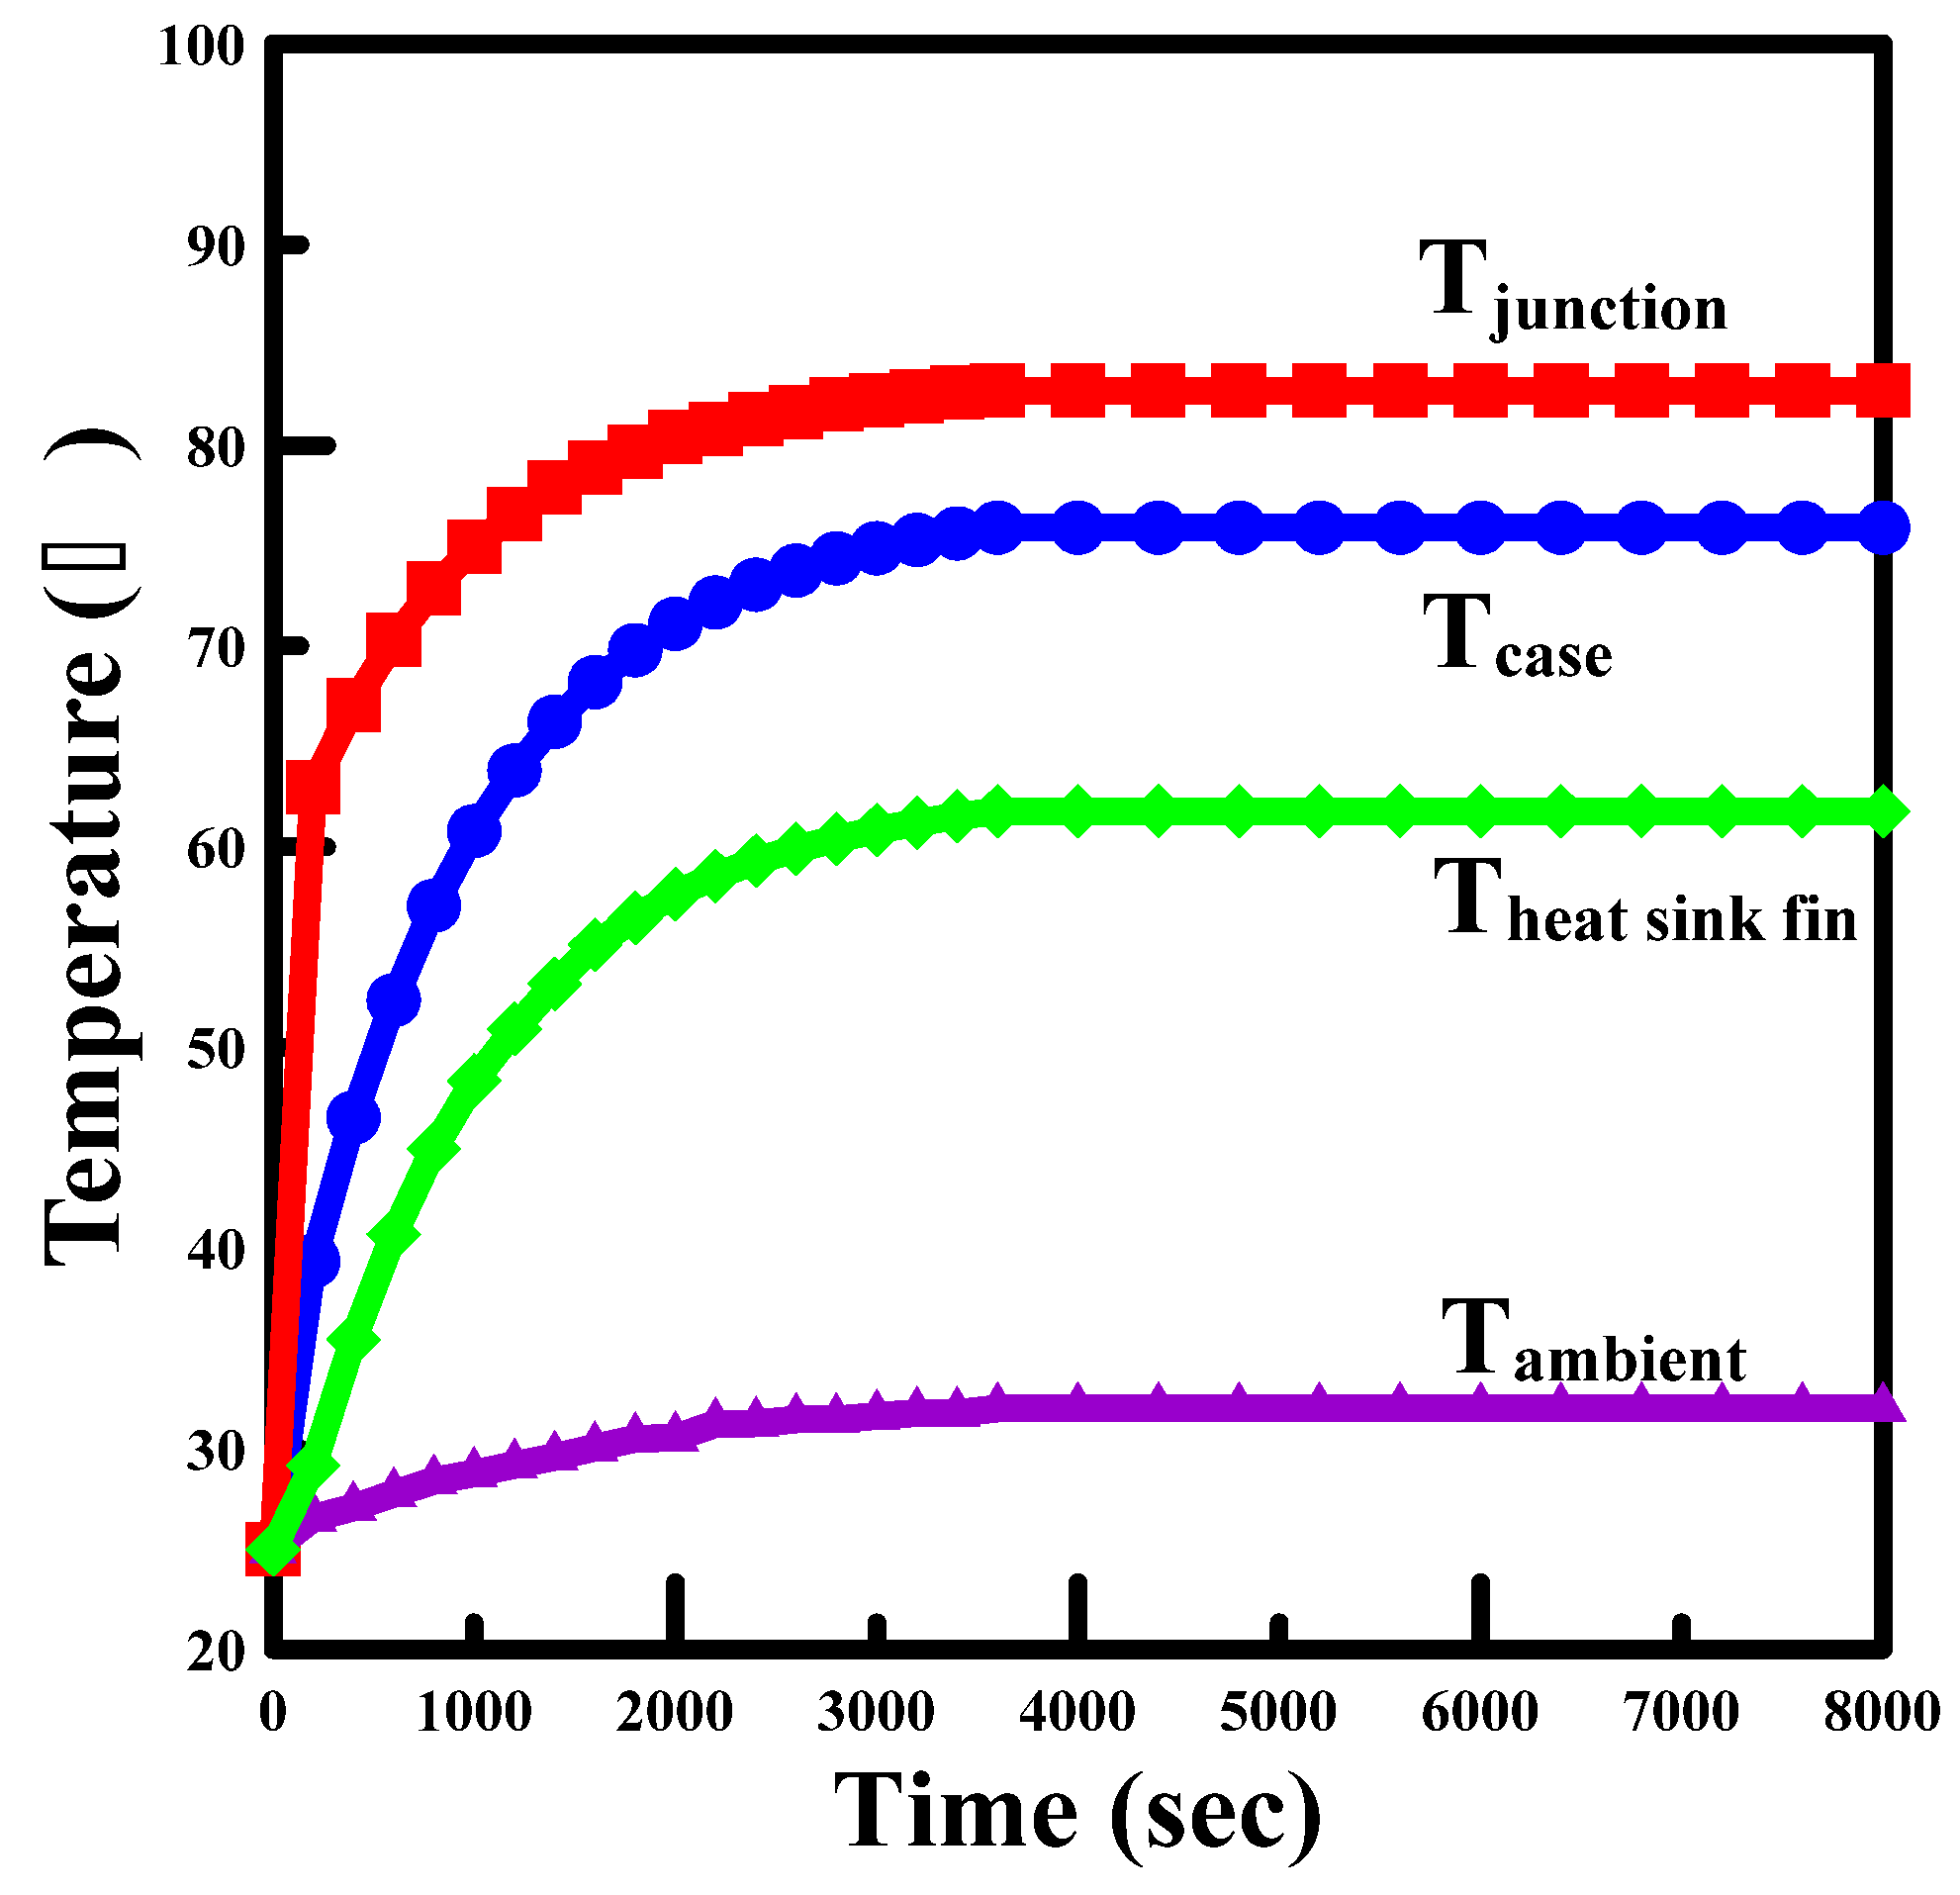
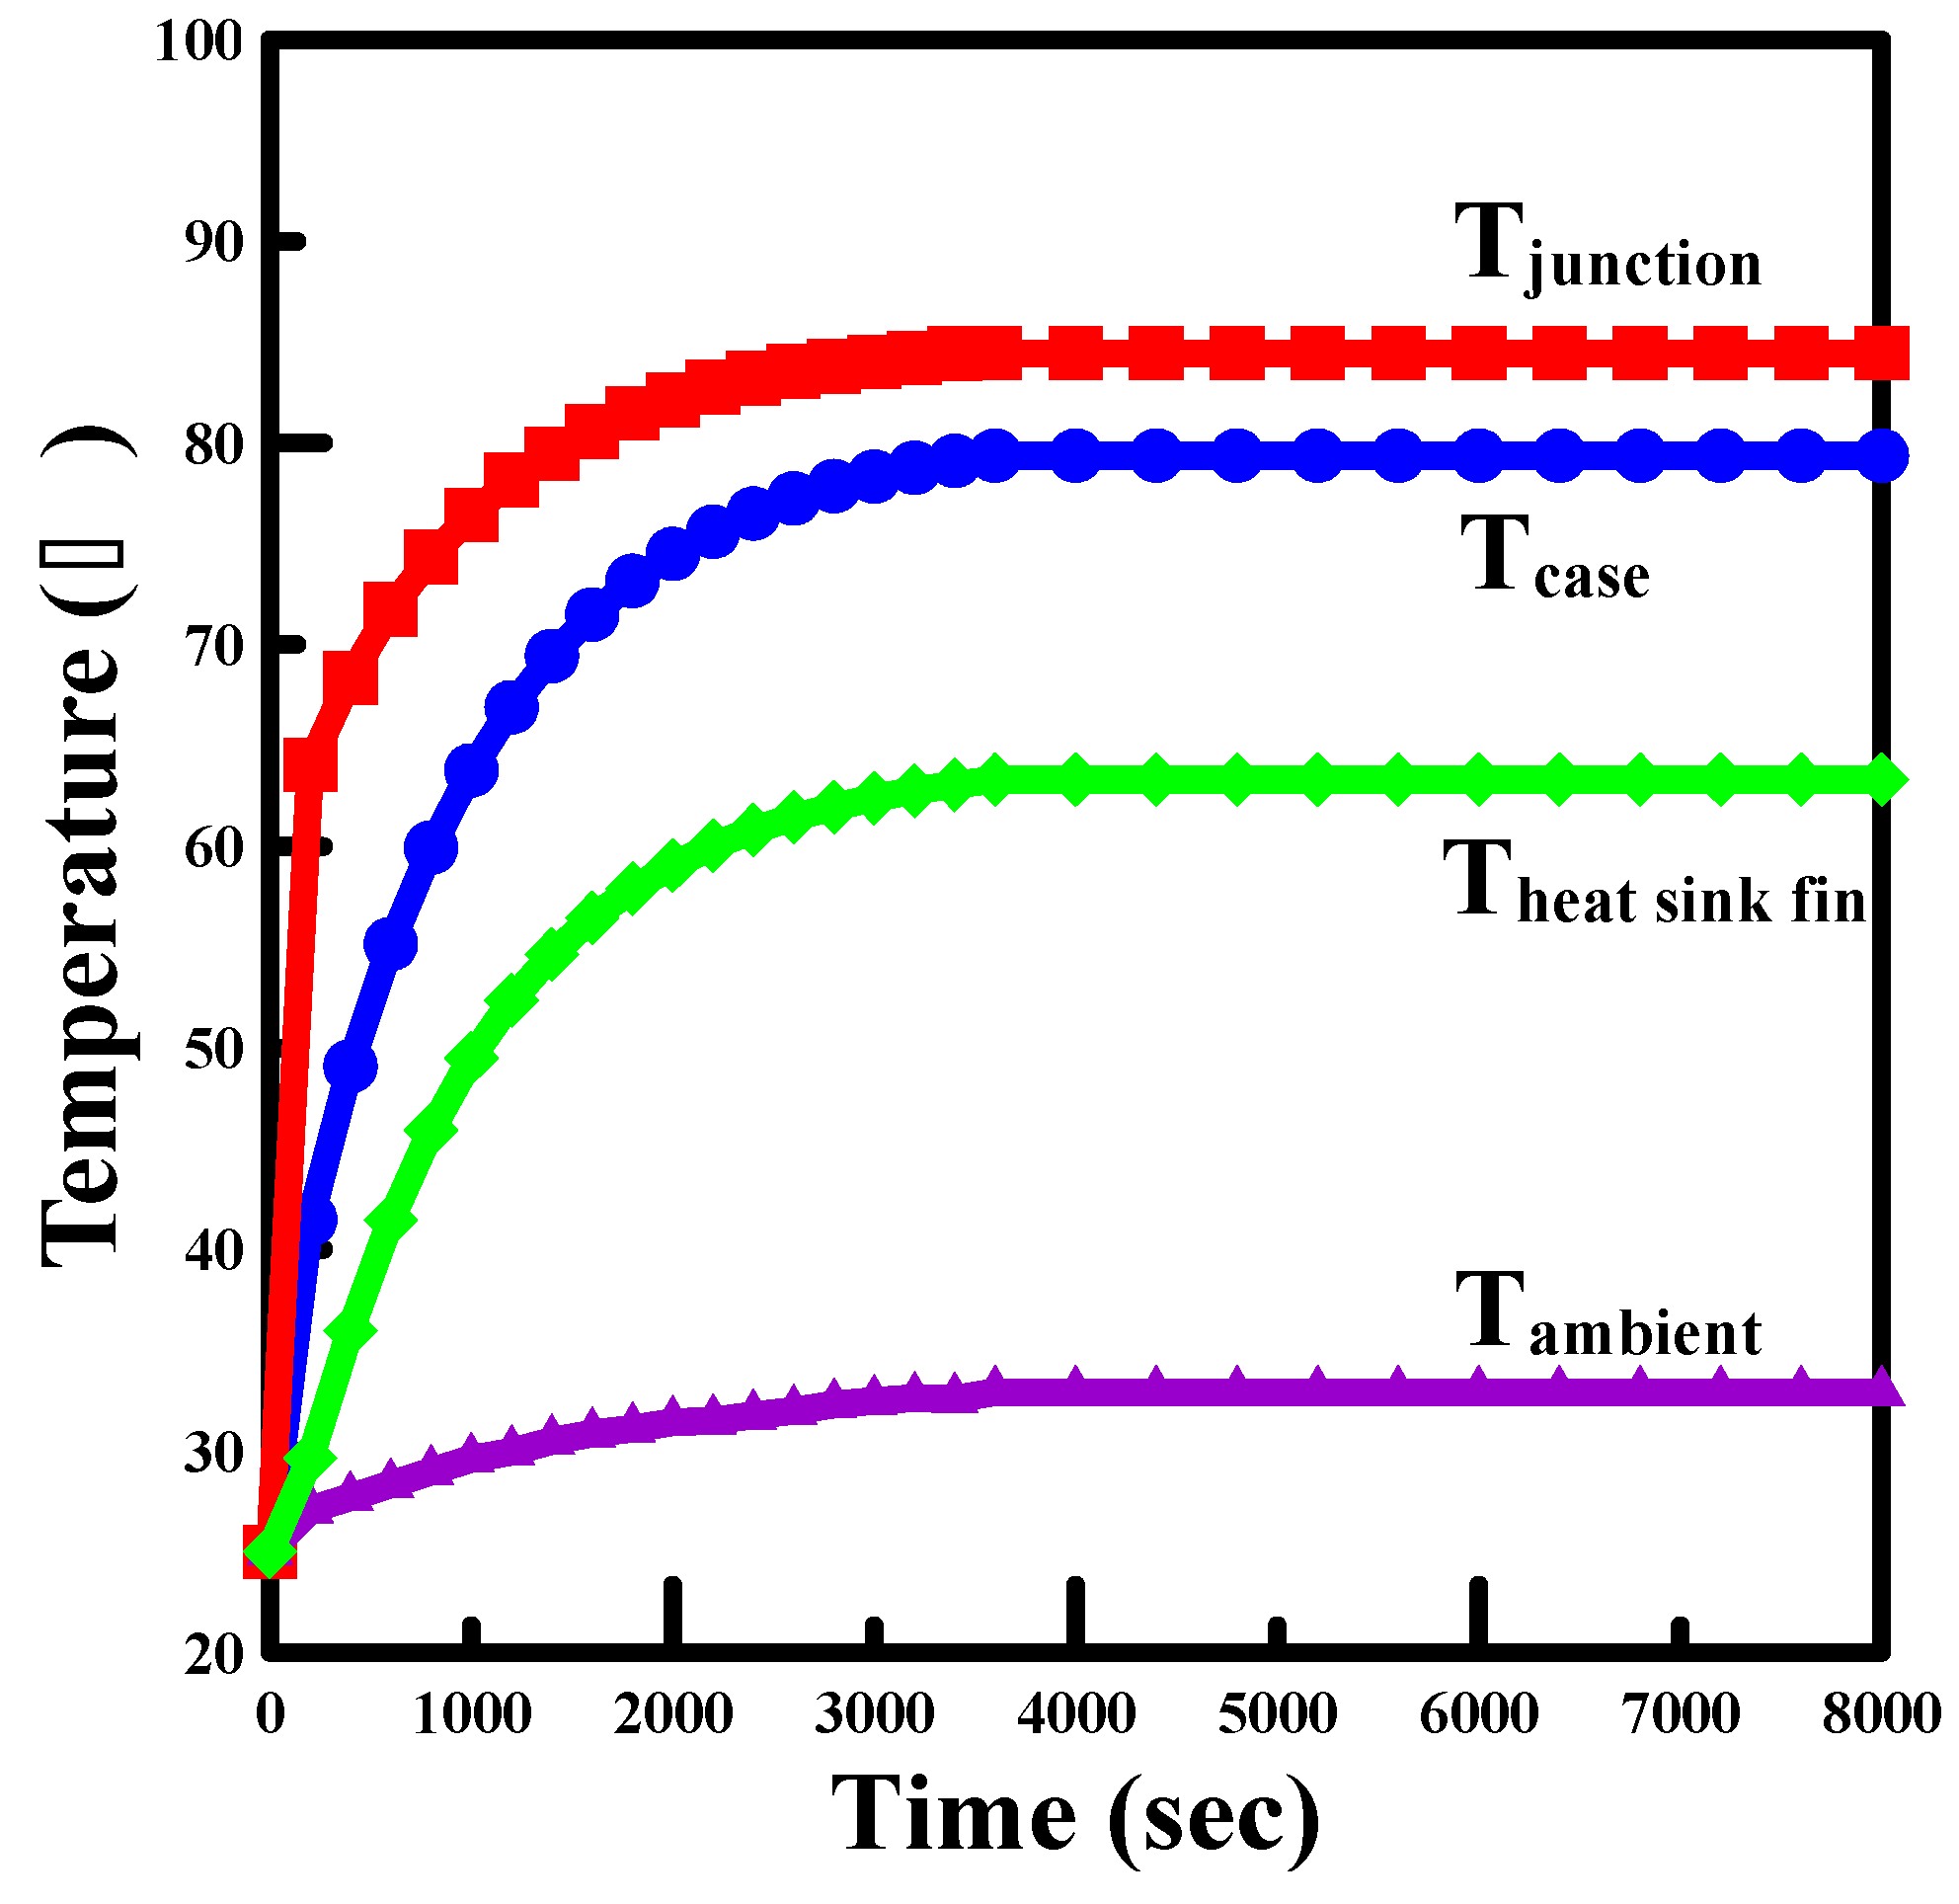
7.2. Temperature Measurement of Various Concentrations of Graphene Grease

Before the experiment on the natural convection heat flow field, the concentration of graphene thermal grease was mixed between 10 and 30 wt.%. Among the various concentrations, those of 10, 15, and 20 wt.% grease (non-curing thermal interface material) had good fluidity and easily adhered to the contact surface. However, when grease concentrations of 25% and 30% were mixed, there was blocking (curing) or a dry consistency, which resulted in poor fluidity and difficulty in sticking and filling the contact surface. Thus, the concentrations of 25% and 30% were not considered for use. In the natural convection experiment, only 10%, 15%, and 20% graphene thermal greases were tested, and the temperature difference and performance curves between the interface temperature Tcase and the fin module temperature Tf were compared over 8000 s; the chip-on-board LED interface temperature Tcase, fin module temperature Tf, and ambient temperature Ta were also recorded. Then, the chip-bonding temperature Tj was calculated using Equation (1). The temperature difference ΔT (Tcase − Tf) was also calculated, and a performance curve was drawn. We determined the concentration of graphene thermal grease with a better heat dissipation effect, checked the temperature distribution, and conducted a visualization of the heat flow field through qualitative physical photography recording and verification of the quantitative temperature measurement values.
As shown in Figure 10, a 50 W chip-on-board LED was used for experimental testing in the natural convection mode. When the concentration of the graphene thermal grease was 10%, the input and output power were stable, and, as the time gradually increased to 8000 s, the ambient temperature Ta gradually increased (25–32.6 °C); the interface temperature Tcase also continued to rise to a stable value of 79.1 °C (the overall specification was 75 °C), the fin heat sink temperature Tf continued to increase to a stable value (63.1 °C), and the calculated junction temperature Tj data of the chip also increased to a stable value (84.4 °C).
As shown in Figure 11, a 50 W chip-on-board LED was used for experimental testing in the natural convection mode. When the concentration of the graphene thermal grease was 15%, the input and output power were stable, and, as the time gradually increased to 8000 s, the ambient temperature Ta also gradually increased (25–32 °C); the interface temperature Tcase also continued to increase to a stable value of 75 °C (equal to the specification of 75 °C), the fin heat sink temperature Tf continued to rise to a stable value (61.7 °C), and the calculated junction temperature Tj data of the chip also increased to a stable value (82.4 °C).
As shown in Figure 12, a 50 W chip-on-board LED was used for experimental testing in the natural convection mode. When the concentration of the graphene thermal grease was 20%, the input and output power were stable, and, as the time gradually increased to 8000 s, the ambient temperature Ta also gradually increased (25–32.9 °C); the interface temperature Tcase also continued to rise to a stable value of 79.4 °C (the overall specification is 75 °C), the fin heat sink temperature Tf continued to increase to a stable value (63.3 °C), and the calculated junction temperature Tj of the chip also increased to a stable value (84.4 °C). Evidently, the junction temperature Tj value of the chip was almost the same as the 10% concentration value, which was higher by 2 °C than the 15% concentration value, and the thermal performance was poor.
Figure 10, Figure 11 and Figure 12 show that the temperature Tj of a chip-on-board LED increased rapidly before 400 s and tended to be stable after 400 s. However, the temperatures Tcase and Tf were similar to the arc shape of a quadratic curve, and the temperature curves of the last three (Tcase, Tf and Tj) tended to be stable. When the chip-on-board LED is started, the interface heat conduction material and fin heat sink module do not remove heat quickly. With the voltage, current, and power consumption rising continuously, after the start at 8000 s, the chip-on-board LED components generate thermal stability. Then, heat is gradually transferred and dissipated by the graphene thermal grease on the contact surface. Therefore, the interface thermal conductivity material and fin heat sink module can quickly remove heat when a chip-on-board LED is started, thereby quickly stabilizing the heat loss. The chip-on-board LED could be operated for a long time. The Tcase, Tf and Tj time and performance curves meet the specifications and exhibit stable and balanced operation.
As shown in Table 2, the ΔT (Tcase − Tf) temperature difference resulted in different concentrations of graphene thermal grease. When the temperature difference between the interface temperature Tcase and fin module Tf was small, the chip-on-board LED interface thermal conductivity could be effectively and quickly transferred as the heat generated by the heat dissipation fin module. Thus, the 15% concentration of graphene thermal grease was better than the 10% and 20% concentrations. The ΔT was smaller and the heat dissipation effect was better. As shown in Table 3, Table 4 and Table 5, the temperature values of the Tcase, Tj, and ΔT (Tcase − Tf) of 15% graphene thermal grease were lower than those of the 10% and 20% graphene thermal greases, regardless of the experimental time. As shown in Table 2, Table 3 and Table 4, the heat transfer performance of 10% and 20% concentration was almost the same under high-temperature operation, and the heat dissipation effects of 10%, 15%, and 20% concentrations were almost the same under low-temperature operation.

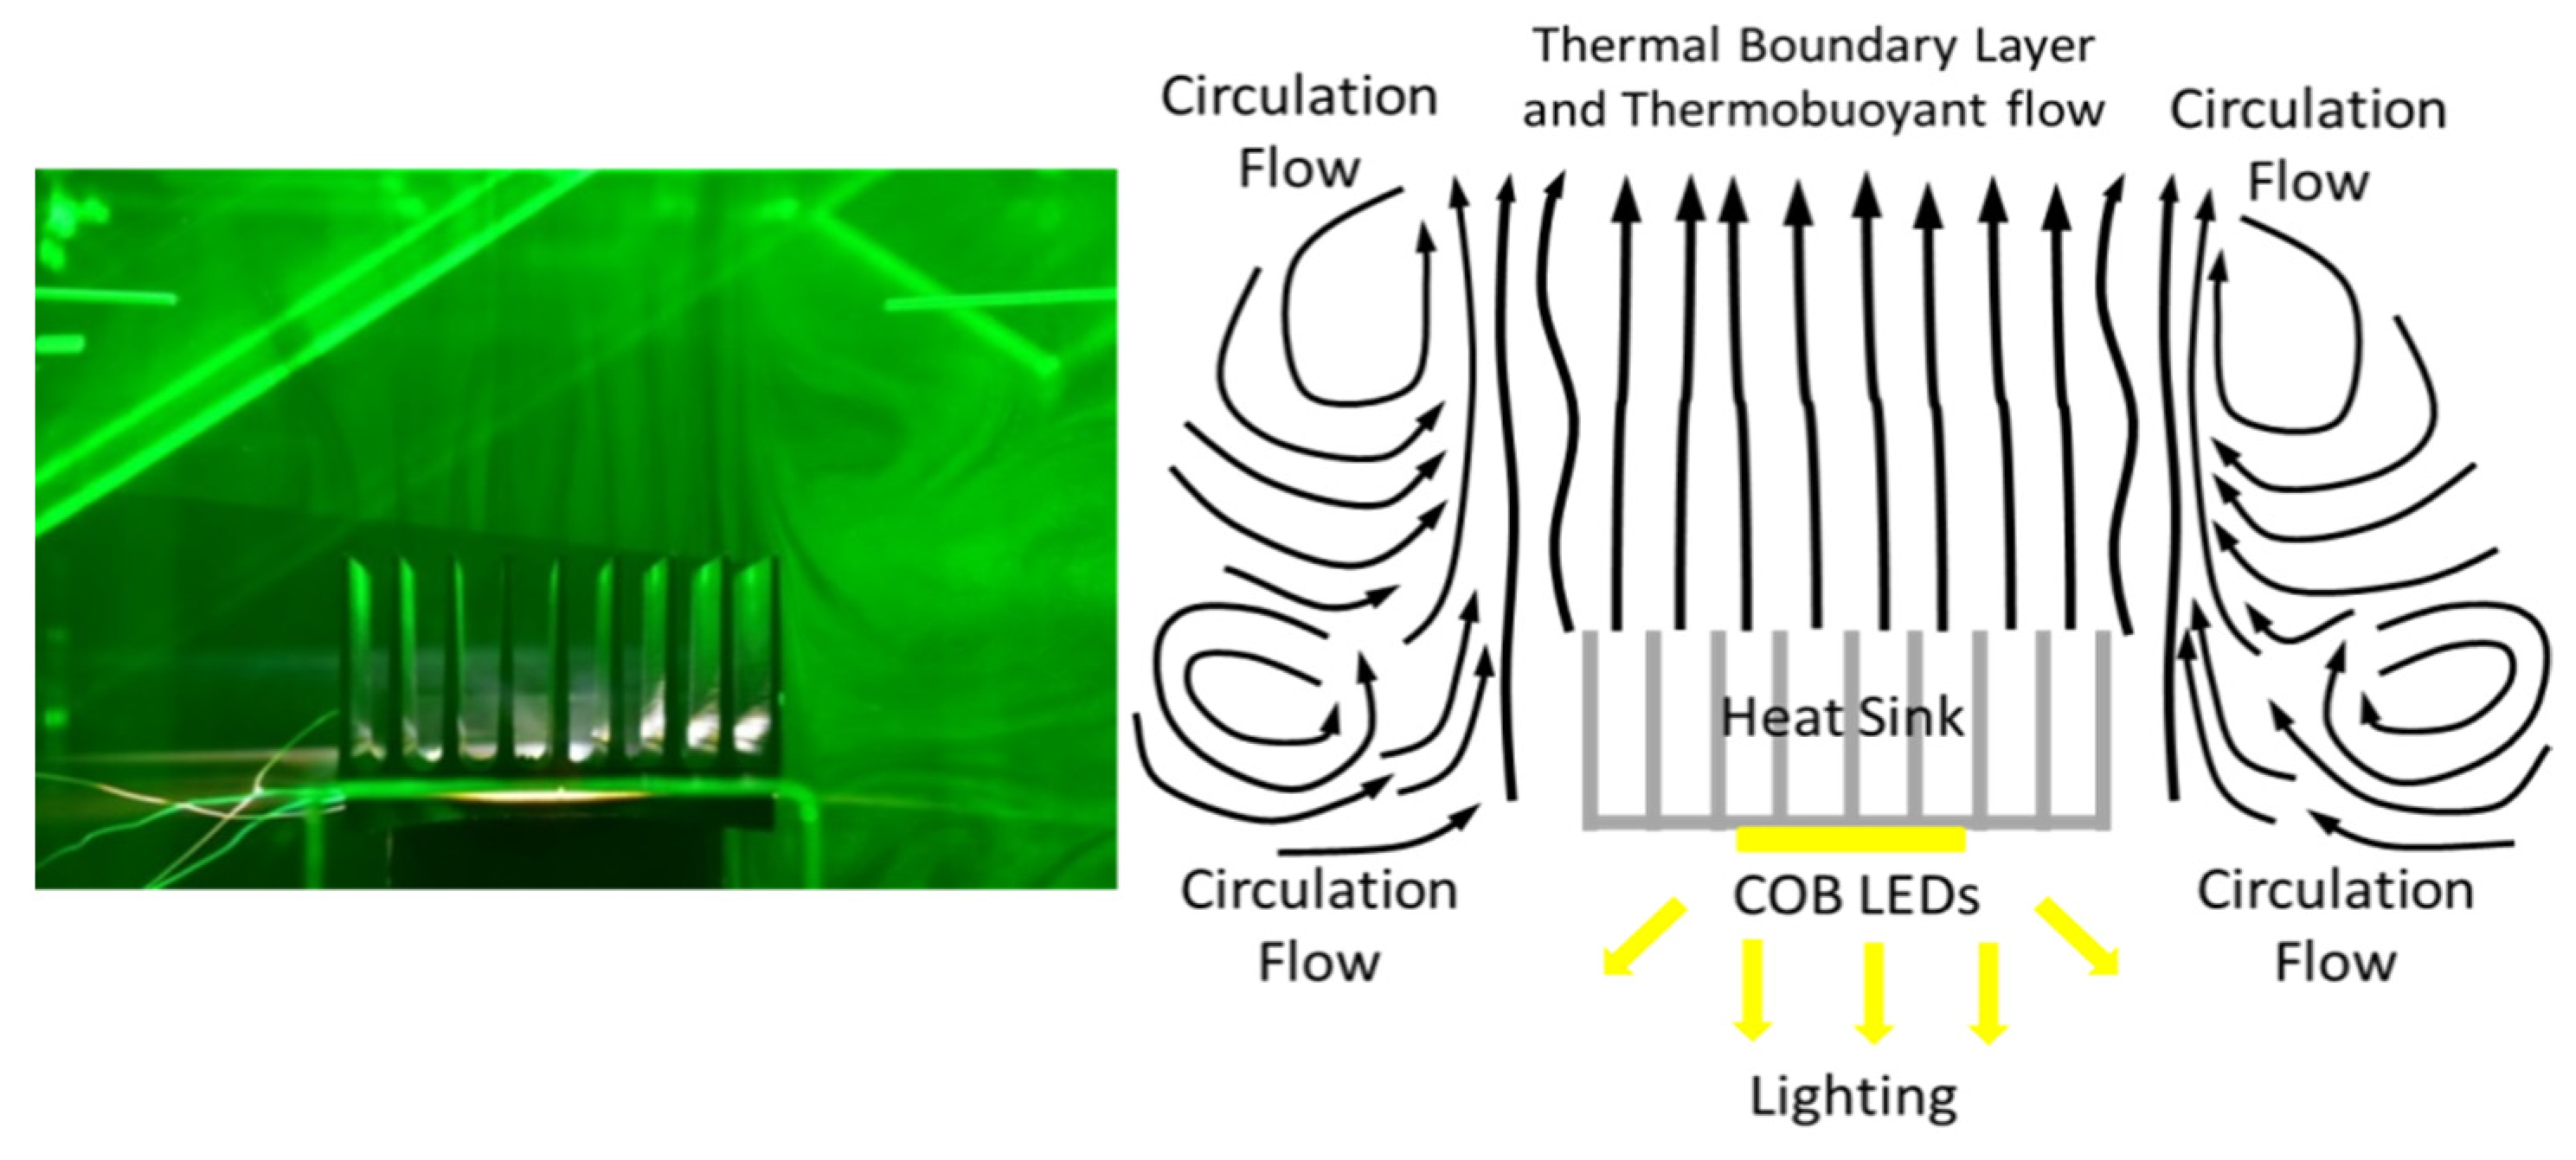
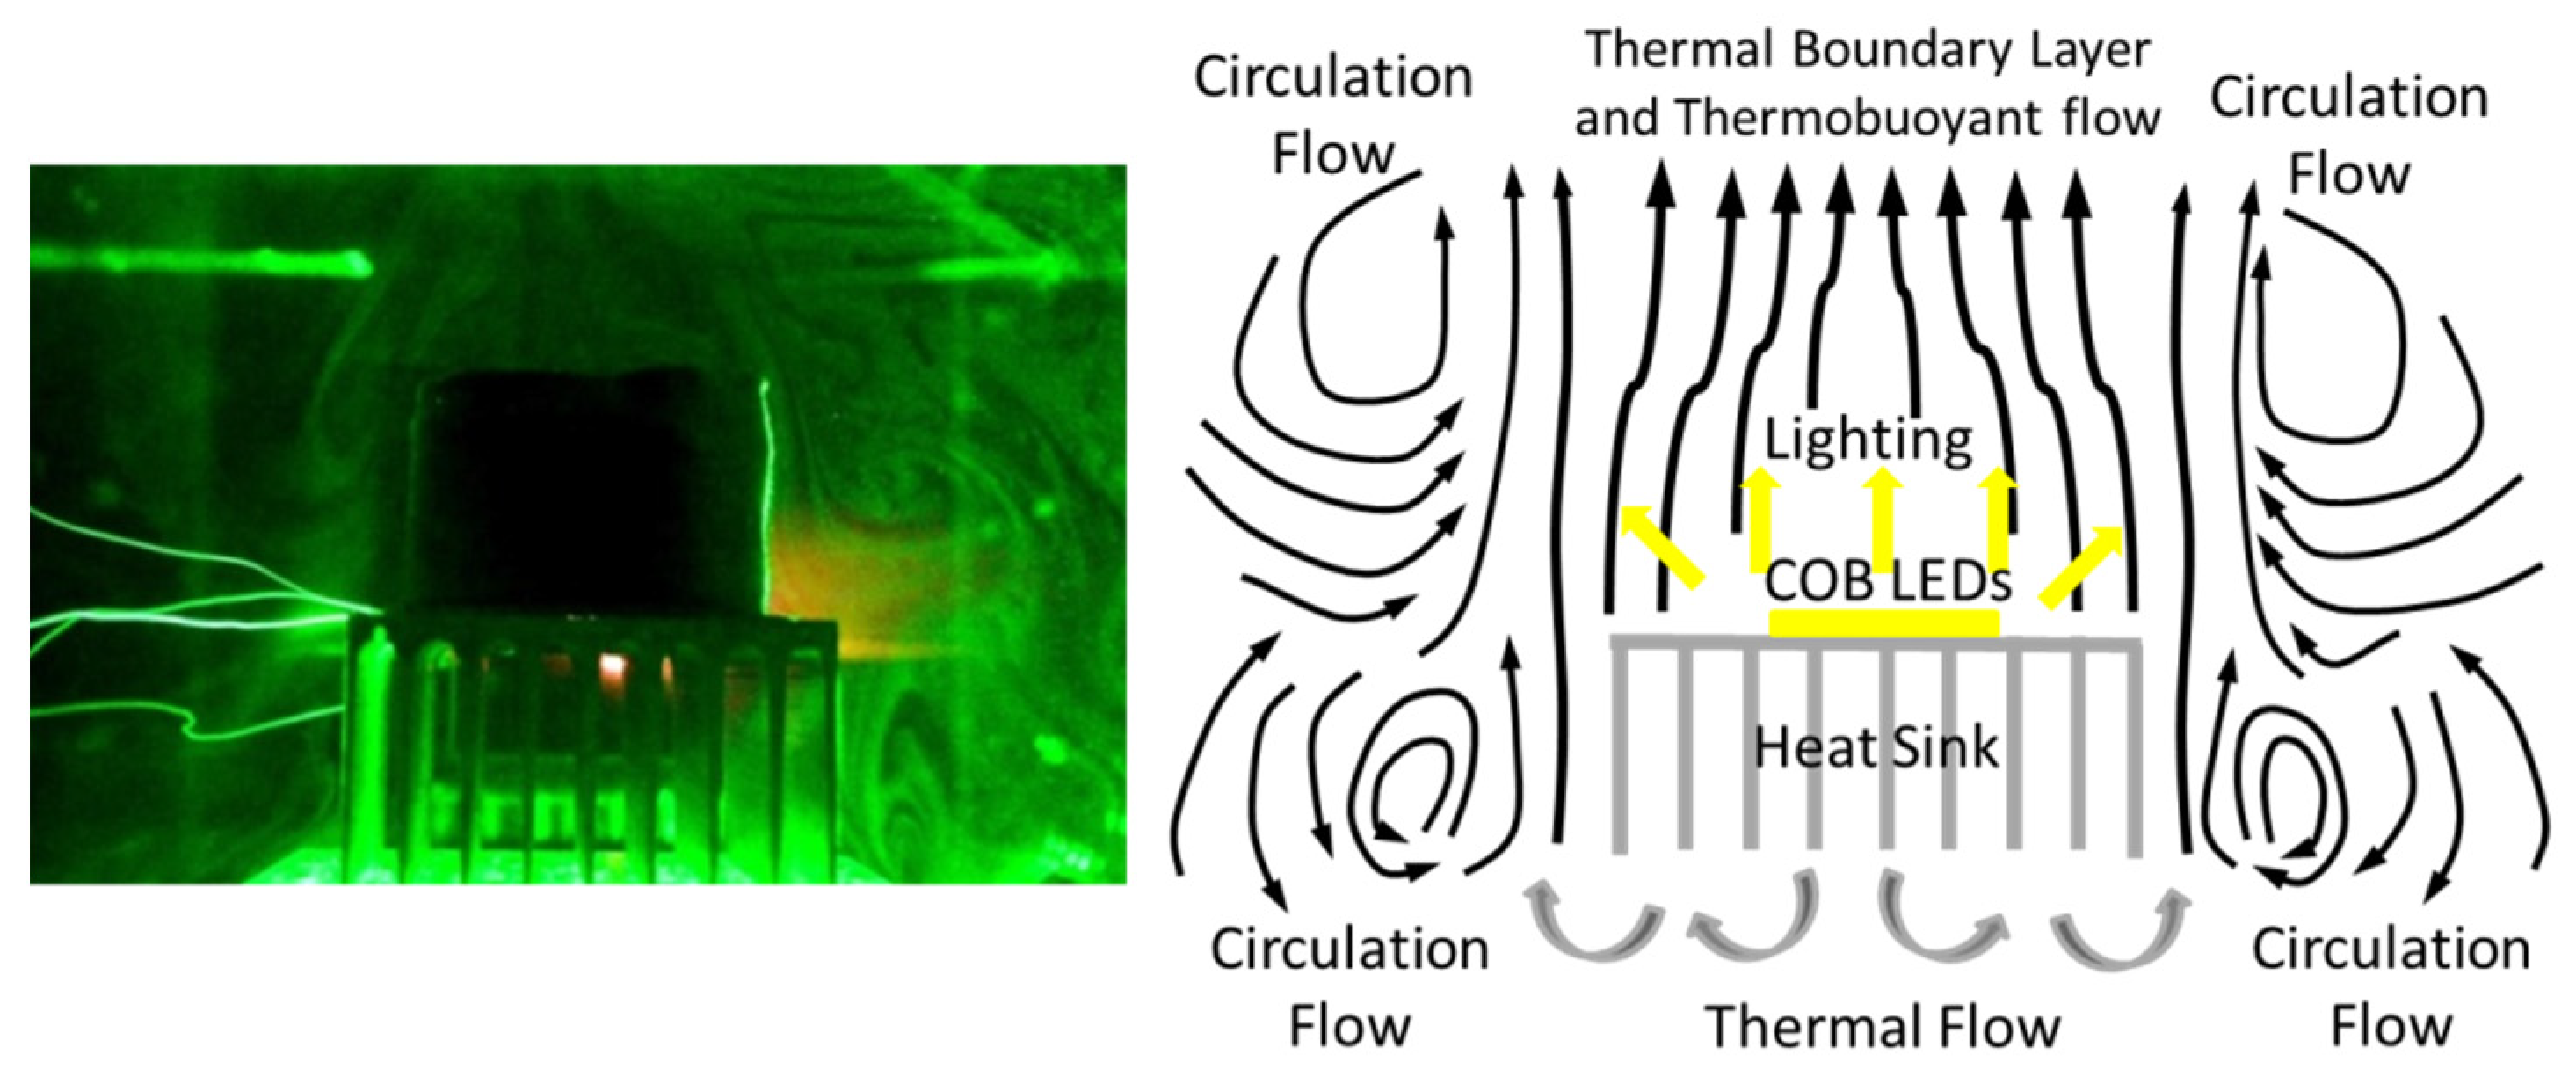
7.3. Flow Visualization

The input power was 50 W, and the operation time was stable between 3600 s and 8000 s. The qualitative heat flow field of natural convection flow visualization was analyzed for the 15 wt.% graphene thermal grease, as shown in Figure 13 and Figure 14. The chip-on-board LED could transmit heat energy to the aluminum extrusion fin module, and the thermal buoyancy effect gradually formed due to the temperature difference, which caused the heat to gradually diffuse and float to the surrounding environment through natural convection. The temperature heat flow streamline gradually drifted upward. In the right half, the air density of the hot air close to the heat sink fin moved upward slightly, and the cold air density far from the fin moved downward. Owing to the air density difference, the hot air molecules diffused into the cold air molecules, coupled with the gravity effect downward. Furthermore, a thermal vortex flow phenomenon was formed, which drove the airflow around the low temperature. As shown in Figure 14, because flow visualization needs to be observed in the dark, the chip-on-board LED light source was temporarily covered by a shield to observe the heat flow visualization.

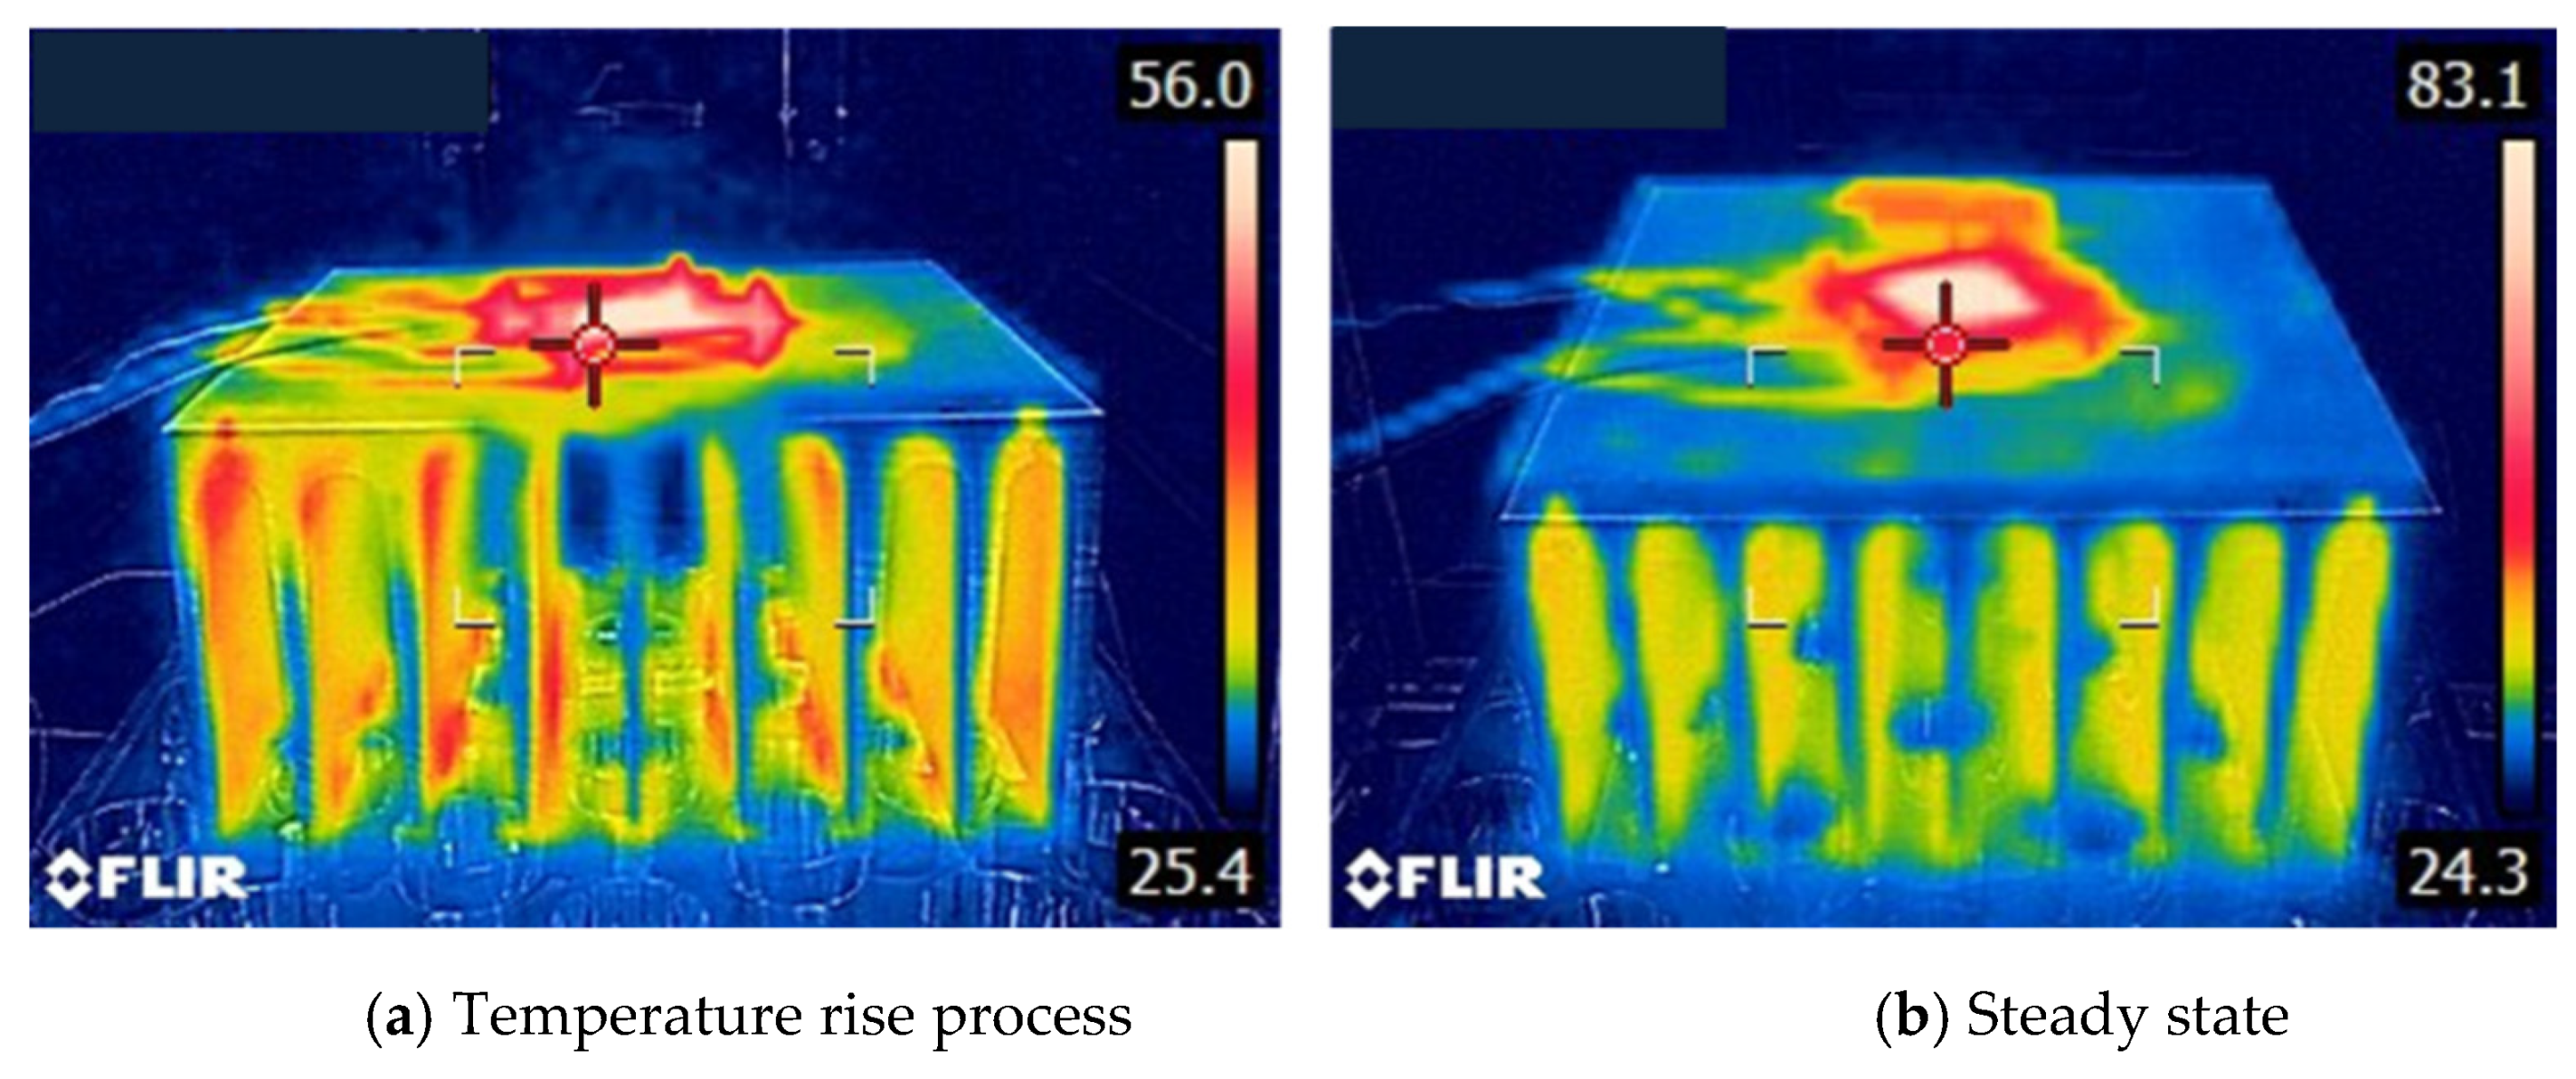
7.4. Thermal Image Temperature Distribution

The 15 wt.% graphene thermal grease was used for experimental testing, and the input power was 50 W. The temperature distribution value of a thermal image was compared with the real measured temperature value to understand its temperature display characteristics. The thermal image value was 83.1 °C, and the temperature between 82.4 °C and 84.4 °C is similar and close to the experimental results. From the other side, the chip-on-board LED exhibited heat transfer to the fin heat sink module. Thermal imager measurement results could be applied to detect the temperature, and it was necessary to adjust reflectivity ε to 0.95, as shown in Figure 15.

7.5. Discussion

The volume heat capacity calculation of natural convection heat dissipation was configured from 50 W to 100 W of the total heat dissipation wattage. As such, the heat transfer capacity to be removed by natural convection was 473,750 mm3 in terms of heat sink volume capacity, which means that 50 W can only be directly contacted by a volume capacity greater than 473,750 mm3. To dissipate the 100 W heat source, the volume capacity was required to be at least above 947,500 mm3. If the volume capacity is greater than 947,500 mm3, the direct-contact heat conduction and heat dissipation must increase the forced convection, and the concentrated heat source can be removed together. Moreover, the contact surface material should be fully closed, and the contact heat conduction material would reach a K value between 12 W/m·K and 13.4 W/m·K for 15 wt.% and a K value between 7 W/m·K and 12 W/m·K for 10 and 20 wt.%. A higher K value indicates a better performance. Aluminum can be extruded, which is economical and affordable, with high material density and at least or above 190–201 W/m·K for AL 6069, AL 6065, AL 6061, or AL 6063, which are suitable. Of course, forging material can be used, but the price is higher than that of aluminum extrusion material. Copper can also be used as the base of the contact surface heat conduction material as the rapid centralized heat source. The extended heat dissipation material with an aluminum fin heat sink is used for the heat transfer of the enhanced convection flow field. Furthermore, a heat pipe, an evaporation chamber, a refrigeration cold plate, and air conditioning bypass cooling can be selected. However, due to the need for customized research and application and the high cost of research and development, the specifications cannot be applied widely, and material configuration is not easy. Thus, we have to consider the characteristics of a chip-on-board LED and the principle of convenient use in the heat transfer method when the high heat source of such an LED is concentrated on the chip to ensure high brightness, power saving, clarity, controllable wattage, long life, and durability.

8. Conclusions

A chip-on-board LED is a solid-state lighting energy-saving lighting element with adjustable input power and high illumination, which enables power saving through a highly concentrated heat source. Thus, for cooling the high heat source of a chip-on-board LED element, a heat conduction approach solution alone cannot be used. It is necessary to analyze when to use natural convection and/or forced convection in combination with the heat transfer capacity of power consumption. Owing to the inconsistency of application occasions, installing a cooling convection heat transfer mode according to the customized type is necessary to reduce the cost of heat transfer cooling components.
Therefore, self-made graphene thermal grease was successfully used as the thermal conductivity material for contact surface heat transfer. We hope that it will become a development option for a new generation of thermally conductive materials. It has a good thermal conductivity performance and is easy to deploy in finished products. It also clearly defines the power analysis boundary between natural and forced convection. When the chip-on-board LED was below 50 W, natural convection was used to solve heat transfer. When the chip-on-board LED was above 50 W, forced convection was used to solve heat transfer. In future research, chip-on-board LEDs, mini/micro-LEDs, laser diodes, and other solid-state lighting elements can be applied in structural and convection heat transfer methods.
Concentrations of graphene thermal grease of 10 wt.% to 30 wt.% were prepared. We found that the graphene was dry and granular due to a lack of silicone oil when the concentration was increased again. When the concentration was reduced, the absorbed silicone oil reached saturation due to an excessively small amount of graphene, resulting in more silicone oil floating above the bottle. Therefore, the range of 10 wt.% to 20 wt.% is considered a good condition for the blending of thin graphene materials. Furthermore, we used thermal FE-SEM imaging to analyze the composition and structure of the graphene thermal greases.
The chip-on-board LED element starting and testing process time was 8000 s. These results show that the temperature of Ta reached 32.6 °C and the chip junction temperature Tj reached 84.4 °C at the graphene thermal grease concentration of 10 wt.%. The temperature of Ta reached 32 °C and the chip junction temperature Tj reached 82.7 °C when the graphene thermal grease concentration was 15 wt.%. The temperature of Ta reached 32.9 °C and the chip junction temperature Tj reached 84.4 °C when the graphene thermal grease concentration was 20 wt.%. The temperature difference ΔT(Tcase − Tf) was smaller and better between the measured temperature Tcase and the fin heat sink module temperature Tf. This means that the heat energy of chip-on-board LEDs can be more effectively transmitted by graphene thermal grease to the fin heat sink, and the heat would gradually dissipate. The heat dissipation effect of graphene thermal grease at a 15% concentration is better, and the temperatures of Tj, Tcase and ΔT are relatively low. The chip-on-board LED displayed thermal distribution and measurement results with a maximum temperature of 83.1 °C from the thermal imager, which is almost consistent with the thermocouple measurement temperature results.
A qualitative heat flow field experiment was conducted to clearly understand the direction and uniformity of thermal flow. Due to the thermal buoyancy effect, hot air was gradually raised, cold air gradually decreased, and the circulation phenomenon of a cold and hot vortex state was gradually formed with the thermal flow streamlined upward. If the temperature distribution is uneven, then flow velocity and an uneven distribution of flow field may occur in the state of thermal streamline. This experiment successfully defined the flow field of the thermal streamline. Due to the high temperature of the fin heat sink, the air around the fin could not pass through the fin surface, thereby forming a thermal boundary layer. With the increase in the thermal buoyancy effect, the hot air flowed upward, the surrounding air temperature gradually decreased, and the thermal boundary layer was gradually lost. When the temperature of Tcase decreased, the input and output power decreased, the overall luminous efficiency increased, and the heat dissipation capacity also increased. With regard to design, if a thermal designer can directly solve the heat dissipation design problem in a chip-on-board LED, including the chip packaging design, conductivity material, and thermal cooling mode, then the heat dissipation of solid-state lighting elements can be improved.

Author Contributions

Conceptualization, C.-N.H.; methodology, C.-N.H.; validation, C.-N.H., K.-W.L. and C.-C.C.; formal analysis, C.-N.H., K.-W.L. and C.-C.C.; investigation, C.-N.H., K.-W.L. and C.-C.C.; resources, C.-N.H.; data curation, C.-N.H., K.-W.L. and C.-C.C.; writing—original draft preparation, C.-N.H.; writing—review and editing, C.-N.H.; visualization, C.-N.H., K.-W.L. and C.-C.C.; supervision, C.-N.H.; project administration, C.-N.H. All authors have read and agreed to the published version of the manuscript.

Funding

This research received external funding by the Ministry of Science and Technology of Taiwan, Republic of China, for financially supporting this study under contract numbers MOST 108-2221-E-167-013-MY2, MOST 104-2221-E-167-015, and MOST 104-ET-E-167-001-ET.

Institutional Review Board Statement

Not applicable.

Informed Consent Statement

Not applicable.

Data Availability Statement

The data are not publicly available.

Acknowledgments

We would like to thank the Ministry of Science and Technology of Taiwan, Republic of China, for financially supporting this study under contract numbers MOST 108-2221-E-167-013-MY2, MOST 104-2221-E-167-015, and MOST 104-ET-E-167-001-ET. We are grateful to C.W. Lu (NCUT) for his assistance with the infrared thermal imager measurement equipment to measure the thermal fluid temperature distribution. C.N. Hsu thanks students T.P. Chen, S.H. Su, P.Y. Chen, and T.H. Hsu for their support in completing the research plan. The authors thank the Green Energy and Engineering Materials Research Center (NCUT) for their assistance with the thermal FE-SEM equipment. The authors also thank Professor M.H. Tsai (NCUT) for providing support with the agitator and electromagnetic rotating mixing platform equipment.

Conflicts of Interest

The authors declare no conflict of interest.

References

  1. Bidsorkhi, H.C.; D’Aloia, A.G.; Tamburrano, A.; De Bellis, G.; Delfini, A.; Ballirano, P.; Sarto, M.S. 3D Porous Graphene Based Aerogel for Electromagnetic Applications. Sci. Rep. 2019, 9, 15719. [Google Scholar] [CrossRef] [PubMed] [Green Version]
  2. Liang, W.; Ge, X.; Ge, J.; Li, T.; Zhao, T.; Chen, X.; Zhang, M.; Ji, J.; Pang, X.; Liu, R. Three-dimensional Heterostructured Reduced Graphene Oxide-Hexagonal Boron Nitride-Stacking Material for Silicone Thermal Grease with Enhanced Thermally Conductive Properties. Nanomaterials 2019, 9, 938. [Google Scholar] [CrossRef] [PubMed] [Green Version]
  3. Mohamed, A.; Tirth, V.; Kamel, B.M. Tribological characterization and rheology of hybrid calcium grease with graphene nanosheets and multi-walled carbon nanotubes as additives. J. Mater. Res. Technol. 2020, 9, 6178–6185. [Google Scholar] [CrossRef]
  4. Naghibi, S.; Kargar, F.; Wright, D.; Huang, C.Y.T.; Mohammadzadeh, A.; Barani, Z.; Salgado, R.; Balandin, A.A. Noncuring Graphene Thermal Interface Materials for Advanced Electronics. Adv. Electron. Mater. 2020, 1–9. [Google Scholar] [CrossRef]
  5. Phuong, M.T.; Trinh, P.V.; Dinh, N.N.; Minh, P.N.; Dung, N.D.; Thang, B.H. Effect of Graphene Nanoplatelet Concentration on the Thermal Conductivity of Silicone Thermal Grease. J. Nano Electron. Phys. 2019, 11, 05039. [Google Scholar] [CrossRef]
  6. Yu, W.; Xie, H.; Chen, L.; Zhu, Z.; Zhao, J.; Zhang, Z. Graphene based silicone thermal greases. Phys. Lett. A 2014, 378, 207–211. [Google Scholar] [CrossRef]
  7. Junaid, M.; Khir, M.H.M.; Witjaksono, G.; Ullah, Z.; Tansu, N.; Saheed, M.S.M.; Kumar, P.; Wah, L.H.; Magsi, S.A.; Siddiqui, M.A. A Review on Graphene-Based Light Emitting Functional Devices. Molecules 2020, 25, 4217. [Google Scholar] [CrossRef] [PubMed]
  8. Chang, C.Y.; Lu, T.C. Application of Graphene in Light Emitting Diodes. Electron. Mon. 2013, 19, 90–99. Available online: https://engineer.windeal.com.tw/supware/temp/i439_elene_0220_90.pdf (accessed on 15 November 2020).
  9. Hsiao, T.J.; Eyassu, T.; Henderson, K.; Kim, T.; Lin, C.T. Monolayer Graphene Dispersion and Radiative Cooling for High Power LED. Nanotechnology 2013, 24, 395401. [Google Scholar] [CrossRef] [PubMed]
  10. Kim, B.J.; Mastro, M.A.; Hite, J.; Eddy, C.R.; Kim, J. Transparent Conductive Graphene Electrode in GaN-based Ultra-violet Light Emitting Diodes. Opt. Express 2010, 18, 23030–23034. [Google Scholar] [CrossRef] [PubMed]
  11. Kang, J.; Li, Z.; Li, H.; Liu, Z.; Li, X.; Yi, X.; Ma, P.; Zhu, H.; Wang, G. Pyramid Array InGaN/GaN Core-shell Light Emitting Diodes with Homogeneous Multilayer Graphene Electrodes. Appl. Phys. Express 2013, 6, 072102. [Google Scholar] [CrossRef]
  12. Yin, L.; Nan, T.; He, P.; Chen, Z.; Yang, L.Q.; Zhang, J. Thermal Performance Enhancement of Light Emitting Diode Device with Multilayer-Graphene Transferred to the Substrate Surface. ECS J. Solid State Sci. Technol. 2017, 6, 35–39. [Google Scholar] [CrossRef]
  13. Lay, K.K.; Cheong, B.M.Y.; Tong, W.L.; Tan, M.K.; Hung, Y.M. Effective Micro-spray Cooling for Light-emitting Diode with Graphene Nanoporous Layers. Nanotechnology 2017, 28, 164003. [Google Scholar] [CrossRef] [PubMed]
  14. Kim, C.M.; Kang, Y.T. Cooling Performance Enhancement of LED (Light Emitting Diode) Using Nano-pastes for Energy Conversion Application. Energy 2014, 76, 468–476. [Google Scholar] [CrossRef]
  15. Colaco, A.M.; Kurian, C.P.; Kini, S.G.; Colaco, S.G.; Johny, C. Thermal Characterization of Multicolor LED Luminaire. Microelectron. Reliab. 2017, 78, 379–388. [Google Scholar] [CrossRef]
  16. Kim, J.; Yim, B.S.; Kim, J.M.; Kim, J.H. The Effects of Functionalized Graphene Nanosheets on the Thermal and Mechanical Properties of Epoxy Composites for Anisotropic Conductive Adhesives (ACAs). Microelectron. Reliab. 2012, 52, 595–602. [Google Scholar] [CrossRef]
  17. Ding, W.T. The Thermal Spreading Resistance Effects Analysis of LEDs. Master’s Thesis, National Chiao Tung University, Hsinchu City, Taiwan, 2014. [Google Scholar]
  18. Lin, Y.; Lu, Y.; Gao, Y.; Chen, Y.L.; Chen, Z. Measuring the Thermal Resistance of LED Packages in Practical Circumstances. Thermochim. Acta 2011, 520, 105–109. [Google Scholar] [CrossRef]
  19. Wang, M.; Tao, H.H.; Sun, Z.H.; Zhang, C.G. The Development and Performance of the High-power LED Radiator. Int. J. Therm. Sci. 2017, 113, 65–72. [Google Scholar] [CrossRef]
  20. Janicki, M.; Torzewicz, T.; Samson, A.; Raszkowski, T.; Napieralski, A.K.T. Experimental Identification of LED Compact Thermal Model Element Values. Microelectron. Reliab. 2018, 86, 20–26. [Google Scholar] [CrossRef]
  21. Kang, H.; Kim, H.; An, J.; Choi, S.; Yang, J.; Jeong, H.; Huh, S. Thermal Conductivity Characterization of Thermal Grease Containing Copper Nanopowder. Materials 2020, 13, 1893. [Google Scholar] [CrossRef] [PubMed] [Green Version]
Figure 1. LED chip packaging modes.
Processes 09 00847 g001
Figure 2. Graphene grease production process using graphene powder and silicone oil mixed to concentrations of 10, 15, and 20 wt.%.
Processes 09 00847 g002
Figure 3. Detection process and operation of the thermal FE-SEM.
Processes 09 00847 g003
Figure 4. Thermal FE-SEM image compositions for 10% graphene grease.
Processes 09 00847 g004
Figure 5. Thermal FE-SEM image compositions for 15% graphene grease.
Processes 09 00847 g005
Figure 6. Thermal FE-SEM image compositions for 20% graphene grease.
Processes 09 00847 g006
Figure 7. Research flowchart for natural convection heat transfer.
Processes 09 00847 g007
Figure 8. Main equipment used in experiments.
Processes 09 00847 g008
Figure 9. Chip-on-board LED of 50–100 W aluminum oxide substrate surface (Tcase) and extrusion heat sink interface using graphene thermal grease in a natural convection experiment.
Processes 09 00847 g009
Figure 10. Time vs. temperature performance curve of 10% graphene grease concentration.
Processes 09 00847 g010
Figure 11. Time vs. temperature performance curve of 15% graphene grease concentration.
Processes 09 00847 g011
Figure 12. Time vs. temperature performance curve of 20% graphene grease concentration.
Processes 09 00847 g012
Figure 13. Thermal streamline flow visualization experiment of natural convection: fin heat sink up.
Processes 09 00847 g013
Figure 14. Thermal streamline flow visualization experiment of natural convection: fin heat sink down.
Processes 09 00847 g014
Figure 15. Temperature distributions of chip-on-board LED and heat sink.
Processes 09 00847 g015
Table 1. The chip-on-board LED basic specifications and extrusion aluminum heat sink.
ItemsSpecificationPhoto Picture
LensSilicon/polymer Processes 09 00847 i001
ElectrodesAg plating copper alloy
Chip dimensionsChip-on-board InGaN/GaN for third generation
40 × 40 × 1 mm3
Defined power50 W min and 100 W max
DC current1560 mA and 3120 mA
Forward voltage32 Vf
Surface case temperature (Tcase)<75 °C max
Junction temperature (Tj)<125 °C max
Heat sink materialExtrusion aluminum AL 6069
L × W × H: 125 × 125 × 70 mm3
Heat conductivity coefficient: 180–200 W/m·K
Processes 09 00847 i002
Table 2. Temperature performance data of ΔT (Tcase − Tf) of various graphene grease concentrations (wt.%).
Temperature
ΔT (Tcase − Tf)
Graphene Thermal Grease (wt.%)
Time (s)10%15%20%
00 °C0 °C0 °C
40013.5011.0613.12
80014.1012.1014.02
200014.3313.4615.45
280014.5913.9715.90
360014.7914.0116.02
440015.2014.1016.04
520015.3514.1116.05
600015.5714.1116.05
680015.6914.1216.06
760015.6914.1216.06
800015.6914.1216.06
Table 3. Temperature performance data of Tcase of various graphene grease concentrations (wt.%).
Temperature
Tcase
Graphene Thermal Grease (wt.%)
Time (s)10%15%20%
025 °C25 °C25 °C
40049.2146.5149.08
80059.7757.0659.92
200074.3671.1174.49
280077.5974.3777.85
360079.0174.4979.21
440079.0274.6979.30
520079.0474.8979.32
600079.0875.0179.36
680079.0875.0879.36
760079.0875.1379.36
800079.0875.1679.36
Table 4. Temperature performance data of chip junction temperature Tj of various graphene grease concentrations (wt.%).
Temperature
Tj
Graphene Thermal Grease (wt.%)
Time (s)10%15%20%
025 °C25 °C25 °C
40068.5067.0768.37
80074.3572.8774.36
200082.1580.4482.12
280083.7682.0483.79
360084.0782.1084.38
440084.1282.1384.40
520084.1482.2384.42
600084.2782.3384.44
680084.3982.3384.44
760084.3982.4384.44
800084.3982.4384.44
Table 5. Temperature performance data of Tcase, Tj and Ta of various graphene grease concentrations (wt.%).
TemperatureGraphene Thermal Grease (wt.%)
Items10%15%20%
Tambient25–32.6 °C25–32 °C25–32.9 °C
Tcase79.1 °C75.2 °C79.4 °C
Tj84.4 °C82.4 °C84.4 °C
Publisher’s Note: MDPI stays neutral with regard to jurisdictional claims in published maps and institutional affiliations.

