Article

Enhanced Resistance to Amylolysis in Rice Kernels through Interaction with Chlorogenic Acid

1
Department of Food Science and Biotechnology, National Chung Hsing University, Taichung 40227, Taiwan
2
Agricultural Chemistry Division, Taiwan Agricultural Research Institute, Council of Agriculture, Taichung 41362, Taiwan
3
Department of Chemistry, National Chung Hsing University, Taichung 40227, Taiwan
*
Author to whom correspondence should be addressed.
Processes 2021, 9(5), 788; https://doi.org/10.3390/pr9050788
Submission received: 30 March 2021 / Revised: 23 April 2021 / Accepted: 29 April 2021 / Published: 30 April 2021
(This article belongs to the Special Issue Biological Activity Evaluation Process of Natural Antioxidants)

Abstract

:
In this study, rice-phenolic acid complexes were prepared by processing rice kernels in chlorogenic acid (CGA) solutions of different concentrations, followed by heating at different adsorption times. An adsorption treatment of 80 °C for 3 h effectively enhanced the complexation of rice samples with CGA (3.86 mg/g) and imparted antioxidant capacities to the complex. An apparent interaction between CGA and rice starch molecules was suggested by electrospray ionization mass spectrometry analysis. Our results revealed that rice samples were functionalized with CGA by modifying their physicochemical properties by increasing swelling ability (9.1%) and breakdown value (24.7%), and retarding retrogradation (−9.8%). The complexation of rice with a high dose of CGA could significantly reduce in vitro and in vivo starch digestibility by 41.9% and 23.0%, respectively, relative to control. This treatment is considered a potential way to confer rice with an increased resistance to digestion, along with desirable pasting properties.

1. Introduction

Positive associations between high-carbohydrate diets and increased risk for diabetes and cardiovascular disease are widely recognized. The effectiveness of various natural ingredients (e.g., phenolic compounds) to attenuate starch digestion have been accessed as a potential strategy to reduce glycemic excursions [1]. The consumption of slowly digestible starch and resistant starch have been shown to delay the increase of postprandial blood glucose concentration [2]. However, the application of resistant starch in baked goods is limited because of its adverse quality impacts on texture, softness, gluten network formation, and other functional properties [3]. The restriction of different physicochemical properties, such as swelling, viscosity, and degree of gelatinization, might make resistant starch unfavorable for applications in moisture holding, thickening, and gel forming [4].
Naturally occurring polyphenols, isolated from various plant materials, have been shown to exhibit an inhibitory effect on a number of digestive enzymes, including amylase, protease, and lipase [5]. The binding of enzyme inhibitors (e.g., tea polyphenols) with α-amylase would lead to some structural alternations in the enzyme molecules, and subsequently affect their binding properties with starch [6]. The interactions between phenolic compounds and starch molecules have gained research focus over the last two decades due to the possible impacts on nutrition and food properties. Factors affecting the functional properties of starch-based foods include the type of phenolic compounds and starch, concentration of phenolic compounds, food processing conditions, and food composition [7]. Previous studies have shown that different phenolic cinnamic acid derivatives might compete with starch molecules for the active sites of amylolytic enzymes, leading to the suppression of the hydrolytic efficiency of starch [8]. Modulation of the in vitro starch digestibility could be achieved through modification of starch with phenolic compounds. The ability of phenolic compounds to form complexes with macronutrients has also been associated with the reduction in their nutritive values [5].
Recent studies have reported a pronounced increase in resistant starch in rice extrudates obtained by combining rice flour and chlorogenic acid through a twin-screw extruder [9]. Some recent findings indicate that complexation interactions between rice kernels and some naturally occurring enzyme inhibitors can be formed and enhanced under appropriate processing conditions. An apparent reduction in starch digestibility has been observed under such conditions. Unlike resistant starch, it was observed that some desirable physicochemical properties (i.e., viscosity) of rice-inhibitor complex remained unchanged. As such, these observations provide an opportunity to exploit rice that is resistant to starch digestion, which elicits a low glycemic response, while maintaining desirable functional properties.
Considering that phenolic compounds or extracts were one of the natural materials that were able to modify the chemical and functional properties of starch, rice-phenolic acid complex was prepared by mixing starch and chlorogenic acid (CGA) under different processing conditions in this present study. Constructed from the background and studies mentioned previously, the aim of this present study was to investigate the potential of these rice-CGA complex (RCC) samples to resist amylolysis through interaction with CGA. After the complexation of rice starch molecules with CGA, changes in some physicochemical properties and characteristics of the RCC samples were evaluated.

2. Materials and Methods

2.1. Preparation of Rice-CGA Complex Samples

Aqueous solutions of CGA with two concentrations (0.5 and 1.0 g/100 mL) were first prepared by dissolving 5-caffeoylquinic acid (C3878, Sigma-Aldrich, St. Louis, MO, USA) in distilled water. According to the methods described by Bermúdez-Oria et al. [10], with modifications, about 20 g of broken rice kernels (obtained from the local market in Taichung, Taiwan) that passed through an 8-mesh screen was mixed with the CGA solutions at a ratio of 2:3 (w/v), and heated at 80 °C for 30 min in a water bath. The samples were then placed in an oven at 80 °C for 1–4 h for thermal absorption. The samples collected at different heating times were washed by stirring with distilled water (1:15, w/v) for 1 min, followed by centrifugation at 2400× g for 10 min. The washing procedure was repeated twice, and all supernatants were collected, combined, and assayed for the content of unbound CGA. Following the above procedure, a control was prepared by cooking the screened rice powder in distilled water at 80 °C for 30 min, and drying in an oven at 80 °C for 3 h in this study. The washed samples were again dried at 80 °C to obtain different rice samples which would be finely ground and stored in a dry cabinet at room temperature for further analysis.

2.2. Determination of CGA Content in the Complex Samples

During the preparation of RCC samples (obtained from Section 2.1), the supernatants were collected and then filtered using a 0.45 μm PVDF syringe filter (Acrodisc, Pall Corporation, Ann Arbor, MI, USA). The total content of CGA in the filtrate was measured spectrophotometrically at 324 nm (Genesys 10S UV-Vis, Thermo Fisher Scientific Inc., Waltham, MA, USA) using AOAC method 957.04 [11]. The amount of CGA bound to the complex sample was determined by subtracting the unbound CGA content in the filtrate from that in the initial solution.

2.3. Determination of Antioxidant Activity by TEAC Method

Based on the Trolox equivalent antioxidant capacity (TEAC) assay described by Miller et al. [12], with minor modifications, the total antioxidant activity of rice samples was measured relative to the ABTS•+ scavenging ability of 6-hydroxy-2,5,7,8-tetramethylchroman-2-carboxylic acid (Trolox), a hydrophilic analog of vitamin E. ABTS•+ radical cation was generated by the interaction of ABTS (100 μM), H2O2 (50 μM), and peroxidase (4.4 units/mL). A mixture of 0.25 mL of sample suspension (0.4 g/mL), with an equal volume of ABTS, H2O2, peroxidase solution, and 1.5 mL of deionized water, was allowed to react for 10 min. The antioxidant activity was measured colorimetrically at 734 nm, and the decrease in absorption at 734 nm was used to determine the TEAC value.

2.4. Determination of Swelling Ability and Water Solubility Index

The swelling abilities of different rice samples were determined by the methods described by Wu et al. [13], with minor modifications. Sample suspension (2%, w/v) was heated at 95 °C in a shaking water bath (90 rpm) for 30 min, followed by cooling to room temperature. After sedimentation by centrifugation (8000× g) for 20 min, the precipitate was weighed (Wp), and the supernatant was dried at 100 °C in an oven to a constant weight (Ws). The water solubility index and swelling ability were determined by the following equations:
Swelling   ability   ( g g ) = weight   of   precipitate   ( W p ) weight   of   sample dry   weight   of   supernatant   ( W s )
Water   solubility   index   ( % ) = dry   weight   of   supernatant   ( W s ) weight   of   sample × 100 %

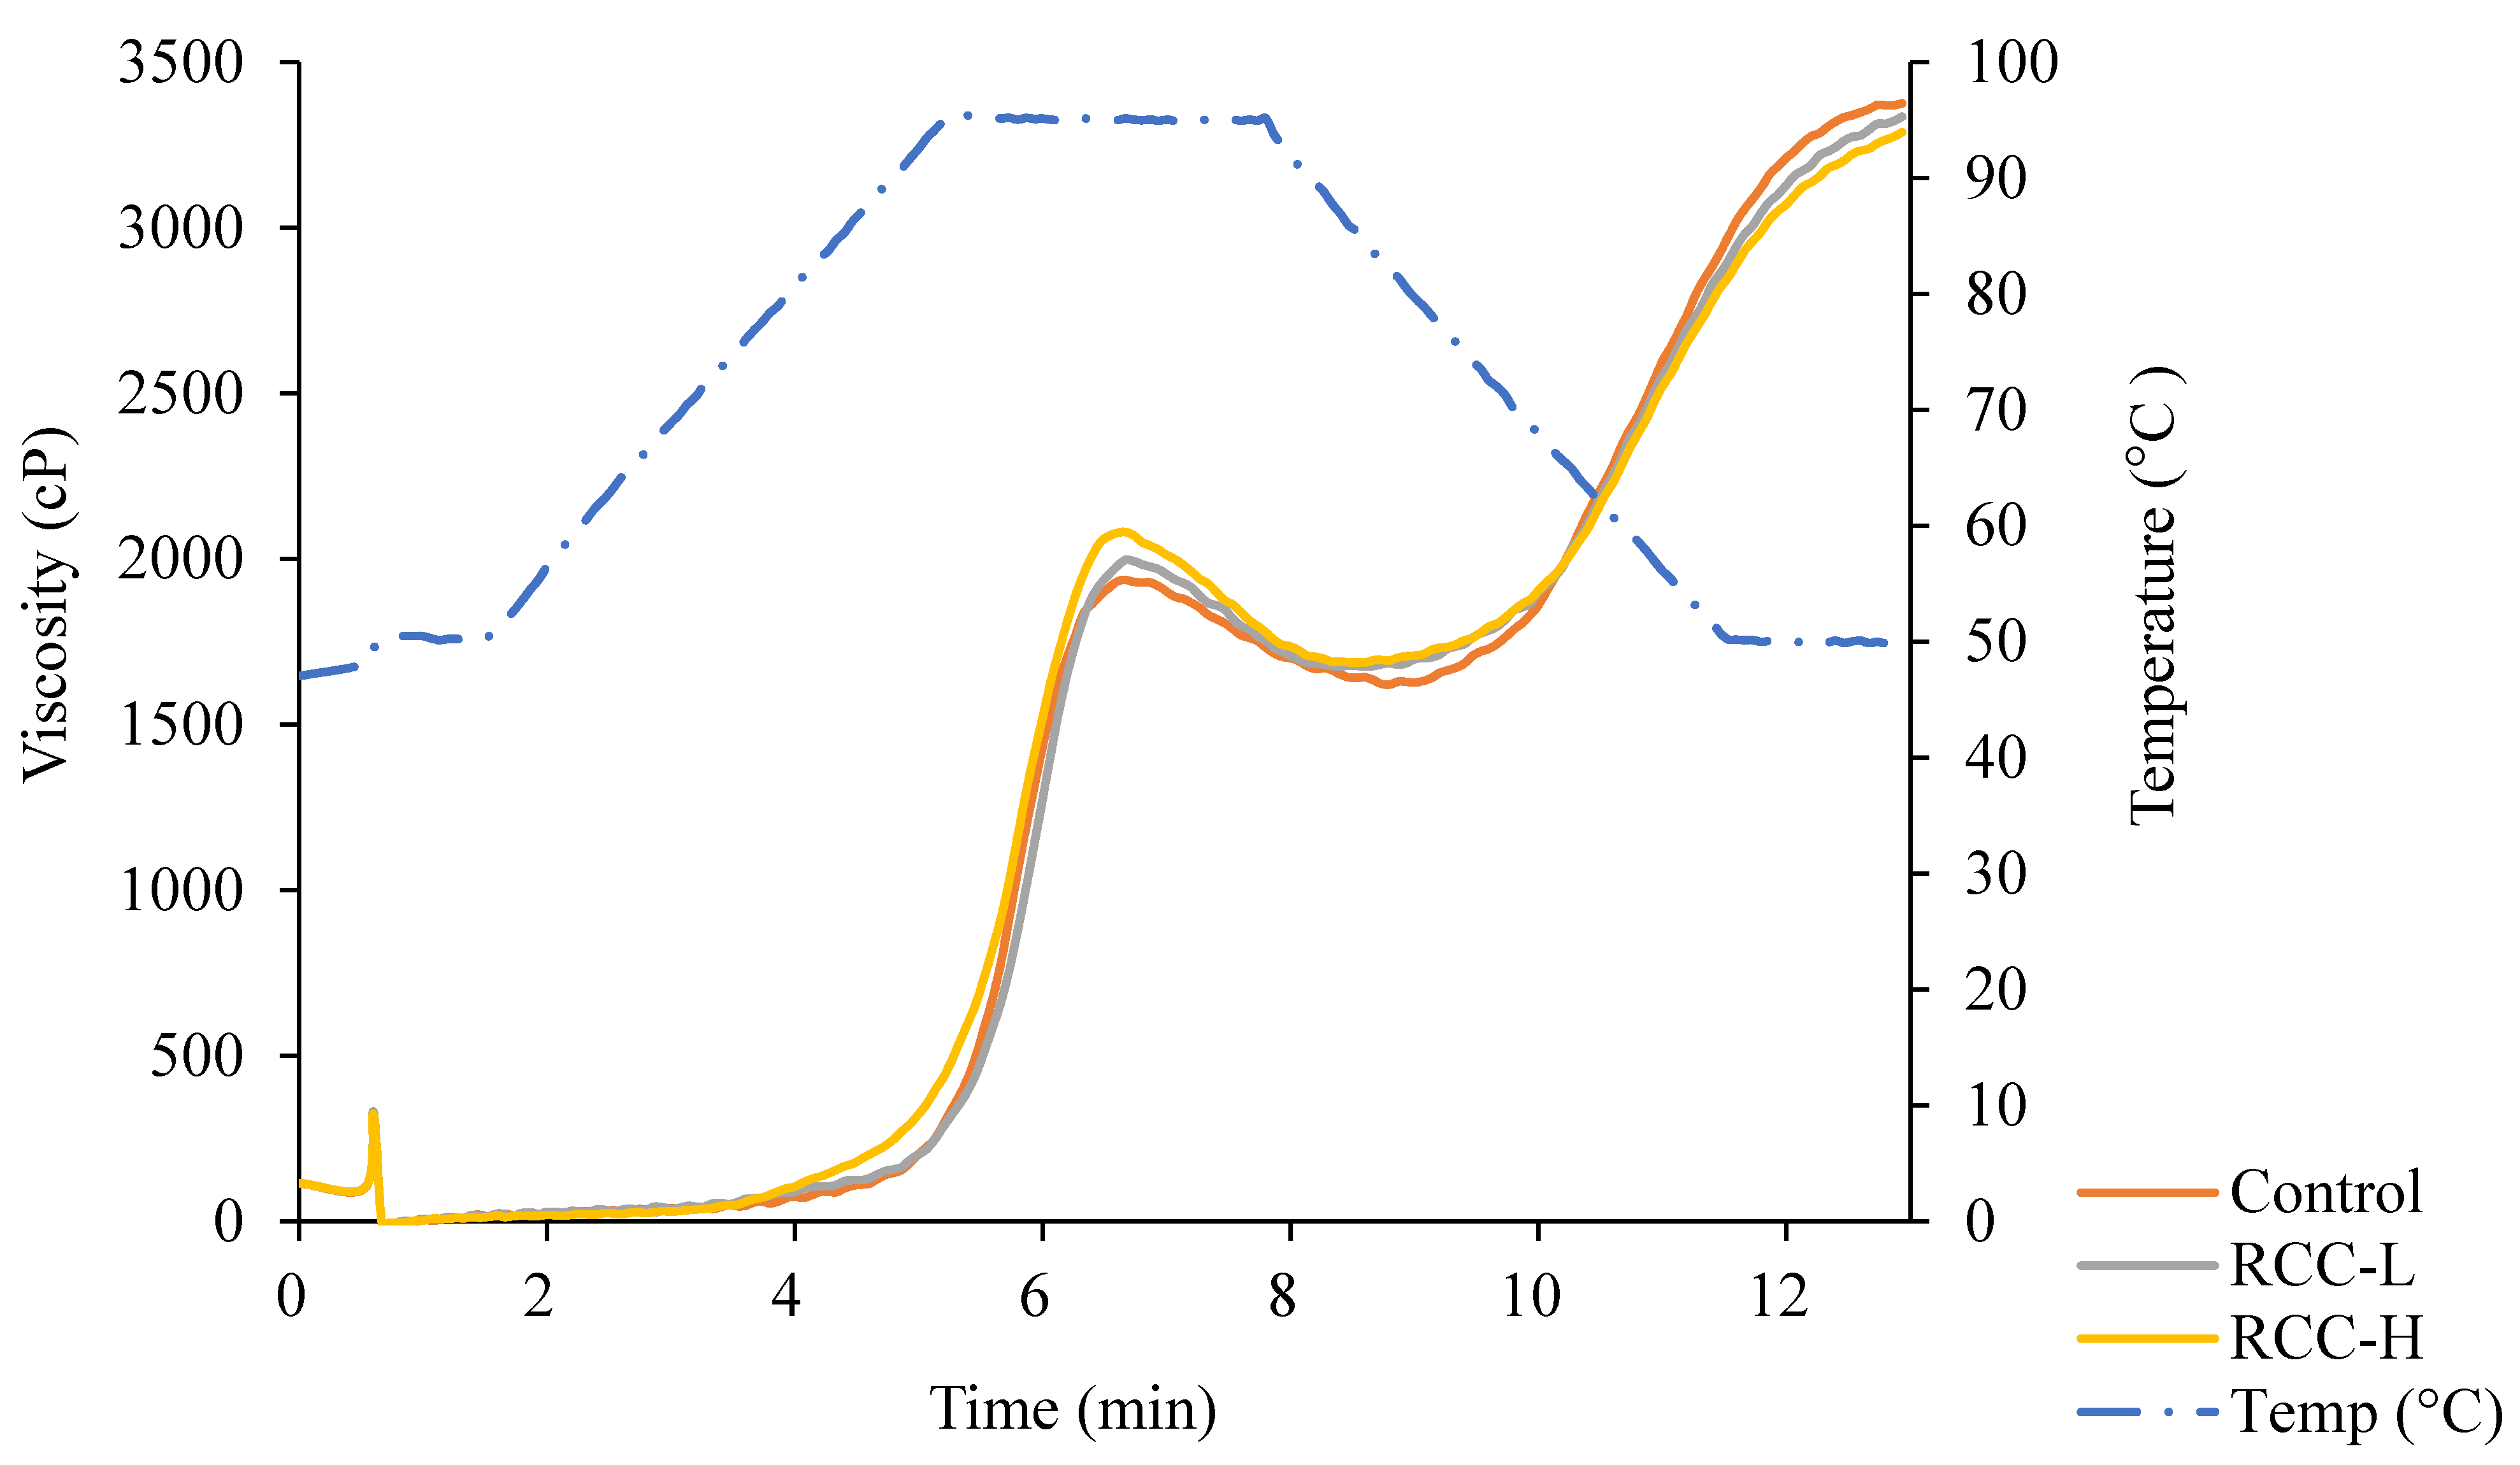
2.5. Determination of Pasting Properties

The pasting properties of RCC samples were measured by the methods described by Wu et al. [4], with slight modifications. The changes in viscosity were analyzed using a Rapid Visco Analyser (Model RVA-Super 3, Newport Scientific Pty Ltd., Warriewood, NSW, Australia) equipped with the Thermocline software (version 2.3, Newport Scientific Pty Ltd., Warriewood, NSW, Australia). Sample suspensions were prepared by mixing the control and RCC samples in distilled water at a ratio of 1:9 (w/w) in a canister. The suspension was equilibrated at 50 °C for 1 min, heated to 95 °C at a rate of 12.2 °C per min, and then held at 95 °C for 2.5 min. After being cooled to 50 °C at a rate of 11.8 °C per min, the sample was held at 50 °C for 2 min. The peak viscosity, trough viscosity, breakdown viscosity, final viscosity, setback viscosity, and pasting temperature were recorded. The viscosity was expressed in centipoise (cP).

2.6. Determination of Resistance to Amylolysis

In order to determine the resistance of different rice samples to amylolytic hydrolysis, rice sample solutions (5 g/100 mL) were first prepared with 0.02 M phosphate buffer (pH 6.8) and heated in a hot water bath at 80 °C for 30 min. Following the methods described by Chau et al. [14], with slight modifications, the resistance of starch samples to enzyme hydrolysis were determined. After cooling to room temperature, 10 mL of starch suspension and 1 mL of 0.02 M phosphate buffer (pH 6.8) containing α-amylase (Cat. No. 100447, ICN Biomedicals) (0.1 mg/mL) were incubated at 37 °C for 30 min. The enzyme reaction was terminated by boiling for 15 min. After centrifugation (3500× g) for 15 min, the amount of maltose formed was determined colorimetrically at 540 nm by the 3,5-dinitrosalicylic acid assay.

2.7. Determination of In Vivo Starch Digestibility

The animal use protocol was reviewed and approved by the Institutional Animal Care and Use Committee (IACUC) of National Chung Hsing University (IACUC approval number 109-105). The laboratory animals were cared for in accordance with the institutional ethical guideline. Twenty 8-week-old male Sprague-Dawley (SD) rats weighing 264.3 ± 13.9 g were obtained from BioLASCO (A Charles River Licensee Corp., Taiwan). The animals were housed in stainless steel, screen-bottomed cages, and placed in a room maintained at 22 ± 2 °C and 60 ± 5% relative humidity with 12 h light/dark cycle. Food and water were given ad libitum.
After one week of acclimation, the animals were randomly divided into four weight groups of five each. The five animals in each weight group were randomly assigned to one of the four experimental groups including ‘baseline’, ‘control’, ‘RCC-L’, and ‘RCC-H’ groups. After being starved for 12 h, the animals in the control, RCC-L, and RCC-H groups were given the control, RCC-L, and RCC-H samples at a level of 1 g/kg, respectively. Blood samples from all groups were then collected via tail vein between 0 and 180 min. Blood glucose levels were measured by glucometer (AB-103G, Apexbio, Taiwan). The areas under the curve (AUC) of blood glucose during the 180 min observation were calculated using the trapezoidal rule method described by Matthews et al. [15].

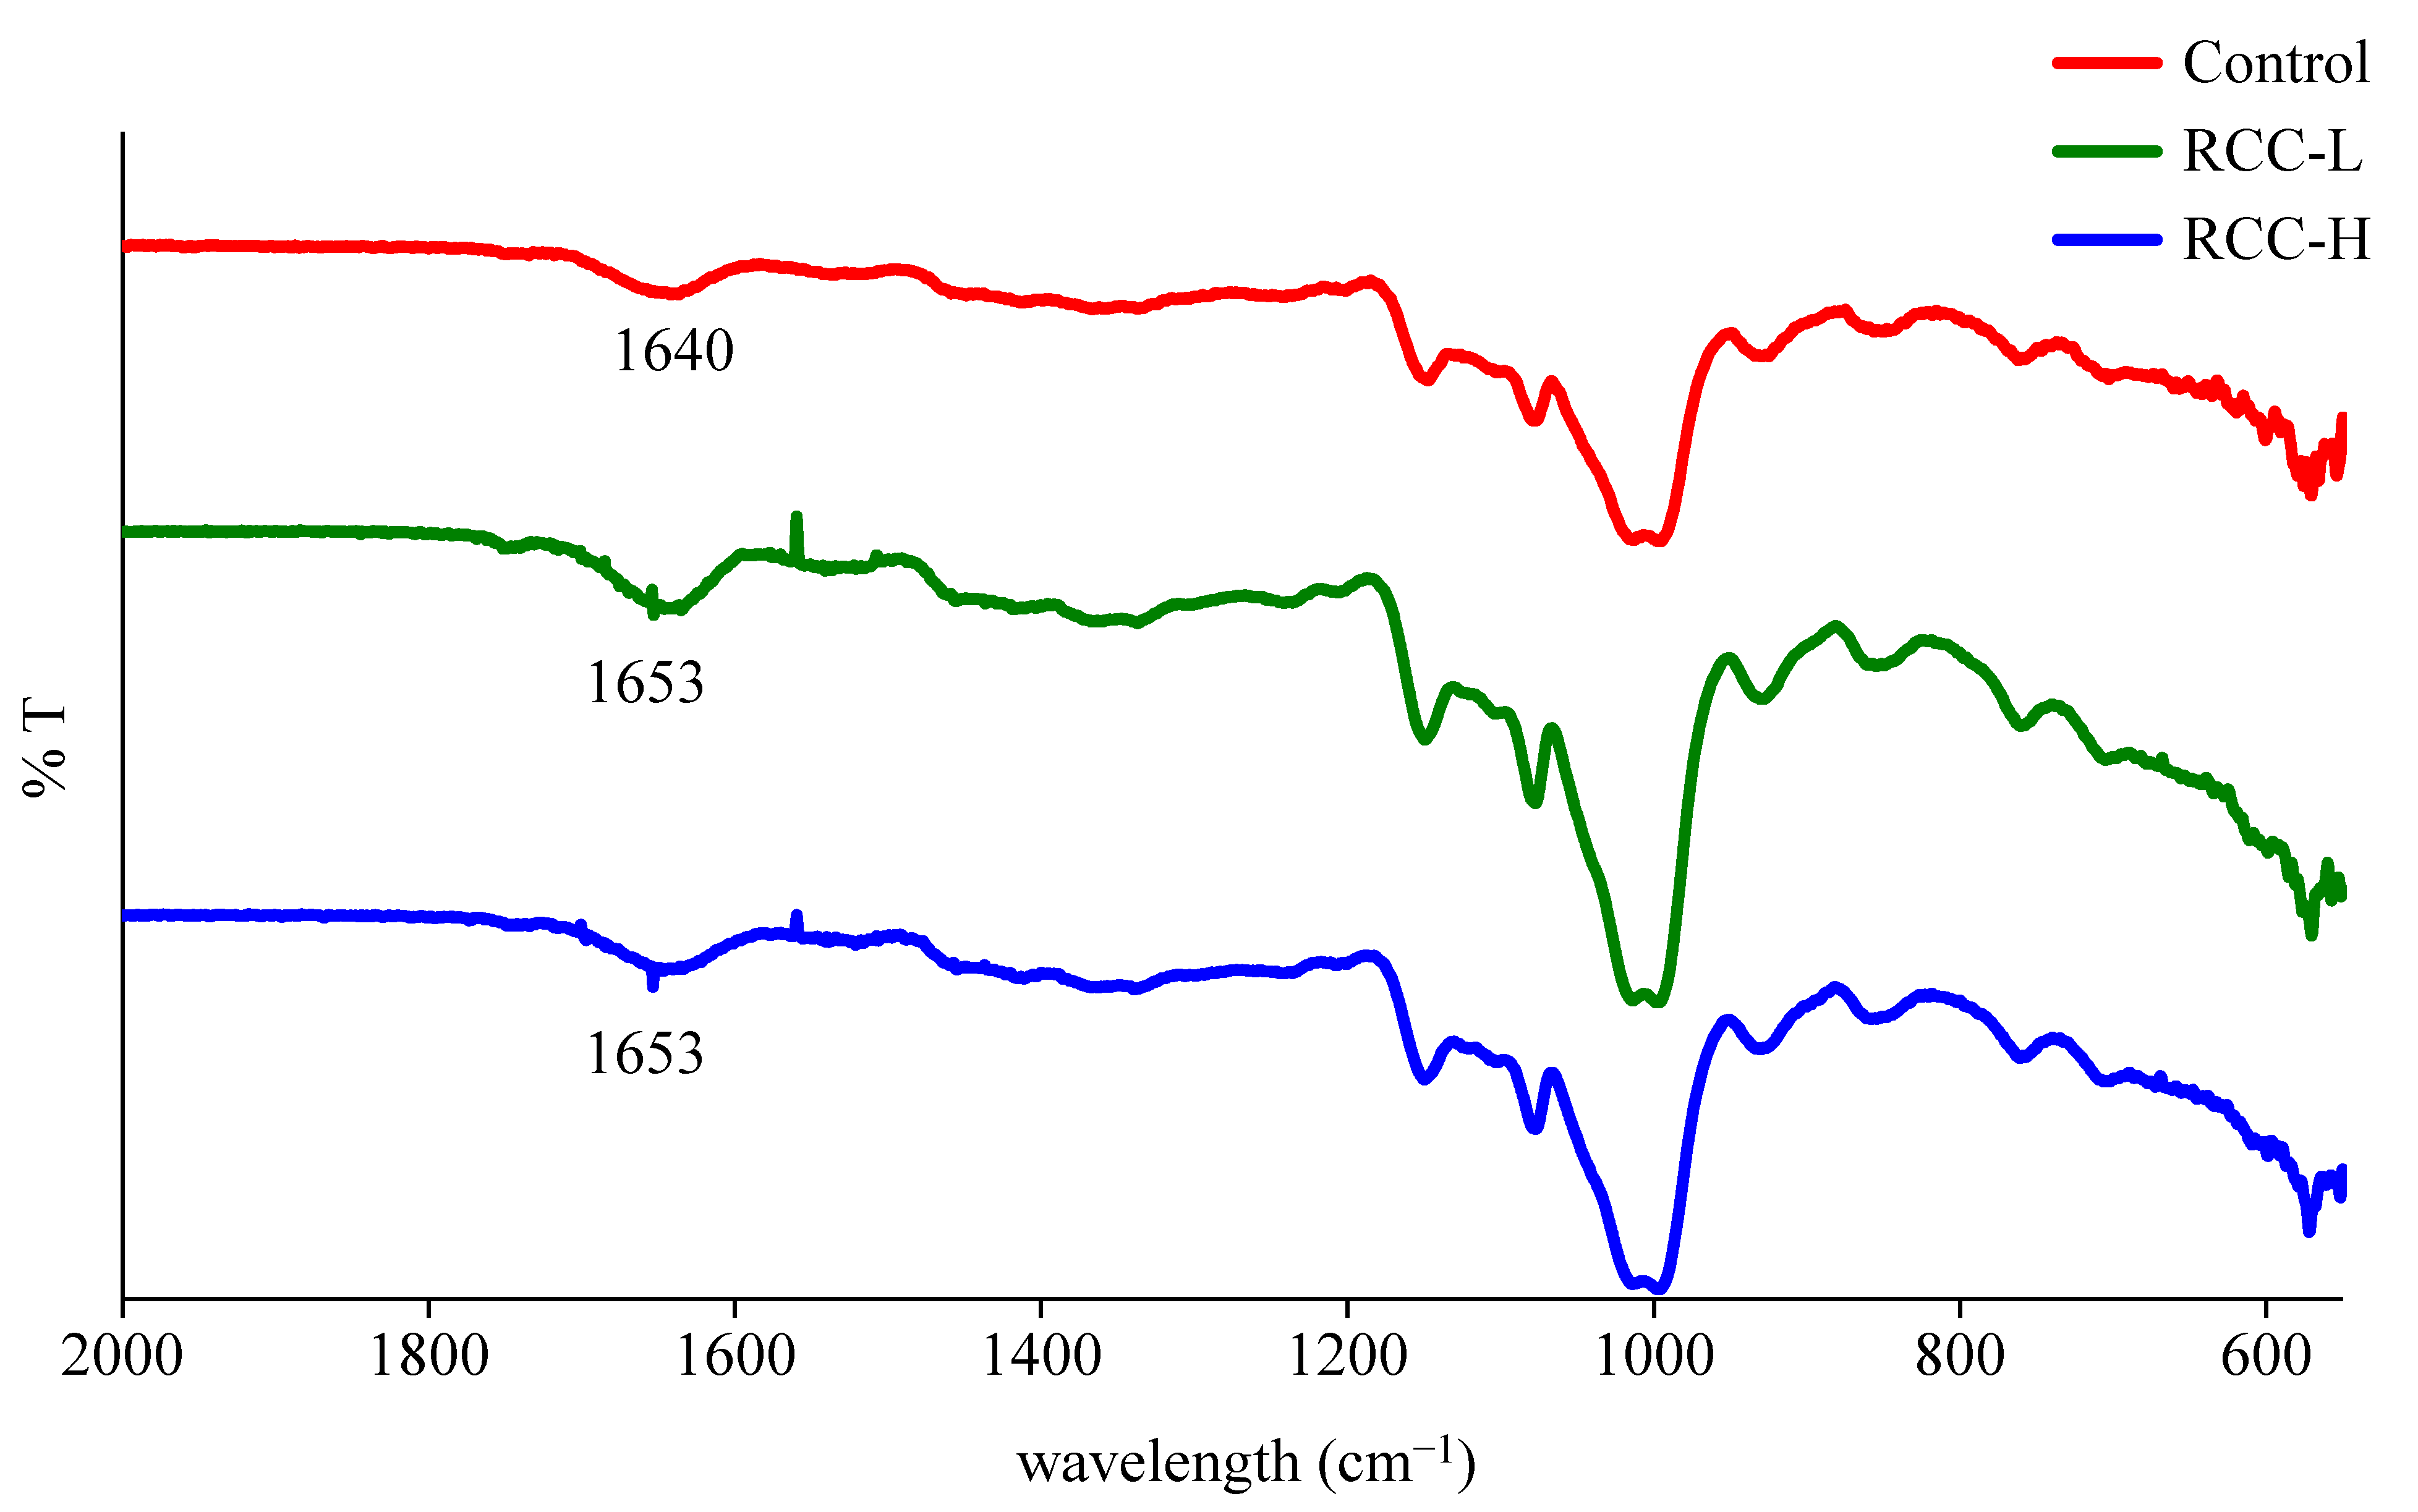
2.8. Fourier Transform Infrared (FT-IR) Spectroscopy Analysis

According to the method described by Liang et al. [16], FT-IR spectra of control, RCC-L, and RCC-H samples were obtained and detected the interaction using a PerkinElmer Fourier transform infrared spectrometer (PerkinElmer, Waltham, MA, USA) equipped with an attenuated total reflectance accessory. FT-IR spectra was acquired over a scan range of 4000–450 cm−1 with a scan number of 20 and a resolution of 2 cm−1. Spectra were collected and analyzed using the Origin Pro 8.6 program (Origin Lab Inc., Northampton, MA, USA).

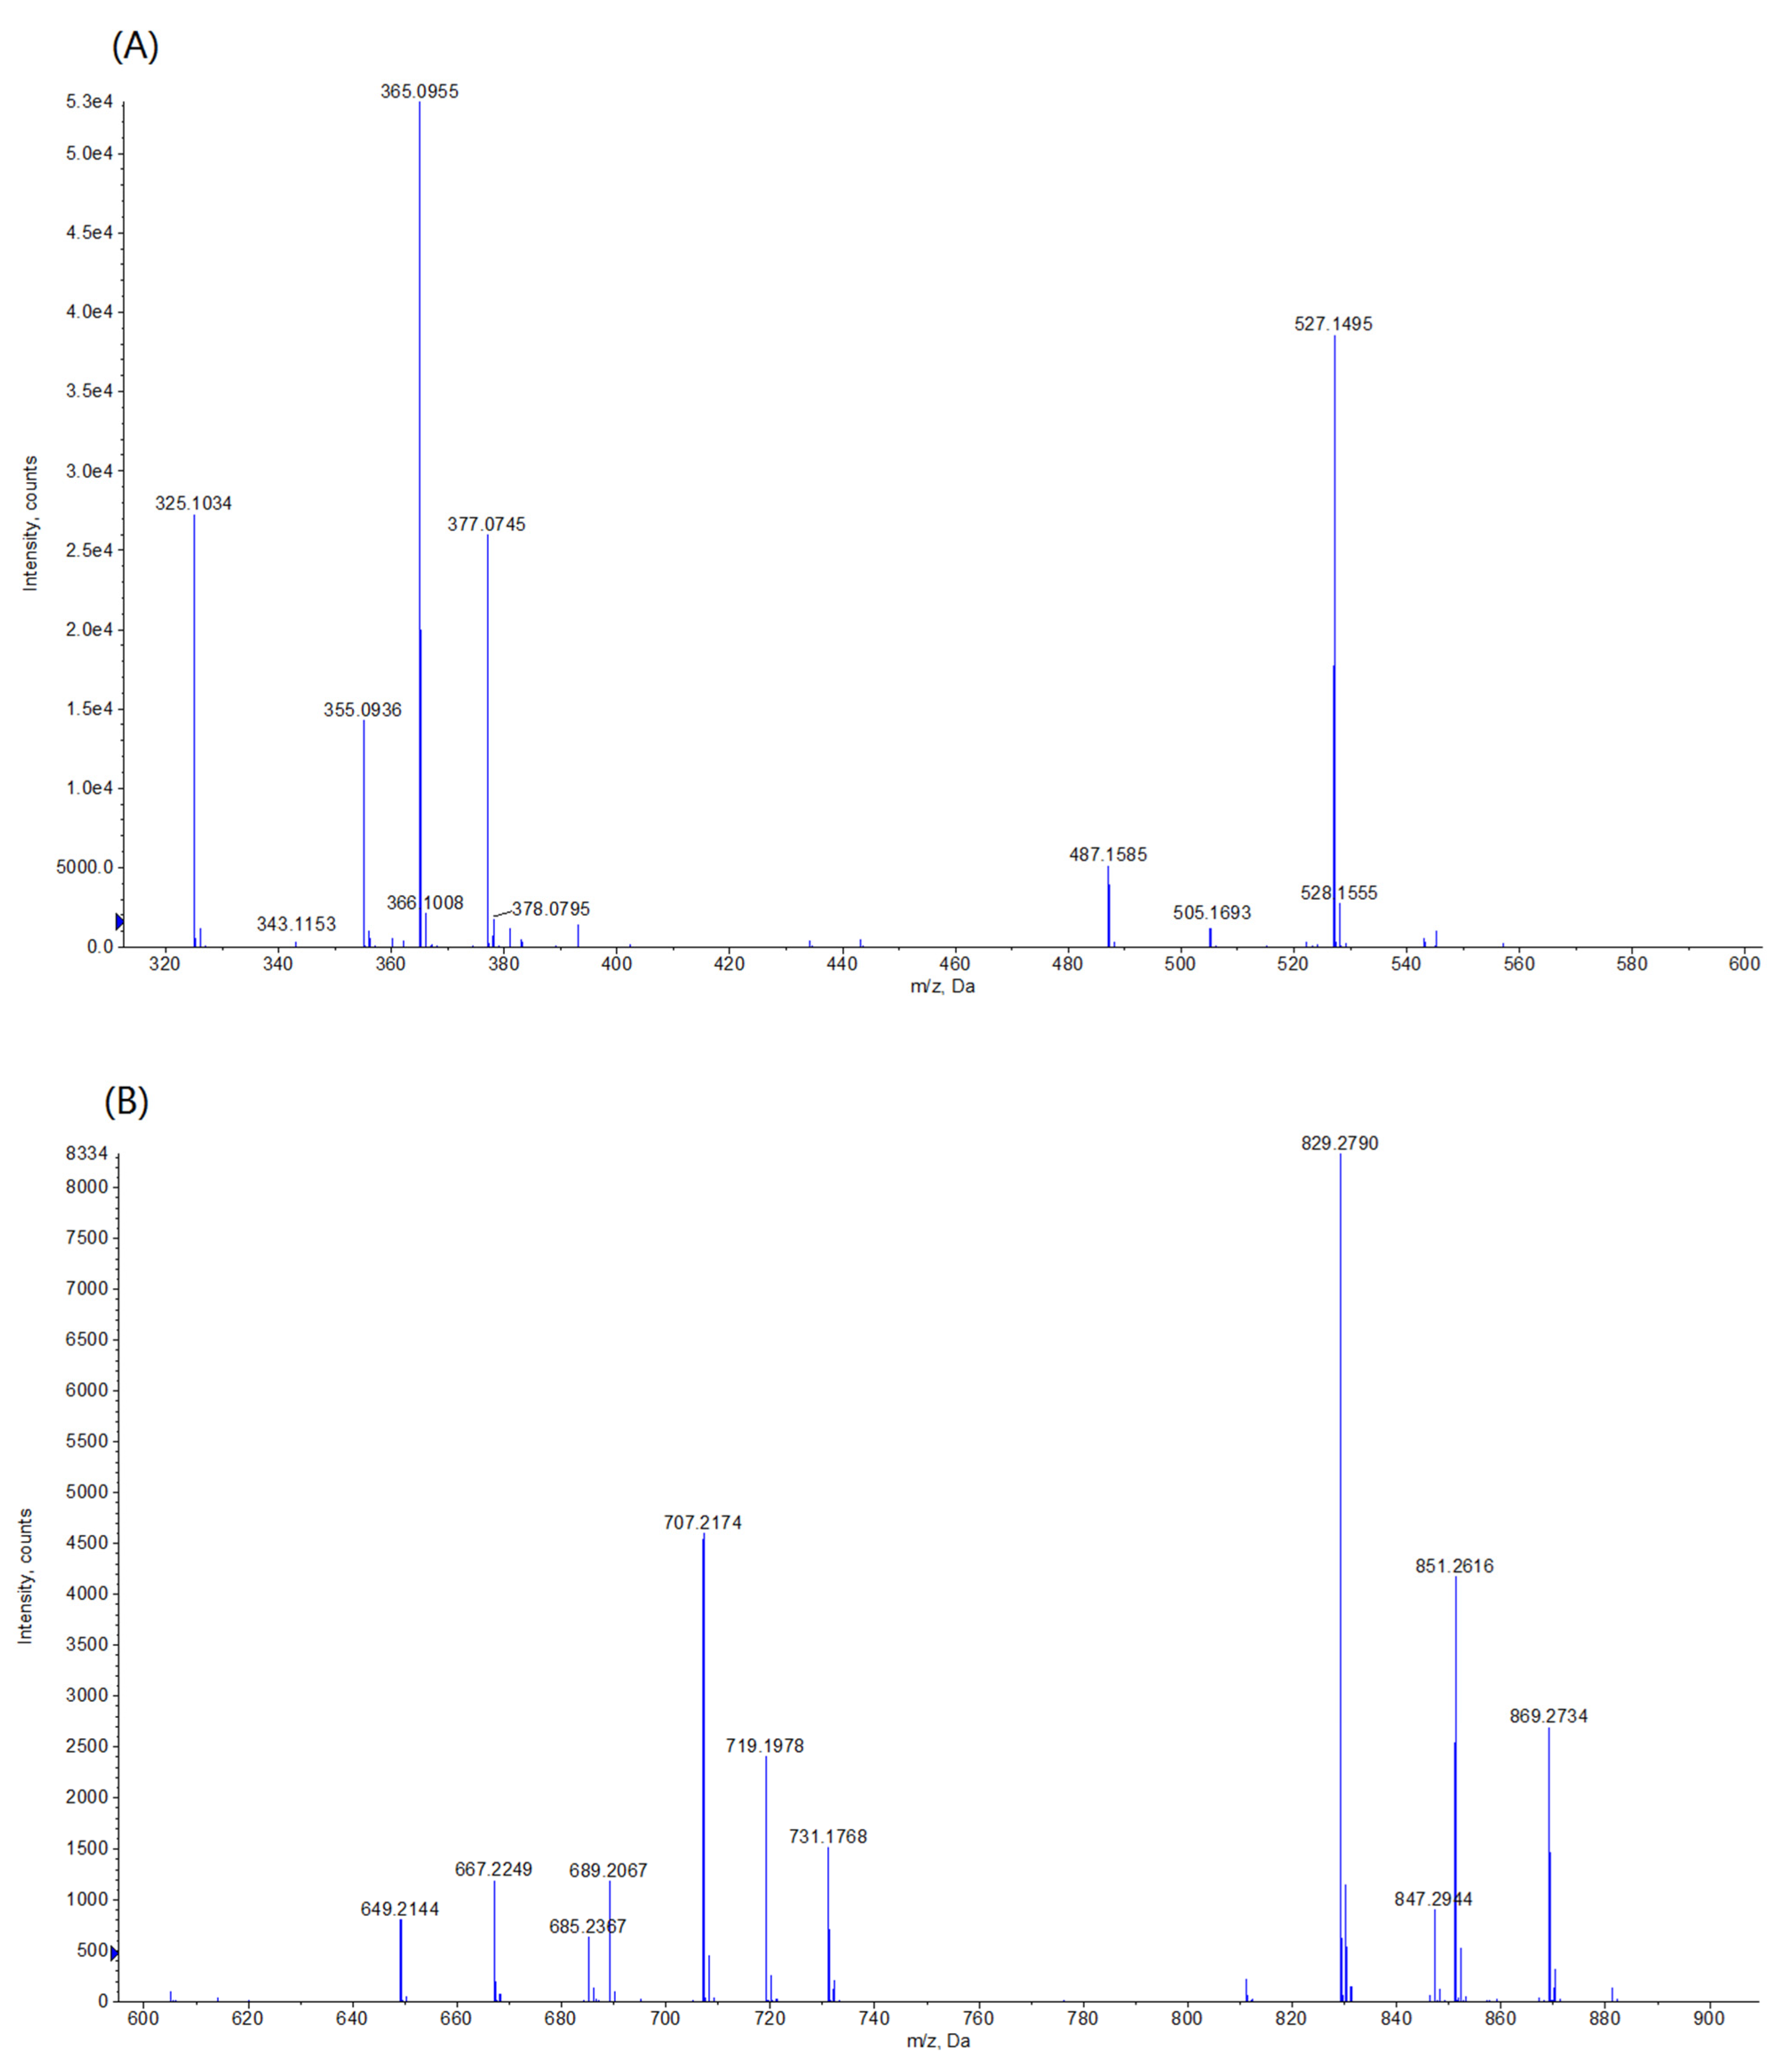
2.9. Electrospray Ionization Time-of-Flight Mass Spectrometry (ESI-TOF-MS) Analysis

After termination of amylolytic hydrolysis by boiling, the hydrolysate mixture (obtained from Section 2.6) was dialyzed against distilled water in the refrigerator for 24 h using a dialysis membrane with a cutoff molecular weight of 10,000. The dialysate was further ultrafiltered using a Microsep Advance Centrifugal Device with Omega Membrane (PALL Corporation, Port Washington, NY, USA) at a molecular weight cut-off of 1 kDa. Thereafter, the fraction (<1 kDa) was collected for further analysis.
ESI-TOF-MS analysis was performed on a QSTAR Elite System (Applied Biosystems/MDS Sciex, Concord, ON, Canada) coupled with an ESI interface and was operated in positive ion mode. The MS operating parameters were as follows: flow rate 3 μL/min; ESI voltage, 1 kV; GS1, 0 psi; GS2, 0 psi; curtain gas, 20 psi; DP, 70 V; focusing potential, 280 V; DP2, 15 V; default energy in collision cell, 5 eV. Data acquisition was performed in infusion mode with MCA. The mass of TOF ranged from m/z 200–2000. Accumulation time was set to 1 s. The mass analyzer was calibrated using polypropylene glycol (0.1 mM) by direct injection at a flow rate of 3 µL/min. The data were acquired and processed using Analyst QS 2.0 software (Applied Biosystems/MDS Sciex).

2.10. Statistical Analysis

The experimental data represent a mean of three replicates. Statistical differences among groups were analyzed by t-test or one-way ANOVA with the use of a statistical analysis system (version 20.0; SPSS, Armonk, NY, USA). Statistical significance difference was defined at p < 0.05.

3. Results and Discussion

3.1. CGA-Binding Capacity in the Complex

In this study, the proximate composition of protein, carbohydrate, fat, and moisture of the native rice samples were 6.6 g/100 g, 77.2 g/100 g, 0.74 g/100 g, and 15.5 g/100 g, respectively. Rice samples were first cooked in a CGA solution at 80 °C and subsequently washed to remove unbound CGA. The binding of CGA to rice starch molecules was further estimated by measuring the content of water-extractable CGA from different RCC samples.
Table 1 shows the amount of CGA bound to rice samples prepared with CGA solutions of different concentrations (0.5 and 1.0 g/100 mL), namely RCC-L and RCC-H, respectively. The freshly cooked RCC-L and RCC-H samples had comparable amounts of CGA (1.88 and 2.00 mg/g of RCC, respectively) initially. Previous studies [17,18] have also demonstrated that polysaccharides had the ability to form complexes with phenolic compounds, and to present an obvious antioxidant capacity.
After further heat treatment in an oven at 80 °C for 1 to 4 h, Table 1 reveals that the level of bounded CGA in the RCC samples increased as the time for thermal absorption was extended. More specifically, remarkable increases in the CGA contents from their initial values to 2.60 mg/g and 3.95 mg/g, respectively, were observed for both the RCC-L and RCC-H samples after 2 h of heating. No further increase in the CGA contents in these RCC samples were observed beyond 2 h of heating, suggesting that the level of bounded CGA reached a steady and maximum value. It has been reported that some polyphenols (e.g., ferulic acids) show good adsorption onto polysaccharides such as cellulose at various temperatures [19]. Zheng et al. [9] has also reported the occurrence of complexation between rice flour and polyphenols when a starch gel network was set by hot extrusion. It was inferred that the increased creation of associations between the rice and CGA with increasing temperature was likely attributed to hydrophobic interactions, which are endothermic processes [20].
It was interesting to note that an attempt to heat the RCC samples at a higher temperature (100 °C) was tried in some of our preliminary studies. This processing condition was found to result in an approximately 20–30% decrease in the bounded CGA contents. This may be attributable to the observation that the quantity of adsorbed phenolic acids decreased with an elevation of adsorption temperatures, and in general depended on their structures [21]. Many phenolic acids like CGA were susceptible to pressure, shearing forces, or high temperature (e.g., 100 °C) [22], so an adsorption temperature of 80 °C was therefore used in the present study.
In general, considerably higher amounts of CGA were found in the RCC-H samples (38.3–97.5%) after two hours of adsorption at 80 °C. Based on these findings, a heat treatment of 80 °C for 3 h was suggested to enhance the complexation of CGA in both the RCC-L and RCC-H samples (containing 2.61 and 3.86 mg/g RCC, respectively). These two samples, prepared accordingly, were used in the subsequent experiments in this study.

3.2. TEAC Value

The antioxidant activity of RCC-L and RCC-H samples was evaluated by the TEAC assay in comparison with the control (Table 2). The TEAC values of both the RCC-L and RCC-H samples were comparable (570 and 572 nmol trolox equivalent/g, respectively), and were significantly (p > 0.05) higher than that of the control. The approximately two-fold increase in the TEAC values indicated that the potent phenolic antioxidant CGA could impart its antioxidant capacity to the complex. The findings from Oladele et al. [23] demonstrated that starch-phenolic complexes which were produced by an interaction between maize starch and phenolic compounds from grape pomace or condensed tannin sorghum possessed noticeable antioxidant activity. The results showed that a larger amount of CGA in the RCC-H sample (3.86 mg/g), relative to the RCC-L sample (2.61 mg/g) (Table 1), did not incur a correspondingly higher TEAC value. The assessment of antioxidant activity could possibly be affected by various factors such as structure-activity relationships among reactants and choice of assay [24]. Considering that starch molecules acted as an entrapping matrix in the structure of RCC samples, it was inferred that the comparable antioxidant activity between RCC-L and RCC-H samples might be associated with their structure-activity relationships, hindering the activity measurement of small amounts of CGA entrapped in the polysaccharide matrix.

3.3. Swelling Ability and Water Solubility Index

The swelling ability and water solubility index of starch molecules provide a basic understanding of the magnitude of interactions between their amorphous and crystalline domains. Table 2 presents the swelling ability and water solubility index among the control, RCC-L, and RCC-H samples. Our results revealed that the swelling ability and water solubility index of the control were 11.13 g/g and 8.53%, respectively. In some previous studies, the swelling ability and water solubility index of different rice cultivars varied from 8.67 to 9.23 g/g and 2.00 to 4.00%, respectively [25]. It was worth noting that the heat treatment of rice starch during sample preparation would cause partial disintegration of starch particles and an increase in their solubility. As shown in Table 2, the complexation of rice starch molecules with CGA (2.61–3.86 mg/g RCC) resulted in an apparent (p < 0.05) increase in swelling ability (7.2–9.1%). The swelling behavior of starch molecules could be affected by various factors such as amylose content, molecular structure, and presence of non-carbohydrate substances [26]. An elevation in swelling might be attributed to the disruption of starch structure after the complexation with CGA. The inclusion of CGA within the network of rice molecules at a level of 3.86 mg/g (Table 1) significantly (p < 0.05) increased their solubility by 45.8% relative to control. An increase in solubility was associated with a higher amount of amylose leaching out from the starch granules, as well as increased swelling [27]. It was inferred that the presence of phenolic acids (i.e., CGA) might improve the interactions between rice starch and water molecules, leading to the increased dissolution of soluble starch [7]. The binding of gallic acid to starch was found to be capable of weakening the inter-chain association between starch chains, resulting in an increase in its swelling power [28].

3.4. In Vitro and In Vivo Starch Digestibility

The resistances of control, RCC-L, and RCC-H samples to amylolytic hydrolysis are presented in Table 3. After 30 min of enzyme digestion, the digestibility of the control sample was 487.2 mg/g. As compared with the control, the in vitro digestibility of RCC-L and RCC-H samples significantly (p < 0.05) decreased by 36.7% and 41.9%, respectively. The results indicated that the direct binding of CGA to rice starch molecules at the level of 2.61–3.86 mg/g RCC (Table 1) might be a practical means to reduce the digestibility of rice starch. The findings from Sun et al. [6] demonstrated that the attachment of polyphenolic compounds like tea polyphenols to starch molecules could promote the binding of porcine pancreatic α-amylase with starch; however, the inhibition of α-amylase by polyphenols still occurred even when the enzyme was bound to starch molecules. This may, in part, explain the effectiveness of RCC samples in lowering starch digestibility. Other studies have also demonstrated that phenolic compounds may interact with starch molecules and modify their physicochemical properties and digestion [23,29].
In the assessment of in vivo starch digestibility, the basal blood glucose levels of animals were maintained steadily at 102–110 mg/dL on average between 0 and 180 min. As can be seen in Table 3, an obvious (p < 0.05) reduction in the AUC value of the plasma glucose response of the RCC-H group (−23.0%) was found as compared with that of the control (3920 arbitrary unit). These in vivo findings revealed that the complexation with CGA could render the rice sample at least in part inaccessible to digestive enzymes, leading to a lower rate of glucose generation. Many natural polyphenolic compounds such as chlorogenic acid, curcumin, catechins, and procyanidins have been demonstrated to help lower plasma glucose and improve insulin sensitivity [30,31]. This finding was consistent with the in vitro amylolytic hydrolysis results, in which the RCC-H sample showed a relatively higher inhibition of the digestibility of rice starch.

3.5. Characterization of Interactions

FT-IR spectra analysis was applied to investigate the underlying interaction between the rice samples and the CGA. As compared with the control, no new peaks were observed in the FT-IR spectra of the RCC-L and RCC-H samples (Figure 1). The FT-IR patterns of all rice samples were basically comparable, indicating that the control and two RCC samples had overall similarities in functional groups. Infrared peaks of chlorogenic acid isomer in coffee occurred at the characteristic regions of 1700–1600 cm−1 [16]. In the fingerprint region, slight width modifications and band shifts from 1640 cm−1, which was assigned to hydroxyl groups (O-H) stretching and bending vibration [32], to 1653 cm−1 were observed. It was inferred that the water content in starch samples was gradually reduced and a slight intermolecular interaction might be elicited in the complexation between rice sample and CGA [9,33].
Figure 2A,B present the mass spectra of the complex formed between 5-caffeoylquinic acid and glucosyl moiety of hydrolyzed RCC sample in positive ion mode. The peak with an [M + H]+ ion at m/z 355 ([caffeoyquinic acid + H]+) was identified as caffeoylquinic acid, while the ion of m/z 377 was caffeoylquinic acid [M + Na]+. The identification of this molecule was found to be consistent with published data in some previous studies [34,35]. The fragmentation of CGAs, which are the esterified form of caffeic acid and quinic acid, typically produced intact caffeoyl and quinic acid fragments [36]. The protonated CGA precursor ion would yield some key fragments at m/z 135 ([caffeic acid-CO − H2O + H]+), m/z 163 ([caffeic acid-H2O + H]+), m/z 181 ([caffeic acid + H]+), and m/z 193 ([quinic acid + H]+) via MS2 experiments [34,36]. The presence of distinctive ions at m/z 325, 487, and 649 suggested that the caffeic acid moiety (m/z 163) was connected with glucose, maltose, and maltotriose, respectively, by an ether linkage. The peak at m/z 365 was tentatively assigned as [M + Na]+ adducts of glucosyl caffeic acid.
With respect to the ion of m/z 181 ([caffeic acid + H]+), the presence of the fragment ions at m/z 343, 505, 667, and 829 were characterized as H+ adducts of caffeoylglycoside of glucose, maltose, maltotriose, and maltotetraose, respectively. Three peaks detected at m/z 527, 689, and 851 were tentatively assigned as [M + Na]+ adducts of the corresponding glucosyl, maltosyl, and maltotriosyl caffeic acid, respectively.
Based on the above arguments, the presence of glucose, maltose, and maltotriose as the glycone units of chlorogenic acid glycosides supports the interpretation of apparent interaction and potential complex formation between CGA and rice starch molecules.

3.6. Pasting Properties

Visco-amylograms of the control, RCC-L, and RCC-H samples are presented in Figure 3, and their pasting behaviors are summarized in Table 4. As compared with the control, significant (p < 0.05) increases in peak viscosity (7.4%) and breakdown value (24.7%) were observed in the RCC-H samples. An apparent decline in final viscosity from 3376 cP (control) to 3288 cP (RCC-H sample) was also noted. These results indicate that the inclusion of CGA in the rice starch matrix at the level of 3.86 mg/g (Table 1) could affect the viscosity of rice samples upon complexation.
As the breakdown viscosity of starch solution was associated with its ability to resist shear stress during heating [37], the highest breakdown value (394 cP) of the RCC-H sample showed that the RCC-H sample exhibited a lower resistance to shear-thinning during heating. It implied that the complexation of CGA in the rice starch network resulted in a lower ability to withstand heating and shear stress. In Table 4, RCC-H sample had a relatively lower pasting temperature. Starch molecules with a high pasting temperature would have a higher resistance towards swelling and rupture [38]. In parallel to the changes in swelling ability as presented in Table 2, the lower pasting temperature of the RCC-H sample might explain its remarkably higher degree of swelling ability among the rice samples.
Setback value represented a degree of reassociation among amylose molecules and the tendency of starch paste towards retrogradation [39]. The setback of the control was 1755 cP initially, but remarkably (p < 0.05) dropped by 6.4–9.8% to 1601–1661 cP after the complexation of rice starch with CGA. As the CGA content increased in the RCC samples, a reducing trend in the setback values relative to control was observed. Typically, starch with lower setback value had a decreased tendency towards retrogradation. The addition of CGA during extrusion would retard starch retrogradation process by interfering with the arrangement of starch chains [9]. As can be seen in Figure 3, complexation between rice and CGA might lead to a reduction in the level of retrogradation and enhance the paste-cooling stability of rice flour.
Unlike most resistant starches, which have their limitations in bakery applications in terms of sensory properties [3], our results suggested that the complex prepared through the interaction between rice kernel samples and CGA in this study was capable of rendering starch sample resistance to amylolytic hydrolysis (Table 3) along with the abovementioned desirable pasting properties. It could be considered a promising way to modify rice starch properties, with improved paste-cooling stability and reduced retrogradation.

4. Conclusions

In conclusion, an adsorption treatment of 80 °C for 3 h was applied to enhance the complexation of rice kernel samples with CGA that imparted an apparent antioxidant capacity to the complex. The inclusion of CGA within a rice starch network at the level of 3.86 mg/g could apparently modify its physicochemical properties by increasing swelling ability, lowering resistance to shear-thinning during heating, and retarding retrogradation. The reduction in starch digestibility, both in vitro and in vivo, through the aforementioned process might be a practical means to reduce the digestibility of rice kernels. An apparent intermolecular interaction between CGA and rice starch molecules was suggested by ESI-TOF-MS analysis. All in all, this process was considered a promising way to reduce the digestibility, as well as to modify the properties, of rice starch, which could be used in various food products requiring better paste-cooling stability.

Author Contributions

Conceptualization, C.-F.C., Y.-L.L., Y.-W.H., and M.-Z.W.; methodology, Y.-L.L., Y.-W.H., M.-Z.W., C.-Y.S., and C.-F.C.; formal analysis, Y.-L.L., Y.-W.H., M.-Z.W., P.-S.L., T.-Y.W., C.-W.L., and N.-N.S.; data curation, Y.-L.L., Y.-W.H., M.-Z.W., P.-S.L., T.-Y.W., N.-N.S., and C.-F.C.; writing—original draft preparation, Y.-L.L., Y.-W.H., M.-Z.W., C.-Y.S., C.-W.L., and C.-F.C.; writing—review and editing, C.-F.C., Y.-W.H., M.-Z.W., and Y.-L.L.; supervision, C.-F.C.; project administration, C.-F.C.; funding acquisition, C.-F.C. All authors have read and agreed to the published version of the manuscript.

Funding

This work was supported by the Council of Agriculture of the Republic of China (110AS-14.1.1-ST-a1), as well as the Ministry of Science and Technology of the Republic of China (MOST 109-2320-B-005-002).

Data Availability Statement

Data are contained within the article.

Acknowledgments

Support regarding the mass spectrometry analysis from the Proteomic MS Core Laboratory, Biotechnology Center of National Chung Hsing University, is acknowledged.

Conflicts of Interest

All contributing authors declare no conflicts of interest.

References

  1. Singh, J.; Dartois, A.; Kaur, L. Starch digestibility in food matrix: A review. Trends Food Sci. Technol. 2010, 21, 168–180. [Google Scholar] [CrossRef]
  2. Kendall, C.W.; Emam, A.; Augustin, L.S.; Jenkins, D.J. Resistant starches and health. J. AOAC Int. 2004, 87, 769–774. [Google Scholar] [CrossRef] [PubMed] [Green Version]
  3. Birt, D.F.; Boylston, T.; Hendrich, S.; Jane, J.L.; Hollis, J.; Li, L.; McClelland, J.; Moore, S.; Phillips, G.J.; Rowling, M.; et al. Resistant starch: Promise for improving human health. Adv. Nutr. 2013, 4, 587–601. [Google Scholar] [CrossRef] [PubMed] [Green Version]
  4. Wu, T.Y.; Sun, N.N.; Chau, C.F. Application of corona electrical discharge plasma on modifying the physicochemical properties of banana starch indigenous to Taiwan. J. Food Drug Anal. 2018, 26, 244–251. [Google Scholar] [CrossRef] [PubMed]
  5. Griffiths, D.W. The inhibition of digestive enzymes by polyphenolic compounds. In Nutritional and Toxicological Significance of Enzyme Inhibitors in Foods; Springer: Boston, MA, USA, 1986; pp. 509–516. [Google Scholar]
  6. Sun, L.; Gidley, M.J.; Warren, F.J. Tea polyphenols enhance binding of porcine pancreatic α-amylase with starch granules but reduce catalytic activity. Food Chem. 2018, 258, 164–173. [Google Scholar] [CrossRef] [PubMed]
  7. Karunaratne, R.; Zhu, F. Physicochemical interactions of maize starch with ferulic acid. Food Chem. 2016, 199, 372–379. [Google Scholar] [CrossRef]
  8. Adisakwattana, S.; Chantarasinlapin, P.; Thammarat, H.; Yibchok-Anun, S. A series of cinnamic acid derivatives and their inhibitory activity on intestinal α-glucosidase. J. Enzyme Inhib. Med. Chem. 2009, 24, 1194–1200. [Google Scholar] [CrossRef]
  9. Zheng, Y.; Yin, X.; Kong, X.; Chen, S.; Xu, E.; Liu, D.; Ogawa, Y.; Ye, X.; Tian, J. Introduction of chlorogenic acid during extrusion affects the physicochemical properties and enzymatic hydrolysis of rice flour. Food Hydrocoll. 2021, 116, 106652. [Google Scholar] [CrossRef]
  10. Bermúdez-Oria, A.; Rodríguez-Gutiérrez, G.; Fernández-Prior, Á.; Vioque, B.; Fernández-Bolaños, J. Strawberry dietary fiber functionalized with phenolic antioxidants from olives. Interactions between polysaccharides and phenolic compounds. Food Chem. 2019, 280, 310–320. [Google Scholar] [CrossRef] [PubMed] [Green Version]
  11. AOAC. Official Methods of Analysis, 17th ed.; Association of Official Analytical Chemists: Gaithersburg, MD, USA, 2000. [Google Scholar]
  12. Miller, N.J.; Rice-Evans, C.A.; Davis, M.J.; Gopinathan, M.; Milner, M. A novel method for measuring antioxidant capacity and its application to monitoring the antioxidant status in premature neonates. Clin. Sci. 1993, 84, 407–412. [Google Scholar] [CrossRef] [PubMed] [Green Version]
  13. Wu, T.Y.; Chang, C.R.; Chang, T.J.; Chang, Y.J.; Liew, Y.; Chau, C.F. Changes in physicochemical properties of corn starch upon modifications by atmospheric pressure plasma jet. Food Chem. 2019, 283, 46–51. [Google Scholar] [CrossRef] [PubMed]
  14. Chau, C.F.; Huang, Y.L.; Lee, M.H. In vitro hypoglycemic effects of different insoluble fiber-rich fractions prepared from the peel of Citrus sinensis L. cv. Liucheng. J. Agric. Food Chem. 2003, 51, 6623–6626. [Google Scholar] [CrossRef]
  15. Matthews, J.; Altman, D.; Campbell, M.; Royston, P. Analysis of Serial Measurements in Medical Research. Br. Med. J. 1990, 300, 230–235. [Google Scholar] [CrossRef] [PubMed] [Green Version]
  16. Liang, N.; Lu, X.; Hu, Y.; Kitts, D.D. Application of attenuated total reflectance—Fourier transformed infrared (ATR-FTIR) spectroscopy to determine the chlorogenic acid isomer profile and antioxidant capacity of coffee beans. J. Agric. Food Chem. 2016, 64, 681–689. [Google Scholar] [CrossRef] [PubMed]
  17. Pérez-Jiménez, J.; Saura-Calixto, F. Macromolecular antioxidants or non-extractable polyphenols in fruit and vegetables: Intake in four European countries. Int. Food Res. J. 2015, 74, 315–323. [Google Scholar] [CrossRef] [PubMed]
  18. Wu, Z.; Ming, J.; Gao, R.; Wang, Y.; Liang, Q.; Yu, H.; Zhao, G. Characterization and antioxidant activity of the complex of tea polyphenols and oat β-glucan. J. Agric. Food Chem. 2011, 59, 10737–10746. [Google Scholar] [CrossRef] [PubMed]
  19. Phan, A.D.T.; D’Arcy, B.R.; Gidley, M.J. Polyphenol-cellulose interactions: Effects of pH, temperature and salt. Int. J. Food Sci. Technol. 2016, 51, 203–211. [Google Scholar] [CrossRef]
  20. Nguela, J.M.; Poncet-Legrand, C.; Sieczkowski, N.; Vernhet, A. Interactions of grape tannins and wine polyphenols with a yeast protein extract, mannoproteins and β-glucan. Food Chem. 2016, 210, 671–682. [Google Scholar] [CrossRef]
  21. Simanaviciute, D.; Klimaviciute, R.; Rutkaite, R. Equilibrium adsorption of caffeic, chlorogenic and rosmarinic acids on cationic cross-linked starch with quaternary ammonium groups. Int. J. Biol. Macromol. 2017, 95, 788–795. [Google Scholar] [CrossRef]
  22. Zeng, Z.; Li, Y.; Yang, R.; Liu, C.; Hu, X.; Luo, S.; Gong, E.; Ye, J. The relationship between reducing sugars and phenolic retention of brown rice after enzymatic extrusion. J. Cereal Sci. 2017, 74, 244–249. [Google Scholar] [CrossRef]
  23. Oladele, A.K.; Duodu, K.G.; Emmambux, N.M. Hydrolysis and antioxidant activity of starch modified with phenolic extracts from grape pomace and sorghum bran under alkaline conditions. Carbohydr. Polym. 2020, 240, 116291. [Google Scholar] [CrossRef] [PubMed]
  24. Csepregi, K.; Neugart, S.; Schreiner, M.; Hideg, É. Comparative evaluation of total antioxidant capacities of plant polyphenols. Molecules 2016, 21, 208. [Google Scholar] [CrossRef] [PubMed] [Green Version]
  25. Ali, A.; Wani, T.A.; Wani, I.A.; Masoodi, F.A. Comparative study of the physicochemical properties of rice and corn starches grown in Indian temperate climate. J. Saudi Soc. Agric. Sci. 2016, 15, 75–82. [Google Scholar] [CrossRef] [Green Version]
  26. Tester, R.F.; Morrison, W.R. Swelling and gelatinization of Cereal starches II. Waxy rice Starches. Cereal Chem. 1990, 67, 551–557. [Google Scholar]
  27. Srichuwong, S.; Suharti, C.; Mishima, T.; Isono, M.; Hisamatsu, M. Starches from different botanical sources II: Contribution of starch structure to swelling and pasting properties. Carbohydr. Polym. 2005, 62, 25–34. [Google Scholar] [CrossRef]
  28. Gunaratne, A.; Corke, H. Influence of prior acid treatment on acetylation of wheat, potato and maize starches. Food Chem. 2007, 105, 917–925. [Google Scholar] [CrossRef]
  29. Li, K.; Yao, F.; Du, J.; Deng, X.; Li, C. Persimmon tannin decreased the glycemic response through decreasing the digestibility of starch and inhibiting α-amylase, α-glucosidase, and intestinal glucose uptake. J. Agric. Food Chem. 2018, 66, 1629–1637. [Google Scholar] [CrossRef] [PubMed]
  30. Jin, S.; Chang, C.; Zhang, L.; Liu, Y.; Huang, X.; Chen, Z. Chlorogenic acid improves late diabetes through adiponectin receptor signaling pathways in db/db mice. PLoS ONE 2015, 10, e0120842. [Google Scholar] [CrossRef] [Green Version]
  31. Aryaeian, N.; Sedehi, S.K.; Arablou, T. Polyphenols and their effects on diabetes management: A review. Med. J. Islam Repub. Iran 2017, 31, 134. [Google Scholar] [CrossRef] [PubMed] [Green Version]
  32. Kalita, D.; Kaushik, N.; Mahanta, C.L. Physicochemical, morphological, thermal and IR spectral changes in the properties of waxy rice starch modified with vinyl acetate. J. Food Sci. Technol. 2014, 51, 2790–2796. [Google Scholar] [CrossRef] [PubMed] [Green Version]
  33. Huang, Z.Q.; Lu, J.P.; Li, X.H.; Tong, Z.F. Effect of mechanical activation on physico-chemical properties and structure of cassava starch. Carbohydr. Polym. 2007, 68, 128–135. [Google Scholar] [CrossRef]
  34. Jaiswal, R.; Müller, H.; Müller, A.; Karar, M.G.E.; Kuhnert, N. Identification and characterization of chlorogenic acids, chlorogenic acid glycosides and flavonoids from Lonicera henryi L. (Caprifoliaceae) leaves by LC–MSn. Phytochemistry 2014, 108, 252–263. [Google Scholar] [CrossRef] [PubMed]
  35. Moreira, A.S.; Nunes, F.M.; Simões, C.; Maciel, E.; Domingues, P.; Domingues, M.R.M.; Coimbra, M.A. Data on coffee composition and mass spectrometry analysis of mixtures of coffee related carbohydrates, phenolic compounds and peptides. Data Brief. 2017, 13, 145–161. [Google Scholar] [CrossRef] [PubMed]
  36. Fang, N.; Yu, S.; Prior, R.L. LC/MS/MS characterization of phenolic constituents in dried plums. J. Agric. Food Chem. 2002, 50, 3579–3585. [Google Scholar] [CrossRef]
  37. Adebowale, A.A.; Sanni, L.O.; Awonorin, S.O. Effect of texture modifiers on the physicochemical and sensory properties of dried fufu. Food Sci. Technol. Int. 2005, 11, 373–382. [Google Scholar] [CrossRef]
  38. Seetharaman, K.; Tziotis, A.; Borras, F.; White, P.J.; Ferrer, M.; Robutti, J. Thermal and functional characterization of starch from Argentinean corn. Cereal Chem. 2001, 78, 379–386. [Google Scholar] [CrossRef]
  39. Zaidul, I.S.M.; Norulaini, N.N.; Omar, A.M.; Yamauchi, H.; Noda, T. RVA analysis of mixtures of wheat flour and potato, sweet potato, yam, and cassava starches. Carbohydr. Polym. 2007, 69, 784–791. [Google Scholar] [CrossRef]
Figure 1. FT-IR spectra of different rice samples.
Processes 09 00788 g001
Figure 2. ESI-TOF-MS spectra of the CGA-rice complex sample. (A) m/z range of 300–600 Da; (B) m/z range of 600–900 Da.
Processes 09 00788 g002
Figure 3. Changes in viscosity among different rice samples.
Processes 09 00788 g003
Table 1. Contents of CGA bound to the complexes (mg/g) after different heating periods.
Samples #Heating Time (H)
1234
RCC-L2.27 ± 0.13 a,m2.60 ± 0.05 a,n2.61 ± 0.23 a,n2.78 ± 0.20 a,n
RCC-H3.44 ± 0.91 a,m3.95 ± 0.13 b,n3.86 ± 0.14 b,n3.85 ± 0.27 b,n
# The initial amounts of CGA in the freshly cooked RCC-L and RCC-H samples were 1.88 and 2.00 mg/g of RCC, respectively. a,b Values (mean ± SD) in the same column with different superscripts are significantly different (Student’s t-test, p < 0.05). m,n Values (mean ± SD) in the same row with different superscripts are significantly different (Duncan, p < 0.05).
Table 2. Antioxidant activity, swelling ability, and water solubility index among different rice samples.
SamplesTEAC # (nmol Trolox Equivalent/g)Swelling Ability (g/g)Water Solubility Index (%)
Control236 ± 7 a11.13 ± 0.04 a8.53 ± 2.04 a
RCC-L570 ± 3 b11.93 ± 0.23 b10.20 ± 1.27 a,b
RCC-H572 ± 3 b12.14 ± 0.21 b12.44 ± 0.68 b
# TEAC, trolox equivalent antioxidant capacity. a,b Values (mean ± SD) in the same column with different superscripts are significantly different (Duncan, p < 0.05).
Table 3. In vitro and In vivo starch digestibility of different rice samples.
SamplesIn Vitro Amylolytic Hydrolysis (Mg/g RCC)AUC #
Control487.2 ± 77.7 a3920 ± 715 a
RCC-L308.4 ± 24.5 b3842 ± 351 a
RCC-H283.0 ± 35.3 b3018 ± 293 b
# AUC, represented as arbitrary unit. a,b Values (mean ± SD) in the same column with different superscripts are significantly different (Duncan, p < 0.05).
Table 4. Viscosity behaviors of the control and rice-CGA complex samples.
SamplesPeak Viscosity (cP)Breakdown (cP)Final Viscosity (cP)Setback (cP)Pasting Temperature (°C)
Control1937 a316 a3376 a1775 a93.3 a
RCC-L1997 a,b322 a3336 a,b1661 b93.4 a
RCC-H2081 b394 b3288 b1601 b90.4 b
a,b All means with different superscripts in each column are significantly different (p < 0.05).
Publisher’s Note: MDPI stays neutral with regard to jurisdictional claims in published maps and institutional affiliations.

