Article

Utilization of Barley Straw as Feedstock for the Production of Different Energy Vectors

1
Institute of Technology, Estonian University of Life Sciences, Kreutzwaldi 56, 51006 Tartu, Estonia
2
Department of Environmental and Biological Sciences, University of Eastern Finland, P.O. Box 1627, 70211 Kuopio, Finland
3
Department of Chemistry, University of Eastern Finland, P.O. Box 111, 80101 Joensuu, Finland
4
Production Systems, Natural Resources Institute Finland, Halolantie 35 A, 71750 Maaninka, Finland
*
Author to whom correspondence should be addressed.
Processes 2021, 9(4), 726; https://doi.org/10.3390/pr9040726
Submission received: 2 March 2021 / Revised: 12 April 2021 / Accepted: 15 April 2021 / Published: 20 April 2021
(This article belongs to the Special Issue Sustainable Development of Waste towards Green Growth)

Abstract

:
During the bioethanol production process, vast amounts of residues are generated as process waste. To extract more value from lignocellulosic biomass and improve process economics, these residues should be used as feedstock in additional processes for the production of energy or fuels. In this paper, barley straw was used for bioethanol production and the residues were valorized using anaerobic digestion (AD) or used for the production of heat and power by combustion. A traditional three-step bioethanol production process was used, and the biomass residues obtained from different stages of the process were analyzed. Finally, mass and energy balances were calculated to quantify material flow and assess the different technological routes for biomass utilization. Up to 90 kg of ethanol could be produced from 1 t of biomass and additional biogas and energy generated from processing residues can increase the energy yield to over 220%. The results show that in terms of energy output, combustion was the preferable route for processing biomass residues. However, the production of biogas is also an attractive solution to increase revenue in the bioethanol production process.

1. Introduction

According to the revised Renewable Energy Directive published in 2018, the European Union (EU) set a goal to become a global leader in renewable energy. To achieve this, the new directive establishes a new binding renewable energy target for the EU for 2030 of at least 32%, where energy in the transport sector is composed of at least 14% from renewable sources by 2030 [1]. However, due to the fuel vs. food dilemma, the challenge is to use raw biomass feedstock for the production of biofuels, which can be produced without directly competing with the production of food crops [2]. Therefore, according to the directive, 3.5% of transport fuels has to come from a variety of alternatives, which include advanced biofuels like second-generation biofuels produced from lignocellulosic biomass [1].
The feedstock used for second-generation biofuels is mainly sourced from lignocellulosic residues from agricultural and forestry sectors and from dedicated energy crops [3]. There are many processes available to convert lignocellulosic biomass into products that can be used for electricity generation, district and process heating, or transport. One of the most common ways to produce liquid biofuels from lignocellulose is to convert the biomass into sugars and ferment the sugars into a fuel like ethanol. The traditional bioethanol production process consists of biomass pretreatment, enzymatic hydrolysis to degrade cellulose to sugars, the fermentation of sugars to ethanol, and distillation [4].
To produce cost effective and profitable biofuel, the process must be effective in all steps. This could be achieved by using a suitable pretreatment method to open the cellulosic structure. More effective enzyme mixtures could be used in the enzymatic hydrolysis step to ensure the complete hydrolysis of both cellulose and hemicellulose into sugars with minimum sugar loss. Furthermore, by using various microorganisms or a combination of them, more efficient fermentation of all sugars to ethanol can be achieved [4].
Additionally, it is possible to improve the economic efficiency of lignocellulosic biofuel production by using all biomass components and production residues. A biorefinery concept has been proposed as a solution for this. A biorefinery carries out the sustainable processing of biomass into a spectrum of marketable products (food, feed, materials, and chemicals), but also into energy (fuels, power, and heat) [5,6]. During the bioethanol production process, vast amounts of residues (mainly residual lignin, unreacted cellulose, and hemicellulose), enzymes, and yeast are left unused as process waste. In order to extract the maximum value from biomass inputs, these residual materials should also be used in separate processes for the production of energy or other fuels like biogas via anaerobic digestion (AD). Such an integrated production scheme could enable higher total energy yield than ethanol production alone [7]. Different production paths can be included in the biorefinery, however a universal and profitable biorefinery concept has not been described yet [6].
In this paper, a bioethanol biorefinery concept is studied where bioethanol production residues were used for the production of biogas or energy by combustion. Detailed methodology for material balance and ethanol yield calculations have been proposed [8]. Several papers reporting the use of bioethanol production waste in an AD process have been published [9,10,11], and bioethanol biorefineries have also been studied [9,12,13]. However, mass and energy balance in the bioethanol production process using barley hay and an explosive pretreatment method combined with combustion and AD has not been studied.
The aim of this paper is to analyze the different biomass residues produced in the bioethanol production process in order to find the most viable route for their utilization in terms of energy. The traditional three-step bioethanol production process was used after pretreatment, and samples from various process stages were analyzed to investigate the possibility of utilizing residues from the bioethanol production process. Combustion and AD were used as waste utilization methods and the biogas and energy yields from these processes were analyzed. Finally, mass and energy balances were calculated to quantify material flow and assess the different technological routes for biomass utilization.

2. Materials and Methods

2.1. Biomass Characterization

Barley straw (Hordeum vulgare) was used as the biomass feedstock for the bioethanol production process. Barley was grown near Tartu, Ätte küla, Estonia on Haplic Luvisol (Hypereutric) soil and harvested in September when it was fully matured. The feedstock was dried to a moisture content less than 100 g kg–1 and ground with a Cutting Mill SM 100 comfort (Retsch GmbH) to a particle size of 3 mm or less.

2.2. Experimental Plan

Fuel and energy production from barley straw was evaluated through different routes (Figure 1). In routes 1 and 2, the biomass was subjected to combustion and anaerobic digestion to study the energy content and biogas potential before pretreatment. After pretreatment, similar experiments were performed with the pretreated biomass (routes 3 and 4). In routes 5 and 6, bioethanol was produced from the biomass using a traditional bioethanol production process. In addition, the solid and liquid fractions were separated after enzymatic hydrolysis, and the solids were subjected to combustion and anaerobic digestion to study the energy content and biogas potential. Yeast was added to the liquids in the fermentation step to study the bioethanol production potential. In route 7, only bioethanol was produced.

2.3. Explosive Decompression Pretreatment

The instrumentation and working principles of the ED pretreatment method have been described in detail in previous publications [14,15,16]. Briefly, 700 mL of distilled water was added to 100 g of dried and milled biomass and mixed thoroughly. The biomass slurry was heated to different temperatures between 125–175 ± 3 °C. Compressed nitrogen gas was added through the top of the reactor into the headspace to obtain a pressure of 30 bar. After reaching the target temperature, the mixture was cooled below the boiling point and the pressure was released in an explosive manner. After the explosion, the samples were cooled to a temperature below 50 °C and used in the enzymatic hydrolysis step or dried in a drying oven (40 °C) and stored for later analysis.

2.4. Enzymatic Hydrolysis and Fermentation

Enzymatic hydrolysis was used to convert cellulose into glucose. Distilled water and an enzyme mixture (Accellerase 1500 from DuPont®®; 30 FPU g−1 cellulose) were added to the pretreated biomass to obtain a final volume of 1000 mL. The enzyme mixture was added to the pretreated biomass suspension at a ratio of 0.3 mL per g of biomass. Hydrolysis lasted for 72 h at a temperature of 50 °C under constant stirring in a rotating shaker/incubator (250 min−1) (Unimax 1010, Heidolph Instruments GmbH & Co. KG, Schwabach, Germany).
After enzymatic hydrolysis, vacuum filtration was used to separate the liquid part of the suspension from the solid part. Then, 1 g of yeast (Saccharomyces cerevisiae) was added to 200 mL of the liquid phase to start the fermentation process. Fermentation lasted for 7 days at room temperature (22 ± 1 °C).

2.5. Biomethane Potential

The biomethane potential test (BMP) was used to analyze the possibility of using different residues from second generation bioethanol processes for further biomethane production. Untreated biomass was used as a control, and the biomethane yields of pretreated samples and of the solid fraction after the hydrolysis step were measured. The BMP was determined using a modified version of the procedures described by Owen et al. and Angelidaki et al. [17,18].
The inoculum was collected from a local wastewater treatment plant (Tartu, Estonia). The experiments were carried out in 575 mL plasma bottles, with a total working volume of 200 mL, and with a substrate to inoculum ratio of 0.25. The substrate to inoculum ratio was calculated from the analysis of the total solids (TS) and volatile solids (VS) content, which was determined using the 1684 standard method from the US Environmental Protection Agency (EPA) [19]. The TS content was measured after drying the sample in the oven at 105 °C for 24 h. The VS content was determined by measuring the weight loss after the sample was ignited (using dry heat at 550 °C). The experiments were set up in triplicate, along with a blank test composed of just inoculum. To ensure anaerobic conditions, nitrogen was flushed in the headspace of the bottles for approximately five minutes. Then, the bottles were sealed, properly mixed, and incubated for a period of 42–45 days (until the gas pressure reached a constant value) at mesophilic conditions (36 °C).
Biogas production and composition were determined by measuring the pressure before (PI) and after (PF) the gas chromatograph analysis using a WAL-BMP-Test system pressure meter (from WAL Mess-und Regelsysteme GmbH). The quantity of methane in the biogas was determined using a CP-4900 micro gas chromatograph (GC) (Varian Inc., Palo Alto, CA, USA) equipped with a thermal conductivity detector and two columns. Column one was a Molsieve 5A backflush heated column (20 m × 0.53 mm) which used argon as the carrier gas. The injection temperature, column temperature, and column pressure were 110 °C, 120 °C, and 50 Psi, respectively. Column two was a PoraPLOT U heated column (10 m × 0.53 mm) which used helium as the carrier gas. The injection temperature, column temperature, and column pressure were 110 °C, 150 °C, and 22 Psi, respectively.

2.6. Characterization of Combustion Behavior

Untreated barley straw, pretreated barley straw, and residues from enzymatic hydrolysis were subject to the following combustion analyses: heating value, ultimate (C, H, N, and S), inorganic element, proximate (volatile matter, fixed carbon, ash), and volatile release analysis. All samples were oven dried (105 °C, 24 h), and then milled using a centrifugal knife mill equipped with a 1 mm cutting screen prior to analysis.
Heating values were determined by bomb calorimetry according to international standard ISO 1928. Ultimate analysis was determined by high-temperature oxidation of the samples according to standards ISO 29541 (determination of C, H, and N) and SFS-EN ISO 16994 (determination of S). Metal and metalloid concentrations were determined using solution-based inductively coupled plasma mass spectrometry (ICP-MS) following a two-step pressurized acid digestion at 200 °C. Digested samples were diluted in deionized water and analyzed for K, Na, Ca, Mg, Al, Fe, P, Si, Ti, Al, and Zn using a NeXION 350D instrument (PerkinElmer, Akron, OH, USA). Detailed descriptions of the sample digestion and solution analysis procedures have been reported previously [20]. One blank and two certified standard reference materials, BCR 129 (hay powder) and BCR 176R (municipal solid waste incineration fly ash), were analyzed in addition to the unknown samples to check for contamination and to verify the accuracy of the test batch. Chlorine content was determined by ion chromatography (IC). Chlorine was extracted by leaching samples (60–100 mg) in 20 mL of boiling deionized water (DI) for a period of 20 min. Water extracts were vacuum filtered through 0.45 µm cellulose membrane filters. Leaching vessels were rinsed twice with two 8 mL aliquots of DI water. The rinsing water was filtered and then added to the water extracts. The water extracts were then diluted with DI water to a final volume of 50 mL and then analyzed for the presence ofchloride with a Dionex ICS-2100 instrument equipped with a Dionex IonPac AS18 RFIC separation column (Thermo Scientific, Waltham, MA, USA) and a conductivity cell type detector. A dilute solution of potassium hydroxide (2.8 mM) was used as the eluent. The instrument was calibrated (0.5–10 ppm) using an aqueous solution containing ammonium chloride. The methods used for proximate analysis are based on international standards ISO 18123 (determination of the content of volatile matter) and ISO 18122 (determination of ash content). Volatile matter was determined by measuring sample weight loss following heating samples to 900 °C in a nitrogen gas atmosphere. Ash content was determined by measuring sample weight loss following two consecutive stages of air combustion in a muffle furnace (250 °C for 1 h and then 550 °C for 2 h). Fixed carbon content was determined by the difference.
The release of volatiles during devolatilization was characterized by heating small samples (9–13 mg) in a thermobalance (Q50 thermogravimetric analyzer, TA Instruments) from 105 to 600 °C at a controlled rate (30 °C min−1) in an inert gas (N2) atmosphere. Samples were held in a platinum pan and purged with a flow of 120 mL min−1 @ STP. Prior to heating, samples were held at 105 °C for 20 min in order to purge the furnace of oxygen and to remove residual moisture from the sample.

2.7. Sample Analysis Methods

The solid and liquid parts of the biomass mixture were weighed before and after pretreatment and after enzymatic hydrolysis, and corresponding samples were taken for analysis. Both the initial biomass and the solid biomass gained after pretreatment and enzymatic hydrolysis were dried and milled for analysis.
The dry matter content was analyzed with a Kern MLS-D moisture analyzer (KERN & SOHN GmbH, Balingen, Germany) and ash content was calculated according to NREL Technical Report NREL/TP-510-42622 [21]. Fiber analysis (cellulose, hemicellulose and lignin) was performed using an ANKOM 2000 analyzer (ANKOM Technology, Macedon, NY, USA) using acid and neutral detergent solutions (ANKOM Technology) and 72% H2SO4 for the determination of acid and neutral detergent fiber and acid insoluble lignin, respectively.
Glucose and ethanol yields were determined using an Analox GL6 electrochemical analyzer (Analox Instruments Ltd., Stourbridge, UK) after the hydrolysis and fermentation steps, respectively. All measurements were conducted in triplicate and the average and standard deviations were calculated.
The hydrolysis efficiency was calculated based on Equation (1):
E H Y = m g l c m c e l · 1.11 · 100 %
where mglc is the measured amount of glucose in the sample, mcel is the measured amount of cellulose in the sample, and 1.11 is the cellulose to glucose conversion factor based on the stoichiometric biochemistry of hydrolysis [22]. Fermentation efficiency was calculated based on Equation (2):
E F = c e t h c g l c · 0.51 · 100 %
where cglc is the concentration of glucose in the sample, ceth is the concentration of ethanol in the sample, and 0.51 is the glucose to ethanol conversion factor based on the stoichiometric biochemistry of fermentation process [22].

2.8. Biogas Calculations

The methane produced from the biomass residue of each stage of bioethanol production is given in mol of methane per 100 g of untreated material. It was determined using Equations (3) through (5) [10]:
CH 4   I   = M F P I   V H S   R   273.15 + T
CH 4   F = MF P F   V H S   R   273.15 + T
CH 4   C t = ( CH 4   I t CH 4   F t 1 ) + CH 4   C t 1
where CH 4   I   (mol CH4) represents the initial molar concentration of methane produced in the headspace of the test bottle, CH 4   F (mol CH4) is the final molar concentration of methane produced in the test bottle,   CH 4   C t (mol CH4) represents the cumulative methane production for the current time interval (t), CH 4   I t (mol CH4) is the initial molar concentration of methane produced in the current time interval, CH 4   F t 1   (mol CH4) is final molar concentration of methane produced in the previous time interval, CH 4   C t 1   (mol CH4) is the cumulative molar concentration of methane produced in the previous time interval, PI (Pa) is the initial total pressure in the bottle headspace measured before the GC analysis, PF (Pa) is the final total pressure measured in the headspace of the bottle after GC analysis, VHS (m3) is the volume of the headspace, MF is the methane fraction measured by gas chromatography in the current time interval, R is the ideal gas constant (8.314 Jmol−1K−1), and T is the incubation temperature (°C).
The data were further modelled with a non-linear regression model and fitted in a one-phase association model (Equation (6)) [11] using the software GraphPad Prism 5. The results of methane production were further analyzed by means of descriptive statistics, Shapiro–Wilk’s normality test and Spearman’s correlation.
B = Bmax (1 − e−k.t)
where B is the cumulative methane production at time (t), Bmax is the maximum methane yield, and k is the kinetic rate constant.

2.9. Energy Balance Calculations

The analysis of energy output from each route was determined by multiplying the amount of bioethanol or biomethane produced with the corresponding calorific value. In the case of biomass combustion, the net calorific value was used. For biogas and bioethanol, the same calorific values reported in the literature was used (20 MJ m−3 and 27 MJ kg−1, respectively) [23,24]. The energy yields were calculated using the corresponding calorific value and the mass of the biomass or the volume of biogas produced.

3. Results and Discussion

3.1. Biomass Characterization

Biomass can be characterized based on its relative proportion of cellulose, hemicellulose, lignin, ash, and moisture. The chemical composition of barley straw varies according to location, method of cultivation, and harvesting season, but also by the analytical procedure used to determine the composition [25]. Previous research has shown that energy crops for ethanol production should be selected based on their cellulose content since ethanol yield per kg of biomass was directly proportional to the cellulose content in the energy crop [26]. As seen in Table 1, the barley straw used in these experiments as a sample biomass had relatively high cellulose and hemicellulose contents, and a low lignin content. The composition of barley straw used in this work is comparable to cereal straws reported by different authors [27,28,29]. The cellulose content in barley straw was approximately 40%, which makes it a suitable biomass for bioethanol production [30].
Table 1 also shows the total solids (TS) and volatile solids (VS) content of untreated and pretreated barley straw, and of the solid fraction from the post-hydrolysis broth. The TS content of untreated barley straw was 931 g/kg. For the pretreated samples, the TS content varied between 927 g/kg and 939 g/kg, and for the samples from the solid fraction of the post-hydrolysis broth, TS content varied between 928 g/kg and 938 g/kg. Regarding the VS content, it was higher in the samples from the solid fraction of the post-hydrolysis broth (976–974 g/kg TS) and lower in the untreated and pretreated samples (960–963 g/kg TS). Statistically significant differences were found between the VS content of pretreated samples (125 °C) and samples from the solid fraction of the post-hydrolysis broth (125 °C) (p ≤ 0.01). Research has shown that a higher TS content leads to higher methane and biogas production [31].
Samples were collected and analyzed at different stages of the bioethanol production process to investigate the change in the biomass due to the effect of these processes. The effect of explosive decompression pretreatment can be compared with steam explosion pretreatment as they are both based on autohydrolysis at higher temperatures followed by rapid decompression. It has been reported that autohydrolysis during steam explosion pretreatment causes partial hemicellulose solubilization [32], while unconverted hemicellulose, lignin, and cellulose remain in the solid phase [33]. During hydrolysis, the cellulose in the solid fraction of the broth decreases as the cellulose is hydrolyzed to sugar monomers by enzymes [4].
As expected, the results show that explosive decompression pretreatment decreased the hemicellulose content in the biomass. While the pretreatment at 125 °C had almost no effect on the hemicellulose content, as the pretreatment temperature increased, the solubilization of hemicellulose increased significantly, and after pretreatment at 175 °C, only 6.51% of hemicellulose remained in the solid state. This is in line with previous research on triticale treated using steam explosion, where the removal of hemicellulose and the digestibility of cellulose in pretreated biomass increased with increasing pretreatment temperature [32]. The removal of hemicellulose increases the availability of the cellulose for enzymes, and thus improves the glucose and ethanol yields in the following process steps [34].
Cellulose solubilizes during pretreatment but not to such a large extent as hemicellulose. After pretreatment, the cellulose content in the biomass was 39.3–41.1%. The lignin content in the pretreated biomass, however, increased with increasing pretreatment temperature (see Table 1). This can be associated with overall mass loss due to the decrease of hemicellulose and cellulose in the biomass. Some of the hemicellulose and a small portion of cellulose were solubilized during the pretreatment, and due to this, the proportion of lignin in the pretreated biomass increased. Ravindran et al. reported similar results with SE, where the pretreatment did not decrease cellulose content nor substantially remove lignin from the biomass [35].
After hydrolysis, hemicellulose and cellulose contents in the solid residue varied between 20.2–28.0% and 38.9–40.8%, respectively, which was roughly the same as in the initial biomass and after pretreatment. On the other hand, the lignin content in the residual biomass increased compared to the composition of the initial biomass and the pretreated biomass, and reached up to 12.1% after hydrolysis in the biomass residue sample pretreated at 175 °C. The increase in lignin content was due to the fact that the mass of the biomass during hydrolysis decreased up to 46% while the mass of lignin remained roughly the same.

3.2. Bioethanol Production Potential

The pretreated biomass was used in the traditional bioethanol production process, where enzymatic hydrolysis was followed by fermentation with yeast. The results of these steps are shown in Figure 2. The results show that yields and efficiencies increased with increasing pretreatment temperatures. It can be seen that the hydrolysis efficiency was 33.9% with a lower pretreatment temperature of 125 °C, which enabled us to obtain 8.3 g of glucose from 100 g of biomass. The efficiency steadily increased to a maximum value of 48.5% for the biomass pretreated at 175 °C, where 15.2 g of glucose was obtained from 100 g of biomass. Higher temperatures were not tested with the NED pretreatment method because it has already been demonstrated that the glucose yield reaches a plateau or decreases at temperatures higher than 175 °C [14,16]. Similar results were gained for meadow hay when pretreated with steam explosion at 170 °C (46.7% hydrolysis efficiency; 12.7 g glucose from 100 g of biomass). At higher pretreatment temperatures of 180 °C and 200 °C, the hydrolysis efficiency increases to 57.9% and 86.3%, respectively [36]. In case of sugarcane straw pretreated using steam explosion at 180 °C, a 58.8% sugar conversion efficiency was gained. As the pretreatment temperature increased, the sugar conversion efficiency also increased up to 80.0% at a pretreatment temperature of 200 °C [34].
In the pretreatment temperature range from 125 to 175 °C, the fermentation efficiency varied between 101% and 117%, with ethanol yields ranging from 4.3 to 9.0 g per 100 g of biomass, respectively. It has been shown that fermentation inhibits compounds like acetic acid and furans, which are formed from the dissolution of hemicellulose and hydrolysis during pretreatment at higher temperatures [37]. This is also the reason why higher pretreatment temperatures were not tested. Fermentation efficiencies exceeding 100% were obtained due to the fermentation of oligosaccharides in the fermentation broth. These oligosaccharides were not detected with the applied sugar analysis method, but were hydrolyzed into sugars during the fermentation period, and thereby contributed to the final ethanol yield. Similar results of fermentation efficiencies exceeding 100% have been reported in many previous studies [30,38].

3.3. Methane Recovery

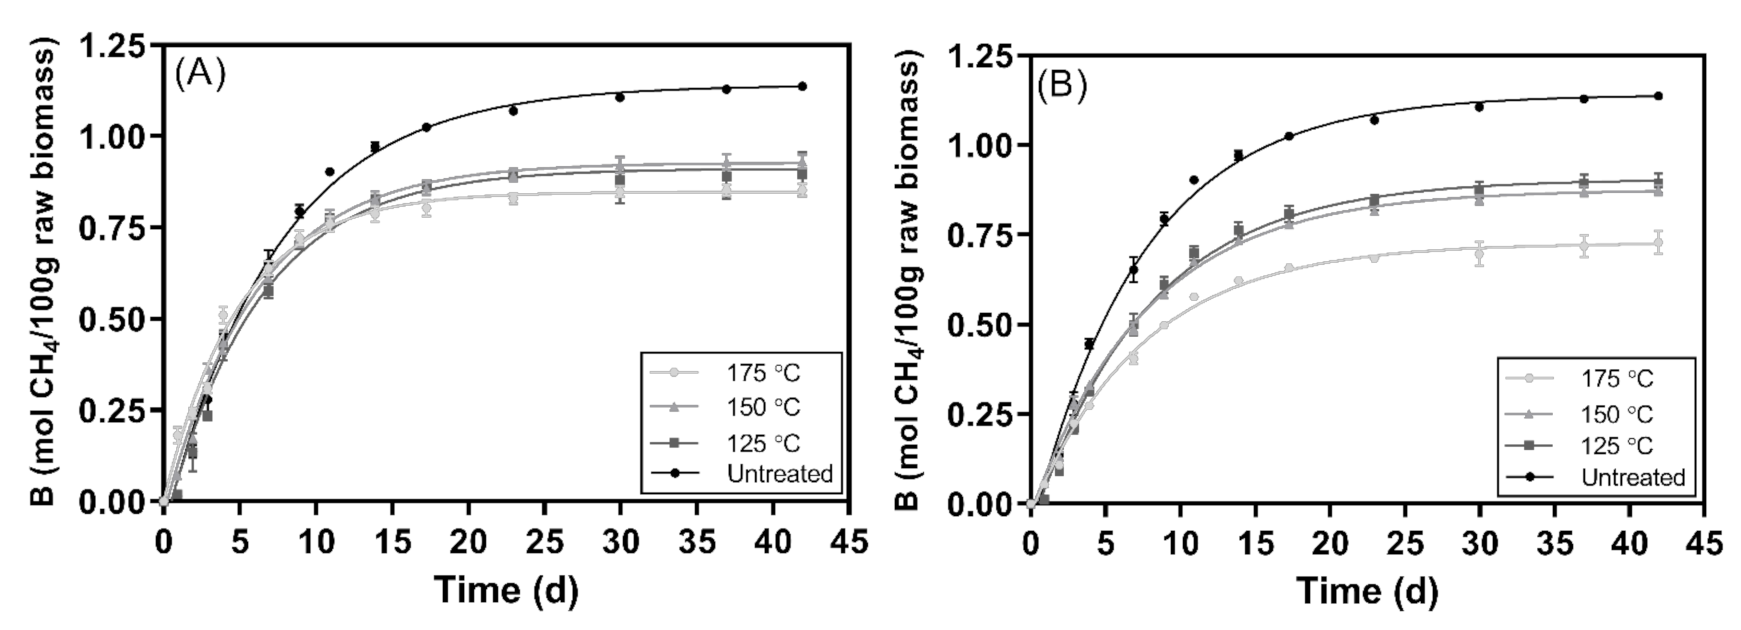
Figure 3 and Table 2 represent the biomethane production results from the samples after pretreatment and from the solid fraction of the post-hydrolysis broth, and their respective fitting curves. The methane yield of untreated material was 1.14 mol CH4/100 g. For the pretreated samples, the methane yield was higher for samples pretreated at 150 °C (0.93 mol CH4/100 g) and lower for samples pretreated at 175 °C (0.85 mol CH4/100 g). Statistically significant differences were found between untreated barley straw and the straw pretreated at 150 °C (p ≤ 0.01), and also between the straw pretreated at 125 °C and the straw pretreated at 175 °C (p ≤ 0.01). For samples from the solid fraction of the post-hydrolysis broth, the methane yields were higher at 125 °C (0.91 mol CH4/100 g) and lower at 175 °C (0.73 mol CH4/100 g). Statistically significant differences were found between samples from the solid fraction of the post-hydrolysis broth pretreated at 125 °C and those pretreated at 175 °C. Differences were also found between samples from the solid fraction of the post-hydrolysis broth pretreated at 150 °C and those pretreated at 175 °C (p ≤ 0.0001). Overall, the methane yields of samples after the pretreatment were 1.1–29.4% higher than those of the samples from the solid fraction of the post-hydrolysis broth. Methane yields tended to decrease with the increment of the pretreatment temperature. This can be explained by the fact that the more severe the pretreatment, the more sugars are released in the soluble form, thus lowering the organic content of the solid residue. Furthermore, the more severe the pretreatment, the more accessible cellulose and hemicellulose are to the enzymes used in the hydrolysis step. Several studies have reported the influence of pretreatment temperature on biogas and biomethane yields. Exposing the feedstock to very high temperatures can destroy the VS and reduce the amount of substrate available for anaerobic digestion [39]. High temperatures during the pretreatment can also lead to the production of inhibitory compounds, such as furan derivates. These compounds can inhibit the anaerobic digestion process and decrease biomethane yields [40,41].

Digestion Time

The biodegradability of the substrate during the anaerobic digestion process was analyzed by calculating the digestion time necessary to achieve 85% and 95% of the maximum methane yield. Table 2 presents the main results obtained. Untreated samples achieved 85% Bmax around day 14 (0.97 mol CH4/100 g) and 95% Bmax on day ~22 (1.1 mol CH4/100 g). Pretreated samples achieved 85% Bmax and 95% Bmax faster than untreated samples and samples from the solid fraction of the post-hydrolysis broth. It took pretreated samples between 9.47–12.2 days to achieve 85% Bmax and 14.9–18.8 days to reach 95% Bmax. For samples from the solid fraction of the post-hydrolysis broth, it took between 14.4–15.1 days to reach 85% Bmax and 22.3–23.2 days to achieve 95% Bmax. Overall, high pretreatment temperatures tended to decrease biomethane production; however, it also decreased the time needed to achieve 85% Bmax and 95% Bmax. In both cases (pretreated samples and samples from the solid fraction of the post-hydrolysis broth), samples pretreated at 175 °C needed less time to be degraded and for the conversion of the substrate into methane than samples pretreated at 125 °C. The low performance of the samples from the solid fraction of the post-hydrolysis broth may be due to the fact that a higher proportion of the readily degradable hemicellulose and cellulose were hydrolyzed by enzymes and solubilized in the liquid part during the hydrolysis, thus leaving less accessible cellulose and lignin in the solid part.

3.4. Combustion Characteristics

Results from the proximate, ultimate, inorganic element, and heating value analyses are presented in Table 3. The NED pretreatment resulted in a minor decrease in the proportion of volatile matter in hay, and consequently a slight enrichment in fixed carbon and ash. The reduction in volatile matter can be explained by the partial decomposition of hemicellulose during NED. It also resulted in a slight enrichment of N, S, and inorganic elements. The impact of this change on ash chemistry is expected to be minor since the relative proportions of inorganic elements remained more or less the same. Some elements (e.g., Cl) were probably leached from the biomass during pretreatment. However, these elements would have precipitated on the treated biomass during biomass drying. Had the process water been removed from the treated biomass by mechanical means, e.g., filtration, the relative proportions of inorganic elements and resultant ash chemistry would have likely changed more significantly. Changes to carbon content, hydrogen content, and heating value were negligible following NED pretreatments.
The hydrolysis residues contained more C and had slightly higher heating values than the untreated and pretreated forms of the biomass. The hydrolysis residues also contained higher proportions of volatile matter and lower proportions of fixed carbon than the untreated and pretreated forms of the biomass. This could be due to the decomposition of cellulose during hydrolysis into simple sugars, e.g., glucose, which volatilize to a greater extent than the original cellulose compounds when heated in an inert gas atmosphere. The release of volatile matter from biomass fuels and the subsequent ignition of the evolved volatile gases is a fast process when compared to the conversion of compounds, which report to the fixed carbon fraction in the proximate analysis. Therefore, the increased ratio of volatile matter to fixed carbon in the hydrolysis residues indicates greater initial fuel reactivity. This change in reactivity may have an impact on the temperature profile within industrial combustors, particularly in the vicinity of points of fuel feeding. The hydrolysis residues also contained less ash than the untreated and pretreated forms of the biomass. The reason for this is that the process liquid was separated from the hydrolysis residues by filtration. As a result, water-soluble, ash-forming constituents were removed from the biomass with the liquid phase during filtration. Consequently, the concentrations of K, Cl, P, and Mg were significantly lower in the hydrolysis residues than in the untreated and pretreated biomass. Low concentrations of K and Cl in biomass fuels is generally advantageous for industrial-scale combustion, because the alkali chloride vapors formed during combustion can cause fouling and high-temperature corrosion of heat exchanger surfaces [42,43]. In addition, high potassium contents in the presence of silicates can lead to the formation of problematic alkali silicate phases that cause furnace slagging problems, and in the case of fluidized bed combustion technologies, also bed agglomeration [42,44]. Finally, alkali metal contents often correlate with fine particle emissions of biomass-fired boilers [45], and therefore a low potassium content in biomass fuel can be considered positive, especially for small boilers that are not equipped with efficient particulate filters.
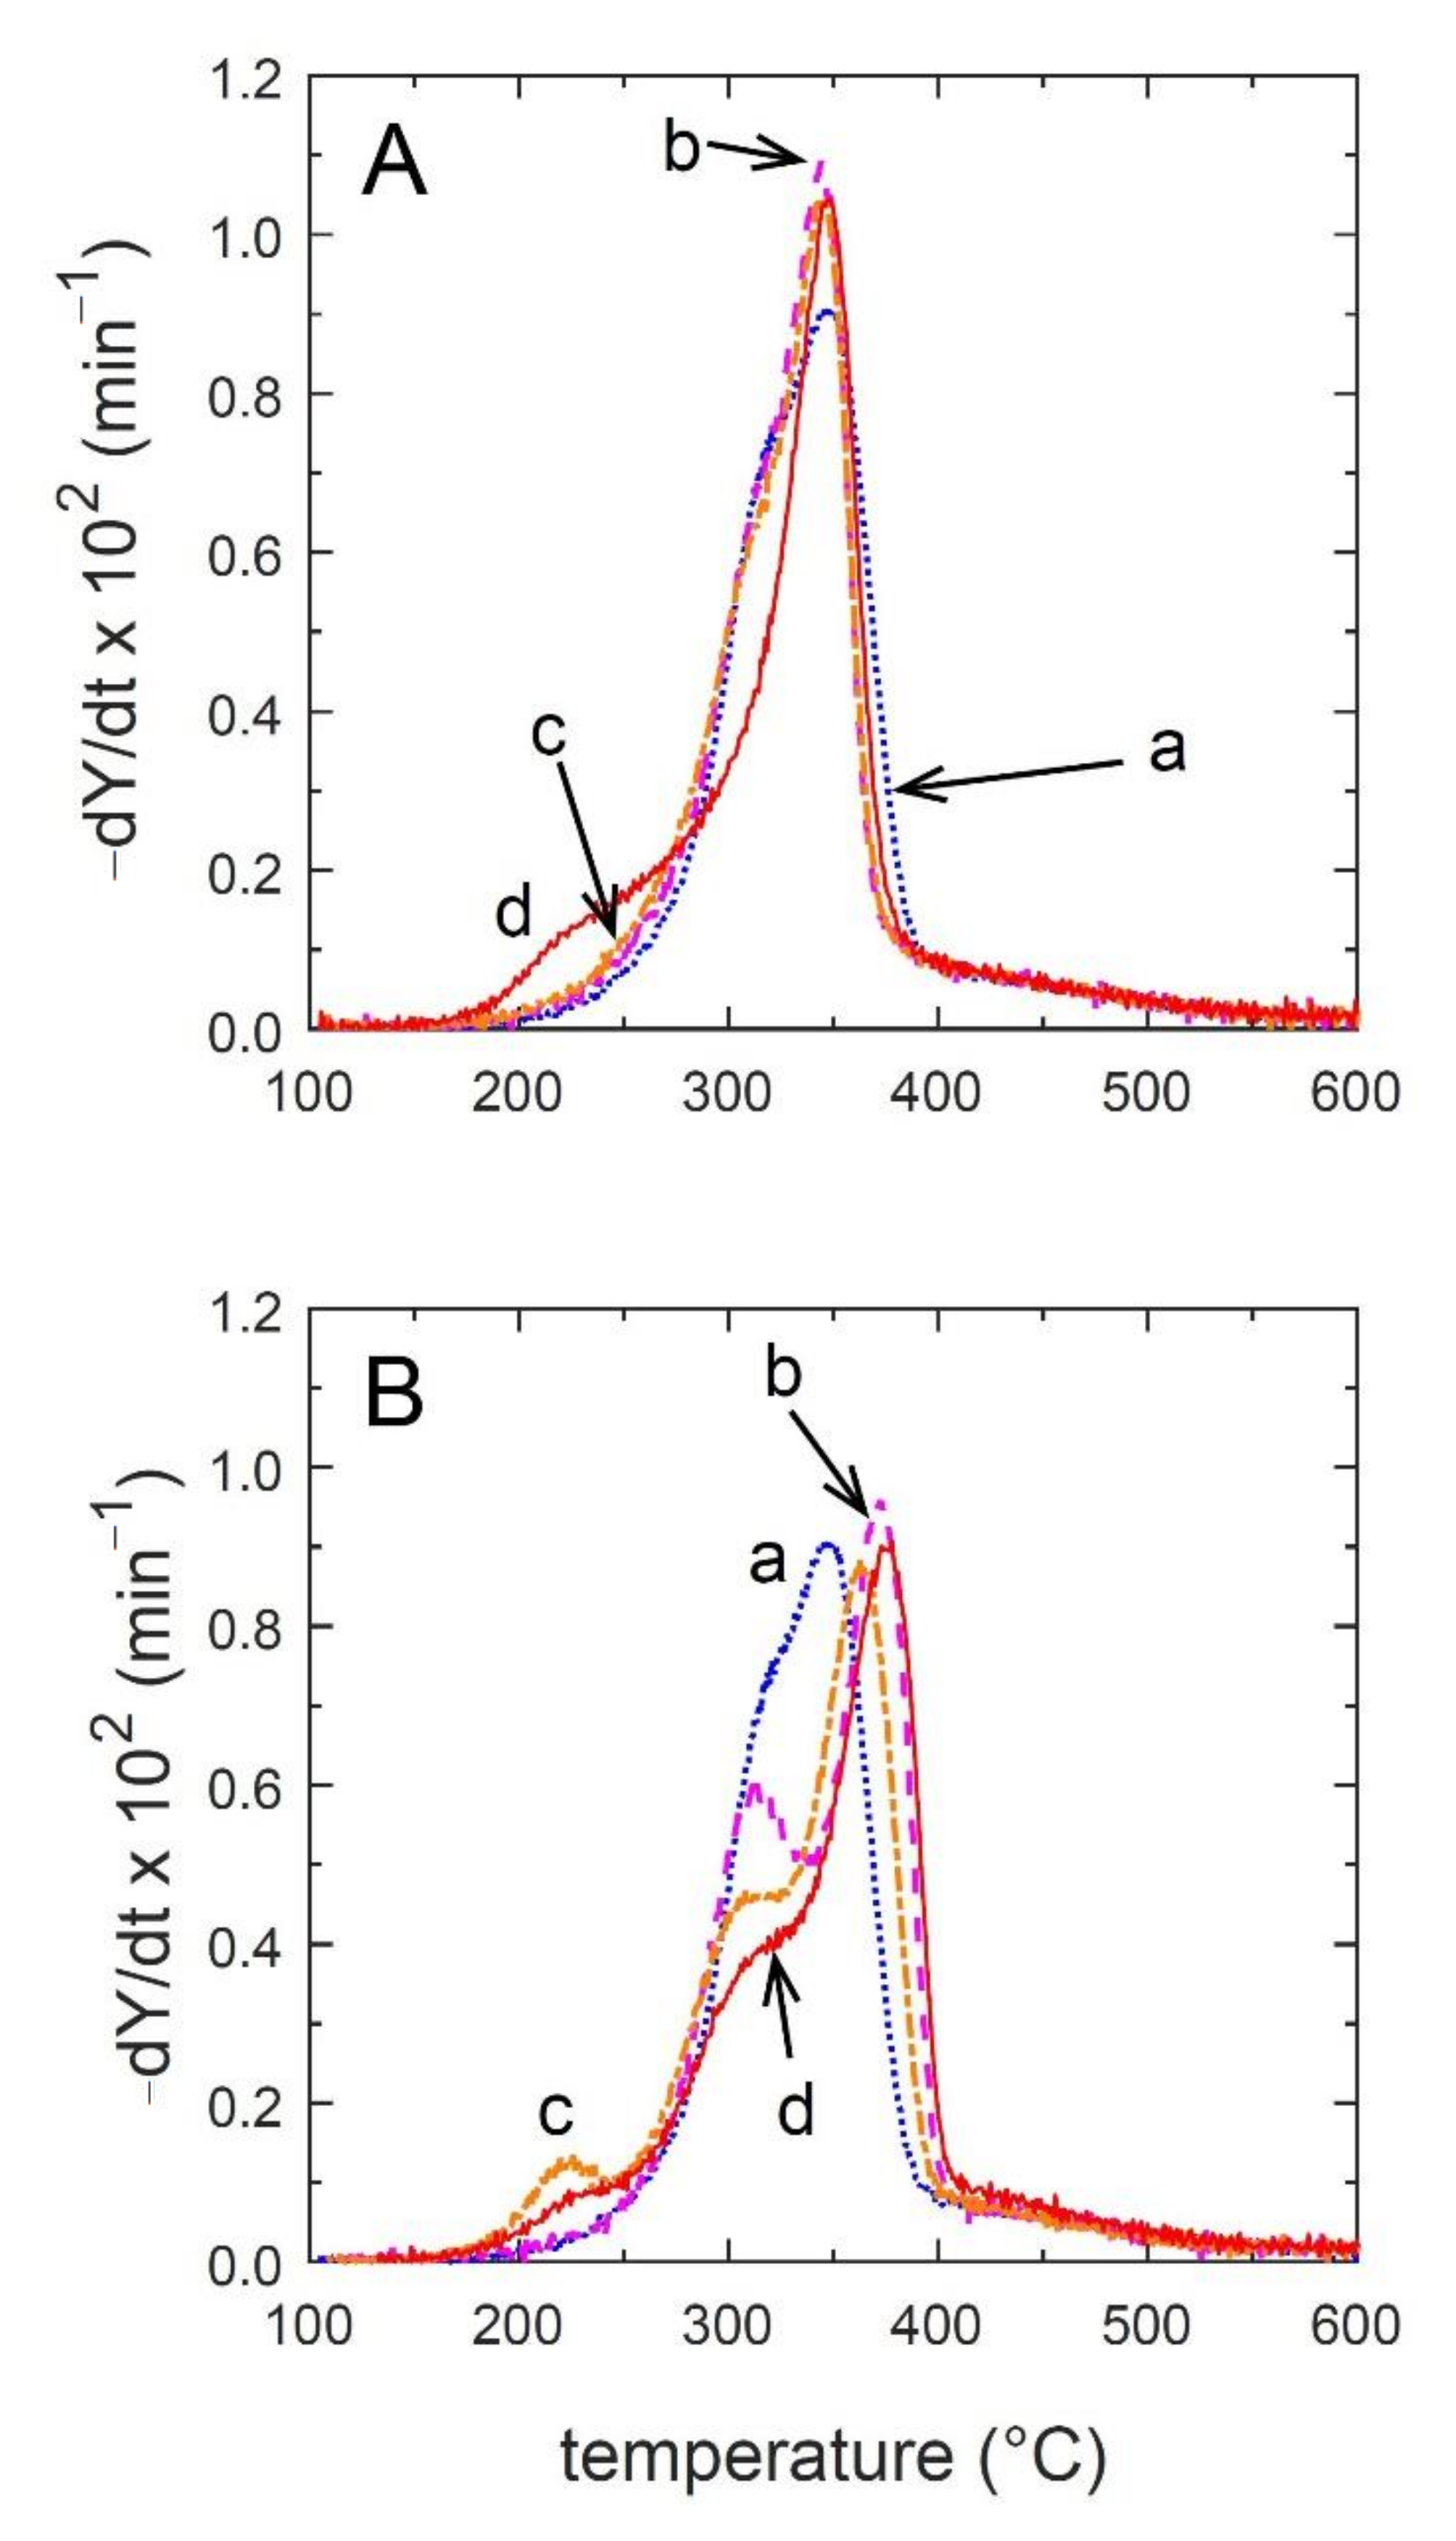
Differential thermogravimetric (DTG) curves, obtained from the devolatilization of untreated and treated forms of hay at a slow, controlled rate, are presented in Figure 4. The DTG curves show the time derivative of the sample weight as a function of devolatilization temperature. The pretreatment of hay at 175 °C caused a significant decrease in the release of volatiles over the temperature range of 290–330 °C, but an increase in the release of volatiles at lower temperatures, particularly within the range of 200–260 °C. The first change is attributed to the decomposition of hemicellulose and the second change is probably due to the formation of low-molecular weight compounds [46]. Pretreatment at 125 and 150 °C had a relatively minor impact on the rate of volatile release. For the hydrolysis residues, the bulk of volatile release takes place at higher temperatures than for the untreated and pretreated forms of biomass. The precise effect of hydrolysis on the release of volatiles was dependent on the pretreatment temperature. The release of volatiles at devolatilization temperatures below 330 °C decreased with increasing pretreatment temperature from 125 to 175 °C. The reduced release of volatiles at low temperatures may cause a minor delay in the ignition of the hydrolysis residues when they are first introduced into combustion reactors. Overall, the differences in the DTG curves are in line with the observed changes in the proportions of hemicellulose, cellulose, and lignin. These differences are, however, not expected to play a major role in the energy use of these biomass types via direct combustion.

3.5. Energy Balance and Analysis of Different Routes

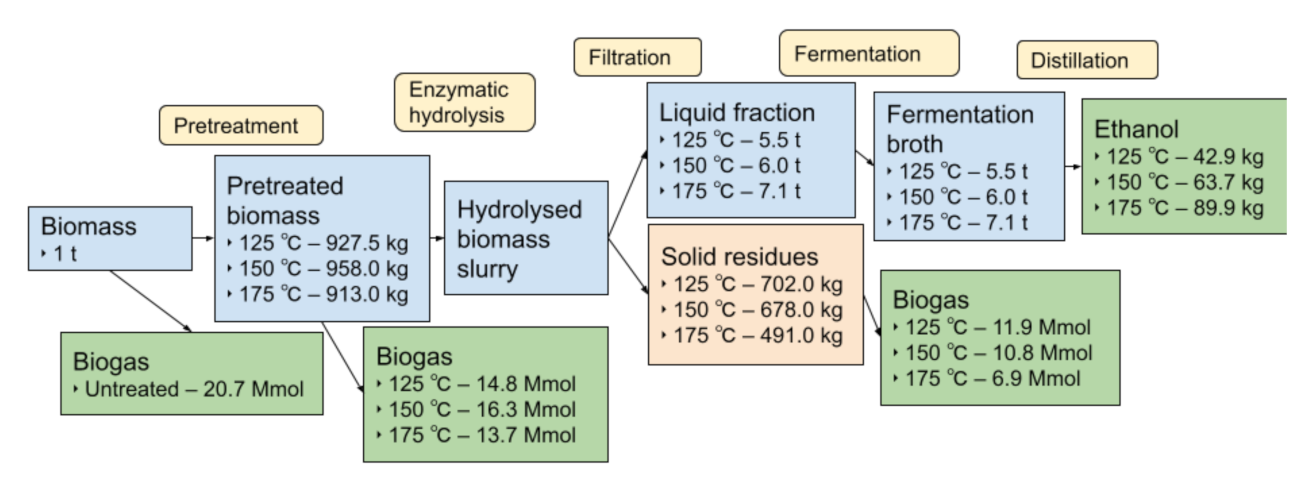
During the bioethanol production process, all liquid and solid samples were weighed to collect data for the mass balance studies. Based on the collected data, the mass balance was calculated, and mass flow charts were prepared for ethanol production processes and waste biomass utilization studies. The mass balance of the bioethanol production process is outlined in Figure 5. For energy balance, a simplified analysis was done, where the energy input involved in transporting, pretreatment, fermentation, distillation, and AD was not considered. The energy output was determined by comparing the biofuel energy of the studied routes. The gross energy outputs of the studied routes are summarized in Table 4.
As shown in Figure 5, there was a small mass loss during pretreatment. From 1 ton of biomass, 913–958 kg of dry biomass, depending on the pretreatment temperature, was recovered. The mass loss during the pretreatment was caused by the dissolution of biomass components, but also partially due to the evaporation of moisture and dissolved compounds during explosive decompression. After hydrolysis, the liquid and solid fractions were separated, and from the initial 1 ton of biomass, 491–702 kg of biomass was left as a solid residue. It has been shown in previous studies that during pretreatment, hemicellulose is mainly removed, and after the hydrolysis step, the sample mass loss was due to the partial hydrolysis of cellulose, while lignin remained in the residual biomass [30,38].
The most ethanol was produced when the highest pretreatment temperature (175 °C) was used, where 89.9 g of ethanol was obtained from 1 ton of biomass. This is more than a 100% increase in yield than when the biomass was pretreated at 125 °C. The hydrolysis and fermentation efficiencies did not increase by such large extents, however, as more liquids were removed with filtration after hydrolysis and used in the fermentation step, higher ethanol yields were finally gained. On the other hand, the biogas yield decreased as the pretreatment temperature increased. After hydrolysis, the mass of the solid residues decreased, and thereby the total amount of biogas also decreased.
As shown in Table 4, the least energy was gained when only bioethanol was produced and the waste biomass was not utilized in any way (route 7). Depending on the biomass pretreatment conditions, 1157–2428 MJ energy was gained as ethanol. The highest fuel energy was achieved via the direct combustion of the biomass, and in this case, 17,554 MJ energy was gained (route 1). When the same untreated biomass was used for biogas production, only 9273 MJ of energy was gained (route 2). When the pretreated biomass was used, the energy output decreased (3.7–6.8%) in the case of combustion, and biogas production also decreased (21.3–33.8%) (routes 3 and 4).
Using this pretreatment method, it is not reasonable to process the hay if the goal is only combustion or anaerobic digestion. During pretreatment, the mass of the biomass, the heat value, and the biogas yield decrease, which leads to a smaller final energy yield. In addition, every process step in bioethanol production also decreases the solid biomass fraction, as the cellulose part of the biomass is converted into sugars and then to ethanol. The remaining biomass is mainly composed of residual cellulose, hemicellulose, and lignin. This study shows that the more efficient the bioethanol process and the more ethanol produced, the less the final energy yield for the residual biomass. This is due to the removal of cellulosic polysaccharides from the biomass and the remaining lignin, which has a lower biogas yield than the easily degradable polysaccharides. Similar results have been shown in research by Rocha-Meneses [10,11].
Although, in the case of direct combustion, the pretreatment of the biomass slightly decreased the energy content of the biomass, which can be advantageous in terms of removing water soluble alkali metal salts from the biomass. It has been shown that biomass washing can be used to reduce ash-related problems in combustion boilers [47]. The reduced heat exchanger tube fouling in power boilers can also enable higher steam values, leading to higher boiler efficiencies.
The results confirmed that instead of a single final product, it is reasonable to use the residues to produce additional fuels or energy. After hydrolysis, bioethanol was produced; from the bioethanol, 1157–2428 MJ energy was obtained. However, if the solid fraction is separated and processed, more energy could be obtained, which would make the whole production process more profitable. If solid residues were used in combustion for energy production, the total energy obtained would reach up to 12,063–14,160 (route 5) or up to 5507–6580 MJ energy if the waste was used for biogas production (route 6).
Although the combustion of the biomass for heat and power would yield more energy than the production of biofuels, there are still several advantages to biofuel production. The combustion of residues enables more energy to be produced than producing biogas with anaerobic digestion. This scenario would be beneficial when the produced energy is used onsite for operating the bioethanol production unit, as the transport of solid biomass over long distances is most likely uneconomical. In addition, in stationary combustion, the direct combustion of solid biofuel requires more expensive combustion devices than biogas or liquid fuels.
On the other hand, as there is a need for sustainable transportation biofuels, the increase in production of biogas with bioethanol is also necessary. Bioethanol and biogas are used as transportation fuels, and are therefore very promising options to obtain a 10% renewable energy share in transport by 2020 as required by the 2015/1513 directive [2]. Moreover, the digestate remaining after anaerobic digestion is an excellent source of nutrients and minerals and could potentially be used for the cultivation of crops. In the case of combustion, the nutrients are not returned to the soil but remain in the ash, which needs additional waste handling.

4. Conclusions

The residues of the bioethanol production process from barley straw were used in two different valorization processes to find the most energetically viable route for their utilization. In addition, mass and energy balances were calculated to quantify material flow and to assess the different technological routes for biomass utilization. In terms of energy efficiency, the most effective utilization of the biomass was combustion for heat and energy production. However, for bioethanol production in a biorefinery, the whole process can be made more efficient if the bioethanol production is supported by biogas production or the combustion of residues. To study this, experiments with combustion and the anaerobic digestion of residual biomass were carried out. The results showed that bioethanol production could be made more profitable when the residues were utilized, since a significant amount of additional energy could be produced as biogas. For the raw biomass, combustion was the preferable route for bioethanol production waste processing in terms of energy. However, as there is a need for sustainable transportation biofuels, the increased production of biogas is also necessary.

Author Contributions

Conceptualization, M.R.; methodology, M.R., D.J.L.; formal analysis, M.R., D.J.L.; resources, M.R., O.S., N.J.S.; writing—original draft preparation, M.R., L.R.-M.; writing—review and editing, M.R., T.K., O.S., N.J.S.; project administration, M.R., N.J.S.; funding acquisition, M.R., N.J.S. All authors have read and agreed to the published version of the manuscript.

Funding

This research was funded by European Regional Development Fund via the Mobilitas Pluss (project MOBERA2) of the Estonian Research Council and the Academy of Finland through the INDO–NORDEN project (Holistic processes and practices for clean energy in strengthening bioeconomic strategies, 311970).
Processes 09 00726 g006

Institutional Review Board Statement

Not applicable.

Informed Consent Statement

Not applicable.

Conflicts of Interest

The authors declare no conflict of interest.

References

  1. Directive (EU) 2018/2001 of the European Parliament and of the Council of 11 December 2018 on the Promotion of the Use of Energy from Renewable Sources. Off. J. Eur. Union 2018.
  2. Directive (EU) 2015/1513 of the European Rarliament and of the Council of 9 september 2015 amending directive 98/70/ec relating to the quality of petrol and diesel fuels and amending directive 2009/28/ec on the promotion of the use of energy from renewable sources. 2015.
  3. Ghosh, S.; Chowdhury, R.; Bhattacharya, P. Sustainability of cereal straws for the fermentative production of second generation biofuels: A review of the efficiency and economics of biochemical pretreatment processes. Appl. Energy 2017, 198, 284–298. [Google Scholar] [CrossRef]
  4. Raud, M.; Kikas, T.; Sippula, O.; Shurpali, N.J. Potentials and challenges in lignocellulosic biofuel production technology. Renew. Sustain. Energy Rev. 2019, 111, 44–56. [Google Scholar] [CrossRef]
  5. Bacovsky, D.; Ludwiczek, N.; Ognissanto, M.; Wörgetter, M. Status of Advanced Biofuels Demonstration Facilities in 2012. A Bioenergy Task 39; IEA: Paris, France, 2013. [Google Scholar]
  6. Hassan, S.S.; Williams, G.A.; Jaiswal, A.K. Moving towards the second generation of lignocellulosic biorefineries in the EU: Drivers, challenges, and opportunities. Renew. Sustain. Energy Rev. 2019, 101, 590–599. [Google Scholar] [CrossRef] [Green Version]
  7. Kreuger, E.; Sipos, B.; Zacchi, G.; Svensson, S.-E.; Björnsson, L. Bioconversion of industrial hemp to ethanol and methane: The benefits of steam pretreatment and co-production. Bioresour. Technol. 2011, 102, 3457–3465. [Google Scholar] [CrossRef]
  8. Hatzis, C.; Riley, C.; Philippidis, G. Detailed Material Balance and Ethanol Yield Calculations for the Biomass-to-Ethanol Conversion Process. In Seventeenth Symposium on Biotechnology for Fuels and Chemicals: Presented as Volumes 57 and 58 of Applied Biochemistry and Biotechnology; Wyman, C.E., Davison, B.H., Eds.; Humana Press: Totowa, NJ, USA, 1996; pp. 443–459. [Google Scholar]
  9. Kaur, M.; Kumar, M.; Singh, D.; Sachdeva, S.; Puri, S.K. A sustainable biorefinery approach for efficient conversion of aquatic weeds into bioethanol and biomethane. Energy Convers. Manag. 2019, 187, 133–147. [Google Scholar] [CrossRef]
  10. Rocha-Meneses, L.; Raud, M.; Orupõld, K.; Kikas, T. Potential of bioethanol production waste for methane recovery. Energy 2019, 173, 133–139. [Google Scholar] [CrossRef]
  11. Rocha-Meneses, L.; Ivanova, A.; Atouguia, G.; Ávila, I.; Raud, M.; Orupõld, K.; Kikas, T. The effect of flue gas explosive decompression pretreatment on methane recovery from bioethanol production waste. Ind. Crop. Prod. 2019, 127, 66–72. [Google Scholar] [CrossRef]
  12. Kaparaju, P.; Serrano, M.; Thomsen, A.B.; Kongjan, P.; Angelidaki, I. Bioethanol, biohydrogen and biogas production from wheat straw in a biorefinery concept. Bioresour. Technol. 2009, 100, 2562–2568. [Google Scholar] [CrossRef]
  13. Elsayed, M.; Abomohra, A.E.-F.; Ai, P.; Wang, D.; El-Mashad, H.M.; Zhang, Y. Biorefining of rice straw by sequential fermentation and anaerobic digestion for bioethanol and/or biomethane production: Comparison of structural properties and energy output. Bioresour. Technol. 2018, 268, 183–189. [Google Scholar] [CrossRef]
  14. Raud, M.; Olt, J.; Kikas, T. N2 explosive decompression pretreatment of biomass for lignocellulosic ethanol production. Biomass Bioenergy 2016, 90, 1–6. [Google Scholar] [CrossRef]
  15. Raud, M.; Rooni, V.; Kikas, T. Explosive decompression pretreatment: Nitrogen vs. compressed air. Agron. Res. 2016, 14, 569–578. [Google Scholar]
  16. Tutt, M.; Raud, M.; Kahr, H.; Pointner, M.; Olt, J.; Kikas, T. Nitrogen explosion pretreatment of lignocellulosic material for bioethanol production. Energy Sources Recovery Util. Env. Eff. 2016, 38, 1785–1789. [Google Scholar] [CrossRef]
  17. Angelidaki, I.; Alves, M.; Bolzonella, D.; Borzacconi, L.; Campos, J.L.; Guwy, A.J.; Kalyuzhnyi, S.; Jenicek, P.; van Lier, J.B. Defining the biomethane potential (BMP) of solid organic wastes and energy crops: A proposed protocol for batch assays. Water Sci. Technol. 2009, 59, 927–934. [Google Scholar] [CrossRef] [Green Version]
  18. Owen, W.F.; Stuckey, D.C.; Healy, J.B.; Young, L.Y.; McCarty, P.L. Bioassay for monitoring biochemical methane potential and anaerobic toxicity. Water Res. 1979, 13, 485–492. [Google Scholar] [CrossRef]
  19. Telliard, W.A. Method 1684: Total, Fixed, and Volatile Solids in Water, Solids, and Biosolids; US Environmental Protection Agency: Washington, DC, USA, 2001.
  20. Lane, D.J.H.A.; Sippula, O.; Lähde, A.; Mesceriakovas, A.; Peräniemi, S.; Jokiniemi, J. Thermal separation of metal values from municipal solid waste incineration fly ash. J. Cleaner Prod. 2020, 253, 120014. [Google Scholar] [CrossRef]
  21. NREL. Determination of Ash in Biomass, Laboratory Analytical Procedure (LAP): Golden, CO, USA, 2005.
  22. Lu, J.; Li, X.; Zhao, J.; Qu, Y. Enzymatic Saccharification and Ethanol Fermentation of Reed Pretreated with Liquid Hot Water. J. Biomed. Biotechnol. 2012, 2012, 276278. [Google Scholar] [CrossRef] [PubMed] [Green Version]
  23. Mittal, S.; Ahlgren, E.O.; Shukla, P.R. Future biogas resource potential in India: A bottom-up analysis. Renew. Energy 2019, 141, 379–389. [Google Scholar] [CrossRef]
  24. Gabisa, E.W.; Gheewala, S.H. Potential, environmental, and socio-economic assessment of biogas production in Ethiopia: The case of Amhara regional state. Biomass Bioenergy 2019, 122, 446–456. [Google Scholar] [CrossRef]
  25. Han, M.; Kang, K.E.; Kim, Y.; Choi, G.-W. High efficiency bioethanol production from barley straw using a continuous pretreatment reactor. Process Biochem. 2013, 48, 488–495. [Google Scholar] [CrossRef]
  26. Kikas, T.; Tutt, M.; Raud, M.; Alaru, M.; Lauk, R.; Olt, J. Basis of Energy Crop Selection for Biofuel Production: Cellulose vs. Lignin. Int. J. Green Energy 2014. [Google Scholar] [CrossRef]
  27. Balat, M. Production of bioethanol from lignocellulosic materials via the biochemical pathway: A review. Energy Convers. Manag. 2011, 52, 858–875. [Google Scholar] [CrossRef]
  28. Talebnia, F.; Karakashev, D.; Angelidaki, I. Production of bioethanol from wheat straw: An overview on pretreatment, hydrolysis and fermentation. Bioresour. Technol. 2010, 101, 4744–4753. [Google Scholar] [CrossRef]
  29. Conde-Mejía, C.; Jiménez-Gutiérrez, A.; El-Halwagi, M. A comparison of pretreatment methods for bioethanol production from lignocellulosic materials. Process Saf. Environ. Prot. 2012, 90, 189–202. [Google Scholar] [CrossRef]
  30. Raud, M.; Krennhuber, K.; Jäger, A.; Kikas, T. Nitrogen explosive decompression PRE-TREATMENT: An alternative to steam explosion. Energy 2019, 177, 175–182. [Google Scholar] [CrossRef]
  31. Yi, J.; Dong, B.; Jin, J.; Dai, X. Effect of increasing total solids contents on anaerobic digestion of food waste under mesophilic conditions: Performance and microbial characteristics analysis. PLoS ONE 2014, 9, e102548. [Google Scholar] [CrossRef]
  32. Agudelo, R.A.; García-Aparicio, M.P.; Görgens, J.F. Steam explosion pretreatment of triticale (× Triticosecale Wittmack) straw for sugar production. New Biotechnol. 2016, 33, 153–163. [Google Scholar] [CrossRef]
  33. Chiaramonti, D.; Prussi, M.; Ferrero, S.; Oriani, L.; Ottonello, P.; Torre, P.; Cherchi, F. Review of pretreatment processes for lignocellulosic ethanol production, and development of an innovative method. Biomass Bioenergy 2012, 46, 25–35. [Google Scholar] [CrossRef]
  34. Oliveira, F.M.V.; Pinheiro, I.O.; Souto-Maior, A.M.; Martin, C.; Gonçalves, A.R.; Rocha, G.J.M. Industrial-scale steam explosion pretreatment of sugarcane straw for enzymatic hydrolysis of cellulose for production of second generation ethanol and value-added products. Bioresour. Technol. 2013, 130, 168–173. [Google Scholar] [CrossRef] [PubMed]
  35. Ravindran, R.; Jaiswal, S.; Abu-Ghannam, N.; Jaiswal, A.K. A comparative analysis of pretreatment strategies on the properties and hydrolysis of brewers’ spent grain. Bioresour. Technol. 2018, 248, 272–279. [Google Scholar] [CrossRef] [Green Version]
  36. Tutt, M.; Kikas, T.; Kahr, H.; Pointner, M.; Kuttner, P.; Olt, J. Using steam explosion pretreatment method for bioethanol production from floodplain meadow hay. Agron. Res. 2014, 12, 417–424. [Google Scholar]
  37. Jönsson, L.J.; Martín, C. Pretreatment of lignocellulose: Formation of inhibitory by-products and strategies for minimizing their effects. Bioresour. Technol. 2016, 199, 103–112. [Google Scholar] [CrossRef] [Green Version]
  38. Raud, M.; Rooni, V.; Kikas, T. The Efficiency of Nitrogen and Flue Gas as Operating Gases in Explosive Decompression Pretreatment. Energies 2018, 11, 2074. [Google Scholar] [CrossRef] [Green Version]
  39. Meegoda, J.N.; Li, B.; Patel, K.; Wang, L.B. A Review of the Processes, Parameters, and Optimization of Anaerobic Digestion. Int. J. Environ. Res. Public Health 2018, 15, 2224. [Google Scholar]
  40. Montgomery, L.F.R.; Bochmann, G. Pretreatment of Feedstock for Enhanced Biogas Production. In IEA Bioenergy Task 37—Energy from Biogas; Baxter, D., Ed.; IEA Bioenergy: Paris, France, 2014; ISBN 978-1-910154-05-2. [Google Scholar]
  41. Phuttaro, C.; Sawatdeenarunat, C.; Surendra, K.C.; Boonsawang, P.; Chaiprapat, S.; Khanal, S.K. Anaerobic digestion of hydrothermally-pretreated lignocellulosic biomass: Influence of pretreatment temperatures, inhibitors and soluble organics on methane yield. Bioresour. Technol. 2019, 284, 128–138. [Google Scholar] [CrossRef] [PubMed]
  42. Niu, Y.; Tan, H.; Hui, S.e. Ash-related issues during biomass combustion: Alkali-induced slagging, silicate melt-induced slagging (ash fusion), agglomeration, corrosion, ash utilization, and related countermeasures. Prog. Energy Combust. Sci. 2016, 52, 1–61. [Google Scholar] [CrossRef]
  43. Nielsen, H.P.; Frandsen, F.J.; Dam-Johansen, K.; Baxter, L.L. The implications of chlorine-associated corrosion on the operation of biomass-fired boilers. Prog. Energy Combust. Sci. 2000, 26, 283–298. [Google Scholar] [CrossRef]
  44. Hupa, M. Ash-Related Issues in Fluidized-Bed Combustion of Biomasses: Recent Research Highlights. Energy Fuels 2012, 26, 4–14. [Google Scholar] [CrossRef]
  45. Sippula, O.; Lamberg, H.; Leskinen, J.; Tissari, J.; Jokiniemi, J. Emissions and ash behavior in a 500kW pellet boiler operated with various blends of woody biomass and peat. Fuel 2017, 202, 144–153. [Google Scholar] [CrossRef]
  46. Bach, Q.-V.; Tran, K.-Q.; Skreiberg, Ø. Comparative study on the thermal degradation of dry- and wet-torrefied woods. Appl. Energy 2017, 185, 1051–1058. [Google Scholar] [CrossRef]
  47. Gudka, B.; Jones, J.M.; Lea-Langton, A.R.; Williams, A.; Saddawi, A. A review of the mitigation of deposition and emission problems during biomass combustion through washing pre-treatment. J. Energy Inst. 2016, 89, 159–171. [Google Scholar] [CrossRef]
Figure 1. A flow chart of the studied routes of a barley hay biorefinery for biofuel and bioenergy production, where the numbers indicate different process routes.
Processes 09 00726 g001
Figure 2. Glucose and ethanol yields and fermentation and hydrolysis efficiencies of the bioethanol production process using NED pretreatment at different temperatures.
Processes 09 00726 g002
Figure 3. Experimental results and corresponding fitting curves for BMP tests involving untreated material and samples after pretreatment (A) and samples from the solid fraction of the post-hydrolysis broth (B).
Processes 09 00726 g003
Figure 4. Time (t) derivative of the mass fraction (Y) as a function of devolatilization temperature for (A) the pretreated biomass and for (B) hydrolysis residues. Results are presented for (a) the untreated biomass and for three different pretreatment temperatures, (b) 125 °C, (c) 150 °C, and (d) 175 °C. Devolatilization was carried out at a heating rate of 30 °C min−1 in pure N2.
Processes 09 00726 g004
Figure 5. The mass balance of the bioethanol production process and the potential bioethanol and biogas amounts that could be produced from 1 ton of biomass under different pretreatment conditions.
Processes 09 00726 g005
Table 1. The composition of dried biomass after pretreatment and after hydrolysis. The sample numbers indicate the pretreatment temperature applied.
Pretreatment TemperatureMoisture (%)Ash (%)Lignin (%)Cellulose (%)Hemicellulose (%)TS
(g kg−1)
VS
(g kgTS−1)
Untreated biomass6.8 ± 0.23.47.8 ± 0.240.0 ± 0.227.2 ± 0.8931 ± 0.8963 ± 0.5
Pretreated samples
125 °C6.7 ± 0.23.28.7 ± 0.641.1 ± 0.426.6 ± 0.7927 ± 1960 ± 0.4
150 °C6.6 ± 0.23.88.9 ± 0.239.3 ± 0.621.1 ± 0.8929 ± 2963 ± 0.5
175 °C5.4 ± 0.22.611.3 ± 0.240.3 ± 0.26.5 ± 1.0939 ± 0.4962 ± 0.7
Hydrolyzed samples
125 °C6.7 ± 0.22.29.4 ± 0.739.8 ± 0.320.2 ± 0.7931 ± 1976 ± 0.2
150 °C5.9 ± 0.22.211.6 ± 0.640.8 ± 0.128.0 ± 0.5928 ± 0.4973 ± 0.4
175 °C5.4 ± 0.22.612.1 ± 0.538.9 ± 0.621.5 ± 0.3938 ± 2974 ± 0.5
Table 2. Maximum methane yield (Bmax) and anaerobic digestion time (85% Bmax and 95% Bmax) for untreated barley straw, pretreated material, and samples from the solid fraction of the post-hydrolysis broth.
SamplePretreatment TemperatureBmax85% Bmax95% Bmax
mol CH4 100 g−1mol CH4 100 g−1Daysmol CH4 100 g−1Days
Untreated-1.14 ± 0.02 a,b0.9714.31.122.1
Pretreated125 °C0.91 ± 0.02 c0.7712.20.8618.8
150 °C0.93 ± 0.01 d0.7911.70.8818.3
175 °C0.85 ± 0.01 e0.729.470.8114.9
Solid fraction of the post-hydrolysis broth125 °C0.91 ± 0.01 f0.7715.10.8623.2
150 °C0.87 ± 0.010.7414.80.8322.9
175 °C0.73 ± 0.010.6214.40.6922.3
a Statistically significant differences (p < 0.05) between untreated material and samples from the pretreatment stage that were pretreated at 125 °C, 150 °C, 175 °C. b Statistically significant differences (p < 0.05) between untreated material and samples from the solid fraction of the post-hydrolysis broth that were pretreated at 125 °C, 150 °C, 175 °C. c Statistically significant differences (p < 0.05) between samples from the pretreatment stage that were pretreated at 125 °C and samples from the pretreatment stage that were pretreated 175 °C; and between samples from the pretreatment stage that were pretreated at 125 °C and samples from the solid fraction of the post-hydrolysis broth that were pretreated at 150 °C, 175 °C. d Statistically significant differences (p < 0.05) between samples from the pretreatment stage that were pretreated at 150 °C and samples from the solid fraction of the post-hydrolysis broth that were pretreated at 125 °C, 150 °C, 175 °C. e Statistically significant differences (p < 0.05) between samples from the pretreatment stage that were pretreated at 175 °C and samples from the solid fraction of the post-hydrolysis broth that were pretreated at 175 °C. f Statistically significant differences (p < 0.05) between samples from the solid fraction of the post-hydrolysis broth that were pretreated at 125 °C and samples from the solid fraction of the post-hydrolysis broth that were pretreated at 175 °C.
Table 3. Results from the proximate, ultimate, inorganic element, and heating value analyses. Results are reported for untreated hay, pretreated hay, and for pretreated and then hydrolyzed hay. Data are presented for three pretreatment temperatures. All values are reported on a dry basis.
UntreatedPretreatedPretreated and Hydrolyzed
125 °C150 °C175 °C125 °C150 °C175 °C
Proximate analysis
Volatile matter (%)80.579.679.779.985.482.382.8
Fixed carbon (%)15.816.316.316.212.115.114.6
Ash (%)3.74.14.03.92.52.62.6
Ultimate analysis
C (% w/w)47.747.547.548.149.249.051.7
H (% w/w)5.95.95.95.96.06.06.1
N (% w/w)0.760.960.910.921.071.031.43
S (% w/w)0.100.110.110.110.080.090.12
Inorganic element analysis
Si (% w/w)0.660.610.670.640.850.640.81
K (% w/w)0.630.750.740.760.050.220.06
Ca (% w/w)0.370.430.370.540.340.230.37
Cl (% w/w)0.100.170.140.19<0.1<0.1<0.1
P (mg kg−1)897101511421015488651424
Mg (mg kg−1)858862948782320436201
Al (mg kg−1)99125138156202241235
Fe (mg kg−1)70122145128181160225
Na (mg kg−1)598173544523040
Zn (mg kg−1)<40<40<4042<40<4047
Ti (mg kg−1)<40<40<40<40<40<40<40
Gross calorific value (MJ kg−1)18.919.019.019.319.719.721.0
Net calorific value (MJ kg−1)17.617.617.718.018.318.319.6
Table 4. Energy outputs in MJ from each studied scenario in the biorefinery concept if 1 ton of biomass was processed.
Untreated Biomass125 °C150 °C175 °C
ScenarioBiogasCombustionBioethanolBiogasCombustionBioethanolBiogasCombustionBioethanolBiogasCombustion
1-16 194.7---------
29273.6----------
3----−1452.3--−915.2--−532.1
4---6648.3--7296.1--6135.4-
5--1157.4-3724.91720.6-2882.22428.0-3578.0
6--1157.45346.4-1720.64859.9-2428.03079.6-
7--1157.4--1720.6--2428.0--
Total Energy from All Outputs
Untreated Biomass125°C150°C175°C
116,194.7---
29273.6---
3-−1452.3−915.2−532.1
4-6648.37296.16135.4
5-4882.44602.96006.0
6-6503.96580.75507.6
7-1157.41720.82428.0
Publisher’s Note: MDPI stays neutral with regard to jurisdictional claims in published maps and institutional affiliations.