Abstract
A rectangular double chamber with trivalent arsenic as the electron donor of the biological anode was constructed by microbial fuel cells (MFC), and the feasibility of the MFC simultaneous degradation of trivalent arsenic and nitrate was studied. Experimental results show that the co-matrix-coupled MFC reactor oxidizes trivalent arsenic in an anode chamber and degrades nitrate in the cathode chamber. The removal rate of trivalent arsenic is about 63.35%, and the degradation rate of nitrate is about 55.95% during the complete and stable operation period. MFC can continuously output electric energy, and the maximum output voltage is 388 mV. We compared and analyzed the main functional microflora of biofilm microorganisms in an anode chamber. In the long-term arsenic-polluted environment, the activity of Acinetobacter, Pseudomonas bacteria with arsenic resistance, was improved. It is inferred that a fraction of trivalent arsenic was oxidized to pentavalent arsenic by electrode-attached microorganisms. While remaining trivalent, arsenic was taken up by the suspended bacterial biomass and converted into stable arsenide. The results of this study have theoretical reference value for the expansion of the MFC application scope.
1. Introduction
With the rapid development of the social economy, arsenic pollution in water has become a global environmental problem, mainly from the use of semiconductors and herbicides, as well as arsenic-containing wastewater discharged from petroleum processing, electroplating, mining, and smelting industries. Arsenic in the water environment is mainly divided into inorganic arsenic and organic arsenic, in which the content of organic arsenic is generally low and inorganic arsenic is the main content [1]. The inorganic arsenic compounds are mainly As(III) (trivalent arsenic, arsenite) and As(V) (pentavalent arsenic, arsenate). Studies have shown that trivalent arsenic is 60 times more toxic than pentavalent arsenic [2]. Arsenic is very stable and not easily removed, and it can be accumulated in the body of the food chain, which harms human health [3,4,5]. At present, the treatment of arsenic pollution in water is mainly divided into an ion-exchange method, adsorption method, extraction method precipitation method, and microbial method. A microbial method consists of using some microorganisms through biological oxidation, methylation transformation, and adsorption to solve the problem of arsenic pollution in the water while detoxifying the water body and purifying the water body [6,7]. Studies have found that Bacillus subtilis, Thiobacillus ferrooxidans, and Bacillus cereus [8,9,10] can adsorb arsenic in different valence states, and some iron bacteria can also act on arsenic in sewage. The electrochemical method is also a common method of water purification, which needs to consume a lot of electric energy, so it is necessary to explore a better method than the electrochemical method to treat heavy metal pollution in water.
Studies have shown that the use of soil microbial fuel cells can significantly reduce the release of arsenic in soil pore water [11,12,13]. On the 50th day, the arsenic concentration in pore water of the paddy soil with microbial fuel cells was only half that of the control, which proved that microbial fuel cells could be combined with the heavy-metal-polluted paddy fields to repair and control the heavy metals in the paddy fields while generating electricity [14]. Zhu et al. studied the influence of the construction of the wetland plant–sediment microbial fuel cell system on the content and morphological changes of As in sediment, proving that the anode electricity generation process can change the morphology of As in sediment and thus affect the absorption of As by plants in sediment [15].
Based on the previous research, this study combined the trivalent arsenic oxidation reaction and nitrate reduction reaction in an MFC to construct a comatrix biogenic cathode MFC. This research is focused mainly on whether the feasibility of using MFC to simultaneously degrade trivalent arsenic and nitrate and simultaneously generate electricity and could provide a theoretical basis for the practical application of the coupled treatment of pollutants by MFC.
2. Experimental
2.1. MFC Construction and Operating Conditions
The anodic and cathodic compartments had a working volume of 400 mL each. The two compartments were separated by a proton-exchange membrane (Nafion 117, Dupont, Wilmington, DE, USA). Each chamber used a self-made carbon bush (with an effective volume of 80 mL) as the electrodes, which were soaked overnight in deionized water to remove organic contamination on the surface of the carbon bushes [16]. The MFC circuits were connected by an external copper circuit under a 1000 Ω load. The produced voltage was monitored using a PC-connected data logger (USB-4716, Yanhua Corp., Beijing, China), and data were recorded every 2 min (Figure 1). All tests were run at 25 ± 0.5 °C in a controlled biochemical incubator. The device remained static to make the cathode and anode biofilms, and the solution was changed every 48 h until the voltage output stabilized [17]. Thereafter, the system started successfully, and microorganisms were fully fit to the simulated wastewater. The end of the production cycle is defined as the voltage output decreased to 50 mV [18]. Due to the error of the voltage collector, when the voltage is lower than 50 mV, it is impossible to confirm whether the voltage comes from the reactor output, so the voltage and contaminant detection was not carried out.
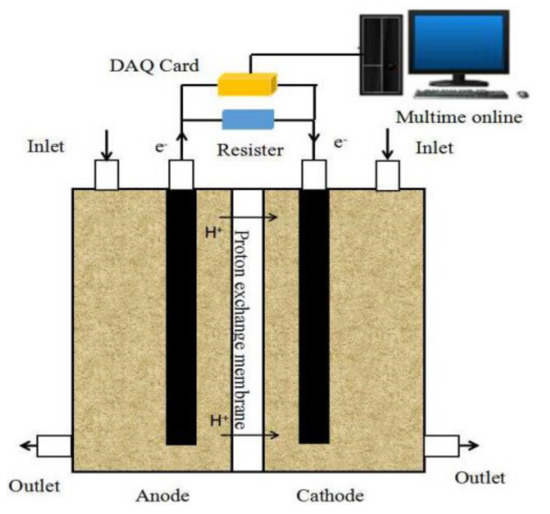
Figure 1.
Schematic of the microbial fuel cell (MFC) reactor.
The mixed solution of anolyte or catholyte and inoculated sludge in a volume ratio of 4:1 was used as a solvent. The anode and cathode were inoculated with raw sludge from an aeration tank from the Wangxiaoying Sewage Treatment Plant in Hefei City, China. The anode growth media (0.4 g/L COD, pH = 7.4) contained 0.641 g/L of acetate, phosphate-buffered solution (PBS, including 2.883 g/L of KH2PO4, 6.571 g/L of K2HPO4, 0.13 g/L of KCl, and 0.31 g/L of NH4Cl; pH = 7.4), a mineral solution, and a vitamin solution. Trivalent arsenic exists in the form of NaAsO2, and the concentration is arranged on demand. The mineral solution included the following constituents (in grams per liter of deionized water): NTA, 1.5; CaCl2·2H2O, 0.1; CuSO4·5H2O, 0.01; H3BO3, 0.01; MgSO4·H2O, 0.5; Na2MoO4, 0.025; NiCl2·6H2O, 0.024; Na2WO4·2H2O, 0.025; ZnCl2, 0.13; AlK(SO4)2·12H2O, 0.01; CoCl2·6H2O, 0.1; and NaCl, 1. Furthermore, the vitamin solution contained the following constituents (in milligrams per liter of deionized water): vitamin B5, 5; vitamin H, 2; vitamin B6, 10; niacin, 5; folic acid, 2; riboflavin, 5; vitamin B12, 0.1; vitamin B1, 5; p-aminobenzoic acid, 5; lipoic acid, 5. The cathode chamber was fed with 0.722 g/L of KNO3 solution at pH 7.4, 12.5 mL/L of the microelement solution, and 5 mL/L of the nutrient solution. Additionally, 1 g/L of NaHCO3 was added to the catholyte to provide a carbon source for cathode microorganisms.
2.2. MFC Testing and Chemical Analysis
Current density (J, mA/m3) was calculated as J = U/(RV), where U is the cell voltage (mV), R is the external resistance (Ω), and V is the effective volume of the cathode chamber (m3). Power density (P, mW/m3) was determined as P = IU. Polarization and power density curves were used to evaluate the power performance of MFC by varying the external resistance over a range of 5–9999 Ω with the use of a resistor box when stable maximum voltages were produced in a steady and repeatable voltage cycle. NO3−-N, NO2−-N, and NH4+-N were measured based on a standard method. Total nitrogen (TN) was measured using a multi N/C3100 analyzer (Analytik Jena, Jena, Germany). The concentration of arsenic in the solution was determined by a high-performance liquid chromatography-hydride generation atomic fluorescence spectrometer (SAP-10, Beijing Jitian Environmental Protection Equipment Co., Ltd. Beijing, China).
2.3. Amplification of 16S rRNA Genes, Sequencing and Sequence Analyses
A piece of the electrode was cut off with a sterile razor after MFC performance tests and chemical analysis, and the genomic DNA was extracted using the Qubit 3.0 DNA for Soil kit (OMEGA, Norcross, GA, USA) by the instructions provided by the manufacturer. The same extraction kit was used to extract DNA from the aeration tank of the sewage treatment plant that was used as a microbial inoculum. The V3–V4 hypervariable regions of the 16S rRNA gene were PCR amplified and sequenced with a MiSeq Illumina sequencer (Illumina, Inc., San Diego, CA, USA) using a 250 bp × 2 paired-end protocol [19]. Multiplexed libraries were prepared using 341F and 805R primers modified by adding external barcodes to allow the parallel processing of multiple samples. Polymerase chain reaction (PCR) was performed in 2 × 15 µL reactions with Taq Master Mix and 10 µM of each primer. Amplification was conducted under the following conditions: 95 °C for 3 min, 5 cycles with 94 °C for 20 s, 55 °C for 20 s, 72 °C for 30 s, and a final elongation step of 72 °C for 5 min. The amplicons were then purified using the Wizard® SV Gel and PCR Clean-up System (Promega Corporation, Madison, WI, USA) following the instructions provided by the manufacturer and then quantified using Qubit® (Life Technologies, Carlsbad, CA, USA). All DNA samples were tested for amplification inhibition by sample dilution. Reads from sequencing were demultiplexed based on the internal barcodes. Forward and reverse reads were merged with perfect overlapping and quality filtered with default parameters. Singleton sequences (sequencing appearing only once in the entire data set) were removed both from the whole dataset and from each sample dataset. Operational taxonomic units (OTUs) were defined in the entire data set, clustering the sequences at 97% sequence identity and defining a representative sequence for each cluster [20]. A subset of 10,000 random sequences was chosen from each sample, and the abundance of each OTU was estimated by mapping the sequences of each sample against the representative sequence of each OTU at 97% sequence identity. The sequences representative of each OTU were classified at different taxonomic ranks by using the Ribosomal Data Project classifier (≧80% confidence) [21]. To compare the microbial diversity between the samples, we performed weighted and unweighted analyses with UniFrac and calculated clustering using the unweighted pair group method with arithmetic mean. The method in which the Simpson calculator for an OTU definition is commonly used in ecology to estimate the total number of species. Furthermore, the Shannon calculator returns the Shannon diversity index for an OTU definition with a higher value, indicating higher diversity [22].
3. Results and Discussion
3.1. Electrical Performance
To the anolyte, 20 mg/L of the trivalent arsenic solution was added, and the nitrate concentration in the catholyte was 80 mg/L (MFC-As). Additionally, the blank control group was set up separately, without trivalent arsenic in the anolyte (MFC-control). The same configuration was used in the same operating environment and with the same material. A comparative analysis of the effect of arsenic trivalent on nitrate degradation in the cathode chamber was performed, showing the effects on MFC electrochemical properties. The stable operation of the MFC lasted for two months, and there was no significant difference in the trend of three consecutive output voltages to determine the successful acclimation of microorganisms. The stable production cycle output voltage of the obtained MFC is illustrated in Figure 2. The output voltage of the two MFC increases rapidly in the logarithmic growth stage of the production cycle voltage. In the control group, after reaching the maximum output voltage, the output voltage of the reactor entered a relatively flat period with a slow decline rate. After a while, the voltage began to decline continuously.
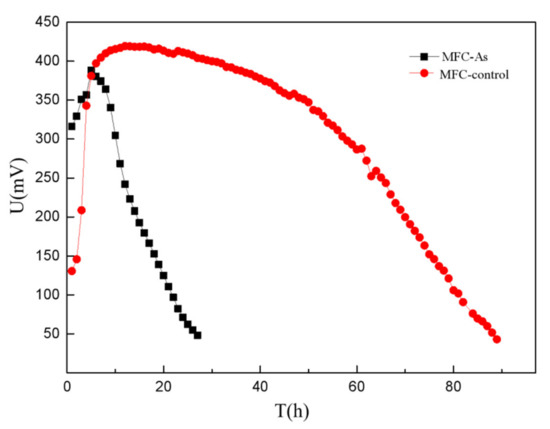
Figure 2.
Output voltage comparison of the MFC during the stable operation period.
As shown in Figure 2, after MFC-As runs for about 5 h, the output voltage reaches a maximum value of 388 mV, and after a continuous decline of about 22 h, the cycle ends, and the production cycle time is 27 h. In the control group, the output voltage of the MFC reactor went through a logarithmic growth stage of about 12 h, reaching a maximum of 419 mV. After a relatively stable voltage output stage of about 37 h, the output voltage of the reactor dropped to 351 mV. After about 38 h, the output voltage reached the lowest value, and the cycle ended. The production cycle duration of the MFC-control was 88 h.
As can be seen from the comparison results, MFC-As can operate normally and produce electricity. Nevertheless, As (III) did not promote any effect on the output voltage of the MFC reactor. The reactor of the electricity production cycle shortened at about 61 h, corresponding to the maximum output voltage gap, which was relatively small. The reason is that the As (III), as a kind of strong toxicity substance, inhibits the anodic intolerance of indoor microbial growth and development and the activity of electro-producing bacteria during the degradation process [23].
The MFC reactor with the above two kinds of stable operation was placed in an open-circuit operation state. When the voltage output was stable and the value was maximum, the power density and the polarization curve of the reactor were measured. The results are presented in Figure 3, showing that when As(III) is added to the anode solution, the MFC reactor power density reaches a maximum of 574.3 mW/m3, and the corresponding current density of 2382.8 mA/m3. The maximum power density value of MFC-control is about 915.1 mW/m3, and the corresponding current density value is approximately 3781.3 mA/m3. The internal resistance of the control group and MFC-As was estimated to be about 201 Ω and 280 Ω by the linear fitting of the polarization curve. Compared with the control group, MFC-As decreased by about 37.2% at the maximum power density. The corresponding current density decreased by about 36.9%, and the internal resistance of the battery increased by about 39.8%. The results show that the presence of trivalent arsenic reduces the power output of the MFC reactor and inhibits the MFC production performance, which is consistent with the output voltage results.
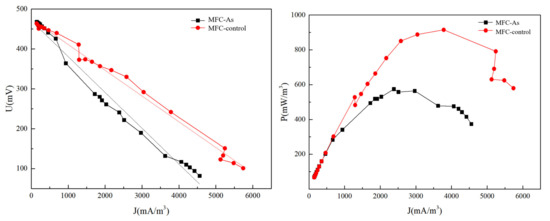
Figure 3.
Power density and polarization curve during stable operation of the MFC.
3.2. Removal of As(III) and Nitrate
3.2.1. Detoxification Effect of Arsenic in MFC-As
Changes of trivalent arsenic, pentavalent arsenic, and average total arsenic concentrations in the anodic liquid outlet in the stable operation stage of MFC-As in the production cycle are shown in Figure 4. In the cycle, the initial concentration of 20 mg/L of trivalent arsenic after the stability of the 27 h electricity production cycle concentration decreased to 7.31 mg/L. MFC-As in the anolyte trivalent arsenic removal rate is about 63.45%. The concentration of pentavalent arsenic in the anode solution increases gradually with the operation of the generation cycle. After a period of slow growth, the concentration finally stabilizes at 5.13 mg/L. The conversion efficiency of trivalent arsenic to pentavalent arsenic in the MFC-As reactor is about 25.65%. The concentration of total arsenic changes relatively gently and stays stable. At the end of the electricity generation cycle, the concentration reaches 12.43 mg/L, and the removal efficiency of total arsenic is approximately 37.85%. The results indicate that the MFC reactor with trivalent arsenic in anode solution and nitrate in the cathode solution can also reduce the toxicity of trivalent arsenic and remove total arsenic in the anode chamber while generating electricity.
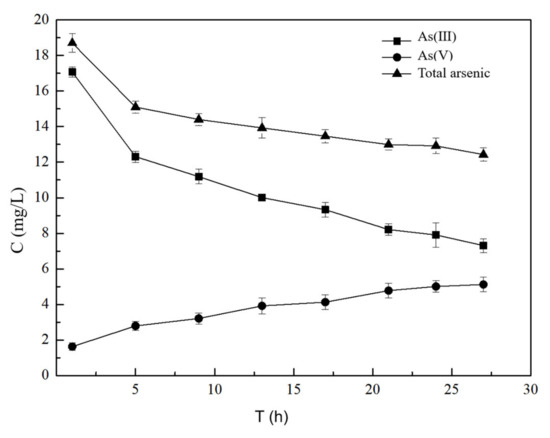
Figure 4.
Concentration changes of arsenic in MFC-As.
3.2.2. Effect on Nitrate Degradation
Figure 5 compares the concentration changes of nitrogen compounds in the cathode liquid water samples of two MFC reactors and the average removal rate of total nitrogen during the production cycle. As can be seen from Figure 5, the addition of trivalent arsenic in the anode fluid significantly inhibited the removal effect of NO3−-N in the cathode chamber. The variation trend of the NO3−-N concentration in the cathode chamber of the two MFC reactors remained consistent, and the concentration decreased with the increase of operating time. At the end of the production cycle of MFC-As, the lowest concentration of NO3−-N in the water sample of the cathode solution was 35.9 mg/L, and the degradation rate was about 55.95%. The average degradation rate in the cycle was about 1.69 mg/(L*h). After running for about 89 h in the MFC-control group, the concentration of NO3−-N in the water sample of the cathode solution was 5.91 mg/L, the degradation rate was about 92.71%, and the average degradation rate was about 0.85 mg/(L*h) in the cycle. The average removal rate of total nitrogen in the production cycle was about 0.425 mg/(L*h) in the MFC-As. The average removal rate in the control group was about 0.616 mg/(L*h), which was about 1.45 times that in the MFC-As. This suggests that the addition of arsenic trivalent is not conducive to the degradation of NO3−-N in the cathode chamber during the production cycle. Although the average degradation rate of NO3−-N is relatively improved, it is not conducive to the removal of total nitrogen in the cathode.
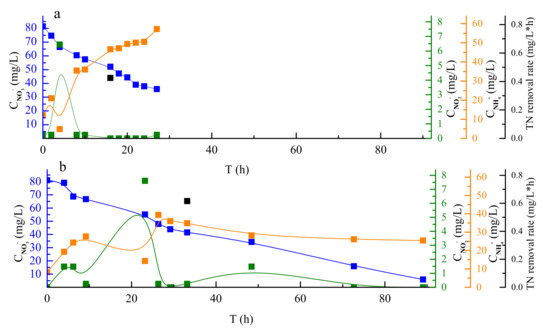
Figure 5.
Changes in the concentration of NO3−-N, NH4+-N, and NO2−-N in MFC catholyte water samples over time and the average removal rate of TN ((a) and (b) represent MFC-As and MFC-control, respectively).
The variation trend of the NO2−-N concentration in the water sample of the cathode solution in the reactor is the same. After MFC-As was run for about 4 h, the concentration of NO2−-N reached the maximum of 6.45 mg/L, which was negligible in other water samples in the cycle. After running for about 23.1 h in the MFC-control, the concentration of NO2−-N in the water sample reached a maximum of 7.61 mg/L, and the concentration of NO2−-N in the water sample during the production cycle was 0. The NH4+-N accumulated in the cathode liquid water sample during the initial operation of the MFC-As. The concentration of NH4+-N accumulated in the catholyte water sample gradually increased, and the accumulated NH4+-N began to decrease after about 2 h. After about 4 h, the NH4+-N concentration reached the lowest value of 4.85 mg/L in the electricity generation cycle, and then with the increase of running time, the larger the concentration was accumulated. At 27 h, the concentration of NH4+-N in the catholyte water sample was 57.2 mg/L. The variation trend of NH4+-N concentration in the control group was similar to that in the MFC-As. At the beginning of the production cycle, the NH4+-N concentration in the catholyte water sample reached a peak of 39.39 mg/L at 26.34 h, and then the concentration began to decrease smoothly. At the end of the production period (89 h), the NH4+-N concentration in the catholyte water sample was 25.44 mg/L.
The presence of NH4+-N and NO2−-N in the catholyte water sample proves to be denitrification reactions in both MFC reactors. The peak value of the NO2−-N concentration in the catholyte water sample in the reactor is commensurate with the period of the lowest value of NH4+-N concentration, and anaerobic ammonia oxidation occurred in the reactor. During the power generation cycle of the device, the degradation of catholyte NO3−-N has different degrees of NH4+-N accumulation, and the accumulation of MFC-As is more obvious. After the production cycle is over, NO3−-N is in the water sample. The sum of the NO2−-N, NH4+-N concentration, and total nitrogen concentration is significantly lower than the nitrogen content of the initial catholyte, indicating the use of the MFC anode compartment to degrade trivalent arsenic and the cathode compartment to degrade nitrate and achieve simultaneous electricity generation feasibility.
3.3. Characterization of Microbial Communities
Microorganisms are the core components of a microbial fuel cell reactor because the reactions in the reactor are mainly derived from the interaction of various microbial communities [24]. The change in MFC performance is caused by the change in the functional microorganism structure, which can act on the biological reaction in the reactor [23]. Therefore, high-throughput sequencing was used to analyze and compare the microbial community structure of the raw sludge and MFC reactor attached to the electrode during the stable production cycle.
3.3.1. Microbial Community Diversity Analysis
The Shannon index and Simpson index are used to evaluate the biodiversity of the communities in the microbial system, and the number of OTUs in the microbial structure is compared to analyze the total microbial species. The results are presented in Table 1. The index reflects whether the sequencing result represents the true situation of the sample. The coverage rates in this sequencing are all above 0.98, indicating that the amount of sequencing this time is reasonable. The sequencing results meet the needs of sample analysis, and can fully reflect the characteristics of the microorganisms in the sample [25].

Table 1.
Comparison of microbial diversity of each sample.
The original inoculated sludge OTU number used in the experiment was 2960. With the addition of nitrate in the catholyte, the OTU number of the cathode chamber increased relatively during the stable power generation stage of the system when the anode chamber after trivalent arsenic was added to the middle anolyte. The OTU value decreased significantly. The minimum OTU number in the MFC-As anode compartment was 2582, while the maximum OTU number of the MFC-control group without trivalent arsenic in the anolyte was 3450, which is the same as trivalent arsenic, inhibits the activity of electricity-producing bacteria, and affects the survival of surrounding microorganisms. The Shannon index and Simpson index in the comparison table show that the diversity of bacteria in the anode compartment of the original inoculated sludge and the MFC-control group is not much different. The difference in the diversity of microbial communities in the cathode compartment of the two MFC reactors is not obvious, and the diversity of microorganisms in the anode chamber of the MFC-As reactor is much lower than that of the MFC sample and the original inoculated sludge, which means that trivalent arsenic has a selective effect on the growth of microorganisms [26] in the reactor.
3.3.2. Analysis of the Structural Composition of Microbial Community
To better understand the effect of arsenic trivalent in the anode chamber on the microbial community structure in the MFC reactor, the community composition of each microbial sample was compared at the family and genus levels. At the level of family classification (Figure 6a), the composition of each microbial sample is quite different. Microbial community composition in the anode chamber was significantly different between MFC-As and MFC-control. The cathodes of the two MFC have a similar microbial community composition, but the proportion of each genus is slightly different, which is consistent with the microbial community similarity results obtained by the UniFrac analysis. The distribution of the microbial community structure of the sample at the genus classification level (proportion: ≥1%) is shown in Figure 6b. Except for the unidentified genus, the dominant genus in the anode compartment is Acinetobacter (4.91–18.18%), Geobacter (0.7–3.71%), Acidaminobacter (0.01–3.49%), Eubacterium (0.7–1.52%), and Petrimonas (0.2–2.49%). The activity of Acinetobacter with strong arsenic resistance was enhanced under the long-term arsenic contamination environment [27], which is conducive to the stability and formation of the biofilm attached to the anode chamber electrode. Geobacter usually exists in an anaerobic environment and mainly acts on the oxidation of organic matter and the anaerobic oxidation of aromatic hydrocarbons [28]. It is considered that Geobacter bacteria are the main bacteria in the current water environment and organic waste generation and can produce more electric energy than other bacteria [29,30]. The proportion of MFC-As is only 0.7%, which makes the power generation performance of the MFC-As weak. Anaerovorax can degrade the carbohydrates in the anode compartment [31,32]. The proportions of Petrimonas in the raw sludge and MFC-control were 0.02% and 0.2%, respectively, while the abundance in MFC-As was 2.49%, the arsenic in the anode chamber added to Petrimonas bacteria of the genus of growth and development. Petrimonas species is a kind of typical hydrogen to produce acetic acid bacteria genera [33], with dual functions of hydrogen production [34] and acetic acid production [35]. There is a symbiotic relationship with methanogens, which affects the efficiency of the MFC reactor. Furthermore, the relative abundance of Pseudomonas in the MFC-As anode chamber sample is 1.4%. The relative abundance in the control sample is only 0.14%. Heterotrophic arsenite oxidizing microorganisms were isolated from [36] Pseudomonas sp.HN-1 and Pseudomonas sp. HN-2. Sodium acetate was used as the source of cell matter and energy in the anode chamber, trivalent arsenic was used as an electron donor, and trivalent arsenic was oxidized to pentavalent arsenic.
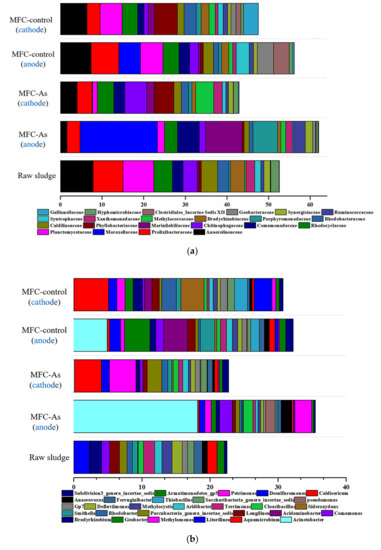
Figure 6.
Microbial community composition distribution of the samples at the family (a) and general (b) level.
In the cathode chamber, the functional microbial bacterium associated with the nitrogen-containing compound can be divided into four categories: nitrate-oxidizing bacteria (NOB), dissimilatory nitrate reduction to ammonium (DNRA), anaerobic ammonia oxidation (Anammox), and denitrification bacteria (DNB). As shown in Figure 7, DNB dominates the MFC cathode chamber in each of the various samples. This is consistent with expectations. With the acclimation and screening of the reactor, the relative abundance increased significantly. The MFC-control group is the highest in the cathode chamber microbial sample. After a period of domestication, DNRA has a growth trend in the microbial community, and the proportion of the MFC-control group is comparatively higher than that of MFC-As. DNRA has caused NH4+-N to accumulate in the MFC cathode chamber. The proportion of Anammox in the original sludge was the highest, and the proportion of Anammox in MFC-As was only 0.1%, which was relatively low in the MFC-control group. Anammox bacteria can directly convert NH4+-N, NO3−-N, or NO2−-N into N2, indicating that the relative abundance of Anammox affects the accumulation degree of NH4+-N in the cathode chamber. The content of NOB in the two reactors was low (≤0.1%) and negligible.
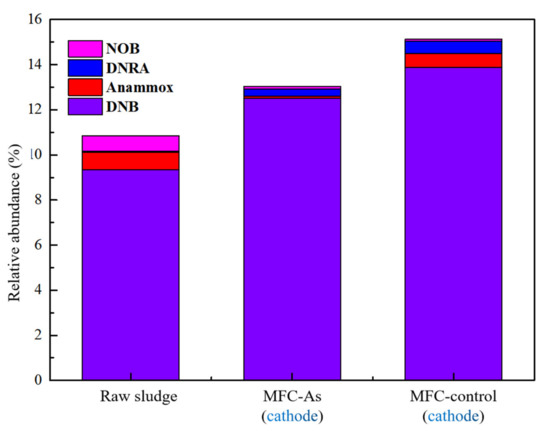
Figure 7.
Relative abundance of functional genera in microbial samples of the cathode chambers.
Based on the experimental results in this chapter and the analysis of the colony structure of the anode and cathode chambers, a theoretical MFC reactor for the degradation of trivalent arsenic and simultaneous removal of nitrate is proposed. It is speculated that the reaction mechanism in the reactor is shown in Figure 8. In addition to the use of acetate as the electron donor in the anode chamber, part of As(III) can also be used by microorganisms attached to the electrode as the electron acceptor donor is oxidized to As(V). Another part of the As(III) absorbed by suspended microbes in the reaction chamber combined with cellular material or the precipitation formation of stable arsenide [37] for As(III) weakened. Nitrate degradation in the cathode chamber is mainly through reduction reactions, including autotrophic denitrification and heterotrophic denitrification. At the same time, there are dissimilated nitrate reduction reactions and anaerobic ammonium oxidation reactions competing with denitrification reactions, and the content of nitrifying bacteria detected is very small and can be almost ignored.
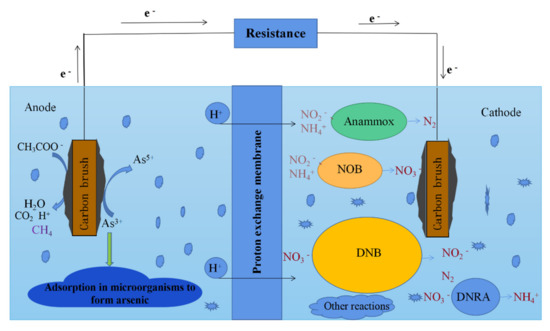
Figure 8.
Speculation on the reaction mechanism of simultaneous degradation of As(III) and nitrate by MFC.
4. Conclusions
The constructed two-chamber MFC for the simultaneous degradation of trivalent arsenic and nitrate has an average arsenic removal rate of 63.45% in the anode chamber during stable operation. In the cathode chamber, the degradation rate of NO3−-N was about 55.95%, and the maximum output voltage was 388 mV. The feasibility of the catalytic oxidation and nitrate degradation of arsenic trivalent in MFC, as well as synchronous electricity generation, was proved. The addition of arsenic in the anolyte inhibited the electrochemical performance of MFC. The proportion of Geobacter bacteria in MFC-As is only 0.7%, which makes the MFC-As have weak electrical performance. The abundance of Petrimonas in MFC-As was 2.49%. The addition of trivalent arsenic was beneficial to the growth and development of Petrimonas and affected the efficiency of the MFC reactor.
Author Contributions
Conceptualization, S.H. and J.W.; Methodology, J.C.; Writing—original draft preparation, J.G.; Writing—review and editing, J.G.; Supervision, J.C.; Project administration, S.H.; Funding acquisition, J.W. All authors have read and agreed to the published version of the manuscript.
Funding
This research was funded by the Natural Science Foundation of China (41372246) and Anhui Province Natural Science Foundation (1808085MD102).
Institutional Review Board Statement
The study did not require ethical approval.
Informed Consent Statement
Informed consent was obtained from all subjects involved in the study.
Data Availability Statement
The data presented in this study are available in article.
Acknowledgments
This research work was supported by the Natural Science Foundation of China (41372246), Anhui Province Natural Science Foundation (1808085MD102).
Conflicts of Interest
There’s no conflict of interest.
References
- Li, H.; Chen, W.X.; Wong, H.M. Arbuscular mycorrhizal fungi reduced the ratios of inorganic/organic arsenic in rice grains. Chemosphere 2016, 145, 224–230. [Google Scholar] [CrossRef]
- Jain, C.K.; Ali, I. Arsenic: Occurrence, toxicity and speciation techniques. Water Res. 2000, 34, 4304–4312. [Google Scholar] [CrossRef]
- Wei, Z.; Wang, W.-X.; Li, Z. Comparison of Bioavailability and Biotransformation of Inorganic and Organic Arsenic to Two Marine Fish. Environ. Sci. Technol. 2016, 50, 2413–2423. [Google Scholar] [CrossRef]
- Anetor, J.I.; Wanibuchi, H.; Fukushima, S. Arsenic exposure and its health effects and risk of cancer in developing countries: Micronutrients as host defence. Asian Pac. J. Cancer Prev. 2007, 8, 13–23. [Google Scholar]
- Islam, M.S.; Ahmed, M.K.; Mamun, H.-A.-M.; Eaton, D.W. Arsenic in the food chain and assessment of population health risks in Bangladesh. Environmentalist 2017, 37, 344–352. [Google Scholar] [CrossRef]
- Pokhrel, D.; Viraraghavan, T. Arsenic removal from an aqueous solution by a modified fungal biomass. Water Res. 2006, 40, 549–552. [Google Scholar] [CrossRef] [PubMed]
- Zhang, J.; Ding, T.; Zhang, Z.; Xu, L.; Zhang, C. Enhanced Adsorption of Trivalent Arsenic from Water by Functionalized Diatom Silica Shells. PLoS ONE 2015, 10, e0123395. [Google Scholar] [CrossRef] [PubMed]
- Masudhossain, S.; Anantharaman, M. Studies on bacterial growth and arsenic (III) biosorption using Bacillus subtilis. Chem. Biochem. Eng. Q. 2006, 20, 209–216. [Google Scholar] [CrossRef]
- Giri, A.K.; Patel, R.K.; Mahapatra, S.S.; Mishra, P.C. Biosorption of arsenic (III) from aqueous solution by living cells of Bacillus cereus. Environ. Sci. Pollut. Res. 2013, 20, 1281–1291. [Google Scholar] [CrossRef] [PubMed]
- Chandraprabha, M.N.; Natarajan, K.A. Mechanism of arsenic tolerance and bioremoval of arsenic by Acidithiobacilus ferrooxidans. J. Biochem. Technol. 2011, 3, 257–265. [Google Scholar]
- Gustave, W.; Yuan, Z.-F.; Ren, Y.-X.; Sekar, R.; Zhang, J.; Chen, Z. Arsenic alleviation in rice by using paddy soil microbial fuel cells. Plant Soil 2019, 441, 111–127. [Google Scholar] [CrossRef]
- Gustave, W.; Yuan, Z.-F.; Sekar, R.; Chang, H.-C.; Zhang, J.; Wells, M.; Ren, Y.-X.; Chen, Z. Arsenic mitigation in paddy soils by using microbial fuel cells. Environ. Pollut. 2018, 238, 647–655. [Google Scholar] [CrossRef]
- Gustave, W.; Yuan, Z.-F.; Sekar, R.; Ren, Y.-X.; Liu, J.-Y.; Zhang, J.; Chen, Z. Soil organic matter amount determines the behavior of iron and arsenic in paddy soil with microbial fuel cells. Chemosphere 2019, 237, 124459. [Google Scholar] [CrossRef]
- Abbas, S.Z.; Rafatullah, M. Recent advances in soil microbial fuel cells for soil contaminants remediation. Chemosphere 2021, 272, 129691. [Google Scholar] [CrossRef] [PubMed]
- Zhu, P.J.; Wang, J.; Zhang, T.P.; Chen, Z. Electricity generation and the river sediment remediation based on wetland plant-sediment microbial fuel cell systems. Chin. J. Environ. Eng. 2017, 11, 3891–3898. [Google Scholar] [CrossRef]
- Ge, Z.; Chen, X.; Huang, X.; Ren, Z.J. Capacitive deionization for nutrient recovery from wastewater with disinfection capability. Environ. Sci. Water Res. Technol. 2017, 4, 33–39. [Google Scholar] [CrossRef]
- Smeacetto, F.; Chrysanthou, A.; Salvo, M.; Zhang, Z.; Ferraris, M. Performance and testing of glass-ceramic sealant used to join anode-supported-electrolyte to Crofer22APU in planar solid oxide fuel cells. J. Power Sources 2009, 190, 402–407. [Google Scholar] [CrossRef]
- Zhang, L.B.; Ding, L.L.; Li, C.; Xu, K.; Ren, H. Effects of electrolyte total dissolved solids (TDS) on performance and anodic microbes of microbial fuel cells. Afr. J. Biotechnol. 2011, 10, 16909–16914. [Google Scholar] [CrossRef]
- Muyzer, G.; Dewaal, G.C.; Uitterlinden, A.G. Profiling of complex microbial populations by denaturing gradient gel electrophoresis analysis of polymerase chain reaction-amplified genes coding for 16S rRNA. Appl. Environ. Microbiol. 1993, 59, 695–700. [Google Scholar] [CrossRef]
- Daghio, M.; Vaiopoulou, E.; Patil, S.A.; Suárez-Suárez, A.; Head, I.M.; Franzetti, A.; Rabaey, K. Anodes Stimulate Anaerobic Toluene Degradation via Sulfur Cycling in Marine Sediments. Appl. Environ. Microbiol. 2015, 23, 297–307. [Google Scholar] [CrossRef]
- Wang, Q.; Garrity, G.M.; Tiedje, J.M.; Cole, J.R. Naïve Bayesian Classifier for Rapid Assignment of rRNA Sequences into the New Bacterial Taxonomy. Appl. Environ. Microbiol. 2007, 73, 5261–5267. [Google Scholar] [CrossRef] [PubMed]
- Schall, P.; Gossner, M.M.; Heinrichs, S.; Fischer, M.; Boch, S.; Prati, D.; Jung, K.; Baumgartner, V.; Blaser, S.; Böhm, S.; et al. The impact of even-aged and uneven-aged forest management on regional biodiversity of multiple taxa in European beech forests. J. Appl. Ecol. 2017, 55, 267–278. [Google Scholar] [CrossRef]
- Kong, D.; Liang, B.; Yun, H.; Cheng, H.; Ma, J.; Cui, M.; Wang, A.; Ren, N. Cathodic degradation of antibiotics: Characterization and pathway analysis. Water Res. 2015, 72, 281–292. [Google Scholar] [CrossRef]
- Wang, N.; Chen, Z.; Li, H.-B.; Su, J.-Q.; Zhao, F.; Zhu, Y.-G. Bacterial community composition at anodes of microbial fuel cells for paddy soils: The effects of soil properties. J. Soils Sediments 2015, 15, 926–936. [Google Scholar] [CrossRef]
- Kraková, L.; Šoltys, K.; Budiš, J.; Grivalský, T.; Ďuriš, F.; Pangallo, D.; Szemes, T. Investigation of bacterial and archaeal communities: Novel protocols using modern sequencing by Illumina MiSeq and traditional DGGE-cloning. Extrem. Life Extrem. Cond. 2016, 20, 795–808. [Google Scholar] [CrossRef] [PubMed]
- Sun, W.M.; Xiao, E.Z.; Xiao, T.F.; Krumins, V.; Wang, Q.; Häggblom, M.; Dong, Y.; Tang, S.; Hu, M.; Li, B.; et al. Response of Soil Microbial Communities to Elevated Antimony and Arsenic Contamination Indicates the Relationship between the Innate Microbiota and Contaminant Fractions. Environ. Sci. Technol. 2017, 51, 9165–9175. [Google Scholar] [CrossRef] [PubMed]
- Cai, L.; Liu, G.; Rensing, C.; Wang, G. Genes involved in arsenic transformation and resistance associated with different levels of arsenic-contaminated soils. BMC Microbiol. 2009, 9, 4. [Google Scholar] [CrossRef]
- Mahadevan, R.; Palsson, B.; Lovley, D.R. In situ to in silico and back: Elucidating the physiology and ecology of Geobacter spp. using genome-scale modelling. Nat. Rev. Microbiol. 2010, 9, 39–50. [Google Scholar] [CrossRef] [PubMed]
- Xu, F.; Cao, F.-Q.; Kong, Q.; Zhou, L.-L.; Yuan, Q.; Zhu, Y.-J.; Wang, Q.; Du, Y.-D.; Wang, Z.-D. Electricity production and evolution of microbial community in the constructed wetland-microbial fuel cell. Chem. Eng. J. 2018, 339, 479–486. [Google Scholar] [CrossRef]
- Yoshida, N.; Miyata, Y.; Doi, K.; Goto, Y.; Nagao, Y.; Tero, R.; Hiraishi, A. Graphene oxide-dependent growth and self-aggregation into a hydrogel complex of exoelectrogenic bacteria. Sci. Rep. 2016, 6, 21867. [Google Scholar] [CrossRef]
- Matthies, C.; Evers, S.; Ludwig, W.; Schink, B. Anaerovorax odorimutans gen. nov., sp. nov., a putrescine-fermenting, strictly anaerobic bacterium. Int. J. Syst. Evol. Microbiol. 2000, 50, 1591–1594. [Google Scholar] [CrossRef]
- Zhu, Y.; Xu, J.; Cao, X.; Cheng, Y. Characterization of functional microbial communities involved in different transformation stages in a full-scale printing and dyeing wastewater treatment plant. Biochem. Eng. J. 2018, 137, 162–171. [Google Scholar] [CrossRef]
- Zeng, T.T.; Miu, W.; Xie, S.B.; Rong, L.; Jiang, X. Analysis of bacterial community in anaerobia granular sludge for citric acid wastewater treatment. J. Harbin Inst. Technol. 2016, 48, 115–120. [Google Scholar] [CrossRef]
- Rui, S.; Xing, D.; Jia, J.; Liu, Q.; Zhou, A.; Bai, S.; Ren, N. Optimization of high-solid waste activated sludge concentration for hydrogen production in microbial electrolysis cells and microbial community diversity analysis. Int. J. Hydrogen Energy 2014, 39, 19912–19920. [Google Scholar] [CrossRef]
- Dong, L.; Cao, G.; Tian, Y.; Wu, J.; Zhou, C.; Liu, B.; Zhao, L.; Fan, J.; Ren, N. Improvement of biogas production in plug flow reactor using biogas slurry pretreated cornstalk. Bioresour. Technol. Rep. 2020, 9, 100378. [Google Scholar] [CrossRef]
- Zhang, Z.N. Oxidation and Fate of Arsenic under the Interaction of Soil Arsenic-Oxidizing Bacteria and Iron Oxide. Ph.D. Thesis, University of Science and Technology of China, Hefei, China, 2016. Available online: http://d.wanfangdata.com.cn/thesis/Y3189874 (accessed on 1 May 2016).
- Ji, P.; Tang, R.; He, P.; Yuan, S.; Wang, W.; Hu, Z.-H. Characterization of arsenic species in the anaerobic granular sludge treating roxarsone-contaminated wastewater. Chem. Eng. J. 2017, 327, 162–168. [Google Scholar] [CrossRef]


Publisher’s Note: MDPI stays neutral with regard to jurisdictional claims in published maps and institutional affiliations. |
© 2021 by the authors. Licensee MDPI, Basel, Switzerland. This article is an open access article distributed under the terms and conditions of the Creative Commons Attribution (CC BY) license (https://creativecommons.org/licenses/by/4.0/).