Article

Machine Learning-Based Energy System Model for Tissue Paper Machines

State Key Laboratory of Pulp and Paper Engineering, South China University of Technology, Guangzhou 510640, China
*
Author to whom correspondence should be addressed.
Processes 2021, 9(4), 655; https://doi.org/10.3390/pr9040655
Submission received: 15 March 2021 / Revised: 1 April 2021 / Accepted: 6 April 2021 / Published: 9 April 2021
(This article belongs to the Special Issue Energy Conservation and Emission Reduction in Process Industry)

Abstract

:
With the global energy crisis and environmental pollution intensifying, tissue papermaking enterprises urgently need to save energy. The energy consumption model is essential for the energy saving of tissue paper machines. The energy consumption of tissue paper machine is very complicated, and the workload and difficulty of using the mechanism model to establish the energy consumption model of tissue paper machine are very large. Therefore, this article aims to build an empirical energy consumption model for tissue paper machines. The energy consumption of this model includes electricity consumption and steam consumption. Since the process parameters have a great influence on the energy consumption of the tissue paper machines, this study uses three methods: linear regression, artificial neural network and extreme gradient boosting tree to establish the relationship between process parameters and power consumption, and process parameters and steam consumption. Then, the best power consumption model and the best steam consumption model are selected from the models established by linear regression, artificial neural network and the extreme gradient boosting tree. Further, they are combined into the energy consumption model of the tissue paper machine. Finally, the models established by the three methods are evaluated. The experimental results show that using the empirical model for tissue paper machine energy consumption modeling is feasible. The result also indicates that the power consumption model and steam consumption model established by the extreme gradient boosting tree are better than the models established by linear regression and artificial neural network. The experimental results show that the power consumption model and steam consumption model established by the extreme gradient boosting tree are better than the models established by linear regression and artificial neural network. The mean absolute percentage error of the electricity consumption model and the steam consumption model built by the extreme gradient boosting tree is approximately 2.72 and 1.87, respectively. The root mean square errors of these two models are about 4.74 and 0.03, respectively. The result also indicates that using the empirical model for tissue paper machine energy consumption modeling is feasible, and the extreme gradient boosting tree is an efficient method for modeling energy consumption of tissue paper machines.

1. Introduction

Industry is one of the largest energy consumption end-use sectors, and its energy consumption was 237.3 quadrillion Btu (British thermal unit, A British thermal unit (Btu) is a measure of the heat content of fuels or energy sources. It is the quantity of heat required to raise the temperature of one pound of liquid water by 1 degree Fahrenheit at the temperature that water has its greatest density (approximately 39 degrees Fahrenheit).) in 2015, which will reach to 299.0 quadrillion Btu in 2050. The use of energy will directly or indirectly generate greenhouse gases, such as carbon dioxide (CO2) and nitrogen dioxide (NO2). The worldwide energy-related carbon dioxide emission was 33.9018 billion metric tons in 2015 and will reach 42.7714 billion metric tons in 2050 (the Energy Information Administration, 2017) [1]. With the crisis of global energy and intensification of environmental pollution, the industry sectors are committed to improving energy efficiencies, especially for energy-intensive manufacturing. The pulp and paper industry is one of the energy-intensive industries. According to the Energy Information Administration (EIA), the pulp and paper industry accounted for 7% of the total industrial energy consumption in 2012 (EIA, 2016) [2]. As a result, it is urgent to improve the energy efficiency of the pulp and paper industry.
The energy consumption model of tissue paper machines is the key to energy efficiency improvement of tissue paper mills. Tissue paper making is a complex production process with complex energy consumption. There are two kinds of direct energy, namely electricity and steam, used in tissue paper machines, respectively. The electricity consumption and steam consumption of tissue paper machines are influenced by numerous process parameters, such as reel cylinder speed, dryer speed and suction cylinder speed. According to the literature, energy consumption models can be grouped into four categories, namely theoretical models, empirical models, discrete event-based models and hybrid models [3]. The theoretical model aims at modeling an accurate mathematical model. However, developing a valid theoretical energy consumption model remains a highly complex task. The empirical models tend to model energy consumption by employing the regression method.
This paper studies the empirical energy consumption modeling of tissue paper machines, and the energy consumption model consists of the electricity consumption model and the steam consumption model. Three regression methods, namely linear regression (LR), the artificial neural network (ANN) and the extreme gradient boosting tree (XGBOOST), are adopted for energy consumption modeling. First, this paper selects some of the process parameters that affect the energy consumption of tissue paper machines. Then, the electricity consumption model and the steam consumption model are built by LR, the ANN and the XGBOOST based on the above selected process parameters. Finally, the best electricity consumption model and the best steam consumption model are selected from the models built by LR, the ANN and the XGBOOST, and combined into the energy consumption model of tissue paper machines.
This paper is mainly organized as follows. In Section 2, a literature review on energy consumption modeling is presented. In Section 3, the tissue paper making system is introduced, and the production process and energy use of tissue paper machines are stated. In Section 4, the electricity consumption model and the steam consumption model of tissue paper machines are built by LR, the ANN and the XGBOOST. In Section 5, a case study based on the real tissue paper mill is simulated to demonstrate the feasibility of the introduced energy consumption model. Finally, a conclusion is drawn in Section 6.

2. Literature Review

A theoretical model is a powerful tool for modeling energy consumption. However, it cannot be easily applied to the actual production environment. In the past decades, few theoretical models have been proposed. Munoz and Sheng proposed a theoretical energy consumption model for machining systems which may be regarded as the pioneering work [4]. Balogun and Mativenga researched the modeling of direct energy requirements in mechanical machining processes, and a new mathematical model and logic were also developed for predicting direct electrical energy requirements in machining toolpaths in their study [5]. Altıntaş et al. proposed a prediction model for estimating theoretical energy consumption involved in the milling of prismatic parts [6]. Furthermore, response surface methodology was utilized to optimize energy consumption. Asrai et al. considered the milling machine as a thermodynamic system [7]. Based on the mechanisms of the significant energy conversion processes within the system, a novel mechanistic model is proposed for the consumption of energy in milling processes in their study.
In recent years, an increasing number of researchers focused on empirical models. Kara and Li proposed an empirical model to characterize the relationship between energy consumption and process variables for material removal processes, and the proposed models were validated in eight different machine tools and in the environment of both dry and wet cutting [8]. In fact, the process parameters (such as cutting speed, the rake angle, nose radius and edge radius) exert a great influence on the cutting energy. Ma et al. analyzed the relationship between these process parameters and cutting energy through numerical experiments using finite element simulation [9]. Material-removal power associates with many process parameters, and the flank wear of the tool is included. Yoon et al. proposed an empirical model for flank wear of the tool and material-removal power using response surface methodology [10]. With the constructed model, the overall energy consumption of the machine tool and the tool-wear state could be estimated more precisely in accordance with various process parameters. Additionally, Sealy et al. also analyzed the relationship between tool wear and energy consumption in hard milling [11]. Besides, other parameters (e.g., depth of cut, cutting speed, feed per tooth) were considered in their energy consumption model. In another study that considered tool wear, Shi et al. proposed a novel energy consumption model for the milling process [12]. Zhou et al. considered the spindle rotation speed as the process parameter of the material removal power and proposed an improved cutting power model of machine tools in the milling process [13]. The proposed model can predict a milling machine’s cutting power more accurately. The empirical model has been extensively used since it was proposed, and now the research on this field is so popular [14,15,16,17].
Discrete event-based models provide a comprehensive approach for modeling the total energy consumption in the production process. Dietmair et al. proposed a generic energy consumption model for manufacturing, and also modeled the energy consumption of machines and plants based on a statistical discrete event formulation [18]. Larek et al. believed that the simulation can provide a feasible way of modeling energy consumption, and thus they proposed a simulation method for modeling energy consumption of machining processes based on the discrete-event simulation [19].
There is not much research on hybrid models. Zhou et al. divided the energy of the machining system into the energy consumption of machining, the energy consumption of transportation and the energy consumption of storage [20]. Then, the energy consumption of each part is modeled and combined into an energy consumption model of the machining system. The case study shows that the error of the calculated energy consumption is 7.839%. Peng and Xu proposed a hybrid energy consumption model through combining high-level and low-level models [3]. Furthermore, integrated, standardized and Standard for the Exchange of Product model data-Numerical Control (STEP-NC) compliant energy data models were put forward for energy analysis. Zhang et al. proposed a tissue paper drying process energy system optimization model based on a process simulation model for the drying process of papermaking [21].
The above literature mainly concentrated on the energy consumption modeling of the machining system, and there are few types of research on the energy consumption modeling of the papermaking industry, where some researches on the energy consumption modeling of the dryer section exist [22,23,24,25]. The research on energy consumption modeling of paper machines is extremely scarce. Wu proposed an ANN model of energy consumption in the newspaper making process [26]. However, the tissue paper machine is different from the newspaper machine, and the energy consumption model of the newspaper machine is unsuitable for the tissue paper machine. Consequently, an empirical energy consumption model of tissue paper machines is proposed in this study.

3. Tissue Paper Machine Description

Figure 1 shows the production process of tissue paper mills, where the dotted frame represents the part of the paper machine. As the comprehensive large machinery, the paper machine is featured with complex structure, fast speed and high precision. In general, the paper machine mainly consists of six parts, namely the approach flow system, the forming sector, the press section, the dryer section, the calendar section and the winding section. The components of a paper machine differ according to the type of product. For example, the calendar section is not included in the tissue paper machine, but all of the components mentioned above are included in the packaging paper machine. The tissue paper machine can be mainly divided into two classes, respectively, the cylinder paper machine and the crescent former paper machine, according to the forming sector. Our research is based on the cylinder paper machine, a typical cylinder paper machine, as shown in Figure 2. The motion trail of paper is presented as the red line in Figure 2, and the paper conveying direction is shown as the red arrows.
As shown in Figure 2, the cylinder paper machine mainly consists of five parts, namely the approach flow system, the forming sector, the press section, the dryer section and the winding section. The first part of the cylinder papermaking system is the approach flow system. The headbox is the most important machine of the approach flow system, and the role of the headbox is dispensing the stock on the moving wire. The jet/wire speed ratio is closely related to the quality of paper, such as bulk, softness and tensile properties, to some extent. The energy consumption of the headbox accounts for a small percentage of energy consumption of the paper machine. When the paper machine is working normally, the energy consumed by the headbox is basically unchanged, which exerts little influence on the overall energy consumption of the paper machine. The second part of the cylinder paper machine is the forming sector and mainly contains suction cylinders and forming rolls. After the stock is dispensed on the moving wire, the forming roll exerts pressure on the moving wire to remove part of the water from the paper so as to ensure the smooth forming of the paper. Then, the suction cylinder further dehydrates the paper through the vacuum suction chamber, and finally, the paper is formed. The suction cylinder is the most important energy consumption equipment in the paper forming process. The water removed from the forming sector is generally divided into two parts, which are the water removed by the centrifugal force generated by the rotation of the vacuum cage and the water absorbed by the vacuum chamber. Thus, the energy consumption of the forming sector is generally classified into two parts, which are the energy consumption generated by the driving motor and the energy consumption generated by the vacuum chamber. In the press section, the pressure rolls are the main equipment, and the role of the pressure roll is dehydrating the paper and modifying the surface of the paper. The energy consumption of the press section consists of the energy consumption generated by the driving motor and the energy consumption generated by the vacuum chamber. As the most energy-consuming unit of the tissue paper machine, the dryer section’s most important function aims to ensure the dryness of the paper. Electricity and steam are the primary forms of energy consumption of the dryer section, and electricity consumption is caused by the driving motor. There are two kinds of steam, namely Steam_1 (at a temperature of 200 °C and a pressure of 1 MPa) and Steam_2 (at a temperature of 225 °C and a pressure of 2 MPa), used in the studied paper mill. Energy consumption in the dryer section may vary with the parameters of devices in the dryer section. The adjustable parameters of devices that can influence the energy cost of the dryer section include frequency of the air exhauster, temperature of the supply air on the wet side, frequency of the air feeder on the wet side, temperature of the supply air on the dry side, frequency of the air feeder on the dry side and pressure of the dryer. The winding section is the last unit of the tissue paper machine and its role is to wind the paper into reel paper. The energy consumption of the winding section is generated by the driving motor. Besides, there are many motor devices which can be used to drive the felt operation. Meanwhile, the energy consumption of these motor devices cannot be ignored.

4. Energy System Model

In this section, an empirical energy consumption model for tissue paper machines is built. This study tends to build an empirical model for the energy consumption of tissue paper machines based on process parameters. The energy model of tissue paper machines can be divided into two parts, namely the electricity consumption model and the steam consumption model. In the present study, the relationship between process parameters and the energy consumption is analyzed by employing the regression method, so as to establish the empirical energy consumption model. Three regression methods are used to build the electricity consumption model and the steam consumption model. The linear regression (LR) method is selected as the first method of setting up the electricity consumption model and the steam consumption model due to its simplicity. The artificial neural network (ANN) is one of the most popular methods for regression problems and has been proven to be effective for modeling energy consumption. In this case, the ANN is chosen as the second method of building the two models mentioned above. In recent years, the extreme gradient boosting tree (XGBOOST) has been used by an increasing number of researchers to solve regression problems and classification problems. Then, good results have been achieved. Thus, the XGBOOST method is selected as the third method. Initially, three electricity consumption models and three steam consumption models are built with LR, the ANN and the XGBOOST respectively, based on training data. Then, electricity consumption models and steam consumption models are evaluated by testing data for selecting the best electricity consumption model and the best steam consumption model and combining them into the energy consumption model.
Two different datasets are used to construct the power consumption model and the steam consumption model. The datasets come from a tissue paper enterprise in Guangdong province. Data were sampled at 10-minute intervals and outliers were removed using the 3 σ principle. Two different datasets are used to build the electricity consumption model and the steam consumption model. Dataset_1 is employed to build the electricity consumption model, and eight process parameters (independent variables) are used to build the electricity consumption model. Besides, the details of eight process parameters are shown in Table 1. Dataset_1 contains 13,647 samples, and 80% of them are split as training data to build the electricity consumption model, while the others are testing data for evaluating the model. Dataset_2 is adopted to build the steam consumption model, and eleven process parameters (independent variables) are used to build the steam consumption model. Additionally, the details of the eleven process parameters are shown in Table 2. Dataset_2 contains 1614 samples, and 80% of them are split as training data to build the steam consumption model, while the others are testing data for evaluating the model. For the steam consumption model, our study takes Steam_2 as a case study, and the model of Steam_1 is similar to that of Steam_2. The whole energy modeling is carried out by applying the Python programming language and the scikit-learn package (a popular machine learning package for the python) in a personal computer with Intel Pentium (R), 8 GB RAM, 2.39 GHz frequency and the Windows 10 operating system.

4.1. Regression Model

On the premise of ensuring the accuracy of the model, a simple method should be adopted to establish the energy consumption model. Undoubtedly, the linear regression is one of the simplest methods for energy consumption modeling, and is a kind of regression analysis, which uses the least square function called the linear regression equation to model the relationship between one or more independent variables and dependent variables. The electricity consumption model and the steam consumption model can be formulated as Equations (1) and (2):
E c = b 1 + α 1 X 1 + α 2 X 2 + α 3 X 3 + α 4 X 4 + α 5 X 5 + α 6 X 6 + α 7 X 7 + α 8 X 8
S c = b 2 + α 9 X 9 + α 10 X 10 + α 11 X 11 + α 12 X 12 + α 13 X 13 + α 14 X 14 + α 15 X 15 + α 16 X 16 + α 17 X 17 + α 18 X 18 + α 19 X 19
where E c represents energy consumption, b 1 is the intercept of the electricity consumption model, α 1 , α 2 , , α 8 are the coefficients of the electricity consumption model, S c represents steam consumption, b 2 is the intercept of the steam consumption model, while α 9 , α 10 , , α 19 are the coefficients of the steam consumption model. The intercept and coefficients can be calculated by the least squares method, and the values of the intercept and coefficients are listed in Table 3.

4.2. Artificial Neural Network Model

The artificial neural network (ANN) is a popular machine learning method, which can express linear, nonlinear or other complex systems. Compared with the linear regression method, the artificial neural network has a more complex structure. However, the artificial neural network is more powerful than linear regression, especially for solving complex regression problems. A typical artificial neural network is mainly composed of the input layer, the hidden layer and the output layer. The detailed principle of the ANN algorithm is presented in Appendix A.
The performance of the artificial neural network is influenced by the structure and the parameters of the artificial neural network. The structure of the artificial neural network mainly includes the number of layers (nlayers), the number of neurons of the input layer (input_layer_sizes), the number of neurons of the output layer (output_layer_sizes) and the number of neurons of each hidden layer (hidden_layer_sizes). The parameters of the artificial neural network mainly include the learning rate (learning_rate), the activation function for the hidden layer (hidden_activation) and the output layer (output_activation), the solver for weight optimization (solver) and the criteria for stop iteration.
The input_layer_sizes and output_layer_sizes depend on the regression problem, and the input_layer_sizes for the electricity consumption model and the steam consumption model are eight and eleven, while the output_layer_sizes for these two models is one. In general, the more hidden layers the artificial neural network has, the more powerful the artificial neural network is. However, with the increasing number of hidden layers, the complexity of the artificial neural network will increase rapidly. In fact, the artificial neural network with three layers has enough power to handle a complex regression problem. Thus, our study uses an artificial neural network with three-layer (one hidden layer) structure for electricity consumption and steam consumption modeling. The value of hidden_layer_sizes seriously affects the performance of the model, and fewer neurons may lead to model underfitting, while too many neurons may lead to model overfitting. There are no criteria for deciding the hidden_layer_sizes. This study firstly determines the approximate range by trial and error and then finds the best hidden_layer_sizes by adopting the grid search method and 10-fold cross-validation. The search range of the hidden_layer_sizes for the electricity consumption model and the steam consumption model is [5:5:75] and [3:1:20], respectively.
The learning_rate influences the convergence rate of the model, and the significantly low learning_rate leads to the model that is difficult to converge, while the extremely high learning_rate will lead to the model that cannot reach the optimal. The grid search method and 10-fold cross-validation are used to choose the best learning_rate. The search range of the learning_rate for the electricity consumption model and the steam consumption model is [0.01:0.01:0.2] and [0.01:0.01:0.2], accordingly. As the role of the activation function means the artificial neural network has the ability to solve the non-linear regression problem, this study uses the hyperbolic tan function as the hidden layer activation function and the linear function as the output layer activation function. There are some common solvers for weight optimization, and the stochastic gradient-based optimizer proposed by Diederik and Ba is also employed [27]. The criterion of the stop iteration indicator is how to end the iteration of the artificial neural network, and two criteria are used in this study. For one thing, the artificial neural network will stop after the maximum number of iterations (Max_iterations). For another, the artificial neural network will stop when the loss or score is not improved by at least tol for n_iter_no_change consecutive iterations (tol refers to the tolerance for the optimization, and the n_iter_no_change refers to the maximum number of epochs for failing to meet tol improvement). Besides, L2 regularization (alpha) is used to prevent model overfitting. The parameters of the electricity consumption model and the steam consumption model are shown in Table 4. The training error curves of the electricity consumption model and the steam consumption model are presented in Figure 3 and Figure 4, respectively. Then, it can be seen that the training errors of the electricity consumption model and the steam consumption model gradually converge after a certain number of iterations.

4.3. Extreme Gradient Boosting Tree Model

The gradient boosted regression tree (GBRT) is an ensemble machine learning method that is extensively widely used by data scientists. The detailed principle of the GBRT algorithm is shown in Appendix B. The extreme gradient boosting tree (XGBOOST) is based on the GBRT. Compared with the traditional GBRT, the XGBOOST has many advantages, as shown below:
  • The traditional GBDT takes the classification and regression tree (CART) as the base classifier, and the XGBOOST also supports the linear classifier.
  • The traditional GBDT only uses the first derivative information for optimization, while the XGBOOST expands the cost function by the second-order Taylor expansion, with both the first and second derivatives for optimization.
  • The XGBOOST adds regular terms to the cost function for controlling the complexity of the model.
  • The XGBOOST uses column subsampling to prevent overfitting.
  • For samples with missing feature values, the XGBOOST can automatically learn its split direction.
  • The XGBOOST supports parallel computing.
  • A parallel approximate histogram algorithm is used to generate candidate segmentation points efficiently.
  • The shrinkage strategy was adopted to enhance the learning ability of the model.
The XGBOOST is a highly complex method that can learn various irregular features of data. It is simple to use XGBOOST to build a model. However, it is challenging to set up a high-accuracy XGBOOST model since many parameters have to be set. On the whole, the parameters of the XGBOOST can be divided into three parts, which are general parameters, booster parameters and learning task parameters. This study only adjusts the important parameters and sets other parameters as the default value. The base classifiers (booster) are the main parameters of general parameters and can be chosen from the tree model-based booster and the linear model-based booster. Booster parameters mainly include the learning rate (learning_rate), the maximum depth of each tree (max_depth), the minimum sum of instance weight needed in a child (min_child_weight), the minimum loss reduction required to make a further partition on a leaf node of the tree (gamma), the L1 regularization term on weights (reg_alpha) and the L2 regularization term on weights (reg_lambda). The learning task parameters mainly include the number of boosted trees for fitting (n_estimators). In general, the tree model-based booster is the best booster for the XGBOOST. In this case, the tree model-based booster is selected as the XGBOOST booster in this study. The learning_rate influences the convergence rate of the model. The too-low learning_rate leads to the model that is difficult to converge, while the too-high learning_rate will lead to the model that cannot reach the optimal. The grid search method and 10-fold cross-validation are used to choose the best learning_rate. The search range of the learning_rate for the electricity consumption model and the steam consumption model is [0.01:0.01:0.3] and [0.01:0.01:0.3], accordingly. The max_depth controls the maximum depth of trees. The larger the parameter is, the easier the overfitting is. The grid search method and 10-fold cross-validation are also adopted to choose the best max_depth. The search range of the max_depth for the two models mentioned above is [3:1:10] and [3:1:10], respectively. The min_child_weight controls the minimum value of the sum of the second derivative in the leaf nodes. Then, the smaller the parameter is, the easier the overfitting is. The grid search method and 10-fold cross-validation are used to choose the best min_child_weight. The search range of the min_child_weight for the electricity consumption model and the steam consumption model is [1:1:6] and [1:1:6], respectively. The gamma is used to control the further partition on a leaf node of the tree. The grid search method and 10-fold cross-validation are for choosing the best gamma. The search range of the gamma for the two models is [0:0.1:1] and [0:0.1:1], accordingly. The reg_alpha and reg_lambda are used to prevent the overfitting of the model. The grid search method and 10-fold cross-validation are used to choose the best reg_alpha and the best reg_lambda. The search range of the reg_alpha for the electricity consumption model and the steam consumption model is [0.001 0.01 0.1 1 10 100] and [0.00001 0.0001 0.001 0.01 0.1 1], separately. The search range of the reg_lambda for the two models mentioned above is [0.001 0.01 0.1 1 10 100] and [50:10:150], accordingly. The n_estimators controls the complexity of the model. The larger the parameter is, the more complex the model is and the easier the overfitting is. The grid search method and 10-fold cross-validation are adapted to select the best n_estimators. The search range of the n_estimators for the electricity consumption model and the steam consumption model is [1:1:1000] and [1:1:1000], separately.
The grid search method and cross-validation are simple and efficient parameter selection methods. However, as the search parameters increase, the time required for grid search and cross-validation will increase rapidly. In this study, to reduce the time required for parameter selection, we divided the parameters into three groups and adopted the grid search method and cross-validation for each group to find the best parameters. The first group contains the n_estimators, the learning_rate and the max_depth. The second group includes the min_child_weight and the gamma, while the third group involves the reg_alpha and the reg_lambda. Firstly, the best n_estimators, learning_rate and max_depth are found with the grid search method and 10-fold cross-validation. Then, the n_estimators, learning_rate and max_depth are set to the best value, and the best min_child_weight and the best gamma are found with the grid search method and 10-fold cross-validation. Finally, the n_estimators, learning_rate, max_depth, min_child_weight and gamma are set to the best value, and the best reg_alpha and the best reg_lambda are found by adopting the grid search method and 10-fold cross-validation. The parameters for the electricity consumption model and the steam consumption model are listed in Table 5.

5. Case Study

5.1. Evaluation Methods

In the current work, two indicators, namely root mean square error (RMSE) and mean absolute percentage error (MAPE), are employed to evaluate the performance of the models. The RMSE and MAPE formulae are shown as follows:
R M S E = i = 1 n ( y y ^ ) 2 n
M A P E = 100 n i = 1 n | y y ^ | y
where y is the real value, y ^ is the predicted value and n is the number of samples of testing data. RMSE and MAPE are the two most commonly used methods for evaluating the performance of regression models. RMSE is the square root of the squared deviation between the predicted value and the real value and the ratio of the number of samples. The lower the RMSE value is, the higher the precision of the model is. MAPE not only considers the error between the predicted value and the real value but also involves the proportion between the error and the real value. The lower the MAPE value is, the higher the accuracy of the model will be.

5.2. Results and Discussion

The RMSE and MAPE of these three electricity consumption models are shown in Table 6, while the RMSE and MAPE of the three steam consumption models are listed in Table 7. From Table 6 and Table 7, it can be seen that the XGBOOST model has the lowest value of RMSE and MAPE, and the value of RMSE and MAPE of the ANN model is lower than that of the LR model. Thus, the XGBOOST is the best method among the three methods for building the electricity consumption model and the steam consumption model for tissue paper machines, while LR is the worst method among the three methods for building the electricity consumption model and the steam consumption model for tissue paper machines because the relationship between some process parameters and electricity consumption or steam consumption is not linear, while the LR method has poor ability to solve the non-linear regression problem.
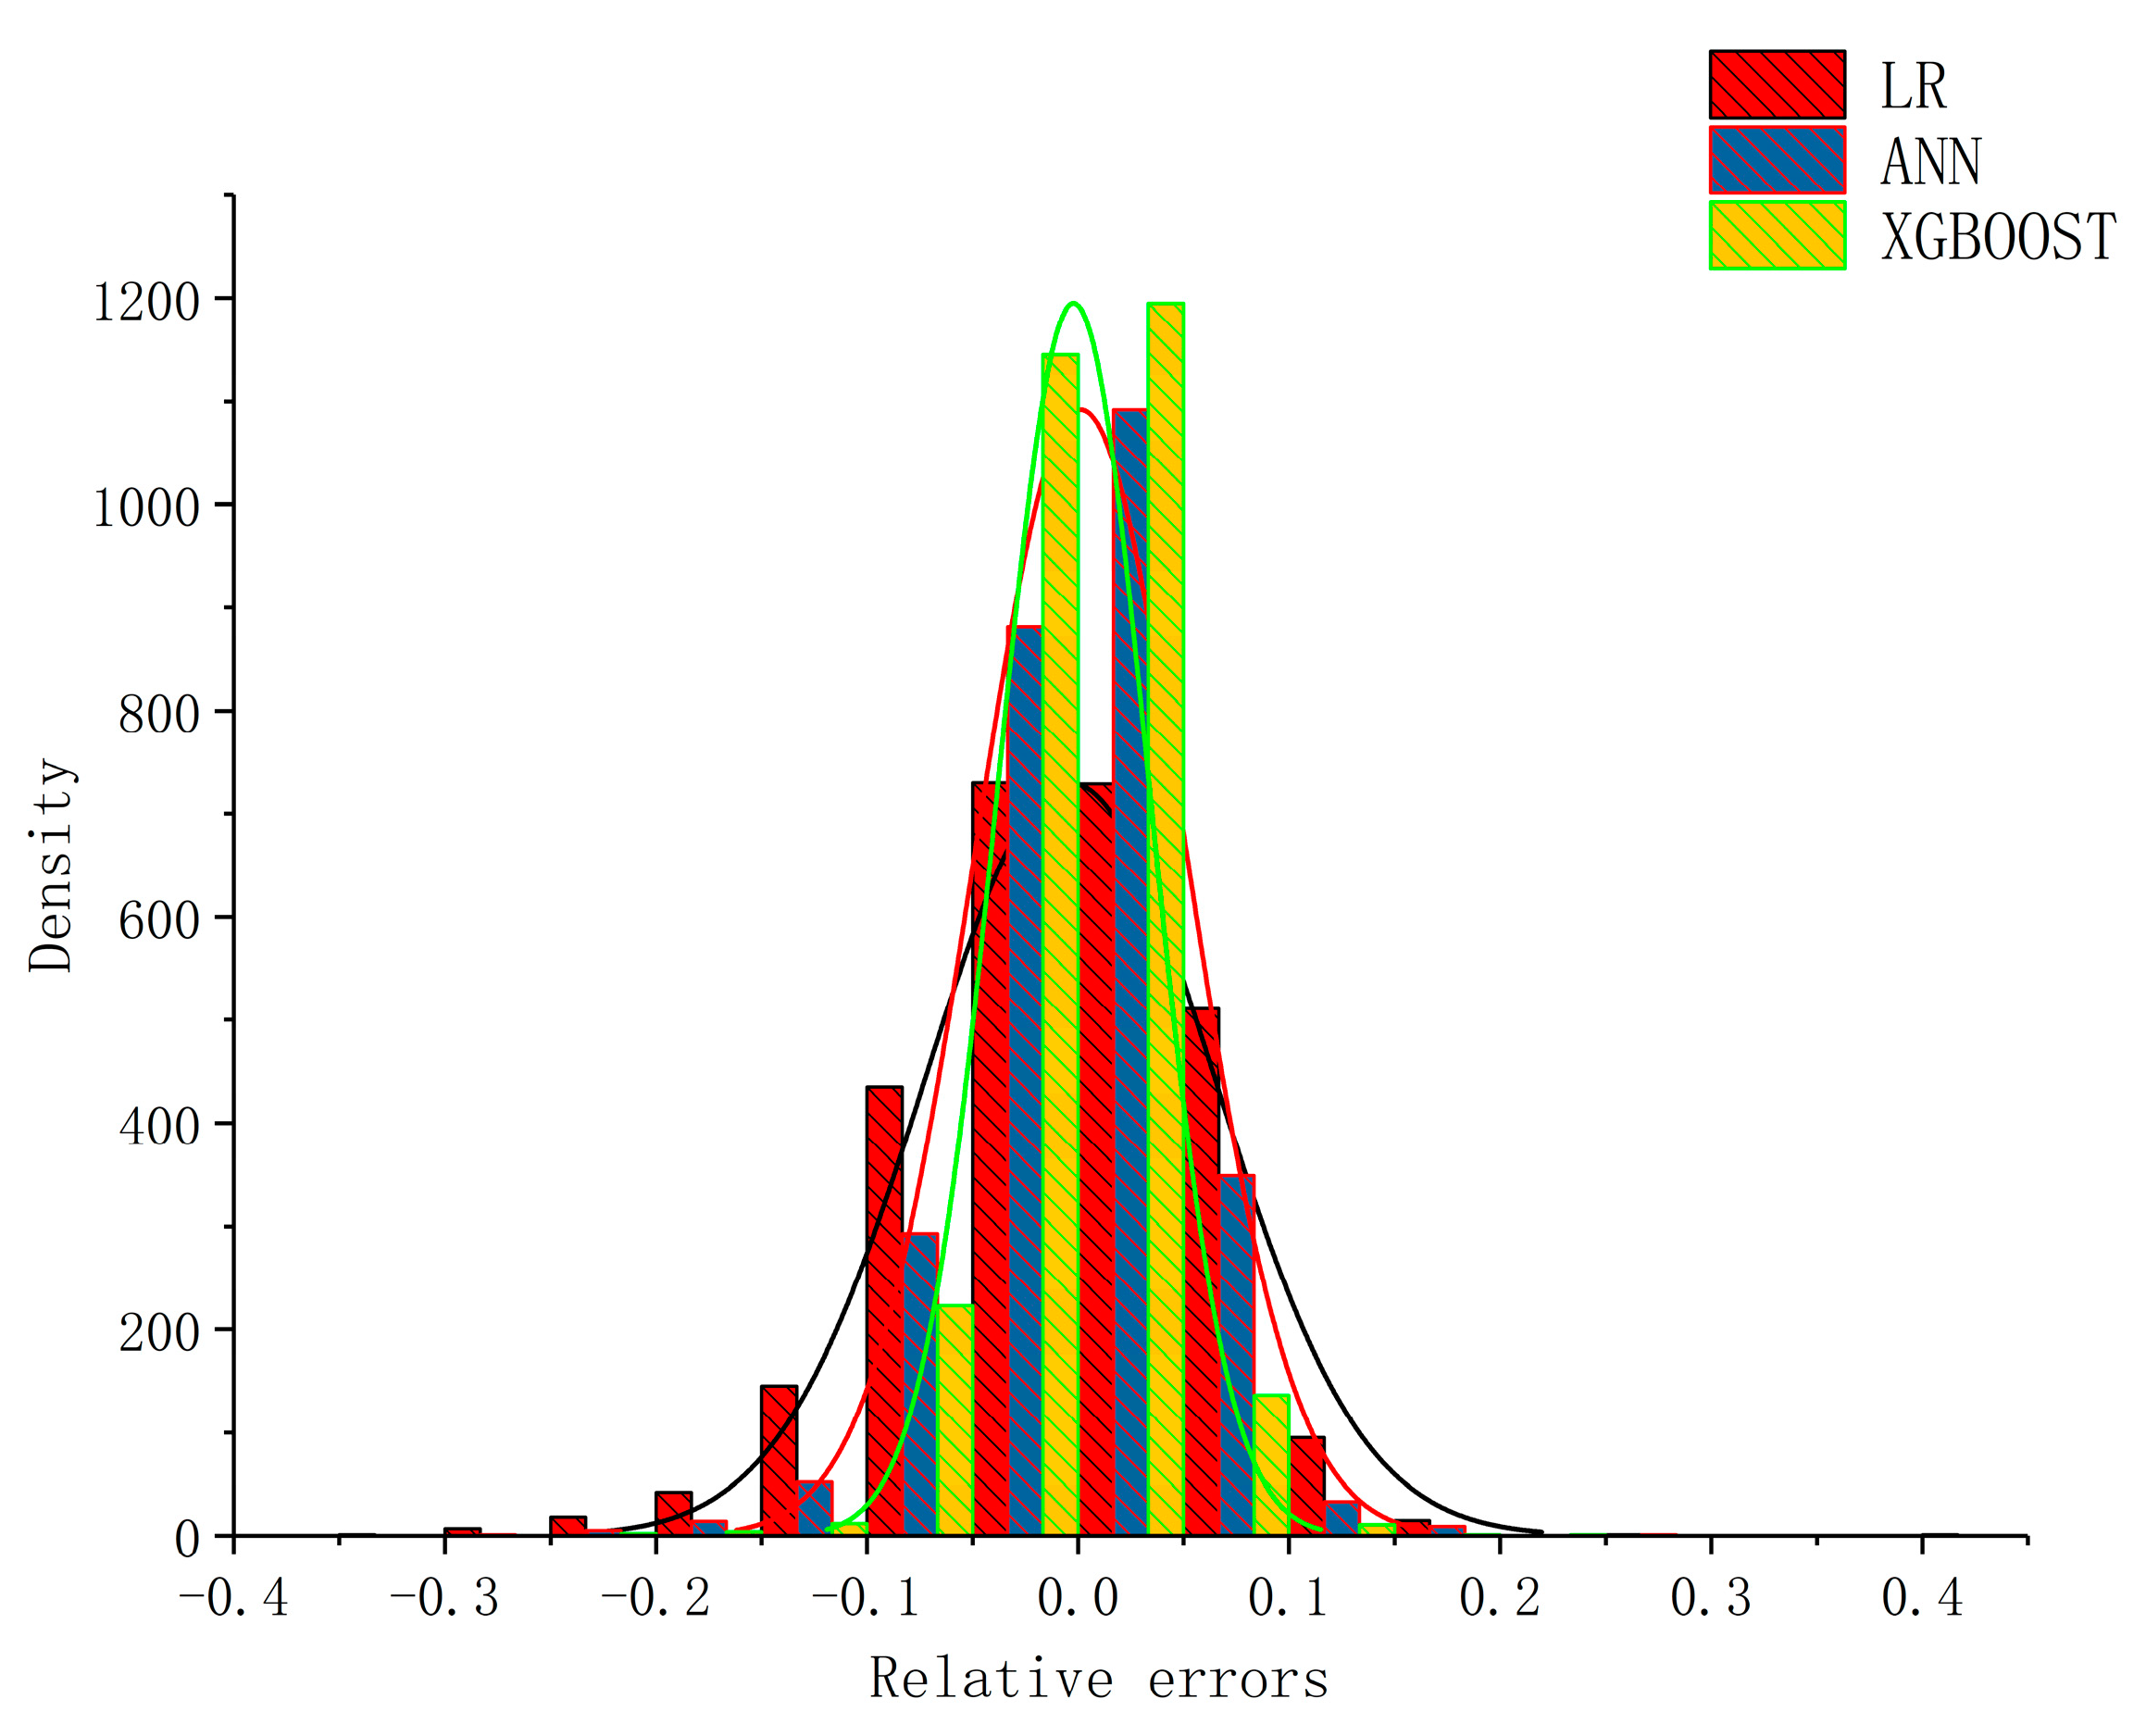
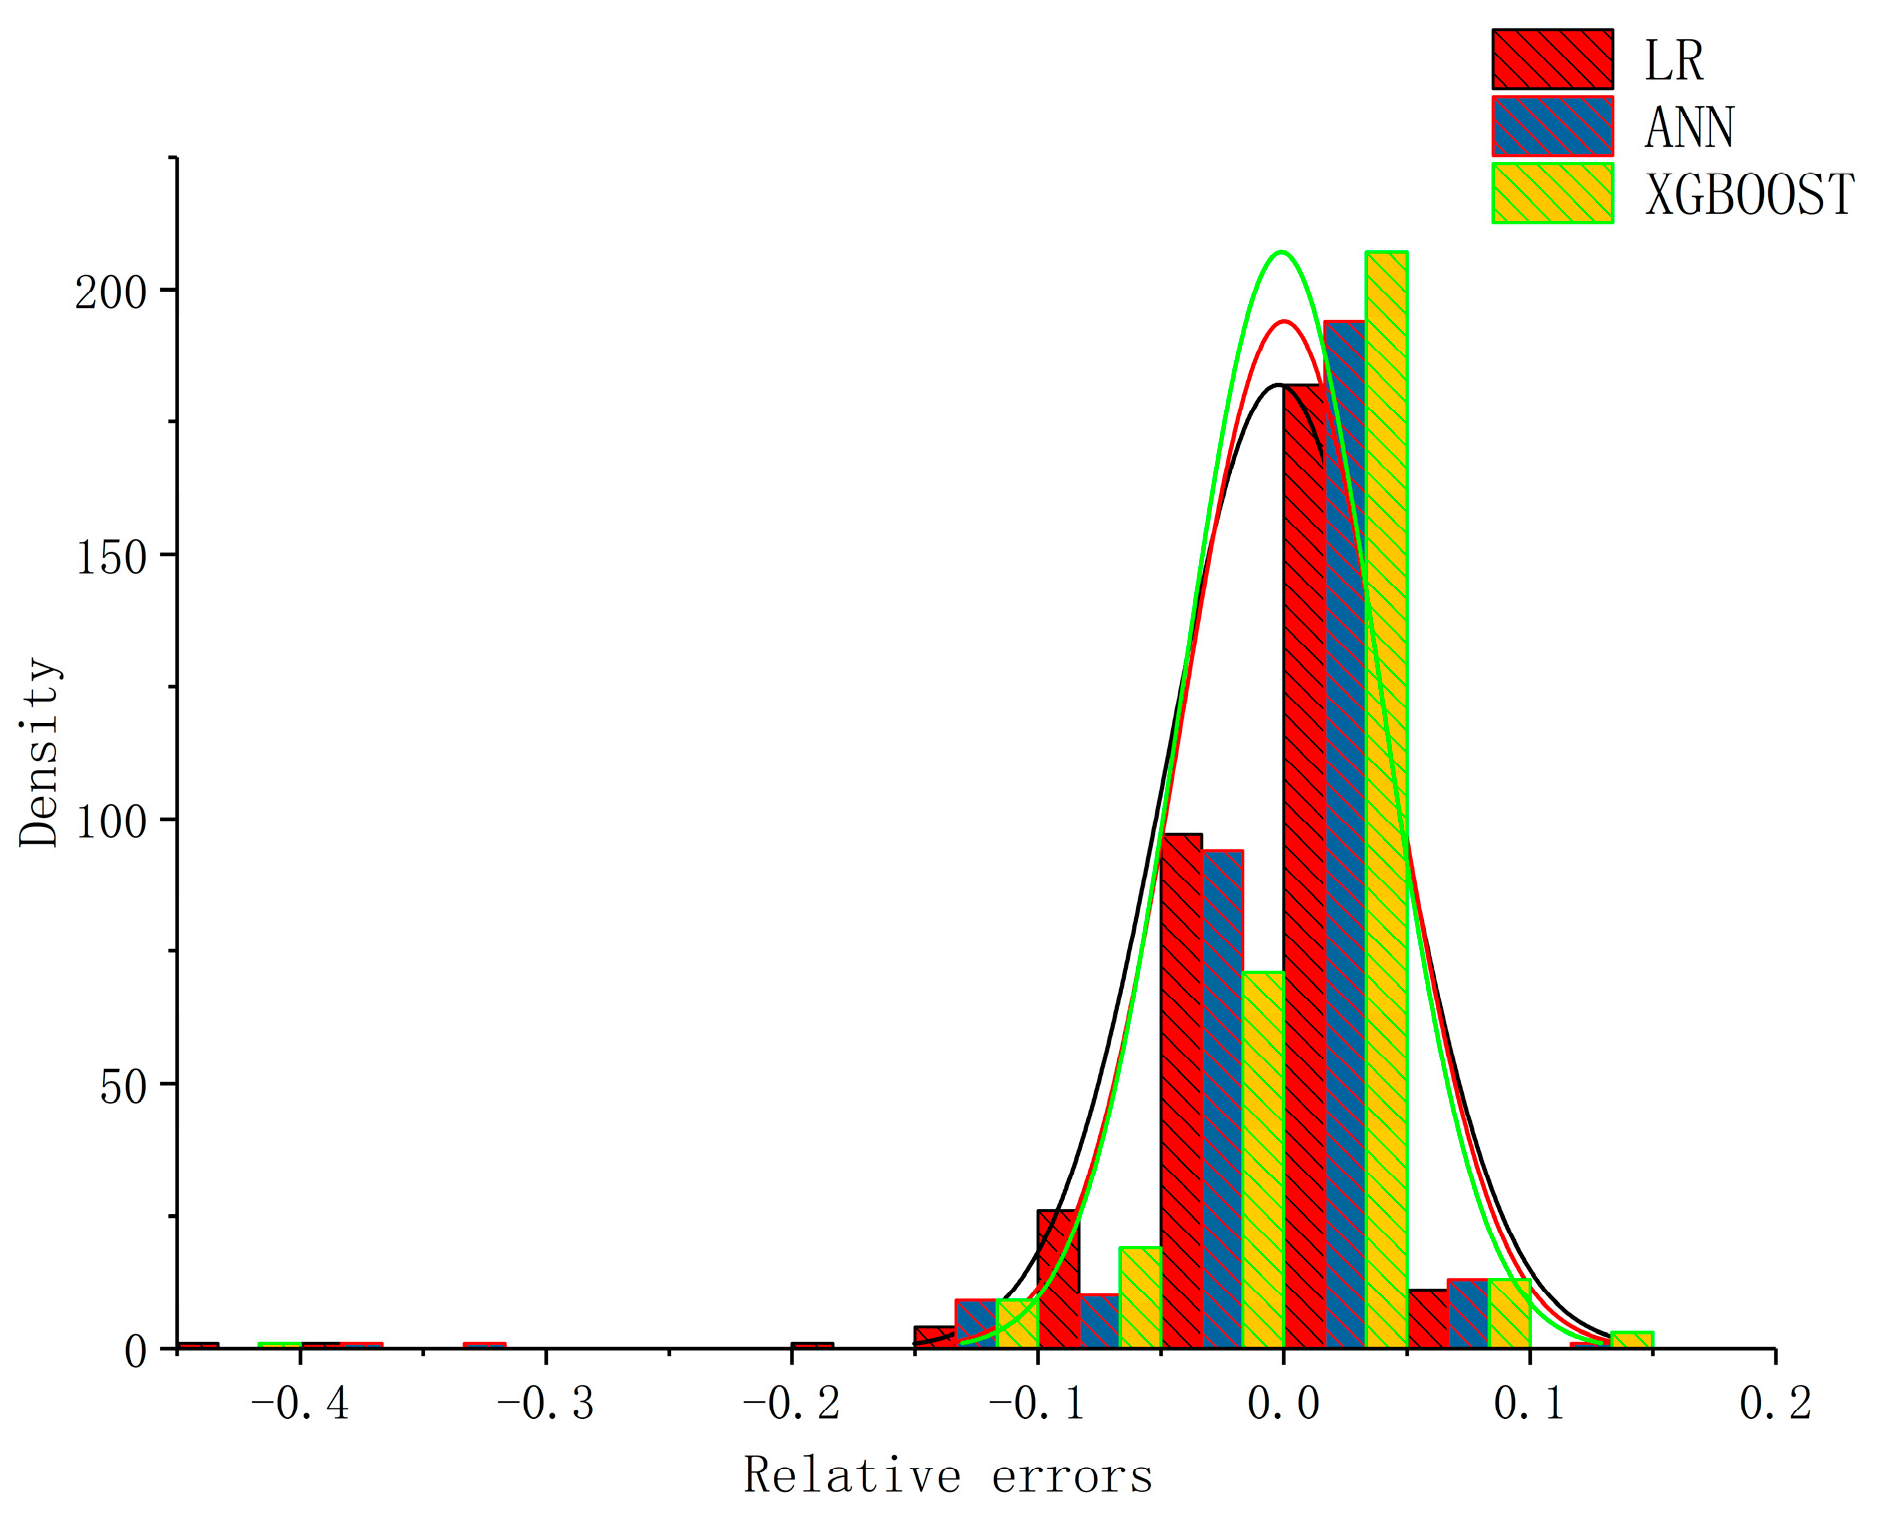
 Figure 5 and Figure 6 present the density plots of the relative errors in the electricity consumption model built by LR, the ANN and the XGBOOST, and the curve in the figure shows that the relative errors of the XGBOOST are more concentrated at zero, which means the XGBOOST has better performance. 
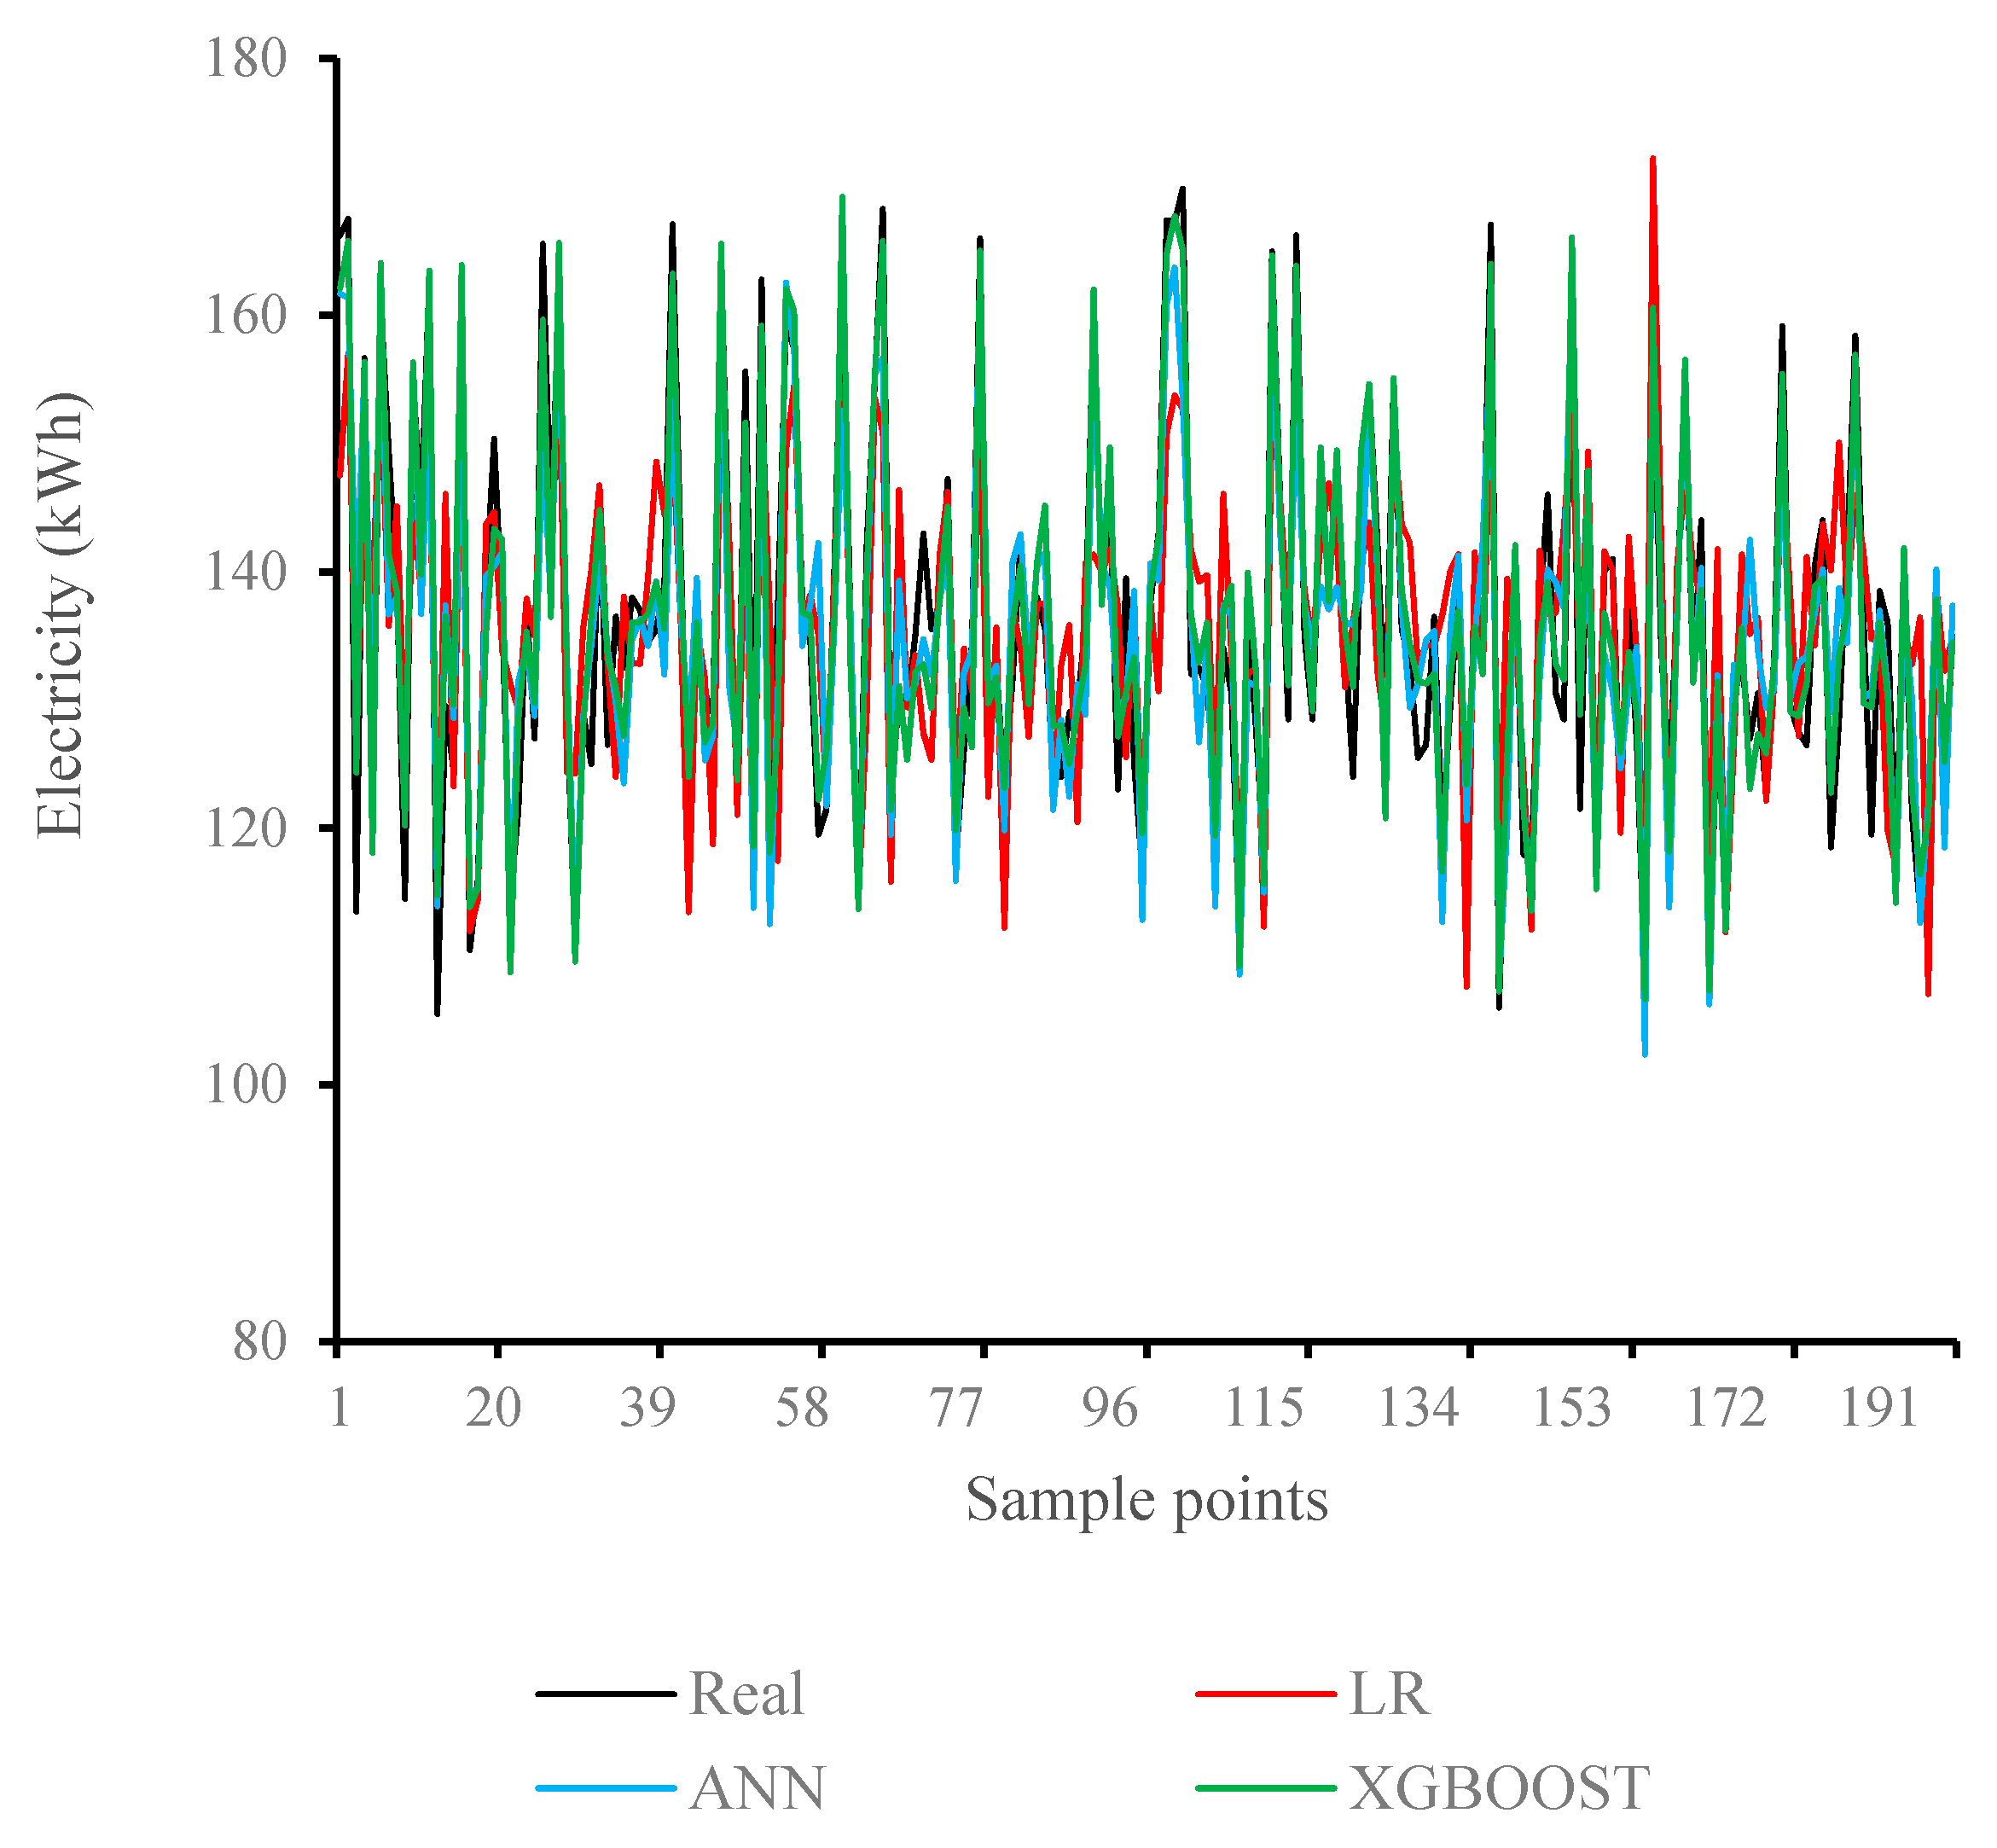
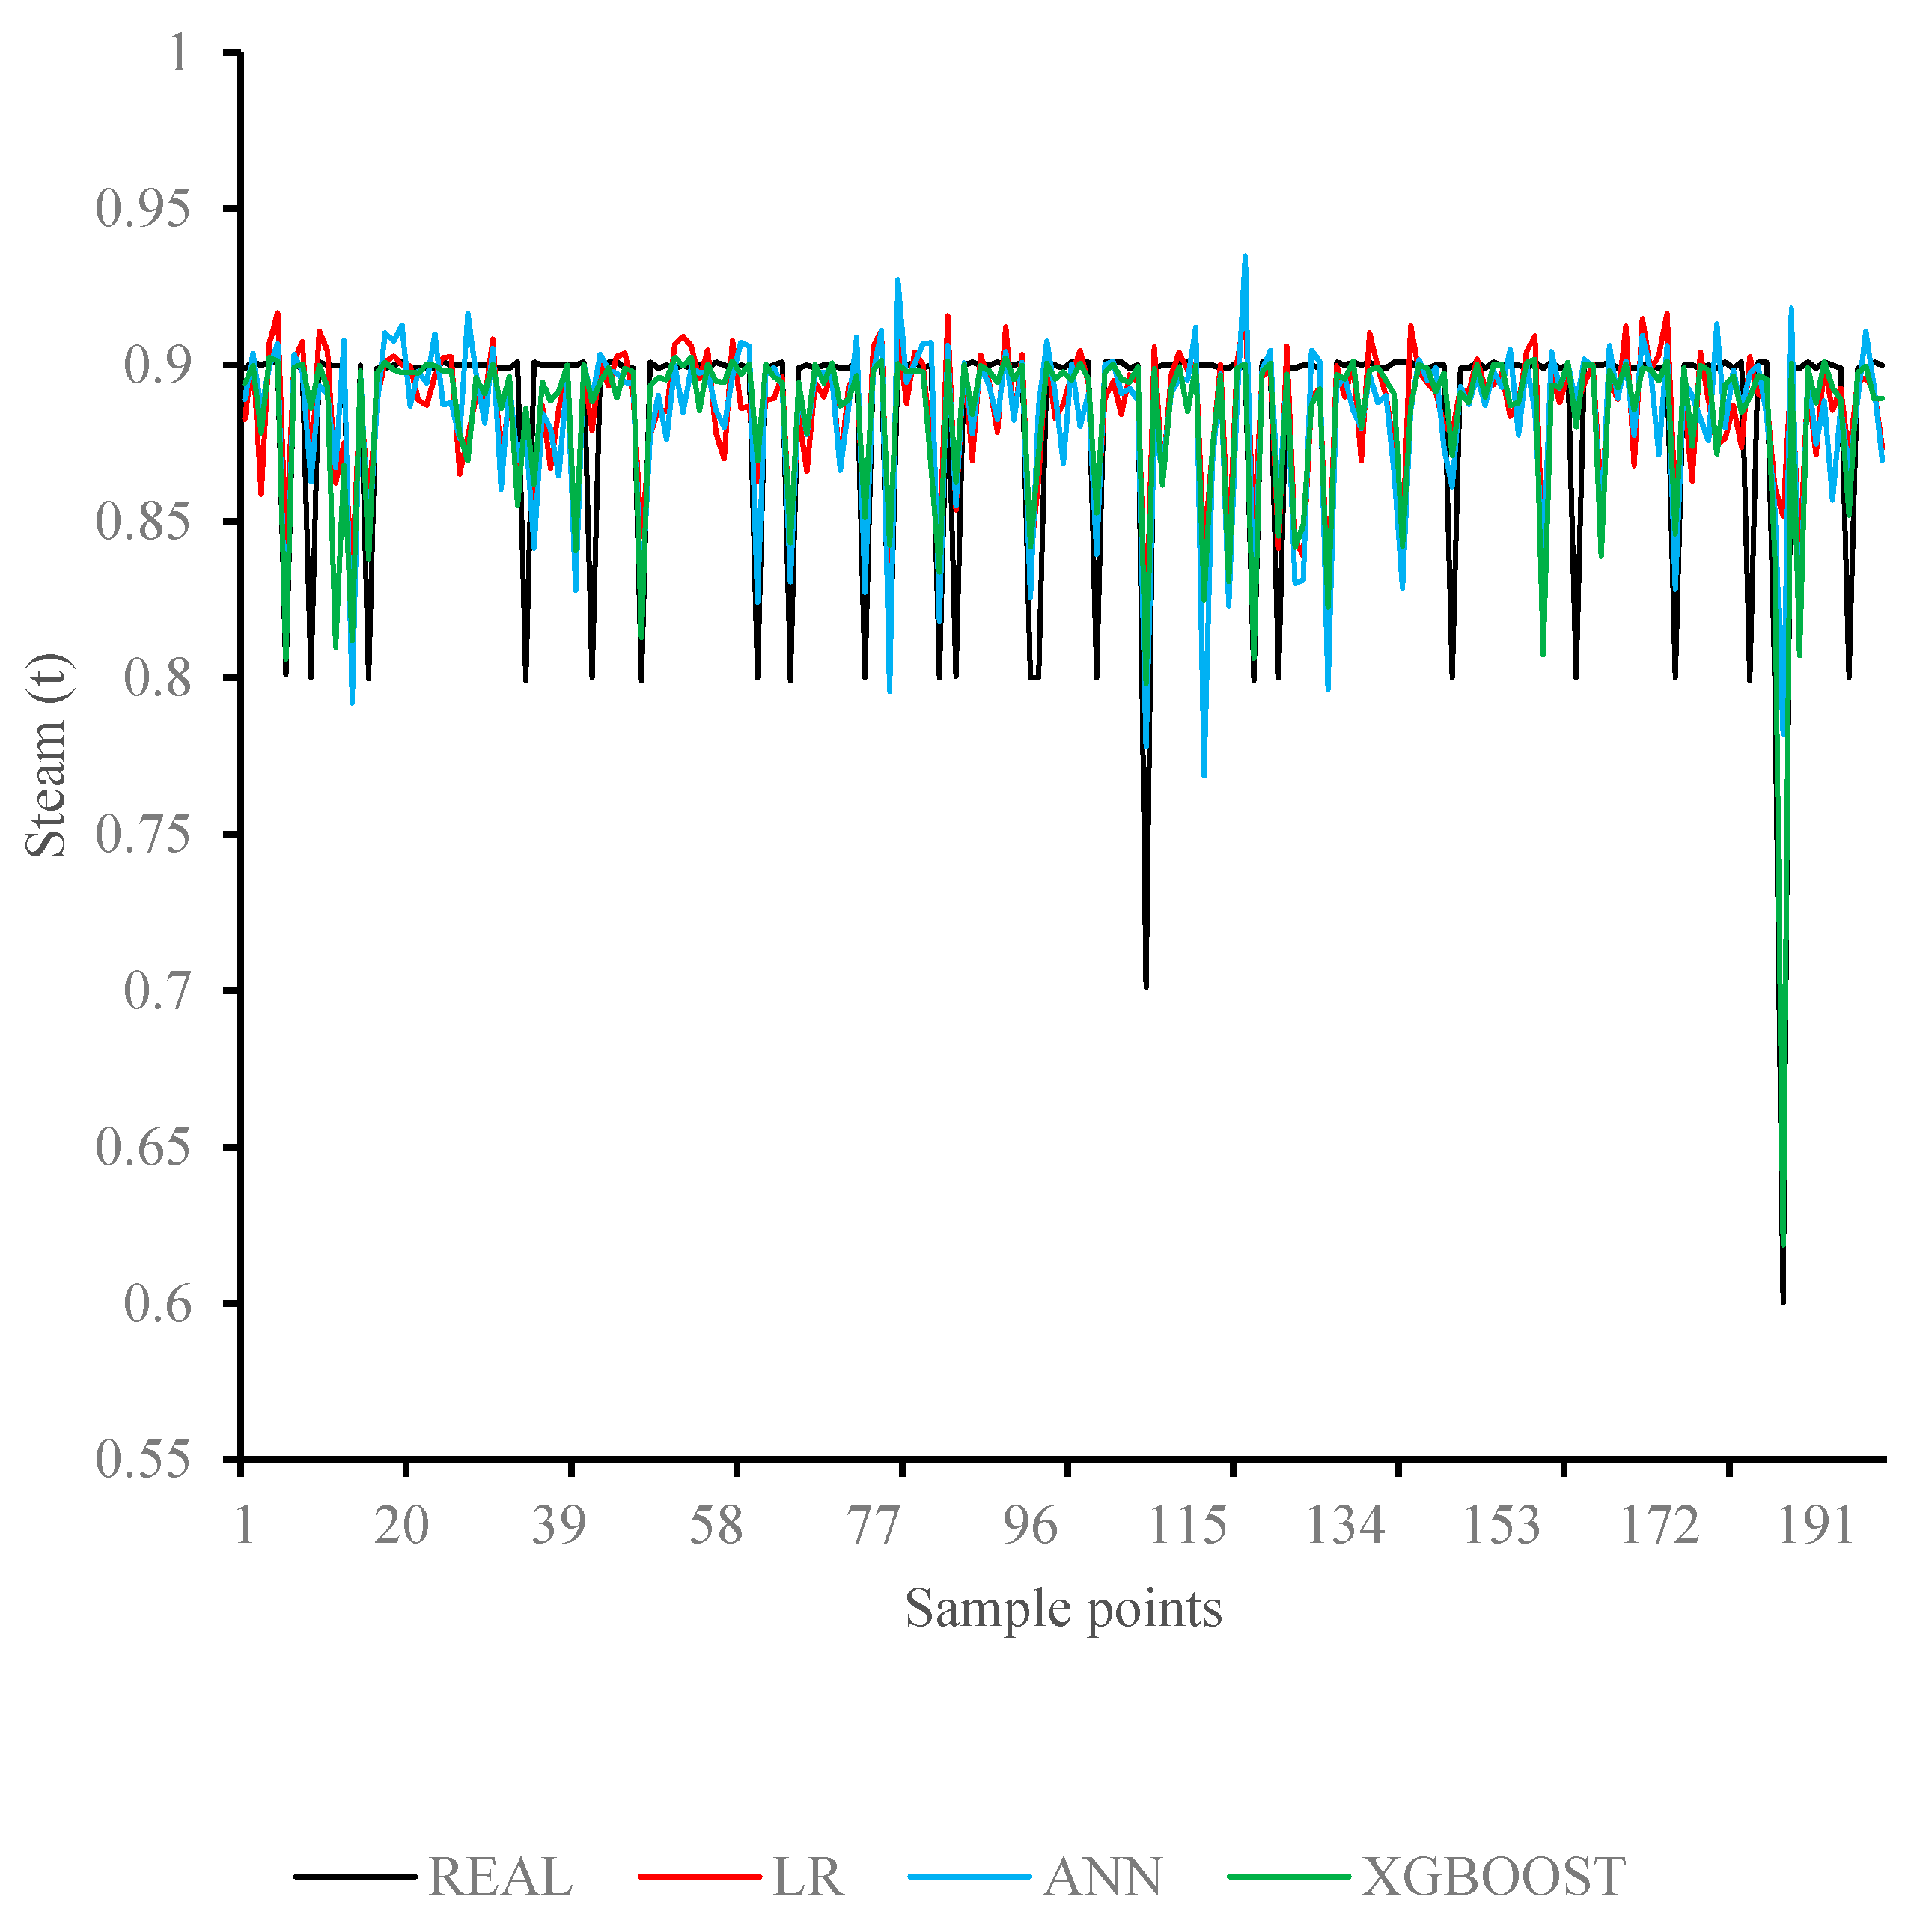
Figure 7 shows a part of real electricity consumption and the corresponding predicted electricity consumption, while Figure 8 shows a part of real steam consumption and the corresponding predicted steam consumption. From Figure 7 and Figure 8, it can be seen that the predicted values are close to the predicted values for all the models, which means modeling energy consumption and electricity consumption of tissue paper machines based on the empirical model is feasible.
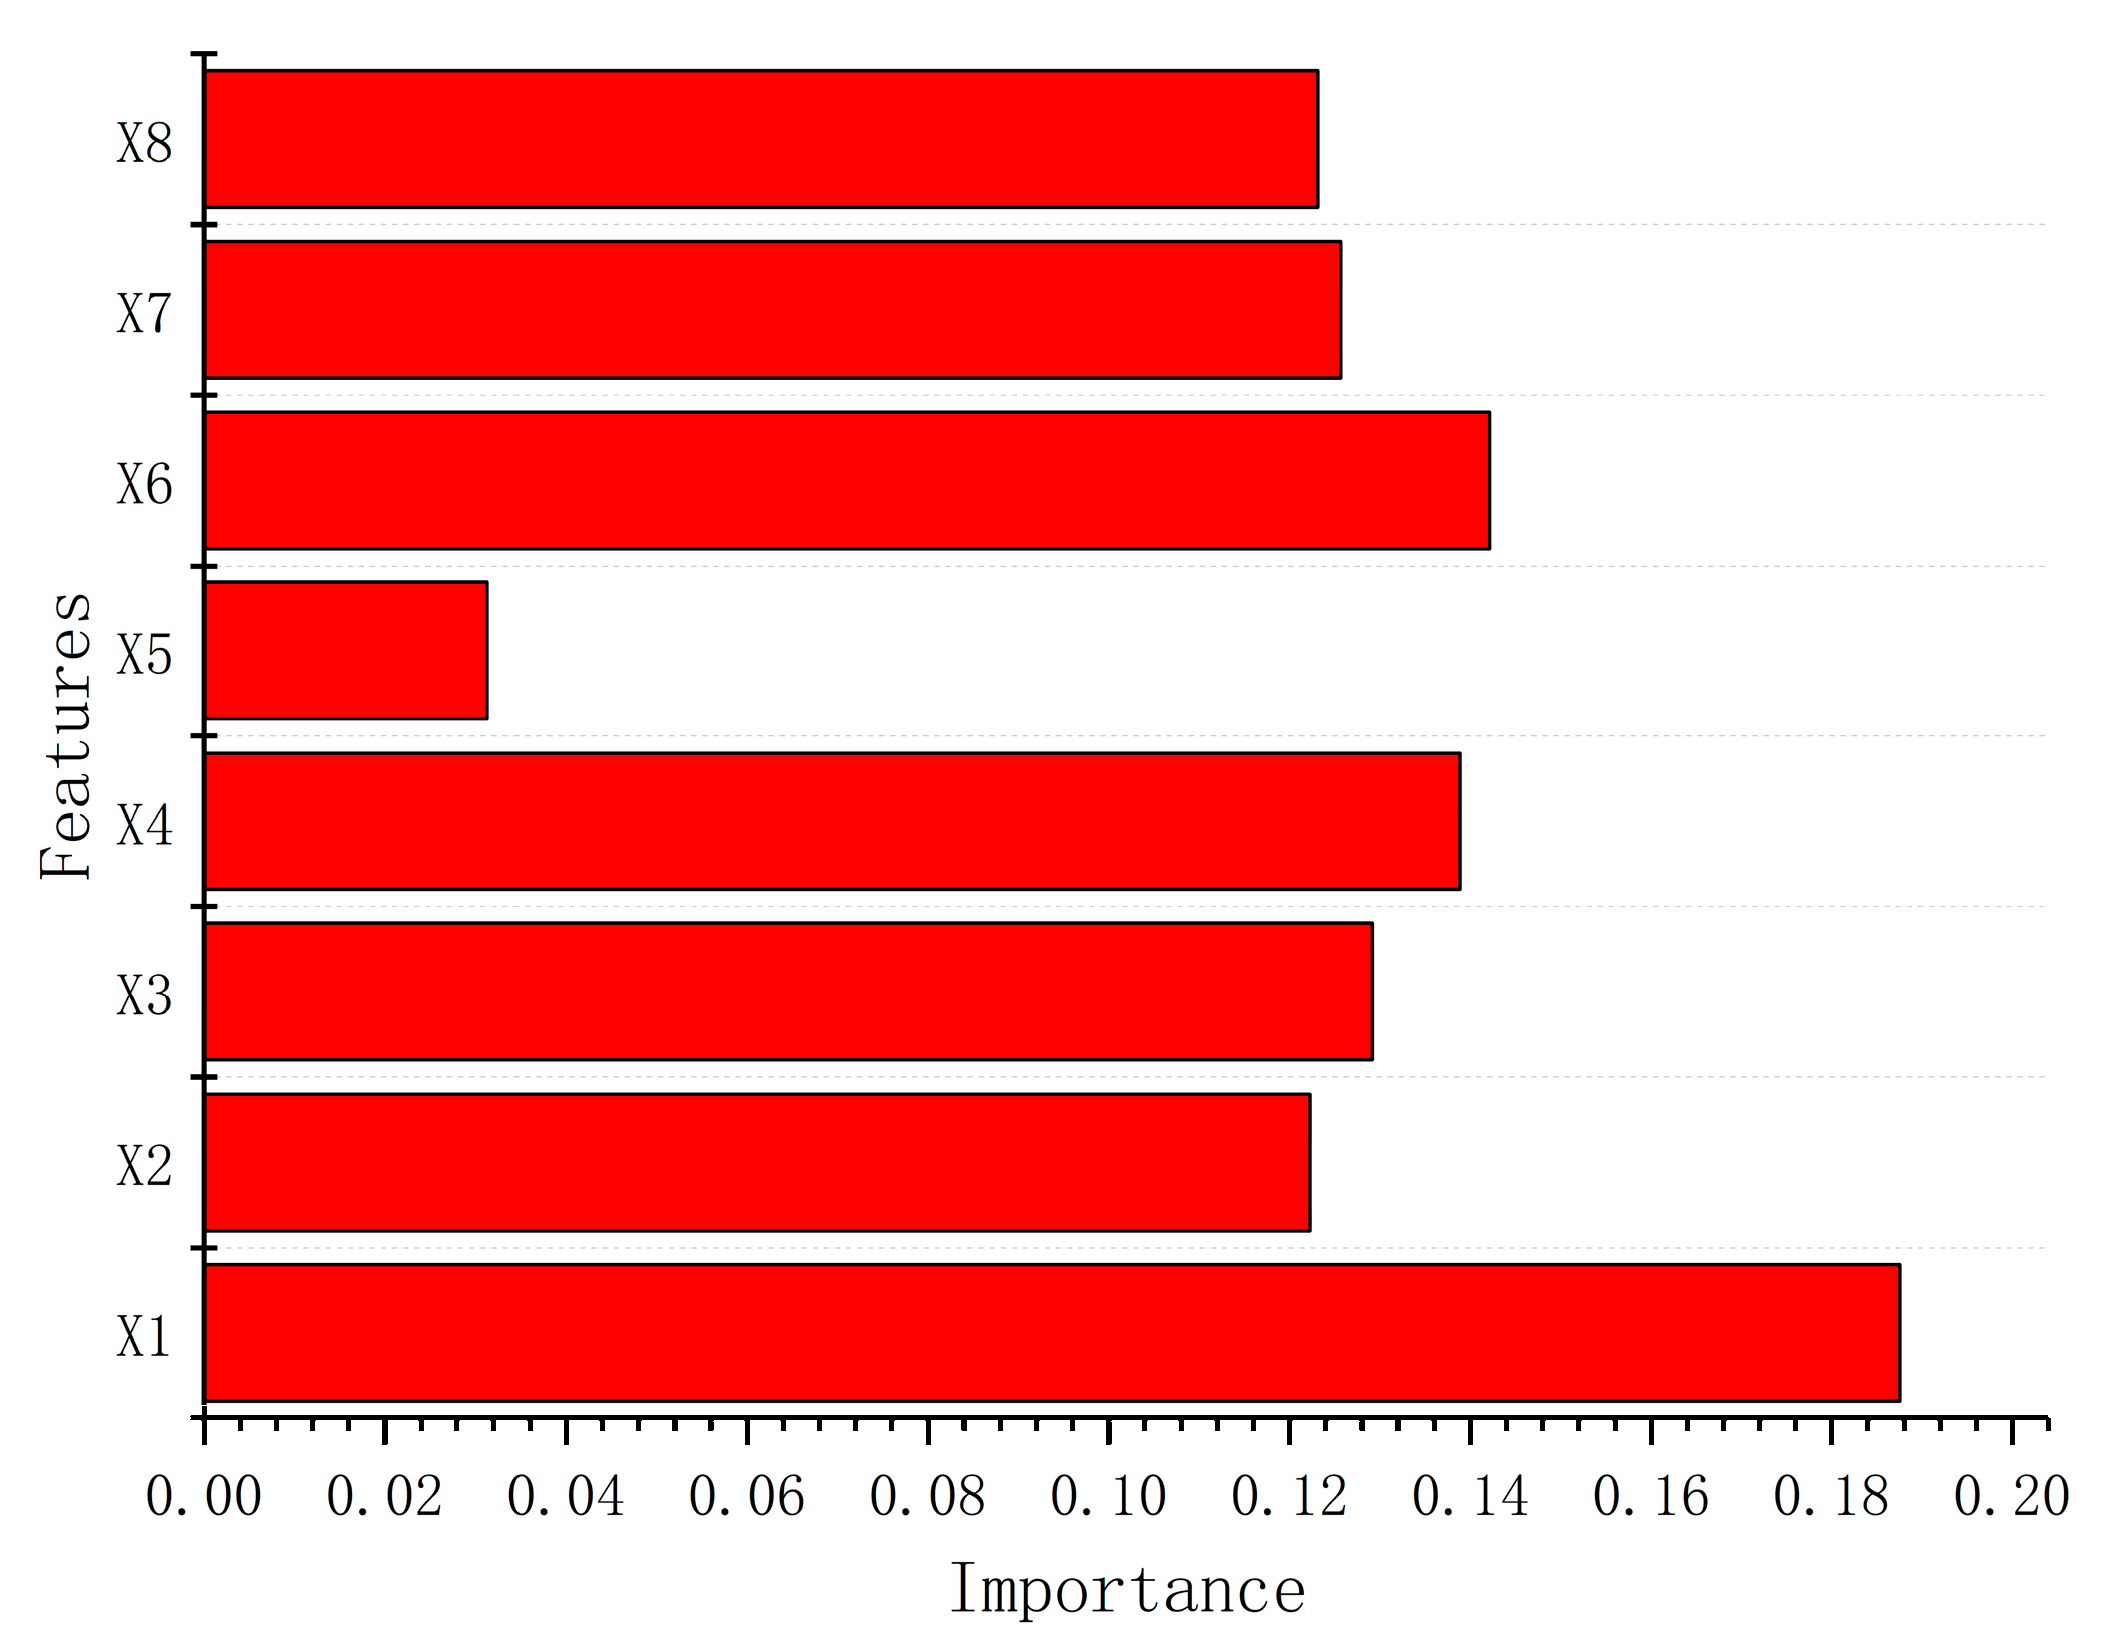
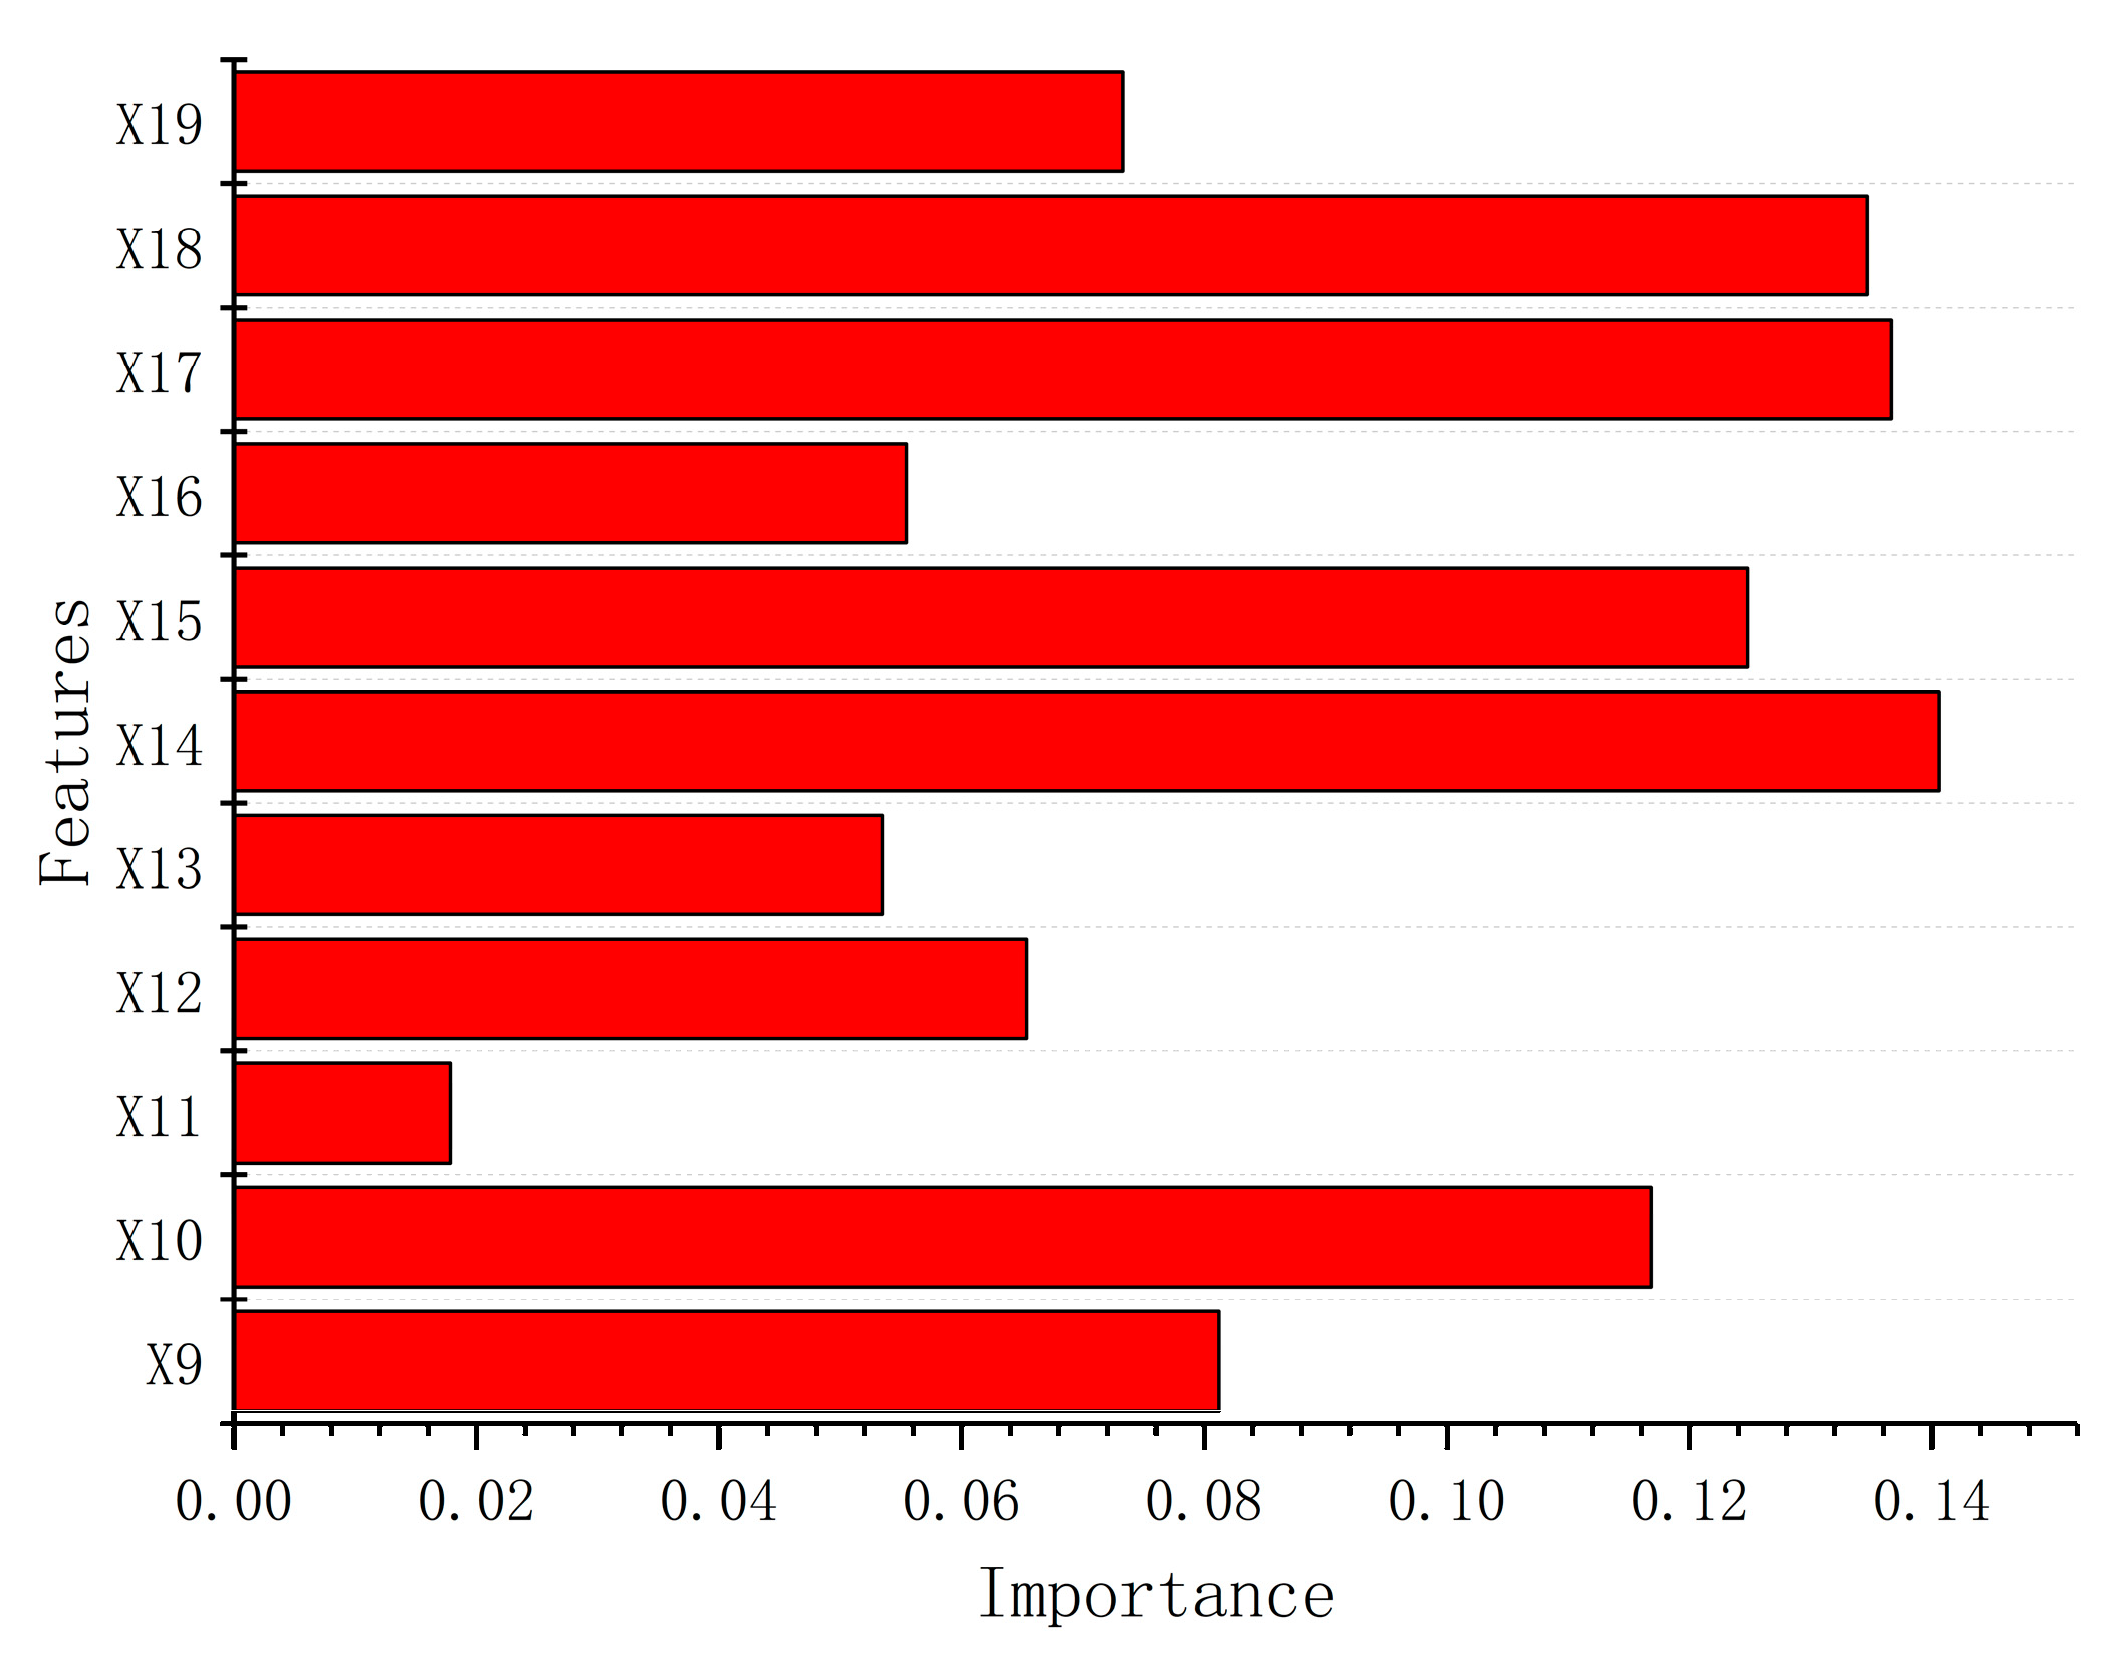
In fact, the electricity consumption and steam consumption of tissue paper machines are influenced by many process parameters, when the influence of different process parameters on electricity consumption and steam consumption is different. Some process parameters are strongly related to electricity consumption and steam consumption, indicating that these process parameters are the important features of electricity consumption modeling and steam consumption modeling, and vice versa. In order to evaluate the importance of the model features, it is calculated by the XGBOOST. The importance of the features of the electricity consumption model and the steam consumption model is shown in Figure 9 and Figure 10 respectively. From Figure 9, it can be observed that the reel cylinder speed (X1) is the most important feature for the electricity consumption model, while the grammage (X5) is the least important feature for the electricity consumption model. From Figure 10, it can be seen that the grammage (X11) is the least important for the steam consumption model, while the temperature of supply air in the dry side (X14), the temperature of supply air in the wet side (X15), the pressure of the dryer (X17) and the pressure of steam (X18) are extremely important for the steam consumption model. For the studied tissue paper machine, the grammage (X5 and X11) values are discrete, and there are very few quantitative values, which lead to the situation that the grammage is not important for the electricity consumption model and the steam consumption model. In the papermaking process, the reel cylinder is one of the most electricity-consuming devices in the papermaking process. Additionally, many devices’ speed is related to reel cylinder speed (X1), or in other words, the electricity consumption of many devices is related to the electricity consumption of the reel cylinder. That is why the reel cylinder speed (X1) is so significant for the electricity consumption model. The steam is mainly consumed in the dryer section, and the mechanism of steam consumption in the dryer section is extremely complicated. Thus, it is difficult to quantify the importance of the parameters of devices for steam consumption in the mechanism. Our study quantifies the importance of the parameters concerning the devices for the steam consumption model.
Figure 9 and Figure 10 show the importance of the features of the electricity consumption model and the steam consumption model. Besides, it can be seen that some of the features are not important for electricity consumption and steam consumption modeling. It remains uncertain whether these features can improve the accuracy of the model or decrease the accuracy of the model. For the problems mentioned above, the present study tends to remove the least important feature (grammage) for the model and rebuild the electricity consumption model and the steam consumption model using the XGBOOST. The rebuilt models are evaluated and determine whether this insignificant feature is removed. Table 8 shows the RMSE and MAPE of the rebuilt models. From Table 6 and Table 8, it can be seen that the RMSE and MAPE of the XGBOOST model that excludes the grammage (X5 and X11) are close to the XGBOOST model that contains the grammage. Thus, the grammage (X5 and X11) can be removed when the electricity consumption model and the steam consumption model are built. Based on Figure 9 and Figure 10, it can be found that other features are important for the electricity consumption model and the steam consumption model, and these features should not be removed.

6. Conclusions

In this paper, an empirical model was proposed for the energy consumption of tissue paper machines. To build the energy consumption model for tissue paper machines, initially, the tissue paper machine was introduced, and the process parameters for modeling electricity consumption and steam consumption were selected. Second, linear regression, the artificial neural network and the extreme gradient boosting tree were adopted to model electricity consumption and steam consumption. Finally, the models built by adopting three methods were evaluated, and the best electricity consumption model and the best steam consumption model were selected and combined in the energy consumption model for tissue paper machines. The experimental result demonstrates that modeling energy consumption for tissue paper machines based on the empirical model is feasible. Besides, the experimental result also shows that the extreme gradient boosting tree is superior to linear regression and the artificial neural network for tissue paper machine energy consumption modeling. In this paper, an efficient way for tissue paper machine energy consumption modeling is presented, and it is an important foundation for energy saving of tissue paper enterprises. For example, the energy consumption model is significant for energy efficiency scheduling. The key to the enhancement of empirical model accuracy is data. With the advent of the industrial big data era, the accuracy of the energy consumption model based on the empirical model will be further improved by adopting big data technology.
In this study, the empirical energy consumption model of tissue paper machines was proposed. The energy consumption in the papermaking process is very complex. Besides, combining the empirical model with the theoretical model or the discrete model may improve the accuracy of the energy consumption model. Further research will focus on the hybrid energy consumption model of tissue paper machines.

Author Contributions

Conceptualization, H.Z.; methodology, H.Z.; software, H.Z.; validation, H.Z. and M.H.; formal analysis, H.Z., J.L. and M.H.; investigation, H.Z., J.L. and M.H.; resources, J.L. and M.H.; data curation, H.Z., J.L. and M.H.; writing—original draft preparation, H.Z.; writing—review and editing, H.Z., J.L. and M.H.; visualization, H.Z.; supervision, J.L. and M.H.; project administration, J.L. and M.H.; funding acquisition, J.L. and M.H. All authors have read and agreed to the published version of the manuscript.

Funding

This research was funded by the National Natural Science Foundation of China, grant number No.61333007. This research was also funded by the Science and Technology Project of Guangdong Province, grant number No. 2015B010110004, 2015A010104004, and 2013B010406002 and The APC was funded by J.L.

Institutional Review Board Statement

I promise that this study not involve human or animal research.

Informed Consent Statement

Informed consent was obtained from all subjects involved in the study.

Data Availability Statement

Data sharing is not applicable to this article.

Conflicts of Interest

The authors declare no conflict of interest.

Appendix A

The topology of the typical artificial neural network is shown in Figure A1.
Figure A1. A typical artificial neural network.
Processes 09 00655 g0a1
Where X 1 , X 2 , , X n are the input data, W i j ( i = 1 , 2 , , n ; j = 1 , 2 , , h ) is the weight that combines input neurons and hidden neurons, h is the number of hidden neurons, W j k ( j = 1 , 2 , , h ; k = 1 , 2 , , m ) is the weight that combines hidden neurons and output neurons and Y 1 , Y 2 , , Y m are the output data. The relationship between input and output can be formulated as follows:
Y k = j = 1 h ( f o u t p u t ( W j k i = 1 n ( f h i d d e n ( W i j X i + b j ) ) + b k ) )
where b j is the bias for hidden neurons, b k is the bias for the output neuron, f h i d d e n is the activation function for hidden layers and f o u t p u t is the activation function for output layers. The output data of the artificial neural network may be different from the expected output, and the artificial neural network aims at eliminating this error. The error of the artificial neural network can be formulated as follows:
E = k = 1 m ( ( Y k D k ) 2 )
where E is the error of the artificial neural network and D k is the expected output. The artificial neural network minimizes errors by constantly updating weights and biases, and the updating formula of weights and biases is shown below:
W i j = W i j η E W i j
W j k = W j k η E W j k
b j = b j η E b j
b k = b k η E b k
where η represents the learning rate, and the above formula shows that weights and biases always change in the direction where the error decreases.

Appendix B

The model of gradient boosted regression tree is composed of, K , the tree, for giving dataset D = { ( x , y ) } ( | D | = n , x R , y R ) , and the model can be expressed as:
y ^ i = k = 1 K f k ( x i ) , f k F
where y ^ i is the output of the model, f k is the regression tree and F is the space of the regression tree, and can be defined as:
F = { f ( x ) = w q ( x ) } ( q : R m T , w R T )
where T is the number of leaves on the tree, w is the leaf weight of the tree and q is the structure of the tree. The model was trained to minimize the objective function, as shown below, to find the set of functions used in the model:
O b j = i = 1 n l ( y i , y ^ i ) + k = 1 K Ω ( f k )
The objective function consists of two items, which are training loss, which measures the fitting degree of the model on training data, and regularization, that calculates the complexity of the model. To optimize the objective function, the additive training procedure appears:
y ^ i ( 0 ) = 0 y ^ i ( 1 ) = y ^ i ( 0 ) + f 1 ( x i ) y ^ i ( 2 ) = y ^ i ( 1 ) + f 2 ( x i ) y ^ i ( t ) = y ^ i ( t 1 ) + f t ( x i )
where y ^ i ( t ) is the prediction of the i-th instant in the t-th iteration. The objective function at round t can be redefined as follows:
O b j ( t ) = i = 1 n l ( y i , y ^ i ( t 1 ) + f t ( x i ) ) + Ω ( f t )
The objective function at round t can be quickly optimized by the second approximation, shown below:
O b j ( t ) i = 1 n [ g i f t ( x i ) + 1 2 h i f t 2 ( x i ) ] + Ω ( f t )
g i = y ^ ( t 1 ) l ( y i , y ^ ( t 1 ) )
h i = 2 y ^ ( t 1 ) l ( y i , y ^ ( t 1 ) )
From above, the objective function at round t only depends on g i and h i , and the approximation objective function can be optimized more quickly than the original objective function.

References

  1. EIA. International Energy Outlook. 2017. Available online: https://www.eia.gov/outlooks/ieo/pdf/0484(2017).pdf (accessed on 14 September 2017).
  2. EIA. International Energy Outlook. 2016. Available online: https://www.eia.gov/outlooks/ieo/pdf/0484(2016).pdf (accessed on 30 May 2016).
  3. Peng, T.; Xu, X. Energy-Efficient Machining Systems: A Critical Review. Int. J. Adv. Manuf. Technol. 2014, 72, 1389–1406. [Google Scholar] [CrossRef]
  4. Munoz, A.A.; Sheng, P. An Analytical Approach for Determining the Environmental Impact of Machining Processes. J. Mater. Process. Technol. 1995, 53, 736–758. [Google Scholar] [CrossRef]
  5. Balogun, V.A.; Mativenga, P.T. Modeling of Direct Energy Requirements in Mechanical Machining Processes. J. Clean.Prod. 2013, 41, 179–186. [Google Scholar] [CrossRef]
  6. Altıntaş, R.S.; Kahya, M.; Ünver, H.Ö. Modeling and Optimization of Energy Consumption for Feature-Based Milling. Int. J. Adv. Manuf. Technol. 2016, 86, 3345–3363. [Google Scholar] [CrossRef]
  7. Imani Asrai, R.; Newman, S.T.; Nassehi, A.A. Mechanistic Model of Energy Consumption in Milling. Int. J. Prod. Res. 2017, 56, 642–659. [Google Scholar] [CrossRef] [Green Version]
  8. Kara, S.; Li, W. Unit Process Energy Consumption Models for Material Removal Processes. CIRP Annals. 2011, 60, 37–40. [Google Scholar] [CrossRef]
  9. Ma, J.; Ge, X.; Chang, S.I.; Lei, S. Assessment of Cutting Energy Consumption and Energy Efficiency in the Machining of 4140 Steel. Int. J. Adv. Manuf. Technol. 2014, 74, 1701–1708. [Google Scholar] [CrossRef]
  10. Yoon, H.-S.; Lee, J.-Y.; Kim, M.-S.; Ahn, S.-H. Empirical Power-Consumption Model for Material Removal in Three-Axis Milling. J. Clean. Prod. 2014, 78, 54–62. [Google Scholar] [CrossRef]
  11. Sealy, M.P.; Liu, Z.Y.; Zhang, D.; Guo, Y.B.; Liu, Z.Q. Energy Consumption and Modeling in Precision Hard Milling. J. Clean. Prod. 2016, 135, 1591–1601. [Google Scholar] [CrossRef]
  12. Shi, K.N.; Zhang, D.H.; Liu, N.; Wang, S.B.; Ren, J.X.; Wang, S.L. A Novel Energy Consumption Model for Milling Process Considering Tool Wear Progression. J. Clean. Prod. 2018, 184, 152–159. [Google Scholar] [CrossRef]
  13. Zhou, L.; Li, J.; Li, F.; Xu, X.; Wang, L.; Wang, G.; Kong, L. An Improved Cutting Power Model of Machine Tools in the Milling Process. Int. J. Adv. Manuf. Technol. 2017, 91, 2383–2400. [Google Scholar] [CrossRef]
  14. Liao, W.; Garg, A.; Gao, L. Design of Robust Energy Consumption Model for Manufacturing Process Considering Uncertainties. J. Clean. Prod. 2018, 172, 119–132. [Google Scholar] [CrossRef]
  15. Jiang, Z.; Gao, D.; Lu, Y.; Kong, L.; Shang, Z. Electrical Energy Consumption of CNC Machine Tools Based on Empirical Modeling. Int. J. Adv. Manuf. Technol. 2019, 100, 2255–2267. [Google Scholar] [CrossRef]
  16. Liu, Z.Y.; Sealy, M.P.; Li, W.; Zhang, D.; Fang, X.Y.; Guo, Y.B.; Liu, Z.Q. Energy Consumption Characteristics in Finish Hard Milling. J. Manuf. Process. 2018, 35, 500–507. [Google Scholar] [CrossRef]
  17. Ge, Y.; Li, L. System-Level Energy Consumption Modeling and Optimization for Cellulosic Biofuel Production. Appl. Energy 2018, 226, 935–946. [Google Scholar] [CrossRef]
  18. Dietmar, A.; Verl, A.A. Generic Energy Consumption Model for Decision Making and Energy Efficiency Optimization in Manufacturing. Int. J. Eng. 2009, 2, 123–133. [Google Scholar]
  19. Larek, R.; Brinksmeier, E.; Meyer, D.; Pawletta, T.; Hagendorf, O. A Discrete-Event Simulation Approach to Predict Power Consumption in Machining Processes. Prod. Eng. 2011, 5, 575–579. [Google Scholar] [CrossRef]
  20. Zhou, X.; Liu, F.; Cai, W. An Energy-Consumption Model for Establishing Energy-Consumption Allowance of a Workpiece in a Machining System. J. Clean. Prod. 2016, 135, 1580–1590. [Google Scholar] [CrossRef]
  21. Zhang, Y.; Hong, M.N.; Li, J.G.; Ren, J.Z.; Man, Y. Energy System Optimization Model for Tissue Papermaking Process. Comput. Chem. Eng. 2021, 146, 107220. [Google Scholar] [CrossRef]
  22. Lin, Z.Z. Research on the Modeling of Paper Sheet Drying. Master’s Thesis, South China University of Technology, Guangzhou, China, 2012. [Google Scholar]
  23. Li, Y.G. Analysis, Modeling, and Optimization of Multicylinder Paper Machine Dryer Section Energy System. Master’s Thesis, South China University of Technology, Guangzhou, China, 2011. [Google Scholar]
  24. Zhang, D.H. Research on Energy Saving and Optimization Model of the Papermaking Process Based on Muti-Agent. Master’s Thesis, South China University of Technology, Guangzhou, China, 2012. [Google Scholar]
  25. Chen, X.B. Study on Modeling and Simulation-Optimization for Energy Efficiency in the Paper Drying Process. Master’s Thesis, South China University of Technology, Guangzhou, China, 2016. [Google Scholar]
  26. Wu, B. Study on Data Mining and Prediction Method of Energy Consumption Used in the Energy Management System of the Paper Process. Master’s Thesis, South China University of Technology, Guangzhou, China, 2012. [Google Scholar]
  27. Kingma, D.P.; Ba, J. Adam: A Method for Stochastic Optimization. In Proceedings of the International Conference on Learning Representations 2015 (ICLR 2015), San Diego, CA, USA, 7–9 May 2015.
Figure 1. The production process of tissue paper mills.
Processes 09 00655 g001
Figure 2. A typical cylinder paper machine.
Processes 09 00655 g002
Figure 3. The training error curve of the electricity consumption model.
Processes 09 00655 g003
Figure 4. The training error curve of the steam consumption model.
Processes 09 00655 g004
Figure 5. Density plots of the relative errors of electricity consumption model built by LR, ANN and XGBOOST.
Processes 09 00655 g005
Figure 6. Density plots of the relative errors of steam consumption model built by LR, ANN and XGBOOST.
Processes 09 00655 g006
Figure 7. Real electricity consumption and predicted electricity consumption.
Processes 09 00655 g007
Figure 8. Real steam consumption and predicted steam consumption.
Processes 09 00655 g008
Figure 9. The importance of the features of the electricity consumption model.
Processes 09 00655 g009
Figure 10. The importance of the features of the steam consumption model.
Processes 09 00655 g010
Table 1. Details of Dataset_1.
Independent Variables NameDescription
X1Reel cylinder speed
X2Dryer speed
X3Pressure roll speed
X4Suction cylinder speed
X5Grammage
X6Frequency of air feeder in the dry side
X7Frequency of air feeder in the wet side
X8Frequency of air exhauster
Table 2. Details of Dataset_2.
Independent Variables NameDescription
X9Reel cylinder speed
X10Dryer speed
X11Grammage
X12Frequency of air feeder in the dry side
X13Frequency of air feeder in the wet side
X14The temperature of supply air in the dry side
X15The temperature of supply air in the wet side
X16Frequency of air exhauster
X17Pressure of dryer
X18Pressure of steam
X19Temperature of steam
Table 3. The values of the intercept and coefficients.
Variable NameValue
b 1 21.895
b 2 0.715
α 1 0.052
α 2 −15.721
α 3 0.998
α 4 14.789
α 5 −1.192
α 6 1.857
α 7 −0.924
α 8 0.193
α 9 2.950 × 10⁻⁴
α 10 8.708 × 10⁻⁵
α 11 1.108 × 10⁻²
α 12 −2.154 × 10⁻³
α 13 1.859 × 10⁻³
α 14 −1.279 × 10⁻⁴
α 15 −1.802 × 10⁻³
α 16 4.901 × 10⁻³
α 17 2.466 × 10⁻¹
α 18 1.212 × 10⁻²
α 19 −2.560 × 10⁻³
Table 4. The parameters of the electricity consumption model and the steam consumption model.
ParametersElectricity Consumption ModelSteam Consumption Model
nlayers33
hidden_layer_sizes4212
learning_rate0.020.03
hidden_activationHyperbolic tan functionHyperbolic tan function
output_activationLinear functionLinear function
SolverStochastic gradient-based optimizerStochastic gradient-based optimizer
tol0.000010.00001
Max_ iterations10001000
n_iter_no_change1010
alpha0.050.05
Table 5. The parameters for the electricity consumption model and the steam consumption model.
ParametersElectricity Consumption ModelSteam Consumption Model
learning_rate0.040.11
max_depth53
min_child_weight11
n_estimators99986
reg_alpha100.1
reg_lambda10140
gamma00
Table 6. The RMSE and MAPE of the three electricity consumption models.
ModelsRMSEMAPE
LR model9.195.43
ANN model6.783.81
XGBOOST model4.782.73
Table 7. The RMSE and MAPE of the three steam consumption models.
ModelsRMSEMAPE
LR model0.033242.4009
ANN model0.031912.2510
XGBOOST model0.030291.8678
Table 8. The RMSE and MAPE of the rebuilt models.
ModelsRMSEMAPE
Electricity consumption model4.742.72
Steam consumption model0.030271.8683
Publisher’s Note: MDPI stays neutral with regard to jurisdictional claims in published maps and institutional affiliations.

