Article

Adsorption Characteristics of Stone-Bentonite Mixtures towards Zn: Equilibrium and Kinetic Tests

1
Institute of Geotechnical Engineering, Zhejiang University of Technology, Hangzhou 310023, China
2
Zhongtian Construction Group Co., LTD., Dongyang 322100, China
3
State Grid Ningbo Power Supply Company, Ningbo 315000, China
4
Library, Zhejiang University of Technology, Hangzhou 310014, China
*
Author to whom correspondence should be addressed.
Processes 2021, 9(4), 619; https://doi.org/10.3390/pr9040619
Submission received: 10 March 2021 / Revised: 21 March 2021 / Accepted: 26 March 2021 / Published: 1 April 2021

Abstract

:
In the treatment of industrial polluted sites and the construction of landfill sites, anti-pollution barriers are usually used to prevent the diffusion of pollutants. In this paper, the adsorption characteristics of Zn ions by the rock-bentonite anti-pollution barrier were observed by means of static equilibrium and dynamic adsorption tests. The experimental results showed that the adsorption of Zn by stone chips—bentonite was close to the nonlinear Freundlich and Langmuir models. When the concentration of Zn ion is constant, the adsorption capacity increases with the increase in temperature. At a certain temperature, the adsorption removal rate decreases with the increase in concentration. Further study found that the adsorption of Zn from mixed soil was mainly an ion exchange process, and the adsorption mode of Zn from mixed soil was controlled by both intra-particle diffusion and membrane diffusion. Zeta potential, X-ray diffraction (XRD) and The Fourier Transform Infrared spectroscopy (FTIR) showed that with the increase in concentration, the mixed soil adsorbed more metal ions, and the thickness of the double electric layer decreased. Moreover, the adsorption of Zn2+ by bentonite was mainly interlayer adsorption and ion exchange. As an anti-pollution barrier material, the mixed soil of stone chips -bentonite can prevent the diffusion of pollutants, which has certain reference significance for engineering construction.

1. Introduction

With the advancement of urbanization, the production of domestic waste increases, which brings great problems to waste treatment [1]. In addition, the removal of chemical and metallurgical enterprises from the city center has left a large area of polluted sites, posing a serious threat to the surrounding environment [2,3,4]. Anti-fouling barriers are widely used in the construction of landfill sites and the treatment of contaminated sites to prevent leachate leakage and pollutant diffusion [5,6,7].
Many scholars have conducted research on the adsorption characteristics of heavy metals through adsorption tests. When studying the effects of reaction time and initial concentration of heavy metals on the adsorption effect, Chen et al. [8] conducted static equilibrium and dynamic adsorption tests on Pb by silt-loess mixed soil, and found that the adsorption amount of Pb by mixture increased with the increase in initial concentration and reaction time, and eventually tended to be saturated. The findings of Liu et al. [9] were consistent with those of Chen. In the experimental study on the adsorption of heavy metals Pb and Zn by sand-bentonite vertical barrier materials, it was found that the adsorption capacity of sand-bentonite for Pb and Zn increased with the increase in solute concentration. Shi et al. [10] suggested that bentonite has a good adsorption and removal effect on heavy metal ions Zn, and the adsorption rate was fast. When it comes to the influence of temperature and initial concentration of solution on the adsorption effect, Wang et al. [11] found that the adsorption capacity of biochar on heavy metal Zn gradually increases with the increase in temperature and initial concentration. Dogan et al. [12] found that the adsorption effect of sepiolite on heavy metals was enhanced with the increase in reaction temperature. When the adsorption model (OriginLab, US) was used to analyze the adsorption of heavy metals by adsorbents, Wang et al. [13] believed that the Langmuir model could better describe the adsorption process of Pb adsorption by sludge incineration ash. El-Enein et al. [14] investigated the adsorption performance of nano-bentonite particles for Cu, and found that the adsorption capacity of Cu monolayer was 35.46 mg/g, and the adsorption kinetics complied with the pseudo-second-order (PSO) rate equation. Guo et al. [15] studied the kinetic characteristics of biochar adsorption of Zn and believed that the kinetics of biochar adsorption of Zn was in line with the PSO kinetic model. Chwastowski et al. [16] believed that the Langmuir model could accurately describe the adsorption process of Cd(II), Mn(II) and Pb(II) in coffee grounds, and the PSO kinetic model could accurately describe the kinetic process. Alandis et al. [17] studied the kinetics and thermodynamics of bentonite adsorption of heavy metals, and found that the PSO kinetic model was consistent with the adsorption of Fe and Ni. The thermodynamic parameters showed that the adsorption process was spontaneous and endothermic.
Some scholars characterized the adsorption of pollutants from the microscopic aspect and explored the adsorption mechanism of pollutants. Somasundaran and Fuerstenau [18] proposed that the electrodynamic properties of fine particles in solution (zeta potential) are of great significance for understanding the adsorption mechanism of inorganic and organic matter at the compound/solution interface. Tang et al. [19] characterized the loess after adsorption of Zn by XRD, and found that the mineral components calcite, goethite and kaolinite were the main clay minerals for removing Zn. Alkan et al. [20] measured by zeta potential that the surface of perlite in aqueous solution was negatively charged, and the absolute value of potential was about 38 mV. Through potential test, it was found that in inorganic salt solutions CaCl2, MgCl2 and Pb(NO3)2, the absolute value of potential of perlite decreased with the increase in salt solution concentration. Pehlivan et al. [21] used FTIR to analyze the adsorption principle of Pb2+ by hazelnut and almond shell, and believed that the surface of hazelnut and almond shells is heterogeneous, and there are a variety of functional groups that can adsorb Pb2+.
Although there have been many studies on the effects of solution characteristics and temperature on the adsorption characteristics of pollutants in bentonite anti-fouling barrier materials, most of them obtained the adsorption rules of pollutants in the anti-fouling barrier through experiments, and few explored the adsorption mechanism from the microscopic perspective. In this paper, by studying the reaction temperature, initial concentration and the adsorption time of stone chips—bentonite mixed soil to remove heavy metal zinc features, using the different adsorption model fitting to explore its adsorption mechanism, with the potential revealing the changes of stone chips—a bentonite mixture for evaluating the zinc adsorption mechanism, we discuss the feasibility of the quarry waste as antifouling barrier material.

2. Material and Test Program

2.1. Test Material

The test uses sodium bentonite, (Yiguo Bentonite Factory, Zhejiang, China) produced in An’ji, Zhejiang Province, the main mineral component is montmorillonite. The free swelling index was 17 mL/2 g, the liquid limit was 218%, and the plastic limit was 43%, Table 1 is the composition of bentonite. The stone chips are the waste material of a quarry, the maximum particle size is less than 5 mm. According to the particle analysis test, the fine particle content is 7.48%, the non-uniformity coefficient Cu is 15.0, the curvature coefficient Cc is 1.7, and the maximum dry density is 1.95 g/cm3 in the compaction test. The content of bentonite in the mixed soil is 7%, and the permeability coefficient is 4.39 × 10⁻⁷ cm/s.

2.2. Zn Standard Curve

The standard curve was made by atomic adsorption spectrometry. The concentration of the standard curve was set as 0.1, 0.2, 0.4 and 1 mg/L in standard zinc solution of 1000 μg/mL, and the standard curve is shown in Figure 1.

2.3. Test Scheme

Batch equilibrium adsorption test was used to investigate the adsorption characteristics of stone debris—bentonite fouling barrier on heavy metal ions Zn [20]. Adsorption tests are mainly divided into static equilibrium isothermal adsorption and dynamic isothermal adsorption. Zn ionic solution was prepared by ZnCl2, and the concentration of 8 groups were 3, 5, 10, 30, 50, 80 and 100 mmol/L, respectively. The reaction time was 24 h at 25, 40 and 55 °C. Dynamic isothermal adsorption tests were conducted at concentrations of 10 and 30 mmol/L, reaction times were set as 0.25, 0.5, 1, 2, 6 and 24 h, respectively, and temperature was 25 °C. The soil–water ratio of both adsorption tests was 1:20, using 0.1 M HCl to adjust the pH of the reaction system to 5.5. The specific test scheme is shown in Table 2.

2.4. Adsorption Parameters

The adsorption removal rate R P and adsorption capacity q e of the mixed soil on heavy metal Zn were calculated using Equations (1) and (2):
R P = C 0 C e C 0 × 100 %
q e = C 0 C s m s V
where R P is the adsorption removal rate (%), C 0 is the initial concentration of pollutants (mg/L), C e is the concentration in the equilibrium state (mg/L), q e is the unit adsorption capacity of soil sample (mg/g), m s is the mass of adsorbent (g), and V is the volume of solution (mL).
The adsorption capacity q t of the mixed soil on heavy metal Zn at any time is:
q t = C 0 C t m s V
where q t is the adsorption capacity at any time (mg/g), and C t is the concentration of Zn in the centrifugal supernatant at time “t” (mg/L).

3. Test Results and Discussion

3.1. Static Adsorption

3.1.1. Effect of Temperature and Concentration on Adsorption Property of Mixed Soil

The relationship between the initial concentration of Zn and the adsorption removal rate at 25 °C, 40 °C and 55 °C is shown in Figure 2. As can be seen from the figure, with the increase in the initial concentration of pollutants, the overall adsorption removal rate of Zn by the mixture showed a downward trend. For example, at 25 °C, 40 °C and 55 °C, the adsorption removal rate decreased from 98.45%, 99.17% and 99.72% at 3 mmol/L to 71.21%, 86.41% and 95.56% at 100 mmol/L, respectively. When the initial concentration of Zn is constant, the adsorption removal rate increases with the increase in temperature. For example, when the initial concentration of Zn was 50 mmol/L, the adsorption removal rates were 83.62%, 90.64% and 96.97% at 25 °C, 40 °C and 55 °C, respectively. With the increase in the initial concentration, the increasing trend of the temperature on the adsorption removal rate of Zn in the mixed soil was more significant.
At 25 °C, 40 °C and 55 °C, the adsorption concentration of mixed soil on Zn (the adsorption strength of mixed soil on Zn in solutions with different concentrations) and the change rule of initial concentration are shown in Figure 3. At different temperatures, the adsorption concentration of Zn increased with the increase in the initial concentration of Zn. When the temperature was 25 °C, 40 °C and 55 °C and the initial concentration was 30 and 80 mmol/L, the adsorption concentration of Zn by the mixed soil was 25.57, 28.08, 29.60 and 60.42, 70.37, 77.42 mmol/L, respectively. Temperature has a significant effect on the adsorption concentration of Zn in the mixed soil. When the concentration is fixed, the adsorption concentration of Zn in the mixed soil increases with the increase in temperature. When the concentration is 100 mmol/L, the concentration of Zn in the mixed soil is 71.09, 86.27 and 95.40 mmol/L at 25 °C, 40 °C and 55 °C, respectively.

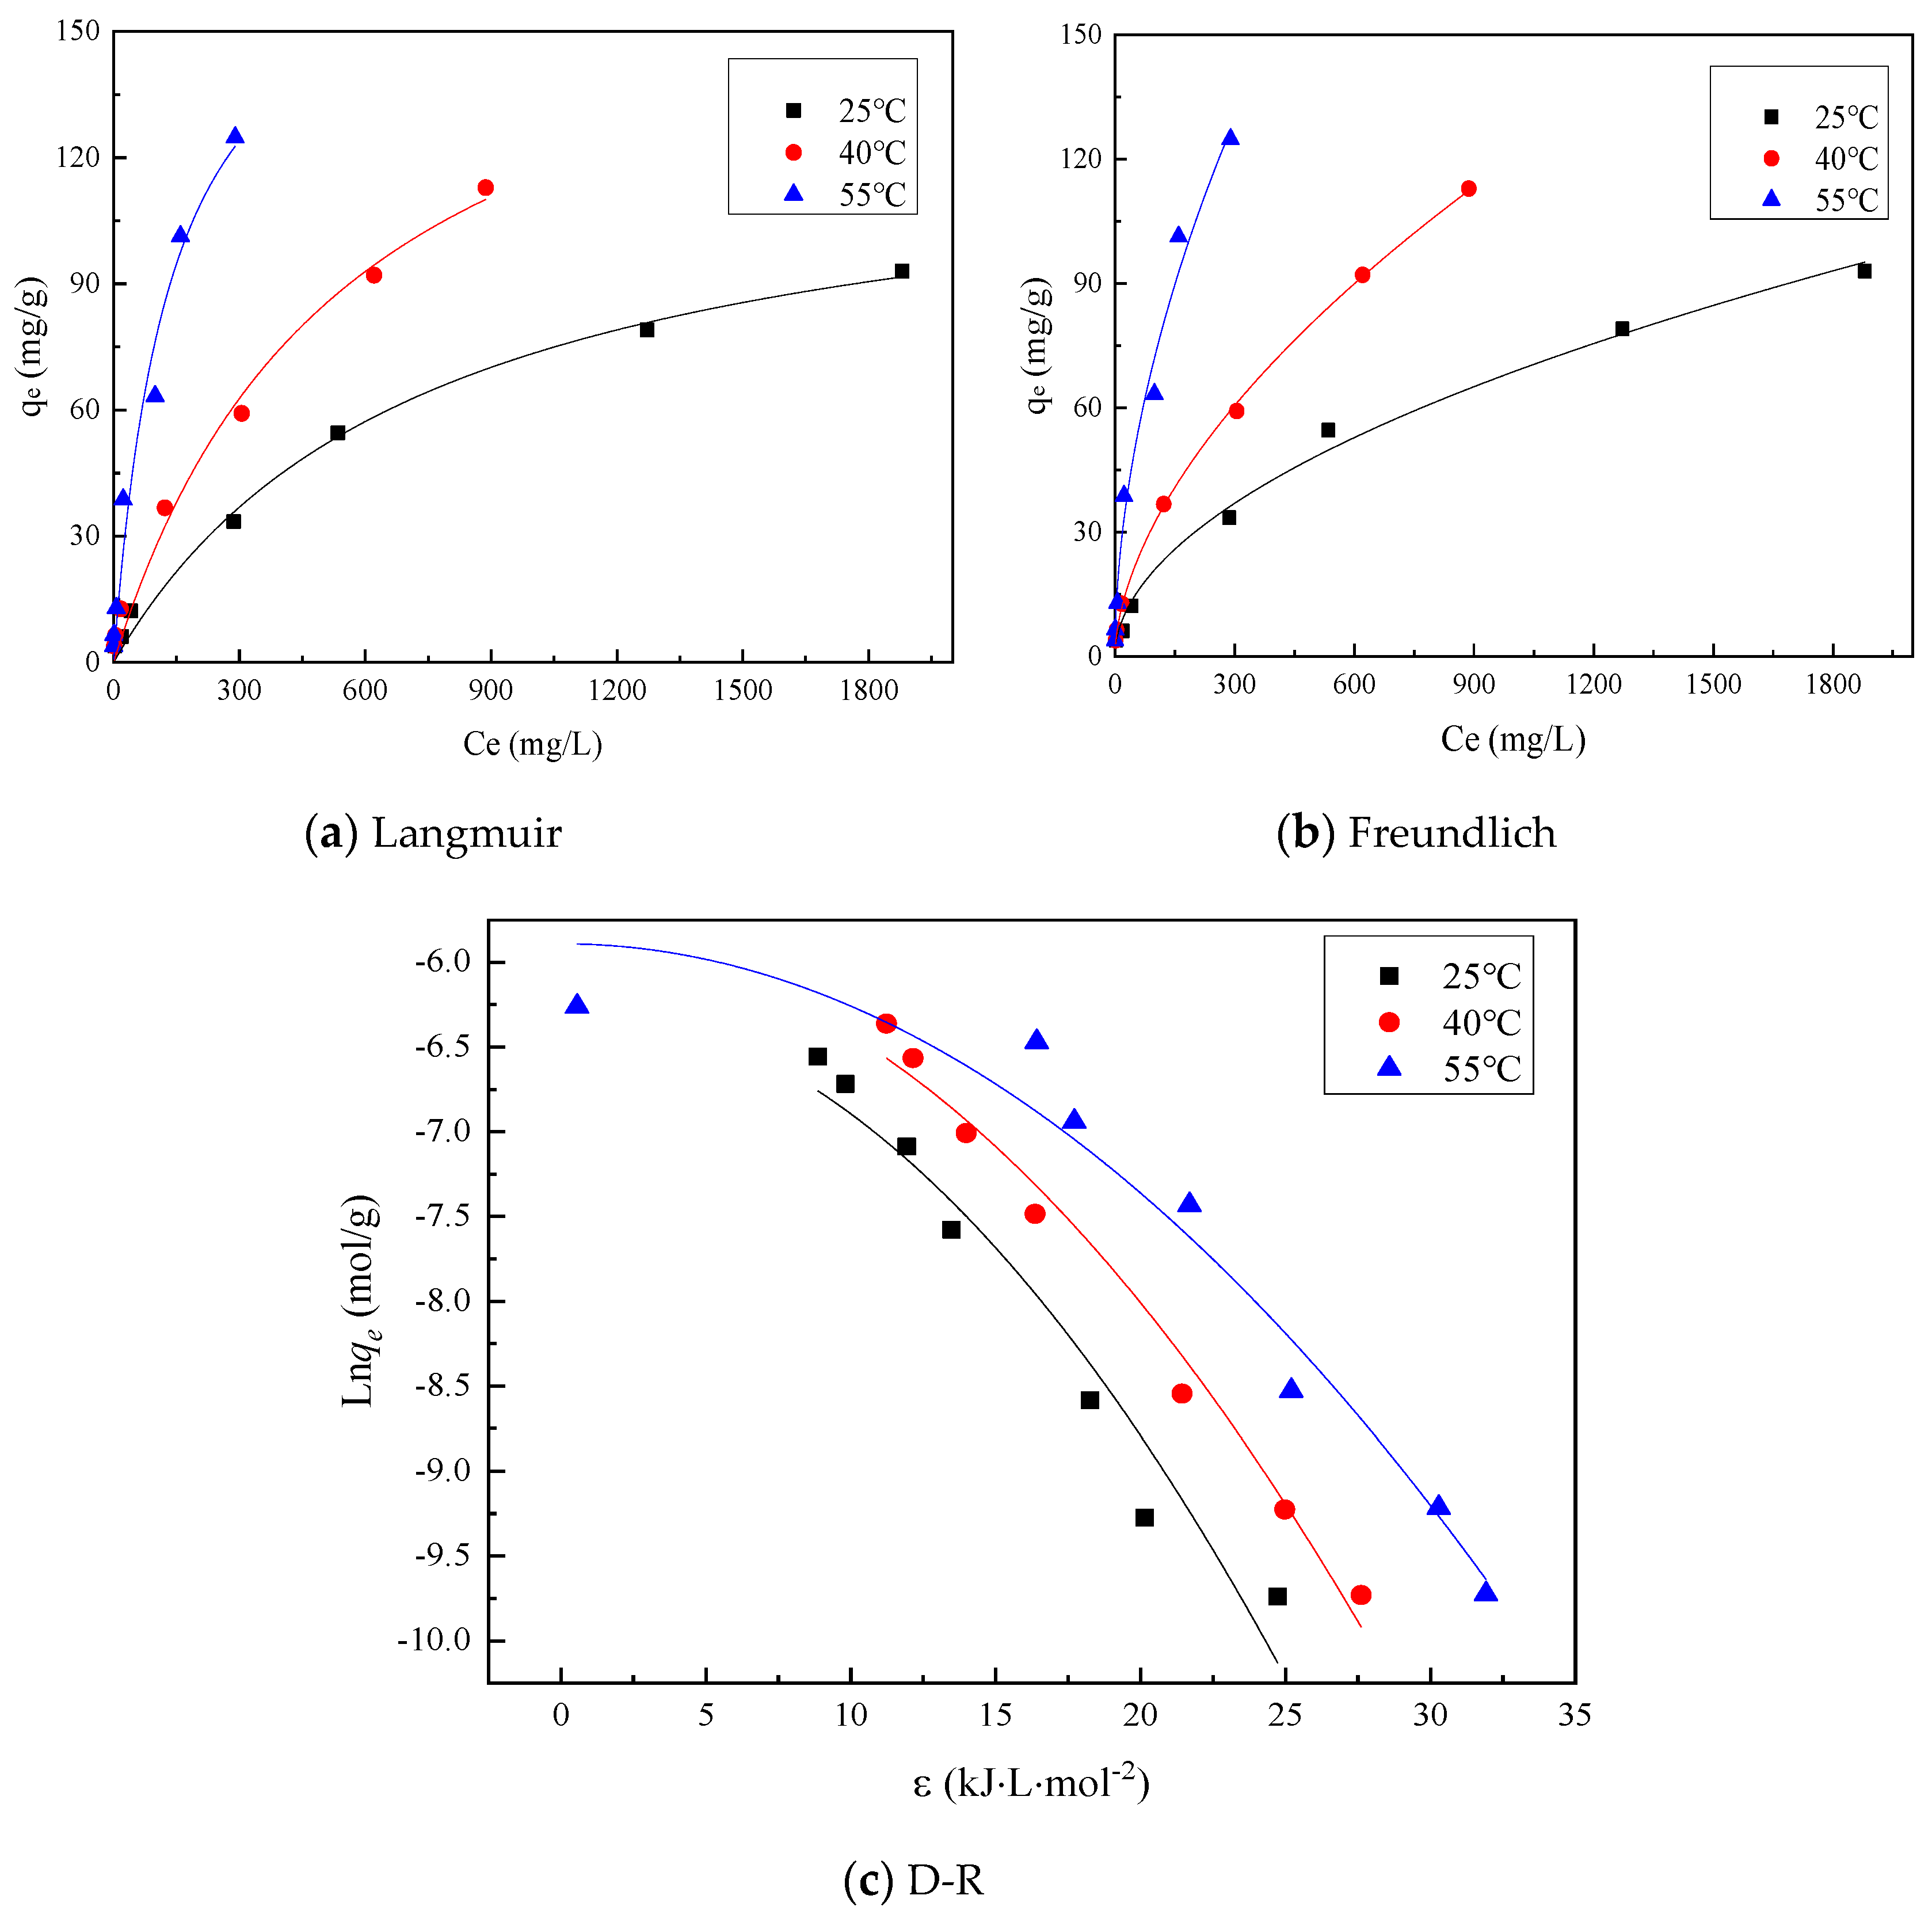
3.1.2. Adsorption Model of Zn by Mixed Soil

The Langmuir model, Freundlich model and Dubinin–Radushkevich (D-R) model were used to fit the isothermal adsorption data, respectively, in order to investigate the maximum adsorption amount of Zn and the adsorption mechanism of the mixed soil. The Equations of the three models are shown in Equations (4)–(8).
(1)
Langmuir model
c e q e = 1 k L q m + c e q m
where k L is the Langmuir isothermal parameter (L/mg), and q m is the maximum adsorption capacity (mg/g) [22,23].
(2)
Freundlich model
q e = k F C e 1 n
where k F is the Freundlich model constant (L/g) related to adsorption capacity, and n is the empirical constant, usually greater than 1. In this case, adsorption is mainly physical process, and the larger the value is, the stronger the non-linearity of the adsorption model is [24].
(3)
D-R model
ln q e = ln q m k ε 2
ε = R T ln ( 1 + 1 c e )
E = 1 2 k
where k is the relevant model constant (mol2·kJ−2), q m is the maximum adsorption capacity (mg/g), ε is the Polanyi potential, is related to the equilibrium concentration c e , R is the ideal gas constant (J·mol−1·K−1), T is the thermodynamic temperature (K), E is the average adsorption free energy (kJ/mol). When 1 kJ/mol < |E| < 8 kJ/mol, for physical adsorption; 8 kJ/mol < |E| < 16 kJ/mol, ion exchange; |E| > 16.0 kJ/mol, chemical adsorption [25,26,27,28,29].
The Langmuir model, Freundlich model and D-R model were, respectively, fitted for the adsorption of heavy metal Zn by mixed soil at 25 °C, 40 °C and 55 °C, and the fitting results are shown in Figure 4. As can be seen from Figure 4, each model can well reflect the adsorption capacity at different temperatures. The fitting parameters are shown in Table 3. According to the correlation coefficient R2 in Table 3, Langmuir models can effectively reflect the adsorption characteristics of heavy metal Zn by mixed soil at temperatures of 25, 40 and 55 °C. Additionally, the constant n in Freundlich model is greater than 1, indicating that the adsorption of Zn by mixed soil is nonlinear. The correlation coefficient R2 ≥ 0.96 of Langmuir model fitting, and the maximum adsorption capacity of monolayer soil at 25, 40 and 55 °C is 127.56, 179.02 and 179.38 mg/g, respectively. The D-R model is used to calculate the adsorption energy of mixed soil for Zn at 25, 40 and 55 °C. The |E| is between 8 and 16 kJ/mol, indicating that the adsorption of Zn by mixed soil is chemical adsorption, and there is ion exchange.

3.2. Dynamic Adsorption

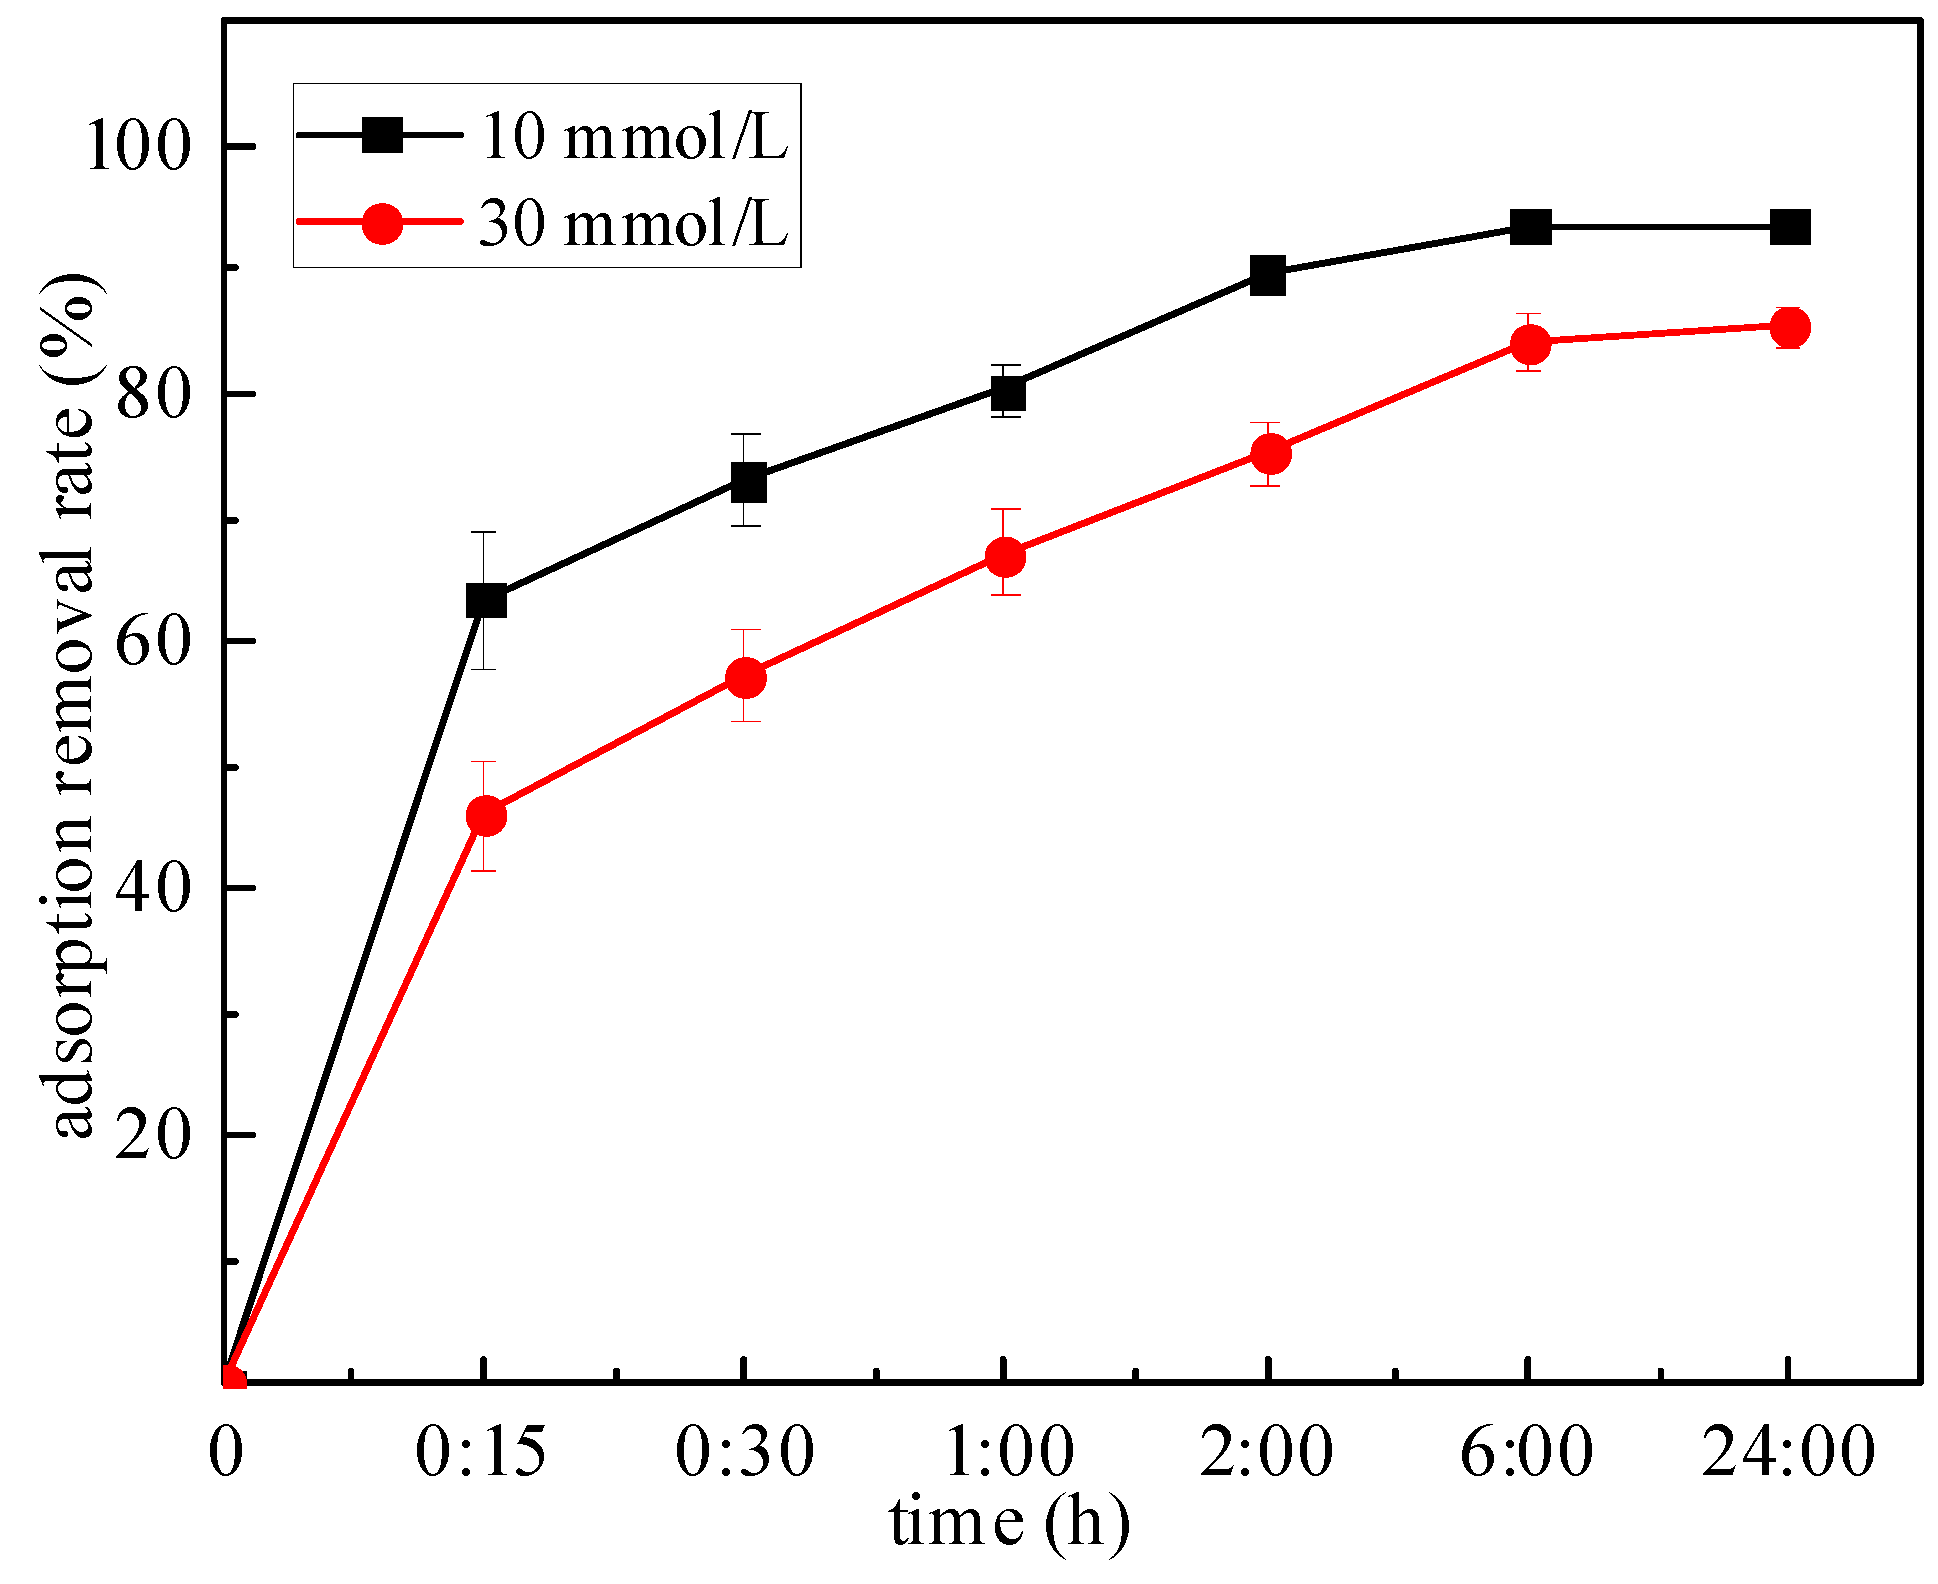
3.2.1. Dynamic Adsorption Characteristic

The relationship between the adsorption removal rate of Zn by mixed soil and the adsorption time is shown in Figure 5. When the initial concentration was 10 and 30 mmol/L, the adsorption removal rates increased with the increase in time and finally tended to be stable. For the adsorption of Zn by the mixed soil, the adsorption rate is faster in the early stage, within 15 min, and the adsorption removal rate changes greatly, then increases slowly, and reaches the adsorption equilibrium in about 6 h. If the initial concentration of Zn was 30 mmol/L, the adsorption removal rates were 63.49%, 73.06%, 80.29%, 89.64%, 93.59% and 93.66% at 0.25, 0.5, 1 h, 2, 6 and 24 h, respectively. When the adsorption time is constant, the adsorption removal rate of Zn decreases with the increase in the concentration. For example, when the adsorption time is 0.5 h, the adsorption removal rate decreases from 73.06% at 10 mmol/L to 57.17% at 30 mmol/L, respectively.

3.2.2. Dynamic Adsorption Model

To understand the adsorption mechanism of Zn on the mixture, sorption kinetics were analyzed using pseudo first order model (PFO), pseudo second order model (PSO) and intra-particle diffusion model. The expressions are shown in (9)–(11). The influence of concentration on the adsorption rate is explored and the control mechanism of heavy metal Zn adsorption in soil is revealed.
(1)
Pseudo first order (PFO) model
q t = q e ( 1 e k 1 t )
where q t is the adsorption capacity of unit soil at any time (mg/g), and k 1 is the PFO model constant (g·mg·h−1). [30]
(2)
Pseudo second order (PSO) model
t q t = 1 k 2 q e 2 + t q e
where k 2 is the PSO model constant (g·mg·h−1), t is time (h) [31].
(3)
Intra-particle diffusion (IP) model
In general, the diffusion energy in the particles determines the rate of the whole adsorption process for the porous adsorption materials. The simplified intra-particle diffusion equation is as follows:
q t = { k int t 0.5 + C ( t < t e ) q e ( t t e )
where k int is the diffusion rate constant within the particle (Mg·g−1·min−0.5), C is the intercept, which is related to the thickness of the boundary layer [32].
Figure 6, Figure 7 and Figure 8 are the fitting curves of the PFO model, the PSO model and the intra-particle diffusion model for the adsorption of Zn by the mixed soil, respectively. According to the fitting correlation coefficient R2 in Table 4, the adsorption of Zn by the mixed soil with different initial concentrations conforms to the PSO model, and the R2 ≥ 0.99. The adsorption parameter K2 of mixed soil with an initial concentration of 10 mmol/L Zn was 0.967 g·mg·h−1, which was higher than that of 0.171 g·mg·h−1 with an initial concentration of 30 mmol/L, indicating that the higher the initial concentration of Zn, the lower the adsorption rate of Zn in mixed soil.
It can be seen from Figure 8 that the curve is divided into two sections, corresponding to non-equilibrium adsorption section and equilibrium adsorption section, respectively. When the concentration is 10 and 30 mmol/L, t e is 2 h and 6 h, respectively, the fitting equilibrium adsorption amount is 12.05 and 33.20 mg/g, respectively, which is close to the 12.23 and 33.45 mg/g obtained from the test. According to the fitting parameters of the intra-particle diffusion model in Table 4, C of the mixed soil for the two initial concentrations of Zn is not equal to 0, and the non-equilibrium adsorption stage curve does not pass through the origin, indicating that the adsorption mode of the mixed soil for Zn is controlled by both intra-particle diffusion and membrane diffusion. The intra-particle diffusion model can reflect the adsorption process and rate. The adsorption process is composed of two successive steps. The first stage is a gradual adsorption stage, and the adsorption rate depends on the diffusion rate. The second stage is the equilibrium stage; the residual Zn2+ concentration in the solution decreases, the concentration difference between soil and water decreases, the diffusion rate between particles decreases, and the adsorption reaction basically reaches equilibrium [31].

3.3. Adsorption Thermodynamics

According to the thermodynamic parameters of Δ G 0 , Δ H 0 and Δ S 0 , the effect of temperature on the adsorption of Zn on the mixed soil is analyzed. The thermodynamic parameters are calculated by Equations (12) and (13).
Δ G 0 = Δ H 0 T Δ S 0
ln K c = Δ S 0 R Δ H 0 R T
where K c is the partition coefficient (the ratio of solid phase equilibrium concentration to solution equilibrium concentration), T is the temperature (K), R is the ideal gas constant (8.314 J·mol−1·K−1), Δ G 0 is Gibbs energy change (kJ·mol−1), Δ H 0 is the enthalpy change (kJ·mol−1), and Δ S 0 is the entropy change (kJ·mol−1).
The reaction is carried out under isothermal and isobaric conditions. The degree of difficulty of the reaction is determined by Δ G 0 to a certain extent, the value of Δ G 0 is negative and the larger the absolute value, the easier the reaction occurs. Δ H 0 is “+” for endothermic reaction, and “−” for exothermic reaction. Δ S 0 is a measure of the disorder of a system, as a criterion for judging the direction of spontaneous reactions.
The fitting results of the thermodynamic model for the adsorption of Zn by mixed soil are shown in Figure 9. In the figure, the slope and intercept of the fitting line between lnKc and 1/T were calculated for the Δ H 0 and Δ S 0 . The adsorption thermodynamic parameters are listed in Table 5. The concentration of Zn is constant and all of Δ G 0 are negative and decrease with the increase in temperature, indicating that the adsorption of Zn by mixed soil is spontaneous and spontaneously increasing with the increase in temperature. For example, when the concentration of Zn was 30 mmol/L, the values of Δ G 0 at 25 °C, 40 °C and 55 °C were −4.020 kJ/mol, −7.836 kJ/mol and −11.651 kJ/mol, respectively. The Δ H 0 of Zn adsorption reaction was positive at different concentrations, indicating that the adsorption reaction was an endothermal process. For example, when the initial concentration of Zn was 3, 5, 10, 30, 50, 80 and 100 mmol/L, the values of Δ H 0 were 46.864, 82.171, 52.153, 71.823, 49.457, 62.658 and 58.498 kJ/mol, respectively. Therefore, increasing the temperature was beneficial to the adsorption of Zn by mixed soil. The values of Δ S 0 of Zn adsorption by mixed soil are all positive, indicating that the reaction is an irreversible process driven by entropy and desorption is not easy to occur [33].

4. Analysis of Adsorption Mechanism
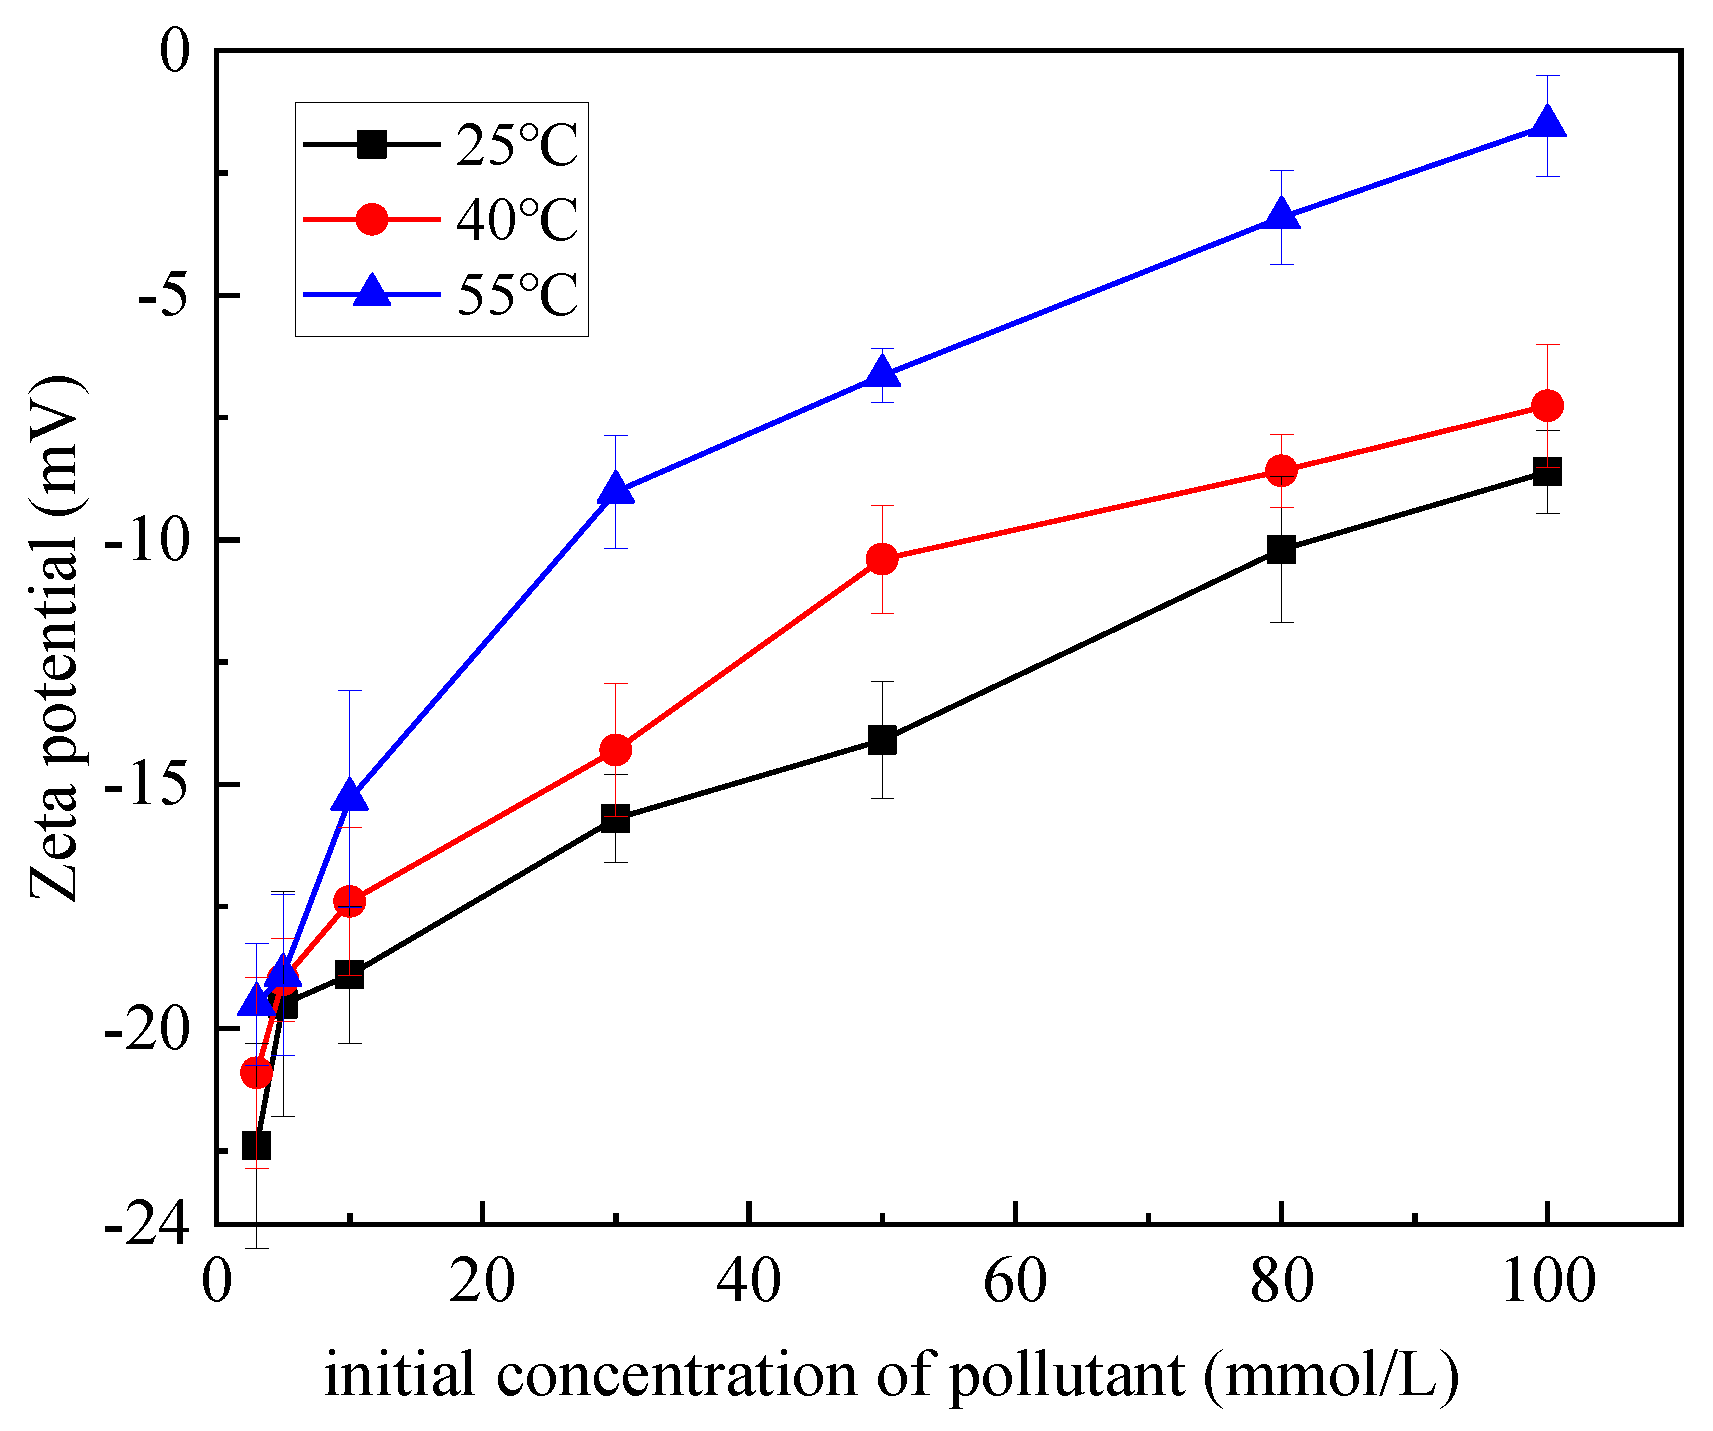
4.1. Zeta Potential

Figure 10 shows the relationship between the initial concentration of heavy metal Zn and the zeta potential of the suspension system of mixed soil at 25 °C, 40 °C and 55 °C. It can be seen from the figure that at 25 °C, 40 °C and 55 °C, zeta potential gradually increases with the increase in the initial concentration of Zn. For example, when the temperature was 25 °C, 40 °C and 55 °C, the zeta potential value increased from −22.4 mV, −20.9 mV and −19.5 mV at the initial concentration of 3 mmol/L to −8.61 mV, −7.26 mV and −1.53 mV at the concentration of 100 mmol/L, respectively. When the initial concentration of Zn is constant, the zeta potential of the suspension system of mixed soil and Zn increases with the increase in temperature. For example, when the concentration of Zn is 50 mmol/L, the zeta potential increases from −14.1 mV at 25 °C to −10.4 mV at 40 °C and −6.64 mV at 55 °C. Adsorption of Zn by mixed soil is an endothermic process, and the amount of adsorption increases with the increase in reaction temperature. With the increase in reaction temperature, on the one hand, the number of active points available on the surface of the adsorbent is increased, and more metal cations can be adsorbed [34]. On the other hand, the thickness of double electric layer on the surface of the mixed soil decreases, and the negative potential on the surface of the soil particles weakens, which is caused by the adsorption of more cations.

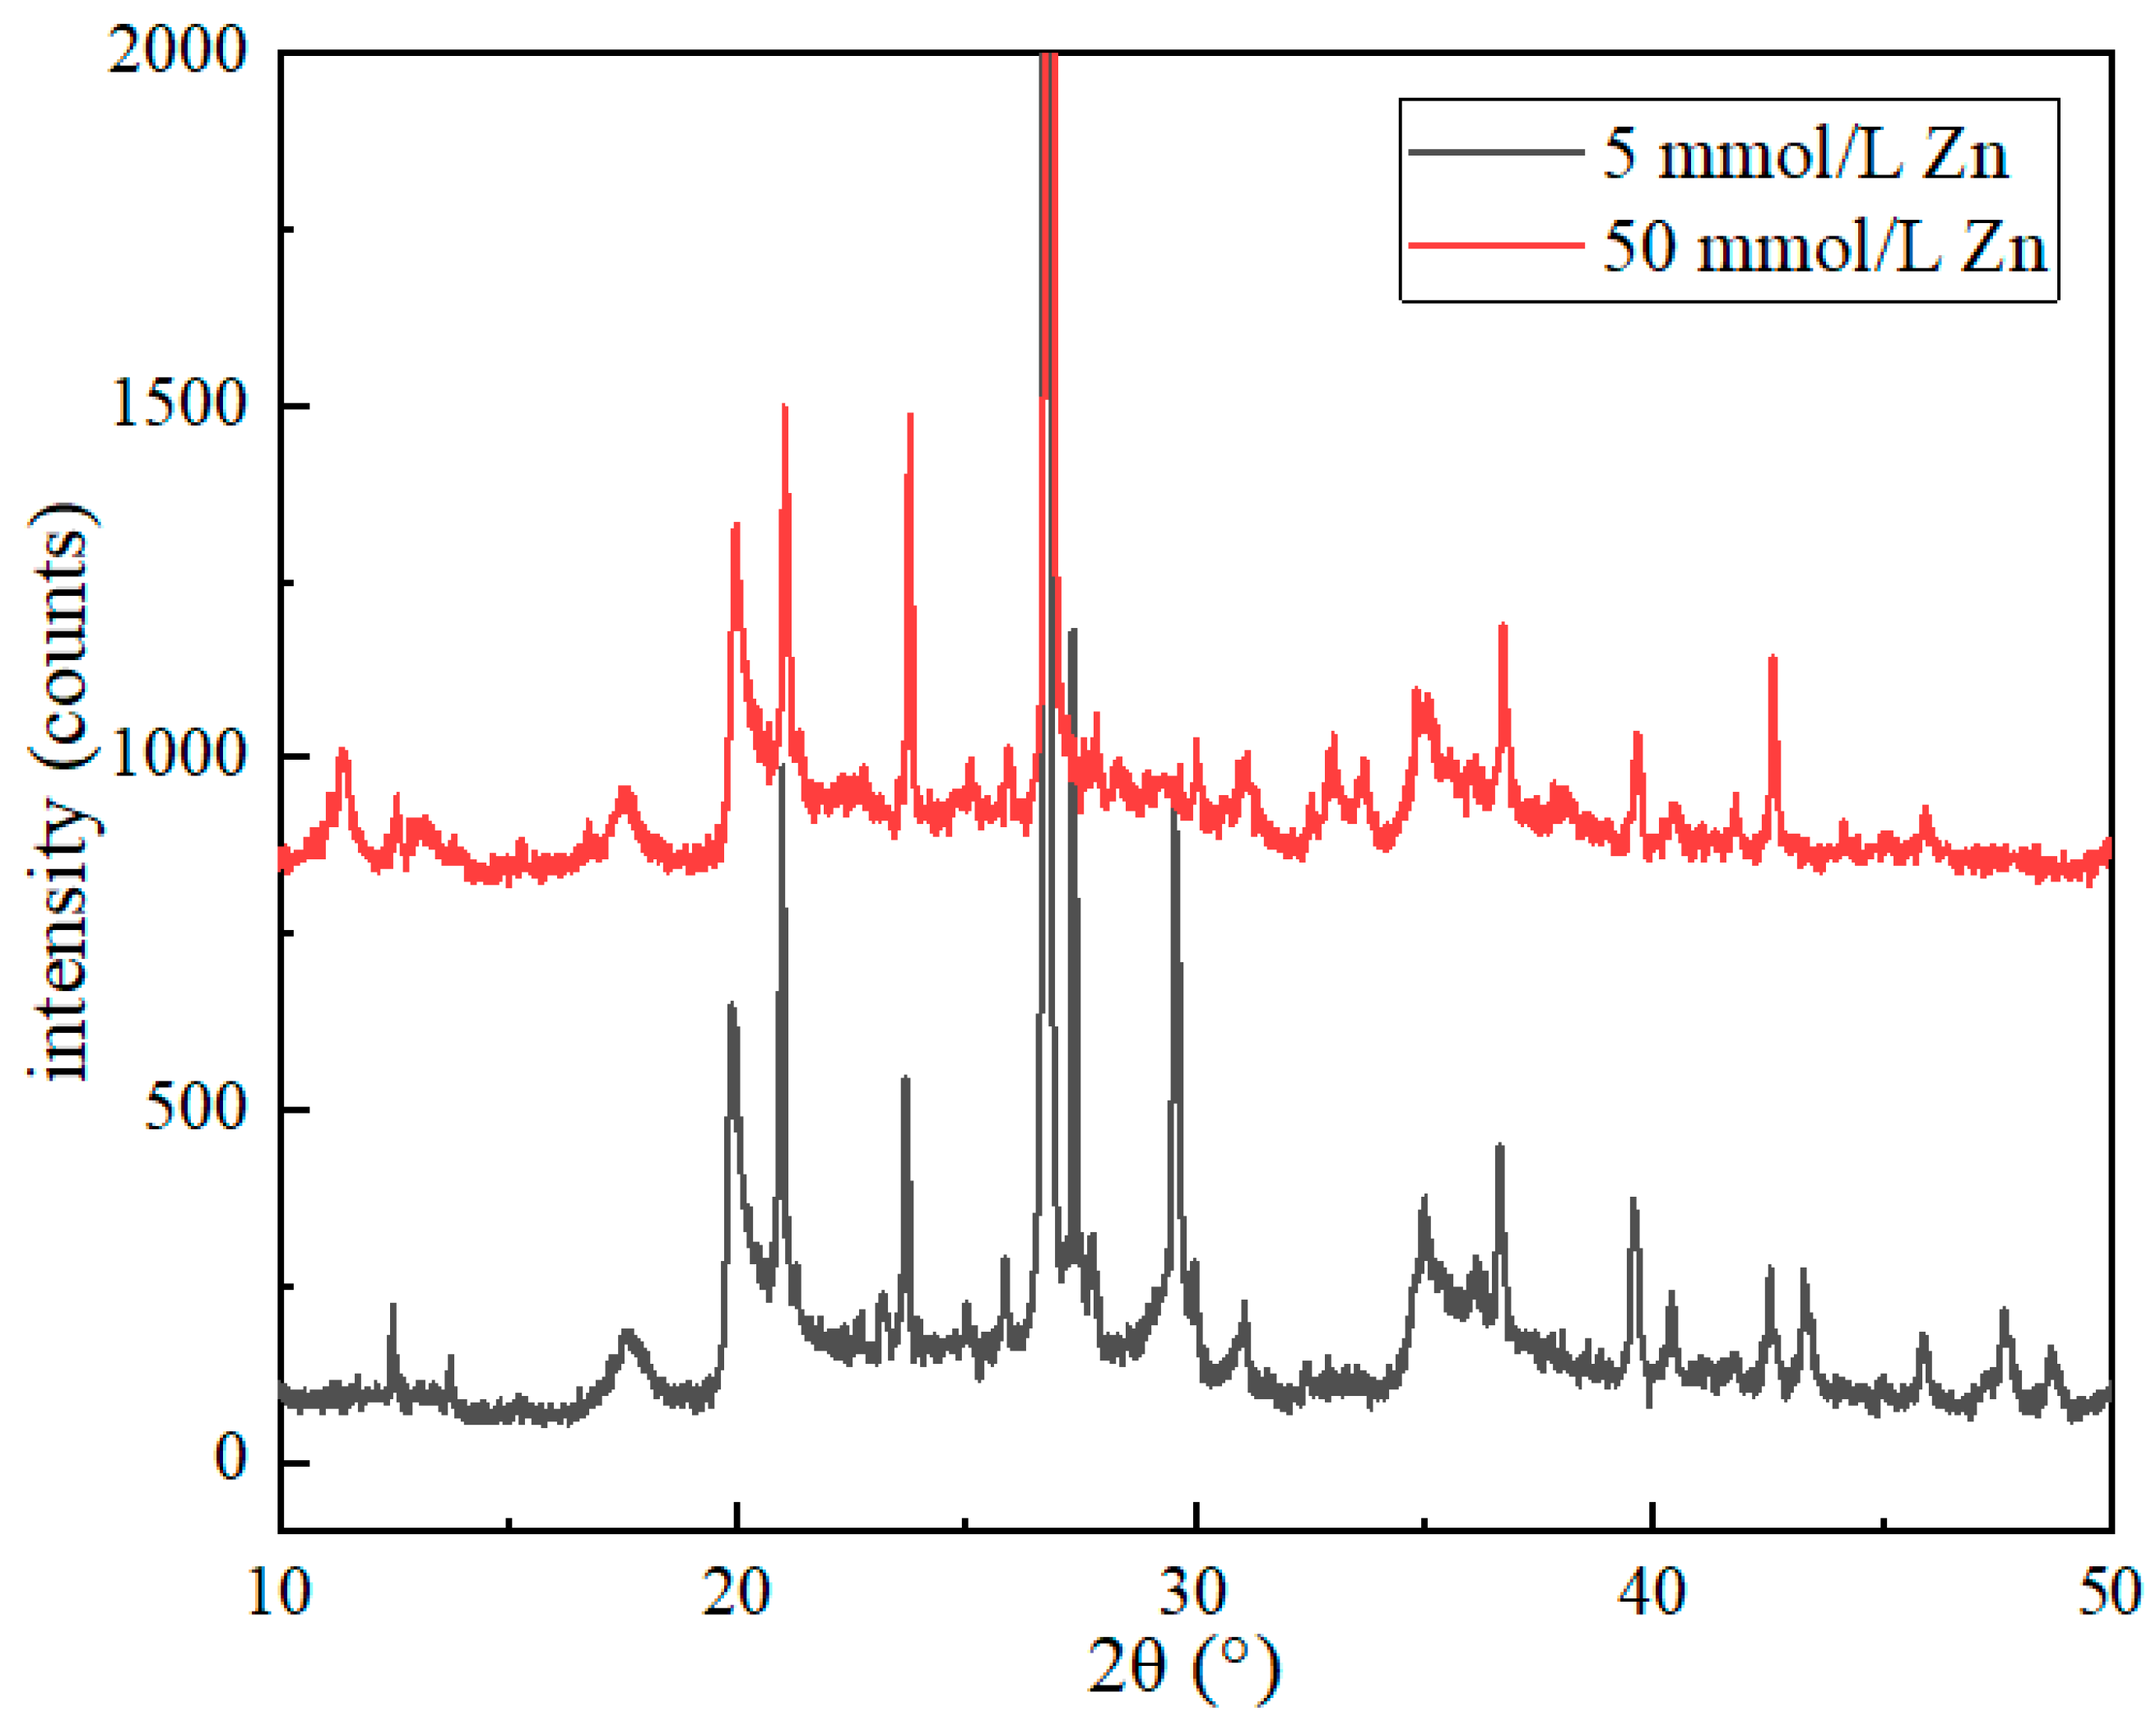
4.2. X-ray Diffraction

Figure 11 shows the relationship between the initial concentration of pollutants and XRD (Bruke D8 Advance, Sigersdorff, Germany) (25 °C). It can be seen from the figure that in 2θ = 10°–15°, the crystal plane characteristic diffraction peak of the bentonite sample with the initial pollutant concentration of 50 mmol/L shifted to the left as a whole compared with the low initial concentration, and a new diffraction peak appeared, indicating that Zn2+ entered the interlayer of bentonite and interlayer adsorption existed. At 2θ = 20°–50°, the peak of the characteristic diffraction peak decreases, and there are different degrees of characteristic peaks decreasing or disappearing, indicating that the bentonite undergoes ion exchange with the increase in the Zn2+ concentration in the pollutant, and the original crystallinity of the sample has changed, indicating that ion exchange occurs between Zn2+ and bentonite surface ions.

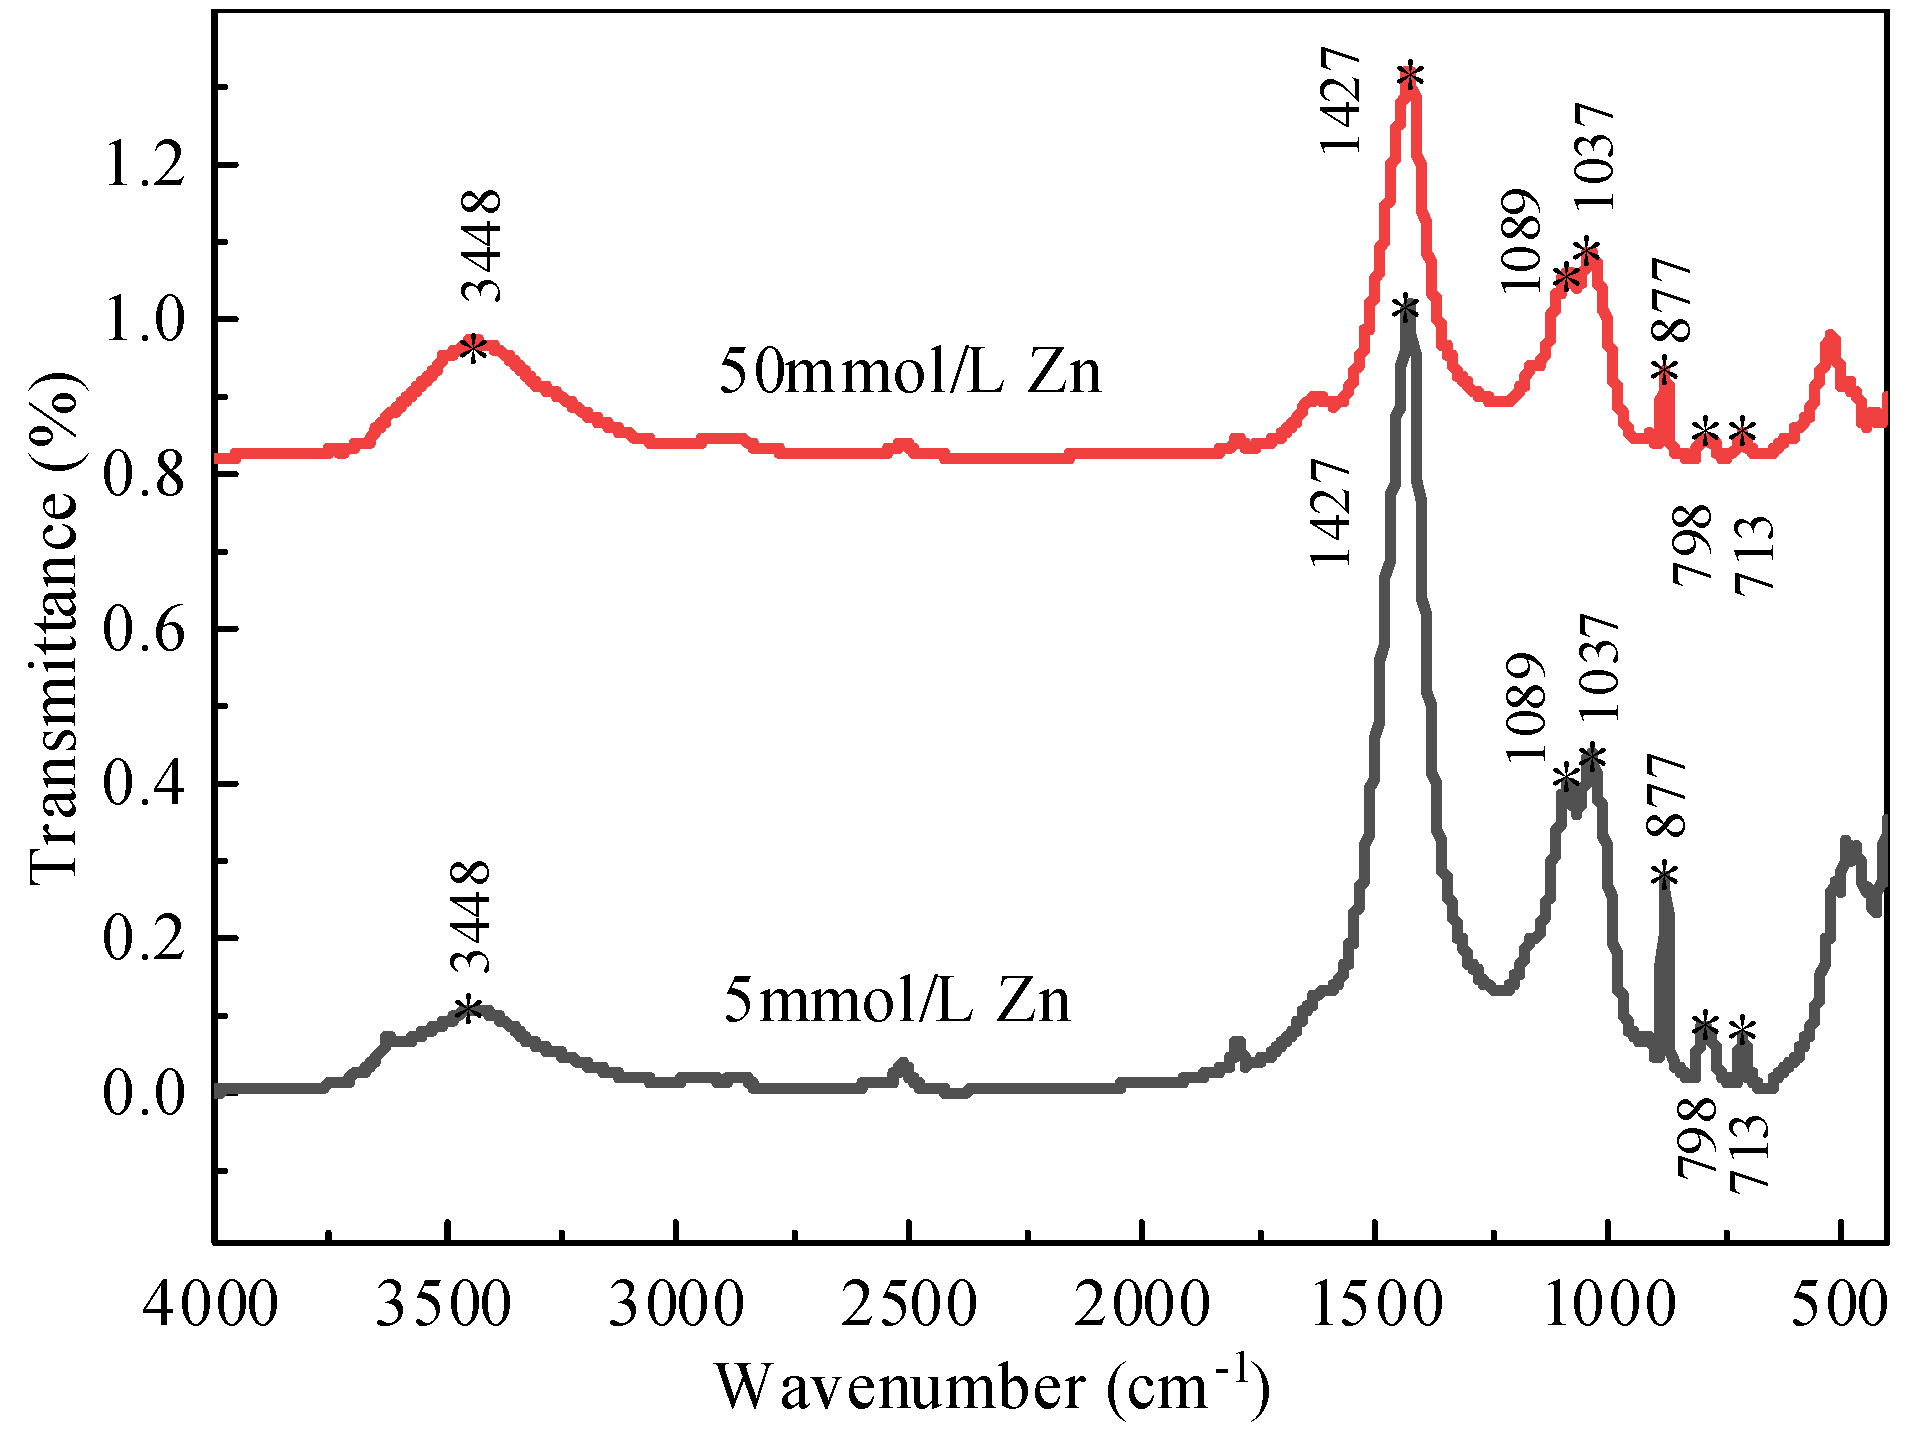
4.3. The Fourier Transform Infrared Spectroscopy

The FTIR (Thermo Scientific Nicolet 10, Waltham, MA, USA) diagram of bentonite adsorbing different concentrations of Zn2+ (25 °C) is shown in Figure 12. Scanning from 4000 to 400 cm−1, the basic framework of bentonite remains unchanged after adsorbing different concentrations of Zn2+. Furthermore, 3448 cm−1 is the elastic vibration of the water molecules H-O-H between the bentonite layers, and near 1427 cm−1 is the special vibration of the Si-O-Si bond. The results show that the changes of the absorption peak before and after the absorption of different concentrations of Zn2+ by the bentonite are basically the same—after adsorption, heavy metal ions enter the interlayer. When the concentration of Zn2+ increases, the peak intensity of the M Al-OH (M means metal cation) shock peak at 877 cm−1 decreases, which means that ion exchange has occurred between bentonite and Zn2+.

5. Conclusions

(1)
With a certain temperature, the higher the initial concentration of Zn, the smaller the adsorption removal rate, and the higher the adsorption concentration. At the same concentration, the removal rate and adsorption concentration of Zn in mixed soil increased with the increase in temperature. The higher the initial concentration is, the more significant the influence of temperature on the adsorption capacity of Zn is.
(2)
The adsorption of Zn by mixed soil is mainly an ion exchange process. The fitting results show that the adsorption of Zn by mixed soil conforms to the PSO dynamic adsorption model. According to the intra-particle diffusion model, the adsorption mode of Zn by mixed soil is controlled by both intra-particle diffusion and membrane diffusion.
(3)
Thermodynamic analysis shows that the sum Δ H 0 and Δ S 0 of Zn adsorption by mixed soil is positive, indicating that the adsorption reaction is an endothermic process and the adsorption reaction is irreversible, and desorption does not occur easily; Δ G 0 are negative, and decrease with the increase in temperature, indicating that the adsorption of Zn by mixed soil is a spontaneous process and the spontaneity increases with the increase in temperature.
(4)
The zeta potential test results showed that the zeta potential value gradually increased with the increase in the initial concentration of Zn at 25 °C, 40 °C and 55 °C. When the concentration is constant, the zeta potential of the suspension system between the mixed soil and Zn increases with the increase in temperature, and the thickness of the double electric layer on the surface of the mixed soil decreases, which results in the weakening of the negative potential on the surface of the soil particles and affects the adsorption performance of the mixed soil. XRD and FTIR results show that the adsorption of Zn2+ by bentonite is interlayer and ion exchange occurs with the ions on the surface of bentonite.

Author Contributions

Conceptualization, S.X., Y.F., W.W. and Z.W.; validation, Y.F., W.W.; formal analysis, Y.F., W.W.; investigation, Y.F., W.W., C.L., M.B.; data curation, Y.F.; writing—original draft preparation, Y.F., W.W., S.X.; supervision, S.X., Z.W. All authors have read and agreed to the published version of the manuscript.

Funding

This project was supported by the Zhejiang Provincial Natural Science Foundation (LY20E080022).

Institutional Review Board Statement

This study did not require ethical approval.

Informed Consent Statement

Informed consent was obtained from all subjects involved in the study.

Data Availability Statement

Data sharing not applicable.

Conflicts of Interest

The authors declare no conflict of interest.

References

  1. Chen, Y.-M. A fundamental theory of environmental geotechnics and its application. Chin. J. Geotech. Eng. 2014, 36, 1–46. [Google Scholar]
  2. Xue, Q.; Liu, S.; Zhan, L.; Hu, L.; Du, Y. Environmental geotechnics: State-of-the-art of theory, testing and application to practice. China Civ. Eng. J. 2020, 53, 80–94. [Google Scholar]
  3. Du, Y.J.; Jin, F.; Liu, S.Y.; Chen, L.; Zhang, F. Review of stabilization/solidification technique for remediation of heavy metals contaminated lands. Rock Soil Mech. 2011, 32, 116–124. [Google Scholar]
  4. Chen, Y.-M.; Shi, J.-Y.; Zhu, W.; Zhan, L.-T. A review of geoenvironmental engineering. China Civ. Eng. J. 2012, 45, 165–182. [Google Scholar]
  5. Zhang, W.J.; Wen-Qiang, J.I.A.; Zhang, G. Advection and dispersion of Cl- in clay-bentonite barriers. Chin. J. Geotech. Eng. 2013, 35, 2076–2081. [Google Scholar]
  6. Fan, R.D.; Du, Y.J.; Chen, Z.B.; Liu, S.Y. Compressibility and permeability characteristics of lead contaminated soil-bentonite vertical cutoff wall backfills. Chin. J. Geotech. Eng. 2013, 35, 841–848. [Google Scholar]
  7. Ministry of Housing and Urban-Rural Development. PRC.CJJ 176-2012 Technical Specification for Geotechnical Engineering of Sanitary Landfill site for Household Garbage; China Building Industry Press: Beijing, China, 2012.
  8. Chen, Y.M.; Wang, Y.Z.; Xie, H.J.; Jiang, Y.S. Adsorption characteristics of loess-modified natural silt towards Pb(II): Equilibrium and kinetic tests. Chin. J. Geotech. Eng. 2014, 36, 1185–1194. [Google Scholar]
  9. Liu, R.; Du, Y.-J.; Mei, D.-B.; Jiang, N.-J.; Mei, Z.-H.; Feng, X.-W. Laboratory study of soil-bentonite vertical barrier on heavy mental migration retardation. J. Disaster Prev. Mitig. Eng. 2018, 38, 815–821. [Google Scholar]
  10. Shi, M.-M.; Liu, M.-Y.; Zeng, Y.-L.; Su, S.-P.; Chen, Y.-X. Adsorption properties of heavy metal ions Zn2+, Pb2+ and Cd2+ by diatomite and bentonite. Environ. Chem. 2012, 31, 162–167. [Google Scholar]
  11. Wang, Y.-X.; Wang, H.; Lu, P. Adsorption and kinetics of heavy metal (Zn) over biochars in solution. Chem. Ind. Eng. Prog. 2019, 38, 5142–5150. [Google Scholar]
  12. Doğan, M.; Türkyilmaz, A.; Alkan, M.; Demirbaş, Ö. Adsorption of copper(II) ions onto sepiolite and electrokinetic properties. Desalination 2009, 238, 257–270. [Google Scholar] [CrossRef]
  13. Wang, Q.; Li, J.-S.; Poon, C.-S. Using incinerated sewage sludge ash as a high-performance adsorbent for lead removal from aqueous solutions: Performances and mechanisms. Chemosphere 2019, 226, 587–596. [Google Scholar] [CrossRef]
  14. El-Enein, S.A.; Okbah, M.A.; Hussain, S.G.; Soliman, N.F.; Ghounam, H.H. Adsorption of Selected Metals Ions in Solution Using Nano-Bentonite Particles: Isotherms and Kinetics. Environ. Process. 2020, 34, 1–15. [Google Scholar] [CrossRef]
  15. Guo, S.H.; Xu, Z.J.; Li, F.W.; Xu, D.D. Adsorption of Pb(II), Zn(II) from aqueous solution by biochars. Chin. J. Environ. Eng. 2015, 9, 3215–3222. [Google Scholar]
  16. Chwastowski, J.; Bradło, D.; Żukowski, W. Adsorption of Cadmium, Manganese and Lead Ions from Aqueous Solutions Using Spent Coffee Grounds and Biochar Produced by Its Pyrolysis in the Fluidized Bed Reactor. Materials 2020, 13, 2782. [Google Scholar] [CrossRef]
  17. Alandis, N.M.; Aldayel, O.A.; Mekhemer, W.K.; Hefne, J.A.; Jokhab, H.A. Thermodynamic and kinetic studies for the adsorption of Fe(III) and Ni(II) ions from aqueous solution using natural bentonite. J. Dispers. Sci. Technol. 2010, 31, 1526–1534. [Google Scholar] [CrossRef]
  18. Somasundaran, P.; Fuerstenau, D.W. Mechanisms of alkyl sulfonate adsorption at the alumina-water interface1. J. Phys. Chem. 2002, 70, 90–96. [Google Scholar] [CrossRef]
  19. Tang, X.; Li, Z.; Chen, Y. Behaviour and mechanism of Zn(II) adsorption on Chinese loess at dilute slurry concentrations. J. Chem. Technol. Biotechnol. 2008, 83, 673–682. [Google Scholar] [CrossRef]
  20. Alkan, M.; Demirbas, O.; Dogan, M. Zeta potential of unexpanded and expanded perlite samples in various electrolyte media. Microporous Mesoporous Mater. 2005, 84, 192–200. [Google Scholar] [CrossRef]
  21. Pehlivan, E.; Altun, T.; Cetin, S.; Bhanger, M.I. Lead sorption by waste biomass of hazelnut and almond shell. J. Hazard. Mater. 2009, 167, 1203–1208. [Google Scholar] [CrossRef]
  22. Langmuir, I. The constitution and fundamental properties of solids and liquids: Part I. Solids. J. Am. Chem. Soc. 1916, 38, 2221–2295. [Google Scholar] [CrossRef] [Green Version]
  23. Langmuir, I. The constitution and fundamental properties of solids and liquids. Part II. Liquids. Pergamon 1917, 184, 1848–1906. [Google Scholar] [CrossRef]
  24. Freundlich, H. Over the adsorption in solution. J. Phys. Chem. 1906, 57, 1100–1107. [Google Scholar]
  25. Dubinin, M.M.; Zaverina, E.D.; Radushkevich, L.V. Sorption and Structure of Active Carbons I. Adsorption of Organic Vapors. Zhurnal Fizicheskoi Khimii 1947, 21, 1351–1362. [Google Scholar]
  26. Giles, C.H.; Smith, D.; Huison, A. A general treatment and classification of the solute sorption isotherms: I Theoretical. J. Colloid Interface Sci. 1974, 47, 755–765. [Google Scholar] [CrossRef]
  27. Do, D.D. Adsorption Analysis: Equilibrium and Kinetics; Imperial College Press: London, UK, 1988. [Google Scholar]
  28. Li, Z.-Z. Mechanism of Sorption, Desorption, Diffusion and Remediation of Heavy Metals in Soils; Zhejiang University: Hangzhou, China, 2009. [Google Scholar]
  29. Zhu, J.; Wu, Q.D.; Wang, P.; Li, K.L.; Lei, M.J.; Zhang, W.L. Application of Classical Isothermal Adsorption Models in Heavy Metal Ions Diatomite System and Related Problems. Environ. Sci. 2013, 34, 4341–4348. [Google Scholar]
  30. Lagergren, S. About the theory of so-called adsorption of soluble substances. Kungliga Svenska Vetenskapsakademiens Handlingar Band 1898, 24, 1–39. [Google Scholar]
  31. Ho, Y.S. Review of second-order models for adsorption systems. J. Hazard. Mater. 2006, 136, 681–689. [Google Scholar] [CrossRef] [Green Version]
  32. Aydin, S.; Kajjumba, G.W.; Emik, S.; Öngen, A.; Özcan, H.K. Modelling of Adsorption Kinetic Processes—Errors, Theory and Application. IntechOpen 2018, 1–19. Available online: https://cdn.intechopen.com/pdfs/63161.pdf (accessed on 10 March 2021). [CrossRef] [Green Version]
  33. Li, A.-M.; Wu, H.-S.; Zhang, Q.-X. The preparation and immobilized on magnetic composite microspheres. Chem. Biodivers. 2004, 22, 259–267. [Google Scholar]
  34. Meena, A.K.; Mishra, G.K.; Rai, P.K.; Rajagopal, C.; Nagar, P.N. Removal of heavy metal ions from aqueous solutions using carbon aerogel as an adsorbent. J. Hazard. Mater. 2005, 122, 161–170. [Google Scholar] [CrossRef]
Figure 1. Standard solution curve of Zn.
Processes 09 00619 g001
Figure 2. Relationship between initial concentration and adsorption removal rate.
Processes 09 00619 g002
Figure 3. Relationship between initial concentration and adsorption concentration.
Processes 09 00619 g003
Figure 4. Adsorption model.
Processes 09 00619 g004
Figure 5. Relationship between adsorption time and removal rate.
Processes 09 00619 g005
Figure 6. Pseudo first order model.
Processes 09 00619 g006
Figure 7. Pseudo second order model.
Processes 09 00619 g007
Figure 8. Intra-particle diffusion model.
Processes 09 00619 g008
Figure 9. Adsorption thermodynamic model.
Processes 09 00619 g009
Figure 10. Influence of temperature on zeta potential of suspension system.
Processes 09 00619 g010
Figure 11. Relationship between initial concentration of pollutants and XRD patterns (25 °C).
Processes 09 00619 g011
Figure 12. FTIR spectra of bentonite adsorbed Zn2+ of different concentrations (25 °C).
Processes 09 00619 g012
Table 1. Composition of bentonite.
Chemical
Composition
SiO2AL2O3CaOMgONa2OFe2O3TiO2
Content (%)68.514.090.632.453.562.370.32
Table 2. Test scheme.
TypeSolid Quality
(g)
The Quality of the Liquid
(g)
Solution Concentration (mmol/L)Time
(h)
T (°C)
Static balance102003, 5, 10,
30, 50, 80, 100
2425
40
55
Dynamic adsorption10, 300.25, 0.5, 1, 2, 6, 2425
Potential3, 5, 10,
30, 50, 80, 100
25
40
55
Table 3. Adsorption model parameters.
ModelParameter25 °C40 °C55 °C
Langmuir k L (L/mg)1.360 × 10−31.800 × 10−37.470 × 10⁻³
q m (mg/g)127.560179.014179.383
R20.9910.9850.966
Freundlich k F 1.9522.3296.317
n1.9381.7511.890
R20.9930.9990.983
D-R k (mol2·kJ−2)6.33 × 10−35.27 × 10−33.680 × 10⁻³
q m (mg/g)1.907 × 10−32.733 × 10−32.764 × 10⁻³
|E| (kJ/mol)8.8899.74011.656
R20.9390.9800.952
Table 4. Kinetic model parameters of adsorption.
ZnPFO Pseudo First Order ModelPSO Pseudo Second Order ModelIntra-Particle Diffusion Model
Conc. Concentration (mmol/L)k1 (g·mg·h−1)R2k2
(g·mg·h−1)
R2kint
(mg·g−1·min−0.5)
Cqe
(mg/g)
R2
102.760.990.970.990.476.7512.050.96
301.880.980.170.990.9117.2833.200.81
Table 5. Adsorption thermodynamic parameters.
C0 (mmol/L)T (°C) Δ G 0 (kJ/mol) Δ H 0 (kJ/mol) Δ S 0 (J·mol−1 K−1)R2
325−10.06946.864190.9550.935
40−12.934
55−15.798
525−6.79582.171298.3930.998
40−11.271
55−15.747
1025−6.59152.153197.0300.992
40−9.547
55−12.502
3025−4.02071.823254.3790.926
40−7.836
55−11.651
5025−3.78849.457178.5850.921
40−6.467
55−9.146
8025−2.53762.658218.6650.942
40−5.817
55−9.097
10025−2.09558.498203.2310.980
40−5.144
55−8.192
Publisher’s Note: MDPI stays neutral with regard to jurisdictional claims in published maps and institutional affiliations.

