Article

Influence of Packaging Material on Polyphenol Content and Antioxidant Activity in Some Commercial Beers

by
Mihaela Mirela Bratu
1,
Semaghiul Birghila
2,*,
Antoanela Popescu
1,
Bogdan-Stefan Negreanu-Pirjol
1,
Marius Radu
3 and
Corina Birghila
4
1
Department of Pharmaceutical Sciences II, Ovidius University of Constanta, Aleea University Avenue, Campus 1, 900470 Constanta, Romania
2
Department of Chemistry and Chemical Engineering, Ovidius University of Constanta, 124 Mamaia, 900527 Constanta, Romania
3
Department of Biological Sciences II, Ovidius University of Constanta, Aleea University Avenue, Campus 1, 900470 Constanta, Romania
4
Department of Statistics and Actuarial Science, University of Waterloo, 200 University Ave. W., Waterloo, ON N2L 3G1, Canada
*
Author to whom correspondence should be addressed.
Processes 2021, 9(4), 620; https://doi.org/10.3390/pr9040620
Submission received: 21 February 2021 / Revised: 28 March 2021 / Accepted: 30 March 2021 / Published: 1 April 2021

Abstract

:
Using two methods (ferric reducing antioxidant power and radical scavenging activity), the total polyphenol content (Folin–Ciocalteu reagent) and polyphenol patterns (HPLC) in 10 commercial lager beer brands produced in Romania was determined. Samples bottled in glass, plastic and aluminium packages were analysed for each brand when available. Results have indicated considerable variations in the total and individual phenolic contents as well as antioxidant activity across beer brands. Gallic and feulic acids were the dominant phenolic compounds identified samples. The statistical analysis indicates a significant difference between the levels of antioxidant activity detected using DPPH and FRAP, for all three types of material considered. The statistical test ANOVA indicates that the polyphenol concentration is similar across all types of material.

1. Introduction

Beer is a fermented, low-alcohol beverage and one of the most consumed beverages around the world; it is rich in nutrients such as carbohydrates, amino acids, minerals, vitamins and other compounds such as polyphenols. Phenolic compounds may be a major factor in assuring the antioxidant potential of the diet and may contribute in maintaining the endogenous redox balance in humans [1,2,3,4].
Hop (Humulus lupulus L.) bring to beer composition not only volatile oils, but also polyphenols of different types, such as: phenolic acids, flavonoids, proanthocyanidins, prenylated chalcones and catechins [5].
Furthermore, malt provides over 70% of the total polyphenolic compounds found in beer. Besides, during fermentation process, resin produced by hops that contains monoacyl phlorogucinols is converted into bitter acids such as humulones and isohumulones. These molecules act as bioactive antioxidants and provide additional beneficial effects in the treatment of chronic diseses in humans (cancer, liver disorders, Parkinson’s disease, hypertension, atherosclerosis) [6].
The literature point out as main polyphenolic compounds present in beer: sinapic, ferulic, and caffeic acids. Vanillic acids are present in bound and unbound forms while 4- hydroxyphenylacetic and p-coumaric acids are present as free forms [7].
Since beer is inexpensive and preferred by many people, it is produced at industrial level worldwide under various brands. In terms of chemical contents, a series of scientific studies have shown its antioxidant activity [8,9]. Studies have also found that beer exhibits inhibitory effects on carcinogens and a positive influence on plasma lipid levels, plasma antioxidants and anticoagulant activities in hypercholesteraemic patients [10,11,12]. Some very recent studies investigated in vitro the antioxidant effects using various methods for determining the correlation of commercial beer with polyphenolic profiles [8,9].
The industrial production of beer also requires packaging containers that can preserve the chemical composition of the beer and antioxidant properties for as long as possible. However, the literature provides little information on the safety compliance of packaging materials for maintaining these properties. There have been some recommendations regarding the chemical nature of beer packaging, but there remains a lack of information about the influence of raw packaging materials on the chemical composition and properties of beer [13]. Some studies quantified the amount of phthalates and adipates occurring in beer from plastic gaskets, lids and stoppers [14] as well as tetra packs [15]. There have also been studies related to the safety of aluminium cans for beer packaging. Some authors demonstrated that there was virtually no difference in aluminium content between beverages in cans and beverages in glass bottles [16,17].
According to our knowledge, there have been no studies on the correlation between the beer antioxidant activity and polyphenol content and the chemical nature of its packaging. The present study draws a comparison between the polyphenol content and antioxidant activity in ten commercial beer brands produced in Romania and packed in three different types of materials: glass bottles, plastic bottles, and aluminium cans. Testing the antioxidant activity (AA) of the beers facilitates the estimation of a protection degree after the AA ingestio, but the results may vary according to the method and/or packaging material. These factors were identified by qualitative characterisation of the samples. Therefore, the main objectives of this study were:
(i)
evaluation and comparison of the phenolic profiles and antioxidant activities of commercial beers packaged in three different types of materials;
(ii)
evaluation of the influence of packaging material on the antioxidant activity and polyphenols in beers, using a statistical analysis.

2. Materials and Methods

2.1. Beer Samples

Ten of the most popular industrial lager beer brands produced in Romania were selected for this study and acquired from a local supermarket. According to the specifications of the producers, all brands come from the same batch, are bottled on the same day and have the following particularities: alcohol content (3.5–5.0%, v/v); original gravity (8.0–11.1 °P) and raw material (malt, hop). For each brand, samples packed in glass bottles, plastic bottles and aluminium cans were purchased when available. Two beer brands lacked glass packaging and another two brands lacked plastic packaging. There were at least two different kinds of packaging for each brand. For each beer sample, beers from three bottles were combined, homogenised and degassed with intensive stirring for 30 min at room temperature. All experiments were performed during the marked shelf lives of the products.

2.2. Chemicals

All phenolic standards and solvents used in the present work were HPLC-grade (purity > 99%). Methanol, ethanol, acetonitrile, and 1,1-diphenyl-2-picrylhydrazyl (DPPH) were purchased from Sigma Aldrich (Steinheim, Germany). 2,4,6-Tripyridyl-s-triazine (TPTZ) and Folin–Ciocalteu reagent were obtained from Merck (Darmstadt, Germany). The phenolic standard containing gallic acid (GA), acid, caffeic acid, p-coumaric acid, ferulic acid, vanillic acid, p-hydoxibenzoic, syringic, chlorogenic acids, ellagic acid, and cinammic acid was purchased from Sigma Aldrich (Steinheim, Germany).

2.3. Determination of Total Phenolic Content

The total phenolic content was determined using the Folin–Ciocalteu reagent according to the method reported by Pereira da Silva et al. [18]. Gallic acid (GA) was used as a calibration standard, and the results are expressed as mg gallic acid equivalents (GAE) per L of beer). For this experiment, an aliquot (1 mL) of beer was added to 1 mL of Folin–Ciocalteu reagent (diluted 1:1 with distilled water), and the mixture was added to 25 mL of distilled water (solution B). Then, 1 mL of solution B was mixed with a 20% sodium carbonate solution to a total of 5 mL. After 40 min of storage in the dark at room temperature, the absorbance was measured at 725 nm versus a prepared blank using a Jasco V-630 UV-VIS spectrophotometer (Japan). The correlation equation constructed with GA (1 to 10 mg L−1) was y = 0.1387x + 0.0204 (R2 = 0.9990), and the limit of detection was 3.26 mg L−1.

2.4. Determination of Phenolic Profile by HPLC

Chromatographic analyses of common phenolic compounds were performed on an Agilent 1200 HPLC system equipped with a diode array detector (DAD), quaternary pump, and auto-sampler (Agilent Technologies, Santa Clara, CA, USA) using a reference method [19]. Phenolic acids were separated on a Zorbax XDB C18 analytical column (250 mm × 4 mm, i.d. 5 µm) maintained at 35 °C. The mobile phase used in the analysis consisted of 0.1% phosphoric acid in water (solvent A) and acetonitrile (solvent B). Gradient elution was programmed according to the following scheme: 0–13 min, 10% B; 13–14 min, 22% B; 14–17 min, 40% B; 17–22 min, 10% B. The injection volume was 20 µL, the flow rate was 1.5 mL min−1, and the chromatograms were recorded at 310 nm. Calibration curves were created for each compound by injecting standards (concentration of stock solution ranged between 0.22 and 0.50 mg mL−1) at six different concentrations. The DAD response was linear for all phenolic acids with correlation coefficients exceeding 0.9953. The results are expressed in mg L−1.

2.5. Antioxidant Capacity

2.5.1. Ferric Reducing Antioxidant Power (FRAP) Assay

The FRAP assay was performed according to previous reports by Benzie and Szeto [20]. The FRAP reagent was prepared by mixing 2.5 mL of 10 mM TPTZ in 40 mM HCl (1 mL), 2.5 mL of 300 mM acetate buffer (pH = 3.6), and 2.5 mL of 20 mM FeCl3·6H2O. The FRAP reagent was added to 1 mL of each diluted beer sample, and the mixture was shaken. A reagent blank was prepared by adding 1 mL of water instead of beer samples. Absorbance readings of the samples and the reagent blank were taken after 4 min at 593 nm using Jasco V-630 UV-VIS spectrophotometer (Hachioji, Tokio, Japan). The antioxidant activity was calculated from the calibration curve made with gallic acid (y = 297.03x) with a range of 0.8–16.6 mM and good linearity (R2 = 0.9953).

2.5.2. DPPH Radical Scavenging Activity

The DPPH radical scavenging activity of the beer samples was determined according to the method reported by Brand-Williams et al. [21] with minor changes. Each diluted beer sample (0.1 mL) was added to 2.9 mL of DPPH solution. The absorbance was measured at 517 nm after the solution had been allowed to stand in the dark for 60 min. The GA calibration curve was plotted as a function of the percentage of DPPH radical scavenging activity (y = 2.4024x + 0.8899) with a range of 0.16–3.32 mM and good linearity (R2 = 0.9913). The results have been expressed as mg GAE/L.

2.6. Statistical Analysis

The antioxidant activity and polyphenol level of the beer obtained through the methods mentioned before and for different packaging materials was further analysed from a statistical point of view, using the statistical software R, version 3.4.3 [22]. Two-tailed ANOVA test was applied to verify the influence of the type of packaging material on the antioxidant activity and polyphenols. The samples considered were independent. The test requires that the samples are normally distributed and the variance of each group is homogeneous (homoskedasticity). The former condition was verified using the Shapiro test, while the latter uses Bartlett test. The impact of the DPPH and FRAP methods on the level of antioxidant activity of beer was an analysed based on the two-sample t-test. All data are reported as means ± standard deviation (SD) from triplicate determinations.

3. Results and Discussion

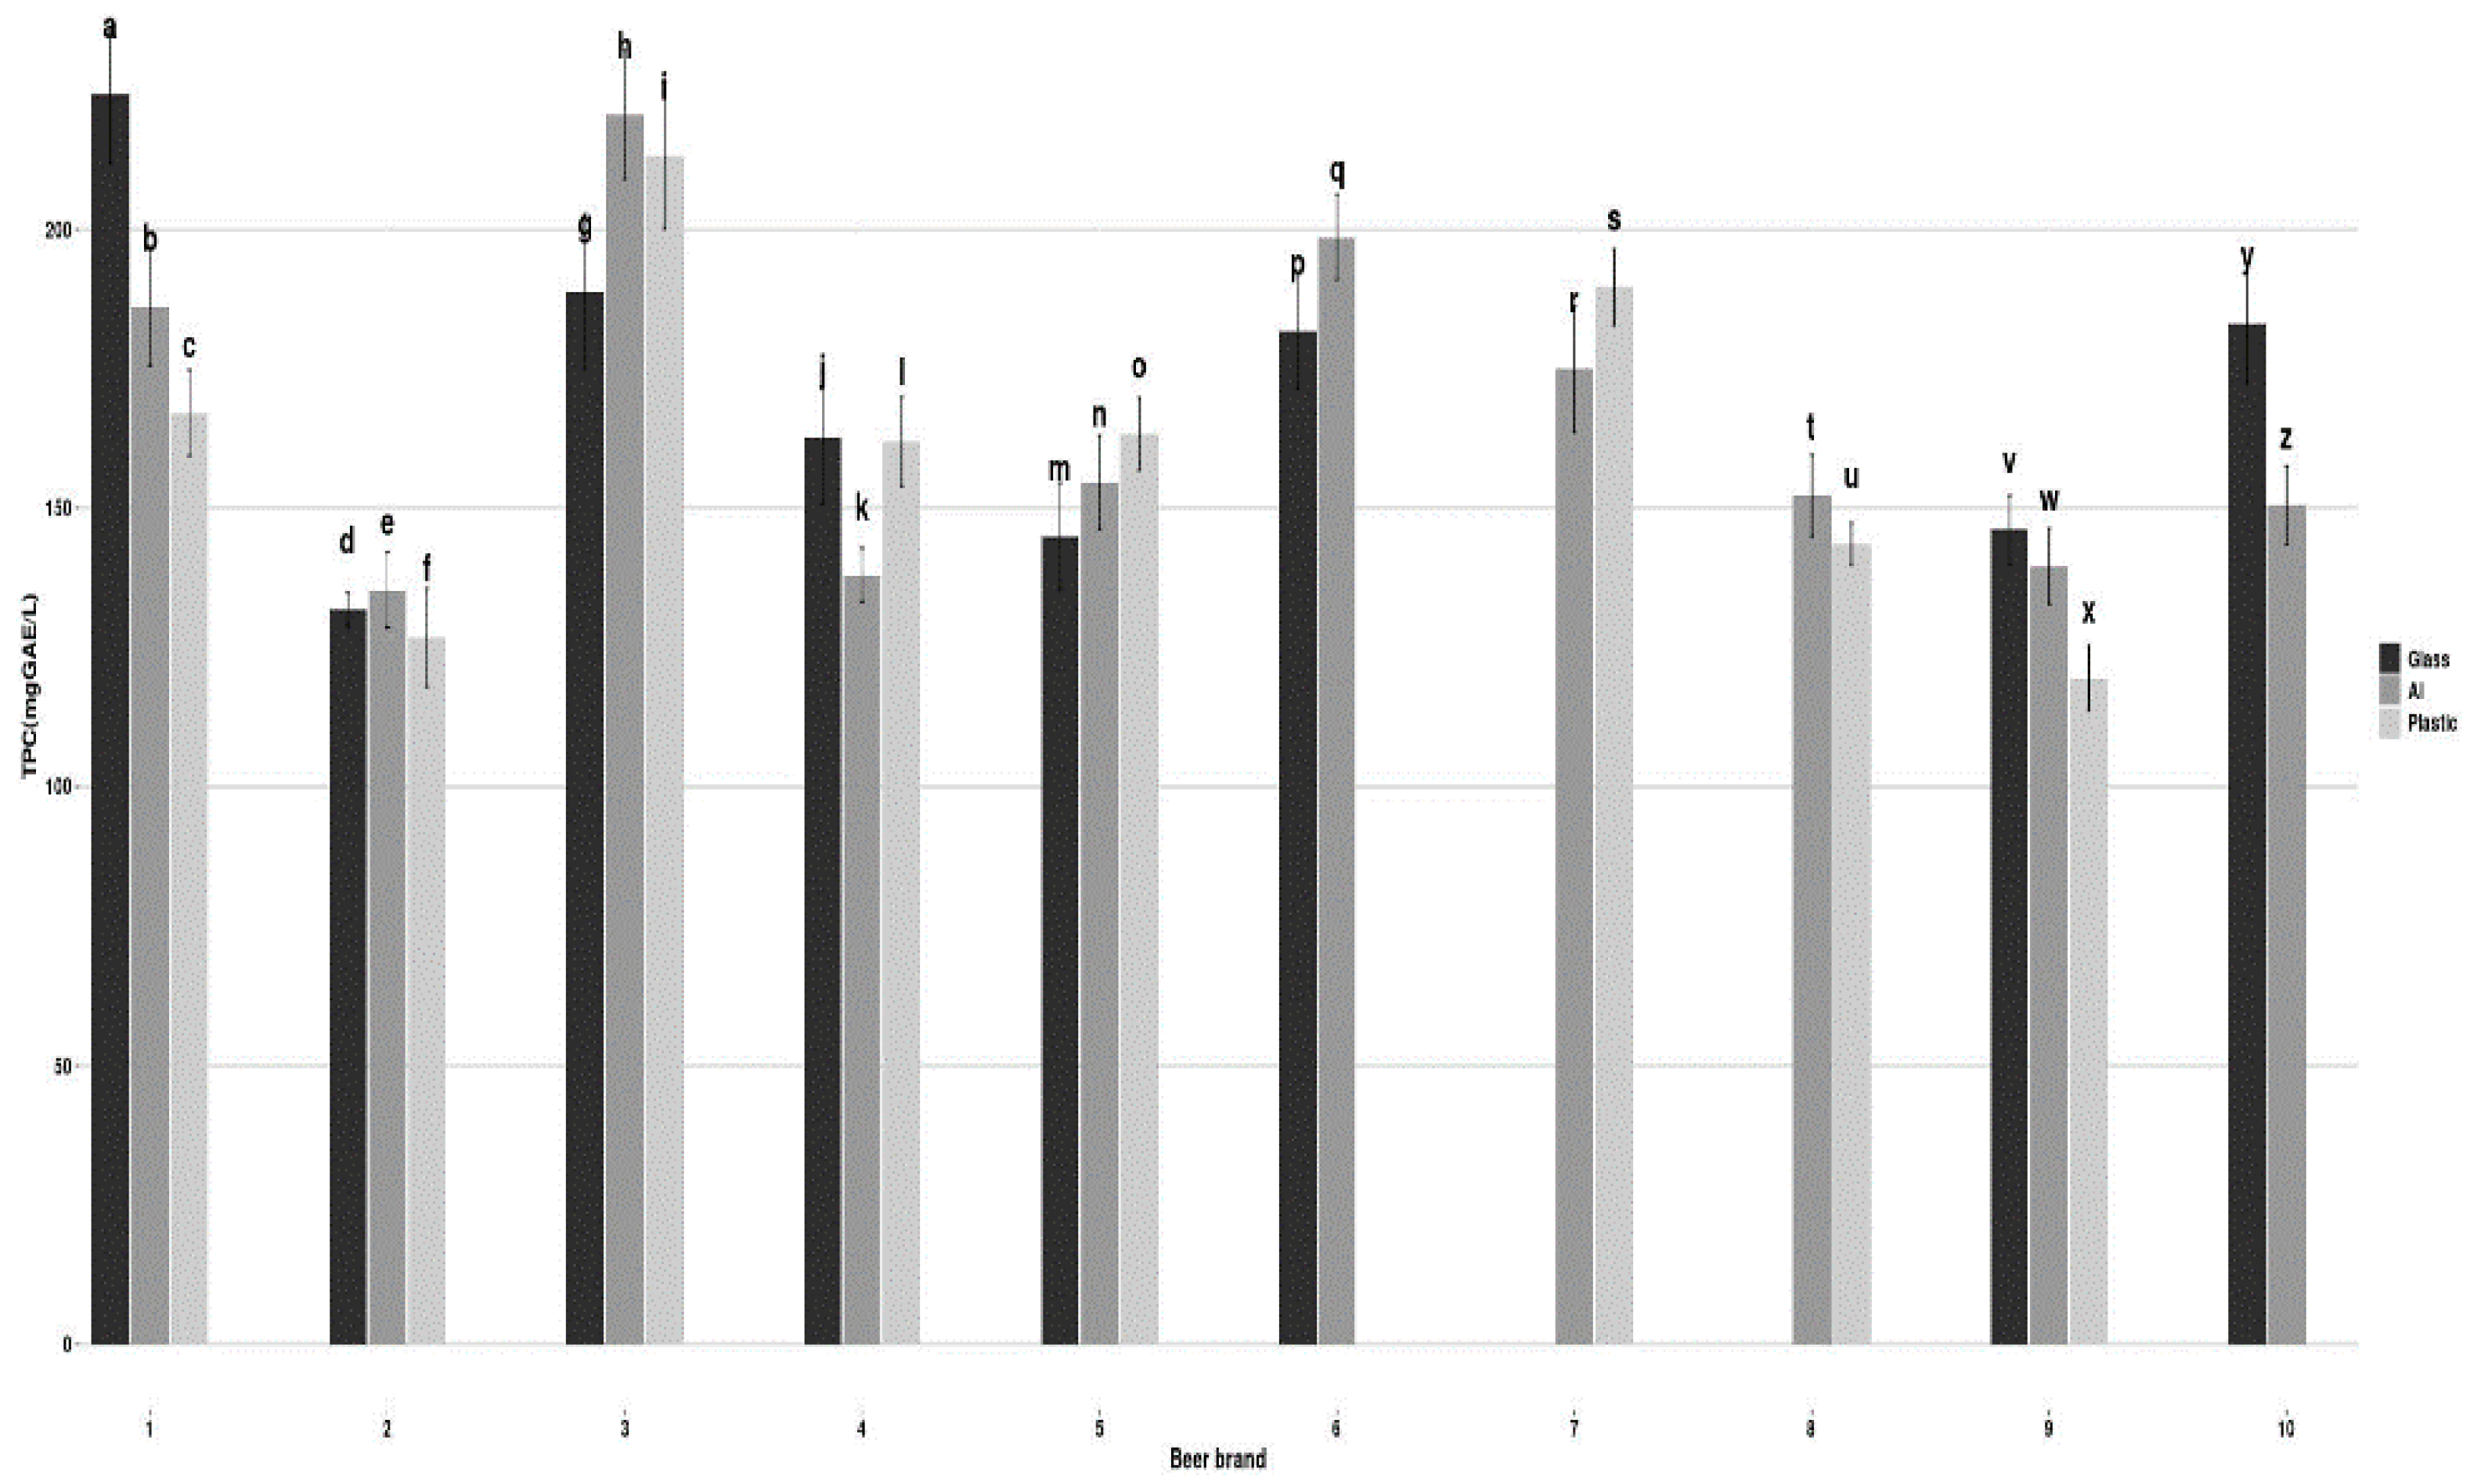
3.1. Total Phenolic Contents

Beer is considered one of the major sources of phenolic compound; the presence of the compounds contributes to colloidal, sensorial properties and to the flavour of beer. Flavour stability is one of the most important factors in determining the shelf life of packaged beer [23]. In this study, commercial beers were analysed, and the results are presented in Figure 1.
The total phenolic (TP) content obtained in mg GAE/L ranged from 131 to 224 (glass), 135 to 220 (Al) and 119 to 213 (plastic). The results obtained were in accordance with the findings of Piazzon et al., [24]: 160–380 mg GAE/L.
The comparison between the mean total phenolic content among the analysed beers (170.43 ± 10.09 for glass; 164.74 ± 12.04 for Al and 160 ± 8.56 for plastic) showed that the type of packaging material does not have the main influence on the concentration of TP in beer.

3.2. Individual Phenolic Acids

Some studies established that the most abundant phenolic acids in beer are gallic acid, ferulic acid, and syringic acid [8]. Some of them are present in beer mainly in free forms, while others in conjugated forms [25]. Hop and malt are the raw materials of beer which serve as an important source of phenolic compounds. Around 30% of polyphenols from beer comes from hops and 70–80% originates from malt [26].
In this study, the beer samples had relatively high levels of gallic, ferulic, caffeic, p-coumaic and vanillic acids, while the levels for cinnamic, p-hydoxibenzoic, syringic and chlorogenic acids were much lower (Table 1—other acids).
Individual phenolic compounds and the significant level obtained when comparing the mean content of individual phenolic acids, across all beer types, using statistical analysis (ANOVA). The resulting p-values at the significance level of 0.05 indicate that only in the case of caffeic acid, there is a significance statistical difference between the mean of the packaging material. The p-values of the other acids considered (gallic acid, ferulic, p-coumaic and vanillic acids) do not support the statistical hypothesis of the equal means across the three packaging materials.
Ferulic acid was among the five predominant phenolic acids detected in the beer samples, with a concentration of 2.04–7.89 mg/L.
A number of research findings suggest that the main phenolic acid in barley, malted barley is ferulic acid [27].
Gallic and ferulic acids were the dominant phenolic compounds identified in the tested beer samples and both of them accounted for >60% of the total phenolic acids.
The results obtained in our experiment revealed that for the same type of packaging material, beer samples showed differences for some phenolic acids. For example, the glass-packaging beers (bands 4 and 10) had both the highest and the lowest level of ferulic acid. Therefore, the type of packaging material is not the main influence on the content of this acid in beer.
The values of TP content in examined beers usually exceeded 100 mg GAE/L, while the sum of the individual phenolic contents varied significantly, ranging from 23.85 to 36.06 mg/L (glass), from 22.32 to 33.07 mg/L (Al) and from 20.65 to 33.20 mg/L (plastic), respectively. The variations in phenolic profiles for different brands might be due to the differences of raw materials, the brewing process (contact with O2, boiling time and temperature, maturing time) or possible changes in the phenolic composition during storage [28,29].
Oxygen in beer mostly enters process during filling. It is a common practice for commercial brewers to measure the total package oxygen (TPO) and to use this value to evaluate the oxygen level in the final packaged beer. It represents the total amount of oxygen with the package, including both the headspace and the liquid. In beer industry, oxygen has a greater effect on the quality of the product, while TPO levels are kept below 100 ppm [30]. Phenolic compounds oxidize easily when they come in contact with oxygen and they may affect the sensory properties, such as flavour, aroma and colour. The content of gallic acid may also give some information about degree of oxidation processes during brewing process due to a very high reactivity and susceptibility of this compound to oxidation and degradation [8].
The same beer in different types of packaging material showed similar phenolic profiles, but significant variations appeared in the total and individual phenolic content, which have been determined through Folin–Ciocalteu and HPLC methods, respectively (Table 1). The difference between the two assays is that the FC method is not specific for phenolic compounds and suffers interference from other compounds [31]. Therefore, the measurement of phenolic profile might provide more information about their antioxidant activity.

3.3. Antioxidant Activity

The radical scavenging activity and reducing power were analysed to determine the antioxidant activity of beers. The DPPH assay measures a change in the stable radical DPPH by the electron donating ability of the sample [32]. The FRAP value measures the reduction of the ferric ion (Fe3+) to ferrous ion (Fe2+) by donor electrons in the sample [33].
In the present study, all beer samples showed antiradical properties (Figure 2). The highest antiradical activity was estimated in the glass packaging beer and the lowest one in plastic packaging beer. These differences may be due to the changes in the phenolic composition during storage. Slight changes in the structure or conformation of these compounds can cause significant changes in the antioxidant activity, which alters the overall oxidative capacity or flavour stability of the beer. Nowadays, flavour stability has become the most important factor in determining the shelf-life of the packaged beer. The flavour stability of the beer primarily depends on the oxygen content of the packaged beer [34].
Some studies show that the content of phenols decreases nearly 35% in the first two weeks of storage and it can be related to a higher level of phenol oxidation at the beginning of the storage [35].
Figure 3 showed the ferric reducing power of selected commercial beers. The FRAP values varied from 14.41 to 24 mg GAE/L for glass, 14.65 to 23.8 mg GAE/L for Al and from 12.25 to 25.88 mg GAE/L for plastic, respectively.
Generally, the results showed that all beers displayed antioxidant properties, although the values varied depending on the brand, method and packaging material. GA values of the same brand obtained through DPPH assay were much higher compared to the values obtained through FRAP assay. Different mechanisms for measuring the antioxidant capacity applied over a similar range of concentrations might lead to different results of the two methods [36].

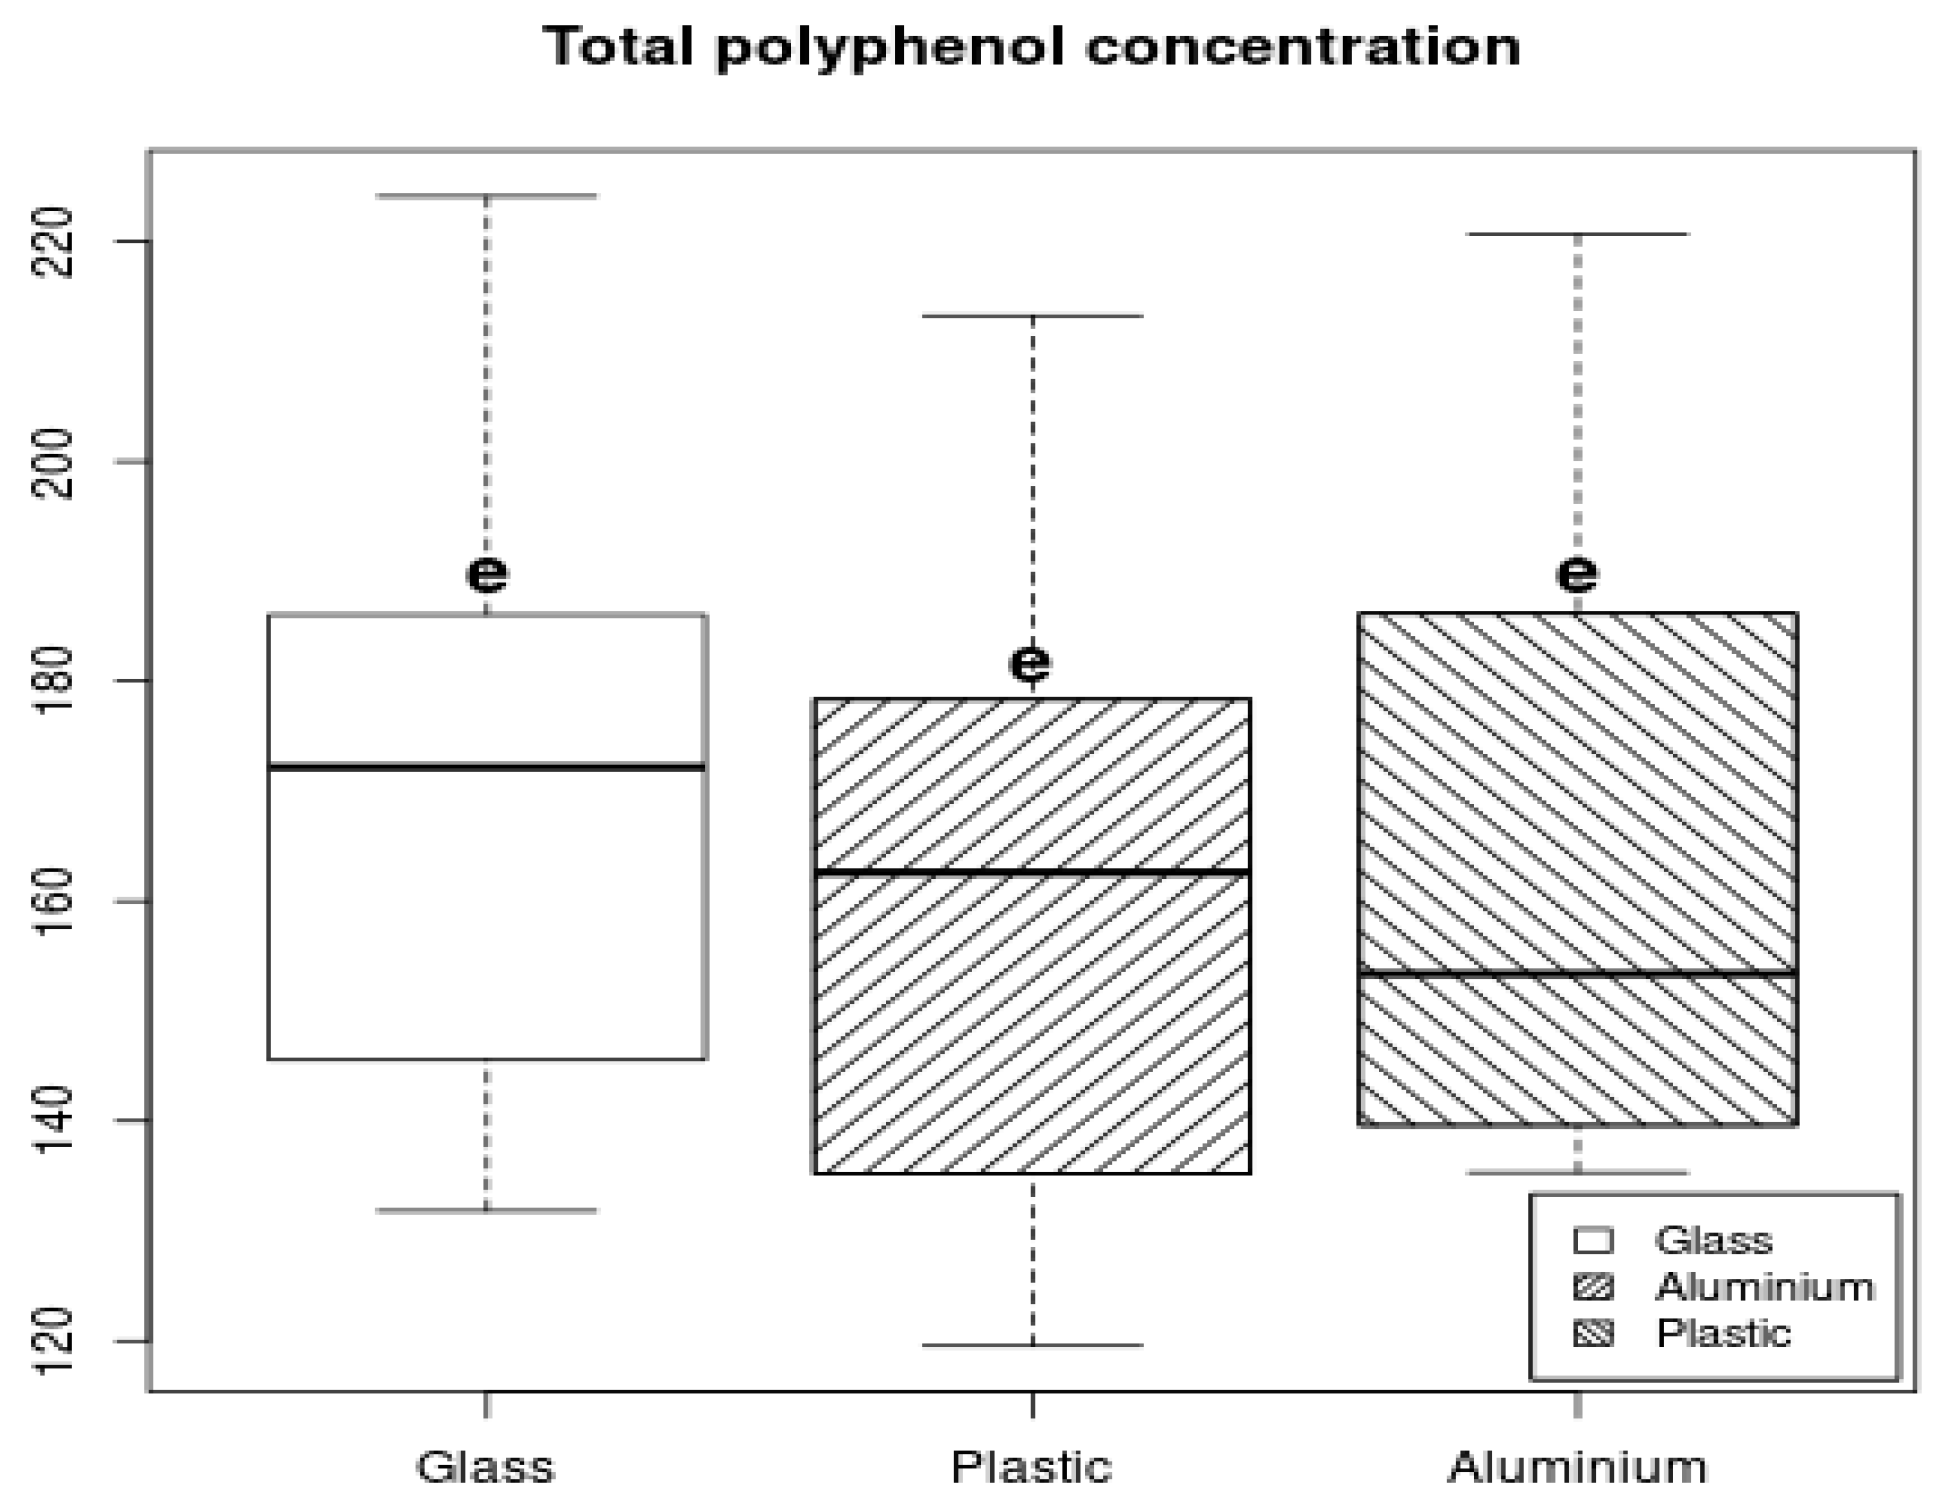
3.4. Effect of the Packaging Material

The influence of the packaging material on the antioxidant activity and the total phenolic content was analysed from statistical point of view. For each type of beer, whenever one of the packaging material was not available, the corresponding value is regarded as unavailable. For the methods considered to determine the antioxidant activity of the examined beers—DPPH and FRAP—the differences between glass, aluminium and plastic materials were studied. The relative order of DPPH assays was plastic < Al < glass and for FRAP assays was glass < plastic < Al. Comparing the methods, AA was about two times higher for DPPH assays, as resulting from the mean plotted in Figure 4. This observation may result from the different mechanisms of analysing the antioxidant activity; these mechanisms are described by the singlet electron transfer (SET) based activity for FRAP values and the mixed mode with SET and hydrogen atom transfer based activity for DPPH radical scavenging activities [37].
For the DPPH method, a two-tailed ANOVA (analysis of variance) test with significance level α   =   0.05 was used to further evaluate the variations between the three types of material. Before applying the test, the normality and the homoskedasticity of the observations were examined using Shapiro and Bartlett tests, respectively. The two tests indicate that the samples are taken from a normal distribution and the variance in the three groups are similar. The null hypothesis of the test is that there is no significant difference between the antioxidant activity of the examined beers in the glass, aluminium, and plastic material, and the corresponding means are equal. From a statistical point of view, the statement is denoted by H 0 : μ G l a s s   =   μ A l u m i n i u m   =   μ P l a s t i c , where μ G l a s s , μ P l a s t i c and μ A l u m i n i u m are the hypothesized means of data in the glass, aluminium and plastic containers, respectively. The alternative hypothesis is that there is a significant difference between the means of the groups analysed, i.e., H a : μ G l a s s μ A l u m i n i u m μ P l a s t i c . The reported p-value of 0.031 is below the significance level, and hence, the null hypothesis is rejected. It follows that in the case of the DPPH method, the means of antioxidant activity between the three groups are significantly different. Figure 4 (left) supports the conclusion of the ANOVA test: the three boxplots corresponding to each type of material indicate different sample medians.
In the case of the FRAP method, a similar analysis was performed. The box plot in Figure 4 (right) suggests that the medians of the observations within each group are similar, fact also proved by the ANOVA test. The resulting p -value = 0.8747 is greater than the significance level, and therefore the null hypothesis is accepted. It follows that in the case of the FRAP method, there is no sufficient statistical difference between the means of antioxidant activity in the three groups.
Figure 5 shows the box plot of total polyphenols detected in glass, plastic and aluminium. The tests for normality and homoskedasticity of data were performed before applying the two-tailed ANOVA test with the same significance level as in the previous analysis. The resulting p -value is 0.808, implying that the difference between the means of the groups is not statistically significant.
A further analysis was conducted to study the impact of the DPPH and FRAP method on the antioxidant activity of beer regardless of the type of packaging material. For each type of material, a two-sample t-test was performed to compare whether the mean of the antioxidant activity changes when using the two methods mentioned above. For example, in the case of glass material, the null hypothesis is H 0 : μ G l a s s , D P P H   =   μ G l a s s , F R A P , while the alternative hypothesis states that the used method significantly influences the level of antioxidant activity of the beer. The reported p -value of 3.051 × 10 9 is significantly smaller than the significant level α   =   0.05 , and hence, the null hypothesis is rejected. Thus, in the case of the glass material, the antioxidant activity of the beer is influenced by the type of method applied. The same analysis was repeated in the case of aluminium and plastic packaging materials, considering the impact of the DPPH and FRAP again. The reported p -values are of order 10 9 , suggesting that regardless of the type of material that is used, the method has a significant effect on the level of detected antioxidant activity.

4. Conclusions

There were considerable variations in phenolic profiles (total and individual phenolic contents) and antioxidant activities in commercial beer across different brands. These variations may be due to the differences of raw materials, the brewing process and possible changes in the phenolic composition during storage. Gallic and ferulic acids were the dominant phenolic compounds identified in the tested samples.
Results indicate that the packaging material influences the antioxidant activity of beer, when determined through the DPPH method. Moreover, the analysis showed a significant difference between the levels of antioxidant activity detected using DPPH and FRAP, regardless of the type of material. The statistical test ANOVA indicates that the polyphenol concentration is similar across all types of material.

Author Contributions

Conceptualization, M.M.B.; writing, investigation, resources, visualization and S.B.; writing—review and editing, investigation, resources, visualization, A.P.; resources, validation, B.-S.N.-P.; methodology, resources, M.R.; methodology, validation; C.B.; formal analysis, software, visualization. All authors have read and agreed to the published version of the manuscript.

Funding

This research received no external funding.

Institutional Review Board Statement

Not applicable.

Informed Consent Statement

Not applicable.

Data Availability Statement

Not applicable.

Acknowledgments

This work was supported by the Department of Pharmaceutical Sciences, University of Constantza.

Conflicts of Interest

The authors declare no conflict of interest.

References

  1. Arranz, S.; Chiva-Blanch, G.; Valderas-Martínez, P.; Medina-Remón, A.; Lamuela-Raventós, R.M.; Estruch, R. Wine, Beer, Alcohol and Polyphenols on Cardiovascular Disease and Cancer. Nutrients 2012, 4, 759–781. [Google Scholar] [CrossRef] [PubMed] [Green Version]
  2. Rodríguez-López, L.; Vecino, X.; Barbosa-Pereira, L.; Moldes, A.B.; Cruz, J.M. A multifunctional extract from corn steep liquor: Antioxidant and surfactant activities. Food Funct. 2016, 7, 3724–3732. [Google Scholar] [CrossRef] [PubMed]
  3. Hajji, T.; Mansouri, S.; Vecino, X.; Cruz-Freire, J.M.; Rezgui, S.; Ferchichi, A. Identification and characterization of phenolic compounds extracted from barley husks by LC-MS and antioxidant activity in vitro. J. Cereal Sci. 2018, 81, 83–90. [Google Scholar] [CrossRef] [Green Version]
  4. Tapia-Quirós, P.; Montenegro-Landívar, M.F.; Reig, M.; Vecino, X.; Alvarino, T.; Cortina, J.L.; Saurina, J.; Granados, M. Olive Mill and Winery Wastes as Viable Sources of Bioactive Compounds: A Study on Polyphenols Recovery. Antioxidants 2020, 9, 1074. [Google Scholar] [CrossRef]
  5. Habschied, K.; Lončarić, A.; Mastanjević, K. Screening of Polyphenols and Antioxidative Activity in Industrial Beers. Foods 2020, 9, 238. [Google Scholar] [CrossRef] [Green Version]
  6. Rasouli, H.; Farzaei, M.H.; Khodarahmi, R. Polyphenols and their benefits: A review. Int. J. Food Prop. 2017, 20, 1700–1741. [Google Scholar] [CrossRef] [Green Version]
  7. Quifer-Rada, R.; Vallverdú-Queralt, A.; Martínez-Huélamo, M.; Chiva-Blanch, G.; Jáuregui, O.; Estruch, R.; Lamuela-Raventós, R. A comprehensive characterisation of beer polyphenols by high resolution mass spectrometry (LC-ESI-LTQ-Orbitrap-MS). Food Chem. 2015, 169, 336–343. [Google Scholar] [CrossRef]
  8. Zhao, H.; Chen, W.; Lu, J.; Zhao, M. Phenolic profiles and antioxidant activities of commercial beers. Food Chem. 2010, 119, 1150–1158. [Google Scholar] [CrossRef]
  9. Tafulo, P.A.R.; Barbosa Queiros, R.; Delerue-Matos, C.M.; Ferreira Sales, M.G. Control and comparison of the antioxidant capacity of beers. Food Res. Int. 2010, 43, 1702–1709. [Google Scholar] [CrossRef] [Green Version]
  10. Gerhauser, C. Beer constituents as potential cancer chemopreventive agents. Eur. J. Cancer 2005, 41, 1941–1954. [Google Scholar] [CrossRef]
  11. Nardini, M.; Natella, F.; Scaccini, C.; Ghiselli, A. Phenolic acids from beer are absorbed and extensively metabolized in humans. J. Nutr. Biochem. 2006, 17, 14–22. [Google Scholar] [CrossRef] [PubMed]
  12. Gorinstein, S.; Caspi, A.; Libman, I.; Leontowicz, H.; Leontowicz, M.; Tashma, Z.; Katrich, E.; Jastrzebski, Z.; Trakhtenberg, S. Bioactivity of beer and its influence on human metabolism. Int. J. Food Sci. Nutr. 2007, 58, 94–107. [Google Scholar] [CrossRef] [PubMed]
  13. Brunazzi, G.; Parisi, S.; Pereno, A. The Importance of Packaging Design for the Chemistry of Food Products; Springer: Berlin/Heidelberg, Germany, 2014; pp. 13–15, 61–65. ISBN 978-3-319-08452-7. [Google Scholar]
  14. Sendon, R.; Sanches-Silva, A.; Bustos, J.; Martin, P.; Martinez, N.; Cirugeda, M.E. Detection of migration of phthalates from agglomerated crock stoppers using HPLC-MS/MS. J. Sep. Sci. 2012, 35, 1319–1326. [Google Scholar] [CrossRef]
  15. Carnol, L.; Schummer, C.; Moris, G. Quantification of six phthalates and one adipate in Luxembourgish beer using HS-SPME-GC/MS. Food Anal. Methods 2017, 10, 298–309. [Google Scholar] [CrossRef]
  16. Müller, J.P.; Steinegger, A.; Schlatter, C. Contribution of aluminum from packaging materials and cooking utensils to the daily aluminum intake. Zeitschrift für Lebensmittel-Untersuchung und Forschung 1993, 197, 332–341. [Google Scholar] [CrossRef]
  17. Stahl, T.; Taschan, H.; Brunn, H. Aluminium content of selected foods and food products. Environ. Sci. Eur. 2011, 23–37. [Google Scholar] [CrossRef] [Green Version]
  18. Pereira da Silva, C.H.T.; Pereira da Silva, T.P.S.; Nobre de Almeida, C.V.T.; Lima, D.C.A.; Cavalcanti de Amorim, E.L. Antioxidant capacity and phenolic content of Caesalpinia pyramidalis Tul and Sapium glandulosum (L.), Morong from Northeastern Brazil. Molecules 2011, 16, 4728–4739. [Google Scholar] [CrossRef] [PubMed] [Green Version]
  19. USP 30—NF 25 Supplement 1. United States Pharmacopeial Convention; USP: North Bethesda, MD, USA, 2007. [Google Scholar]
  20. Benzie, I.F.F.; Szeto, Y.T. Total antioxidant capacity of tea by ferric reducing antioxidant power assay. J. Agric. Food Chem. 1999, 47, 633–636. [Google Scholar] [CrossRef]
  21. Brand-Williams, W.; Cuvelier, M.E.; Berset, C. Use of a free radical method to evaluate antioxidant activity. LWT Food Sci. Tech. 1995, 28, 25–30. [Google Scholar] [CrossRef]
  22. R Version 3.4.3—“Kite-Eating Tree”; Copyright (C) 2017 The R Foundation for Statistical Computing; Platform: x86_64-pc-linux-gnu (64-bit); Sourced via CRAN—Mirror. Vienna, Austria. 2017. Available online: https://cran.wu.ac.at/ (accessed on 1 March 2021).
  23. Callemien, D.; Collin, S. Structure, Organoleptic Properties, Quantification Methods, and Stability of Phenolic Compounds in Beer—A Review Food. Food Rev. Int. 2010, 2, 1–84. [Google Scholar]
  24. Piazzon, A.; Forte, M.; Nardini, M. Characterization of phenolics content and antioxidant activity of different beer types. J. Agric. Food Chem. 2010, 58, 10677–10683. [Google Scholar] [CrossRef] [PubMed]
  25. Nardini, M.; Ghiselli, A. Determination of free and bound phenolic acid in beer. Food Chem. 2004, 84, 137–143. [Google Scholar] [CrossRef]
  26. Krofta, K.; Mikyska, A.; Haskova, D. Antioxidant characteristics of hops and hop products. J. Inst. Brew. 2008, 114, 160–166. [Google Scholar] [CrossRef]
  27. Szwajgier, D.; Pielecki, J.; Targonska, Z. The release of ferulic acid and feruloylated oligosaccharides during wort and beer production. J. Inst. Brew. 2005, 111, 372–379. [Google Scholar] [CrossRef]
  28. Socha, R.; Pająk, P.; Fortuna, T.; Buksa, K. Antioxidant activity and the most abundant phenolics in commercial dark beers. Int. J. Food Prop. 2017, 20, S595–S609. [Google Scholar] [CrossRef]
  29. Stewart, G.G.; Borthwick, R.; Bryce, J.H.; Cooper, D.; Cunningham, S.; Hart, C.; Rees, E. Recent developments in high gravity brewing. Tech. Q. Master Brew. Assoc. Am. 1998, 34, 264–270. [Google Scholar]
  30. Cook, J.M.; Karelitz, R.L.; Dalsis, D.E. Measurement of Oxygen, Nitrogen, and Carbon Dioxide in beverage headspace. J. Chromatogr. Sci. 1985, 23, 57–63. [Google Scholar] [CrossRef]
  31. Dávalos, A.; Gómez-Cordovés, C.; Bartolomé, B. Commercial dietary antioxidant supplements assayed for their antioxidant activity by different methodologies. J. Agric. Food Chem. 2003, 51, 2512–2519. [Google Scholar] [CrossRef]
  32. Rahman, M.M.; Islam, M.B.; Biswas, M.; Khurshid Alam, A.H. In vitro antioxidant and free radical scavenging activity of different parts of Tabebuia pallida growing in Bangladesh. BMC Res Notes. 2015, 8, 621. [Google Scholar] [CrossRef] [Green Version]
  33. Chen, T.S.; Liou, S.Y.; Wu, H.C.; Tsai, F.J.; Tsai, C.H.; Huang, C.Y.; Chang, Y.L. New analytical method for investigating the antioxidant power of food extracts on the basis of their electron-donating ability: Comparison to the ferric reducing/antioxidant power (FRAP) assay. J. Agric. Food Chem. 2010, 58, 8477–8480. [Google Scholar] [CrossRef]
  34. Bamforth, C.W. Beer quality: Oxidation. Brew. Guard. 2000, 4, 31–34. [Google Scholar]
  35. Vanderhaegen, B.; Neven, H.; Verachtert, H.; Derdelinckx, G. The chemistry of beer aging—A critical review. Food Chem. 2006, 95, 357–381. [Google Scholar] [CrossRef]
  36. Youn, J.S.; Kim, Y.J.; Na, H.Y.; Jung, H.R.; Song, C.K.; Kang, S.Y.; Kim, J.Y. Antioxidant activity and contents of leaf extracts obtained from Dendropanax morbifera LEV are dependent on the collection season and extraction conditions. Food Sci. Biotechnol. 2019, 28, 201–207. [Google Scholar] [CrossRef]
  37. Kareem, H.S.; Ariffin, A.; Nordin, N.; Heidelberg, T.; Abdul-Aziz, A.; Kong, K.W.; Yehye, W. Correlation of antioxidant activities with theoretical studies for new hydrazone compounds bearing a 3,4,5-trimethoxy benzyl moiety. Eur. J. Med. Chem. 2015, 103, 497–505. [Google Scholar] [CrossRef]
Figure 1. Total phenolic content (mg GAE/L) for 10 ten beer brand and for three packing materials: glass, aluminium and plastic. Vertical bars above each column represent the standard deviation of triplicate determinations. Different letters indicate differences (p < 0.05) between the samples.
Processes 09 00620 g001
Figure 2. DPPH radical scavenging activity (mg GAE/L) for 10 beer brand and for three packing materials: glass, aluminium and plastic. Vertical bars above each column represent the standard deviation of triplicate determinations. Different letters indicate differences (p < 0.05) between the samples.
Processes 09 00620 g002
Figure 3. Ferric reducing power (mg GAE/L) for 10 beer brand and for three packing materials: glass, aluminium and plastic. Vertical bars above each column represent the standard deviation of triplicate determinations. Different letters indicate differences (p < 0.05) between the materials.
Processes 09 00620 g003
Figure 4. The box plot of DPPH (left) and FRAP (right) methods (mg GAE/L). According to ANOVA test, the significant statistical difference between the means for each type of container is marked by different letters (p < 0.05).
Processes 09 00620 g004
Figure 5. The box plot of total phenolic content (mg GAE/L). According to ANOVA test, the significant difference between the means for each type of container is marked by different letters (p < 0.05).
Processes 09 00620 g005
Table 1. Individual phenolic compounds.
Packing MateialBeer
Brand
Gallic
Acid
Ferulic
Acid
Caffeic
Acid
P-Coumaic
Acid
Vanillic
Acid
Other
Acids
Sum of Individual
Phenols
Glass117.32 ± 0.274.41 ± 0.063.36 ± 0.120.85 ± 0.021.29 ± 0.051.11 ±0.0428.34 ± 0.30
220.54 ± 0.116.98 ± 0.095.77 ± 0.070.58 ± 0.010.57 ± 0.011.24 ± 0.0135.68 ± 1.47
310.42 ± 0.124.36 ± 0.114.24 ± 0.051.26 ± 0.010.27 ± 0.013.30 ± 0.2423.85 ± 1.07
422.03 ± 0.673.78 ± 0.241.49 ± 0.030.74 ± 0.020.72 ± 0.022.41 ± 0.0931.17 ± 1.12
521.40 ± 0.454.56 ± 0.075.85 ± 0.130.65 ± 0.011.05 ± 0.102.55 ± 0.1236.06 ± 3.19
620.33 ± 0.232.95 ± 0.043.63 ± 0.080.86 ± 0.030.98 ± 0.041.31 ± 0.2230.06 ± 1.28
7-------
8-------
911.13 ± 0.107.89 ± 0.211.79 ± 0.022.41 ± 0.011.63 ± 0.053.48 ± 0.0828.33 ± 2.01
1020.02 ± 0.422.04 ± 0.083.91 ± 0.011.55 ± 0.020.71 ± 0.010.70 ± 0.0128.93 ± 1.14
Al115.07 ± 0.233.59 ± 0.101.75 ± 0.041.10 ± 0.010.41 ± 0.011.68 ± 0.1323.60 ± 0.89
218.49 ± 0.404.12 ± 0.144.74 ± 0.100.87 ± 0.010.54 ± 0.024.32 ± 0.2533.07 ± 1.50
311.06 ± 0.123.02 ± 0.163.59 ± 0.071.25 ± 0.010.88 ± 0.122.52 ± 0.1422.32 ± 1.13
422.28 ± 0.513.89 ± 0.201.18 ± 0.021.20 ± 0.051.08 ± 0.062.20 ± 0.1531.83 ± 1.70
519.57 ± 1.034.78 ± 0.093.94 ± 0.010.76 ± 0.020.67 ± 0.012.70 ± 0.1132.42 ± 1.22
619.13 ± 0.823.90 ± 0.041.19 ± 0.010.41 ± 0.071.14 ± 0.101.63 ± 0.0127.30 ± 0.89
718.75 ± 0.472.73 ± 0.011.04 ± 0.010.58 ± 0.051.05 ± 0.022.67 ± 0.1026.82 ± 1.04
816.14 ± 0.153.77 ± 0.102.46 ± 0.021.52 ± 0.110.68 ± 0.011.29 ± 0.0525.86 ± 1.20
912.56 ± 0.306.54 ± 0.121.34 ± 0.011.46 ± 0.081.84 ± 0.112.47 ± 0.1529.21 ± 1.56
1019.37 ± 0.503.89 ± 0.202.54 ± 0.011.52 ± 0.100.64 ± 0.010.41 ± 0.0228.37 ± 1.23
Plastic117.12 ± 0.713.97 ± 0.121.46 ± 0.031.98 ± 0.021.17 ± 0.101.51 ± 0.0527.21 ± 1.50
219.64 ± 0.524.16 ± 0.072.55 ± 0.021.56 ± 0.010.75 ± 0.013.47 ± 0.1832.13 ± 2.02
310.08 ± 0.203.47 ± 0.252.26 ± 0.121.55 ± 0.011.09 ± 0.042.20 ± 0.1020.65 ± 1.21
420.54 ± 1.213.12 ± 0.671.23 ± 0.040.82 ± 0.010.67 ± 0.012.40 ± 0.0528.70 ± 1.47
519.37 ± 0.905.08 ± 0.043.85 ± 0.090.94 ± 0.010.83 ± 0.123.13 ± 0.1233.20 ± 2.26
6-------
718.18 ± 1.253.42 ± 0.201.51 ± 0.100.29 ± 0.011.42 ± 0.154.11 ± 0.1728.93 ± 0.86
818.02 ± 0.812.09 ± 0.051.96 ± 0.221.06 ± 0.050.67 ± 0.013.22 ± 0.0927.02 ± 1.16
911.21 ± 0.547.78 ± 0.821.29 ± 0.041.38 ± 0.021.07 ± 0.052.43 ± 0.1525.16 ± 1.80
10-------
p-value 0.85160.70960.03120.86510.9292
Each value is the mean ± standard deviation of triplicate determinations; the levels of individual phenolic compounds are expressed as mg/L.
Publisher’s Note: MDPI stays neutral with regard to jurisdictional claims in published maps and institutional affiliations.

