
Corrosion and Corrosion Fatigue of Steels in Downhole CCS Environment—A Summary


Abstract
1. Introduction
- Temperature and CO2 partial pressure;
- alloy composition and compositions of the corrosive media;
- contamination of alloy and media;
- flow conditions and injection pressure and;
2. Materials and Methods
2.1. Steels
Aquifer Water
2.2. Static Corrosion Experiments
Heat Treatment
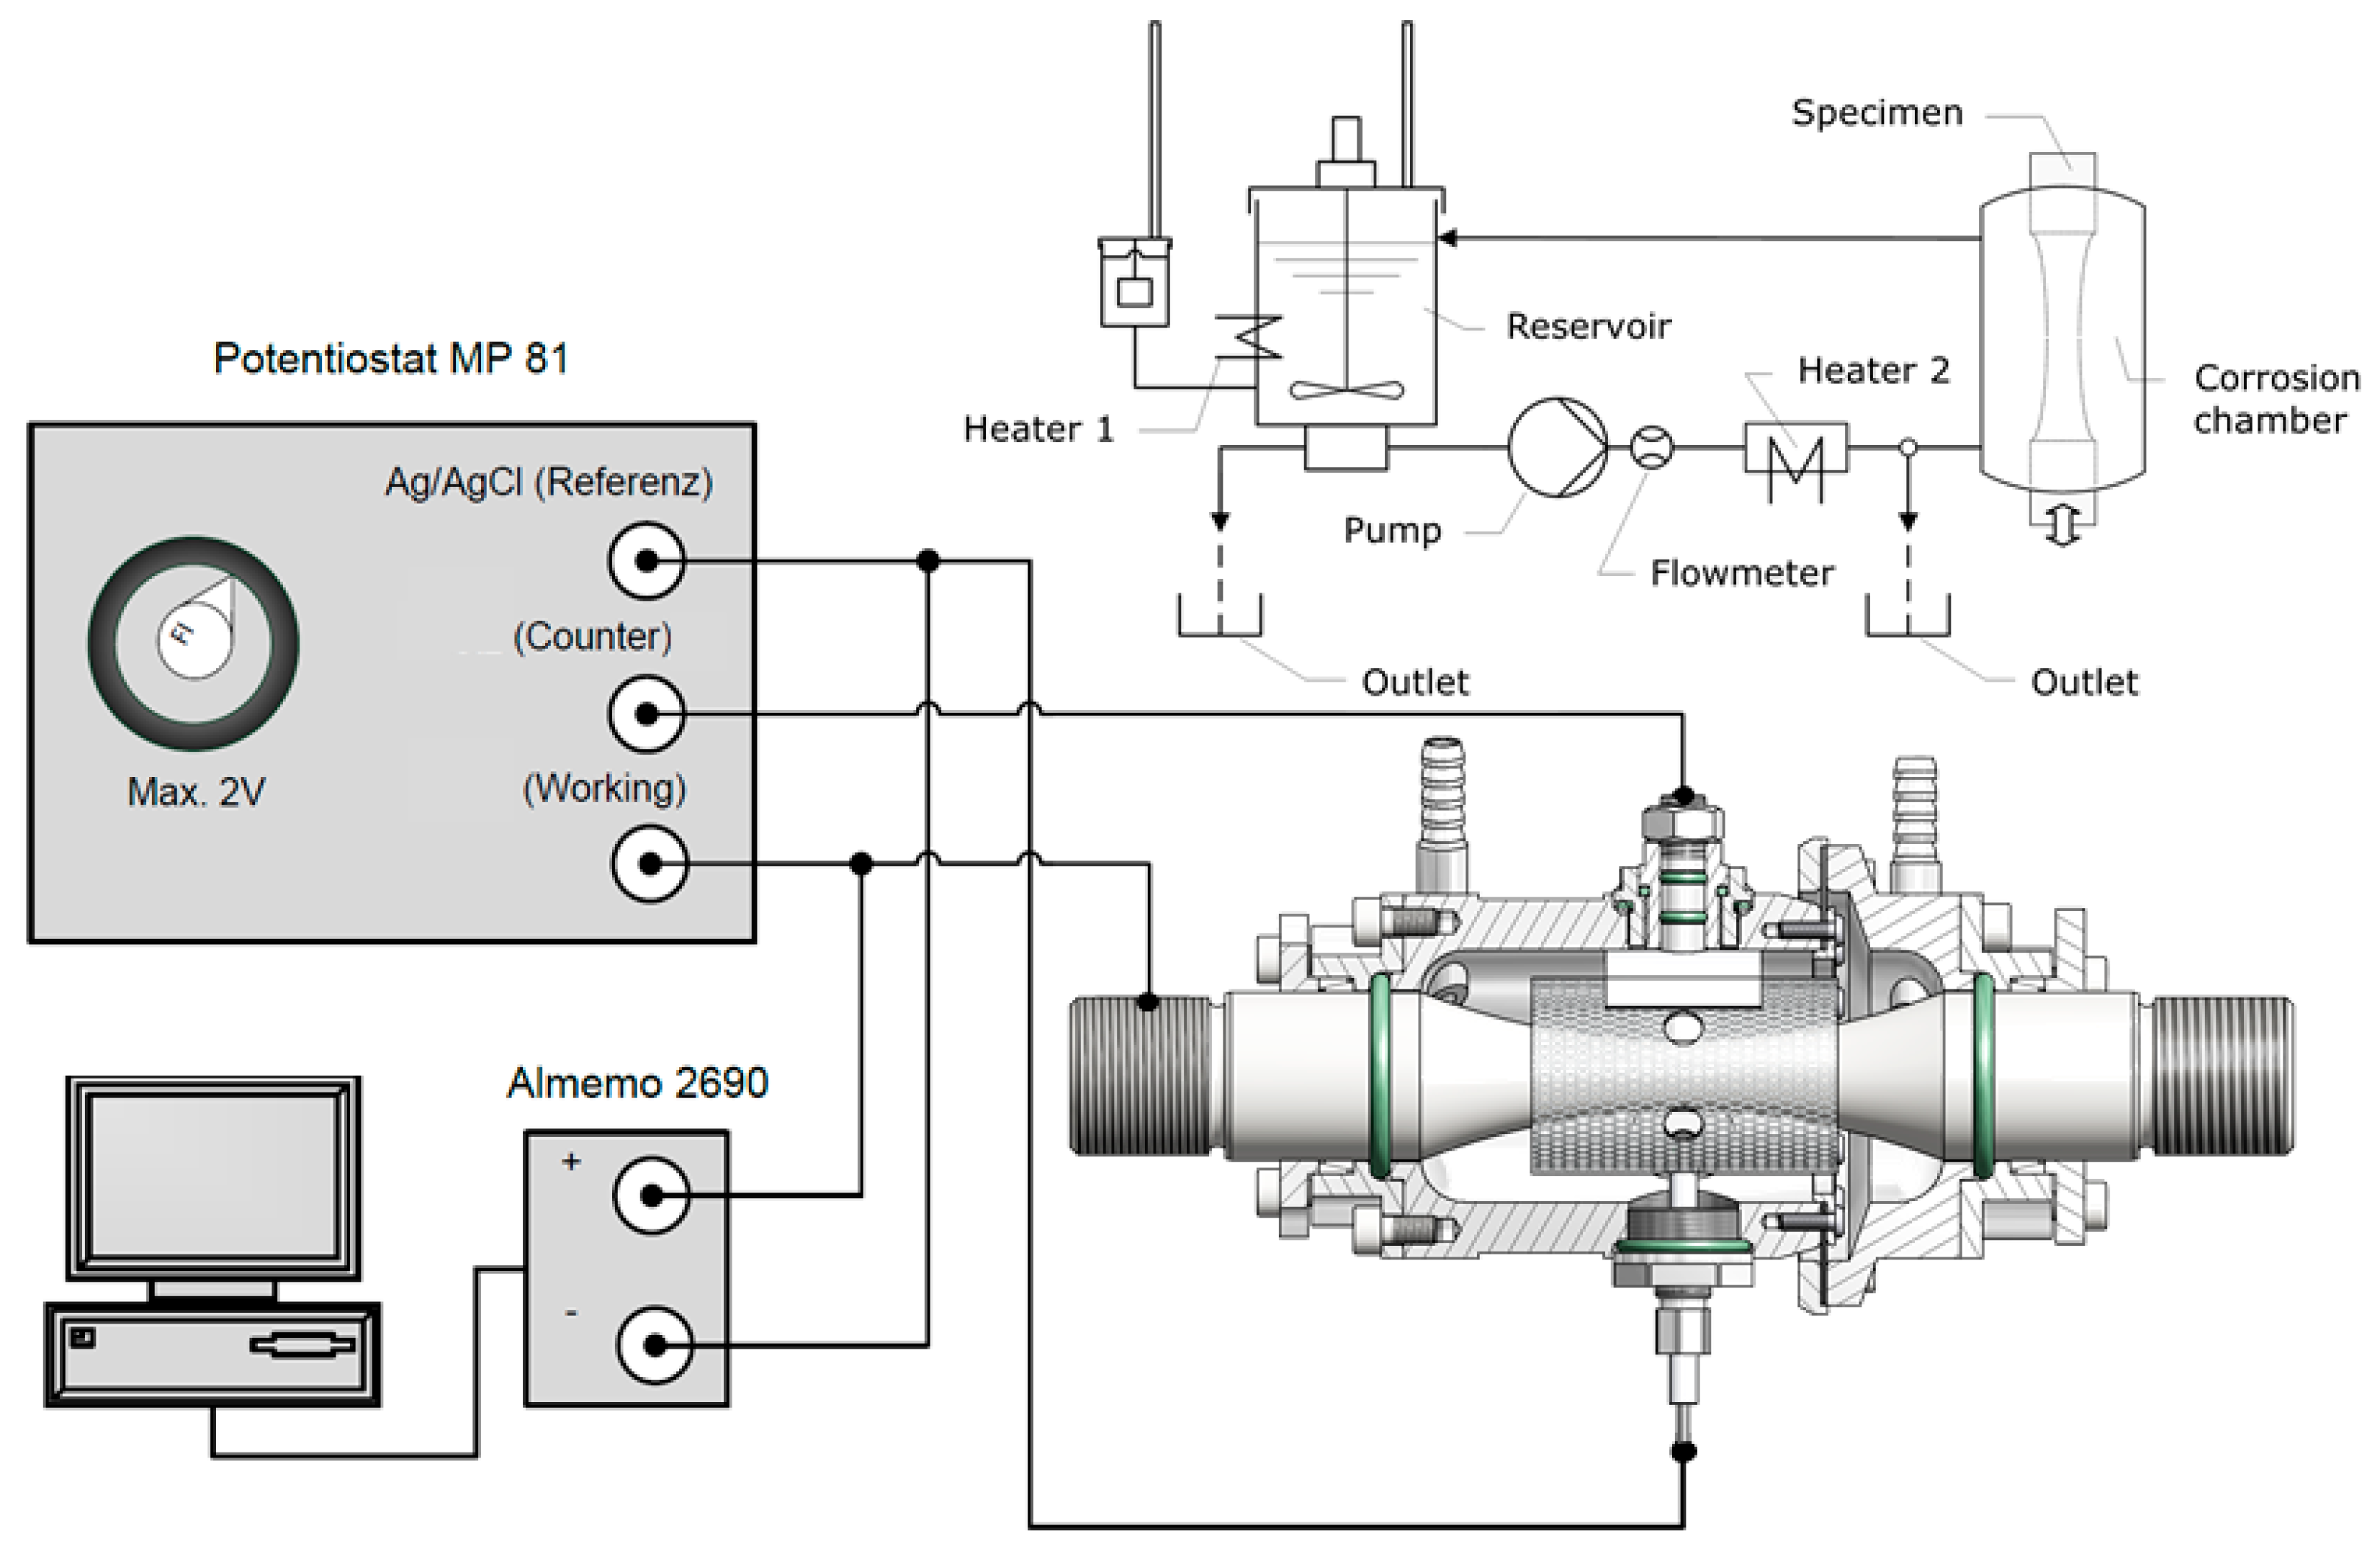
2.3. Corrosion Fatigue Experiments
Test Setup
2.4. Analysis
3. Results
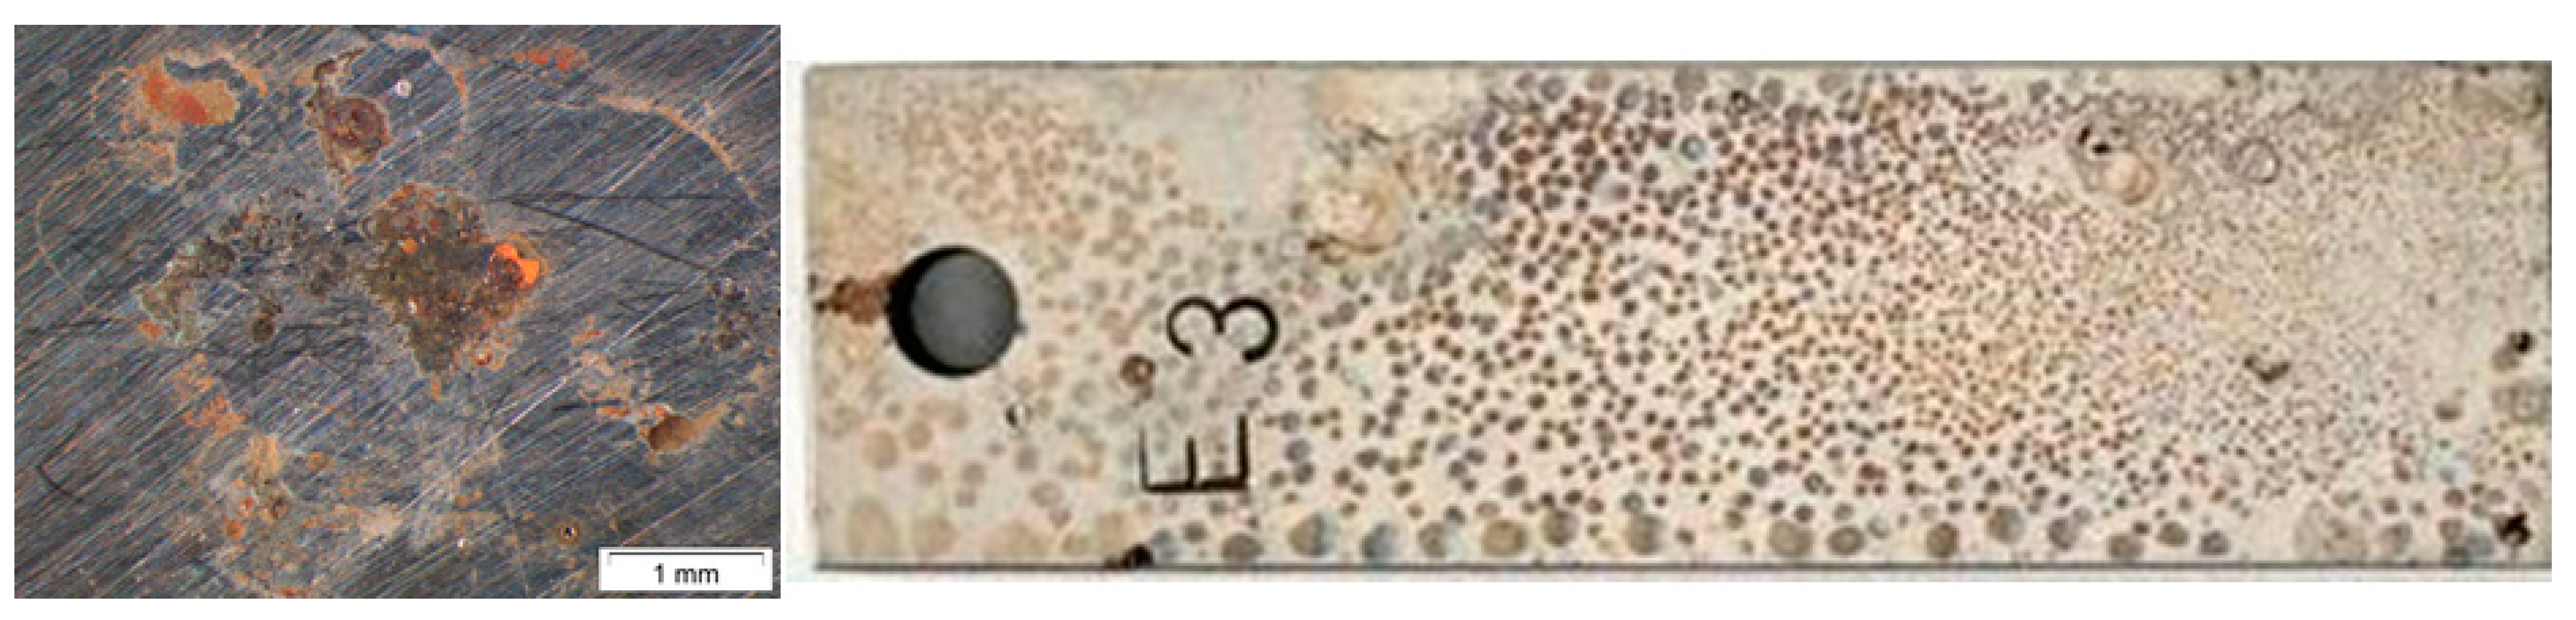
3.1. Surface Corrosion
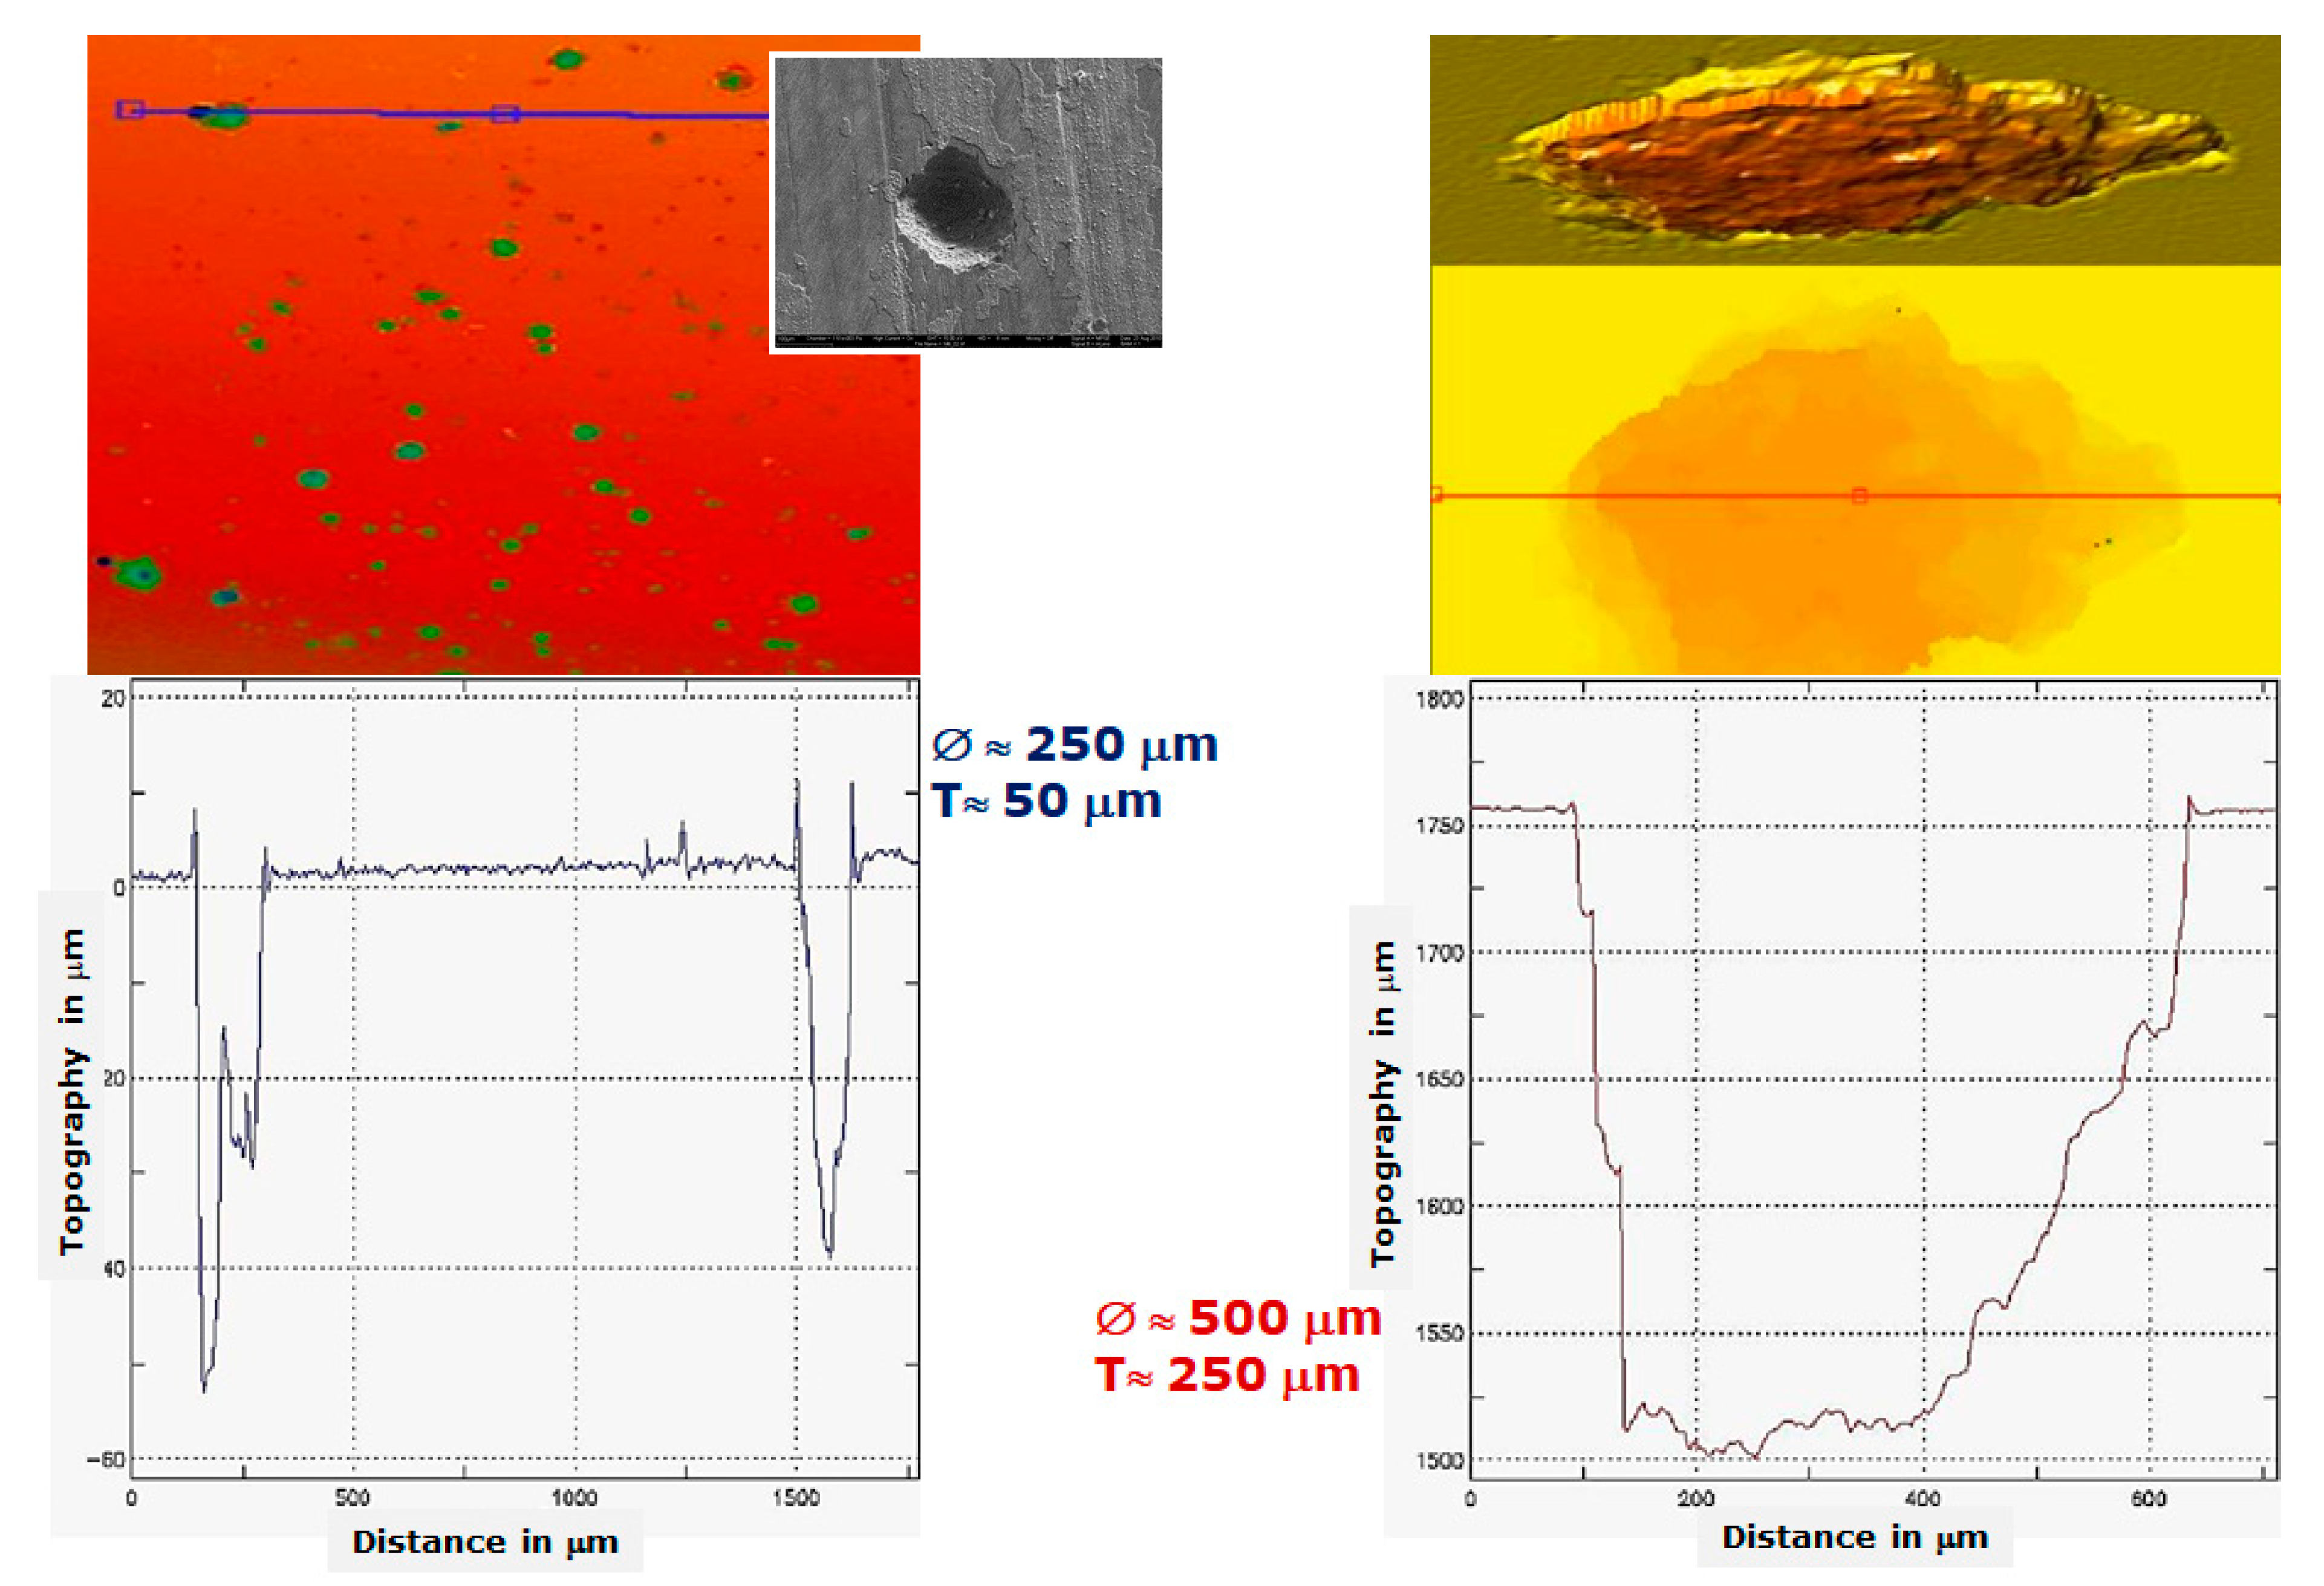
3.2. Local Corrosion
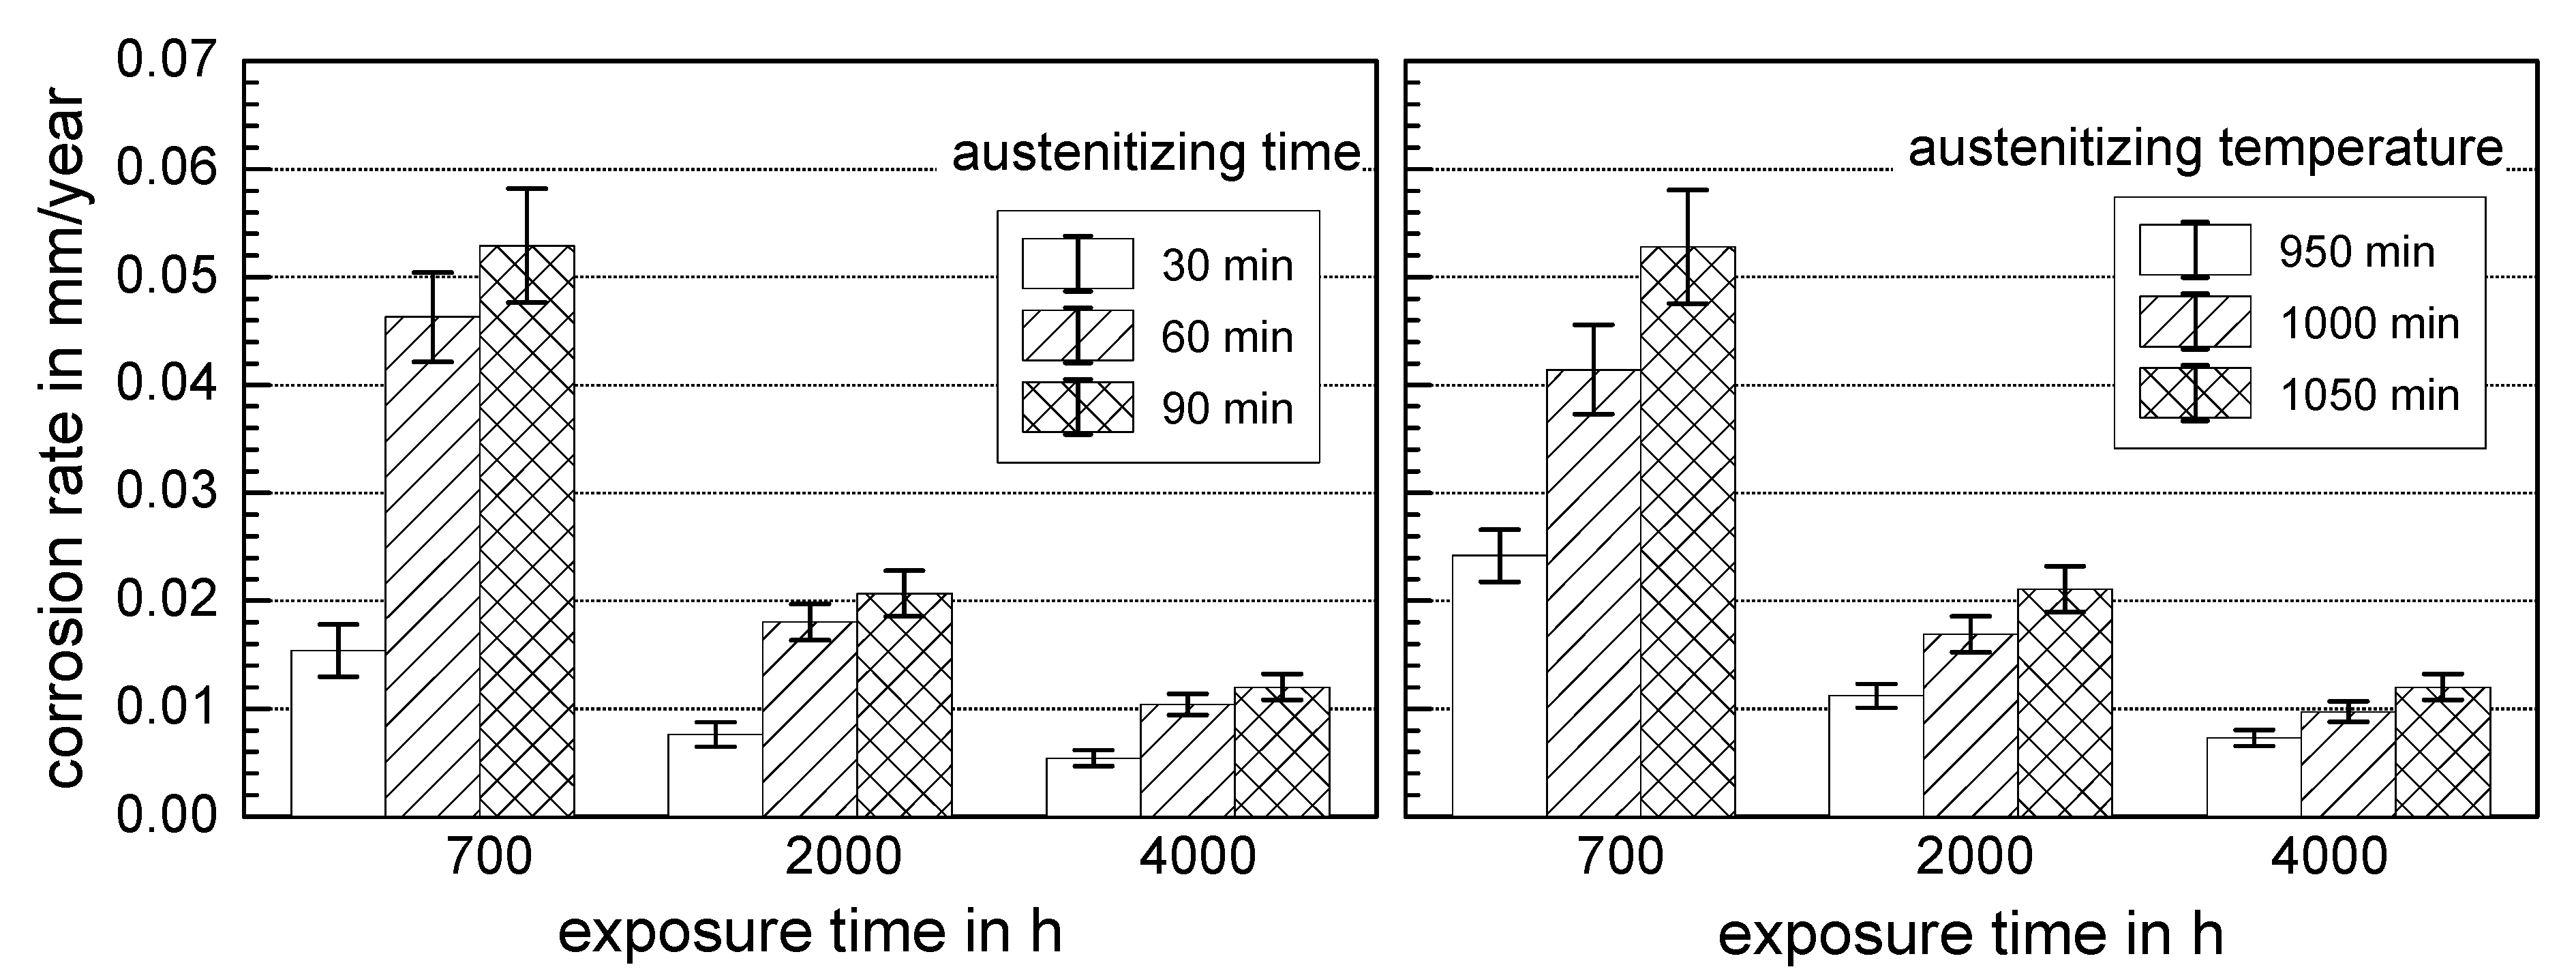
3.3. Influence of Heat Treatment
3.3.1. Surface Corrosion
3.3.2. Pit Corrosion
3.4. Statistical Approach in Corrosion Fatigue
- log(σa): Logarithm of stress amplitude σa, independent (error-free) variable x;
- log(Nf): Logarithm of cycles to failure Nf, dependent variable y (inaccurate);
- m: Estimate for the slope of the regression line;
- b: Estimate for the intercept of the regression line;
- tX: One-sided barrier of standard normal distribution for PS = x %;
- sN: Standard error of the estimate of N;
- PS: Probability of survival.
- N50 50% probability cycle value;
- NA reference cycle value;
- SA reference stress value;
- Sa selected stress value.
- N90 90% probability cycle value;
- N10 10% probability cycle value;
- TN scatter range.
3.5. Corrosion Fatigue of X46Cr13 (Air: σts = 680 MPa, σy = 345 MPa, Fatigue Limit: 260 MPa)
- σee: Estimated endurance limit in air from the yield and tensile strength in MPa;
- σy: Yield strength in MPa;
- σts: Tensile strength in MPa.
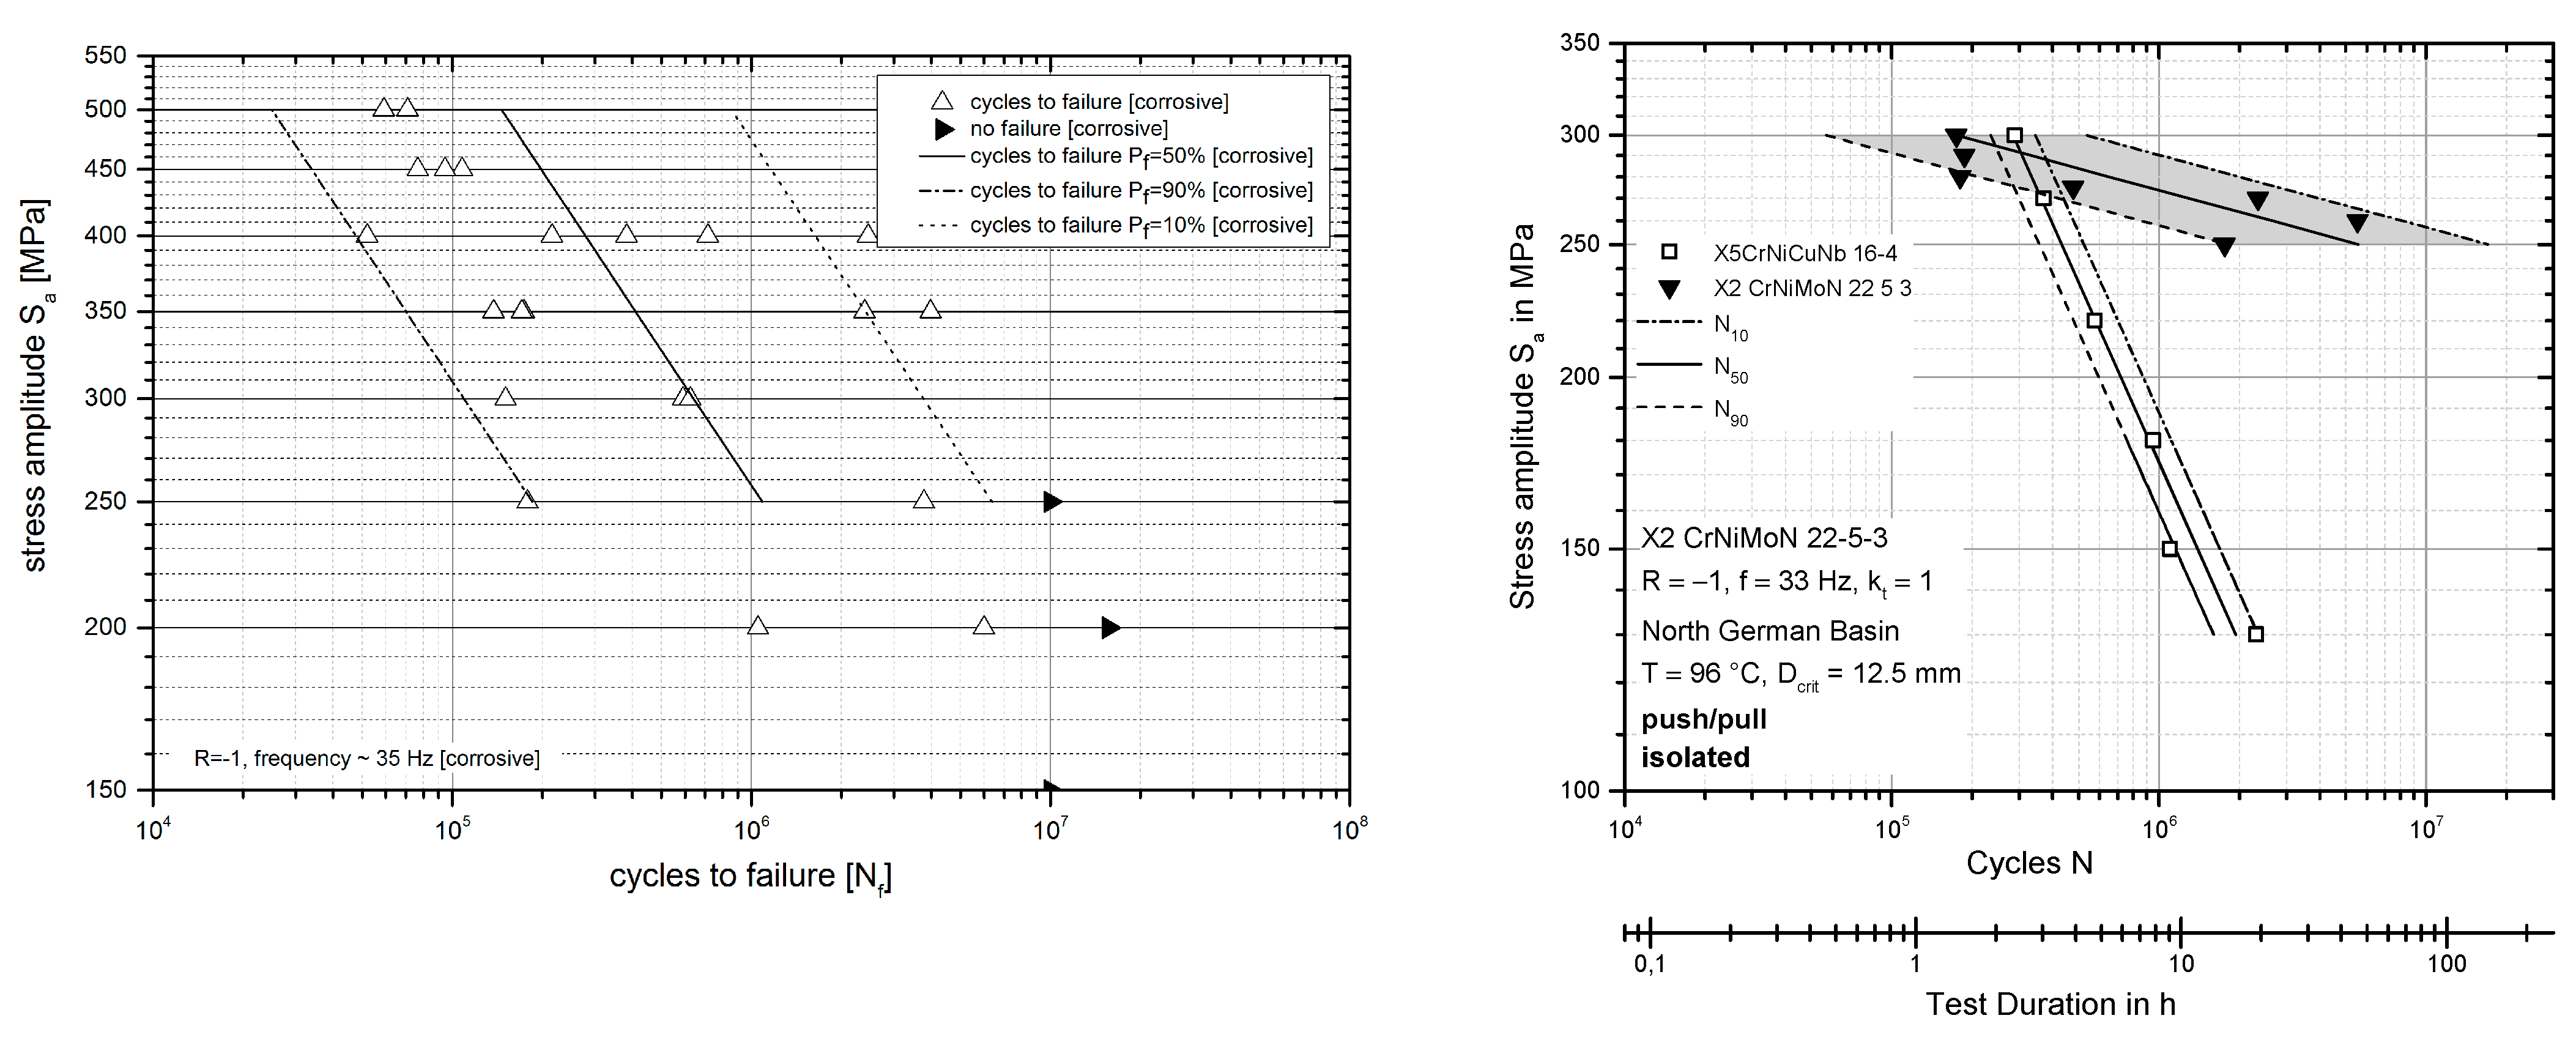
3.6. Corrosion Fatigue of X5CrNiCuNb16-4 (Air: Fatigue Limit: 620 MPa)
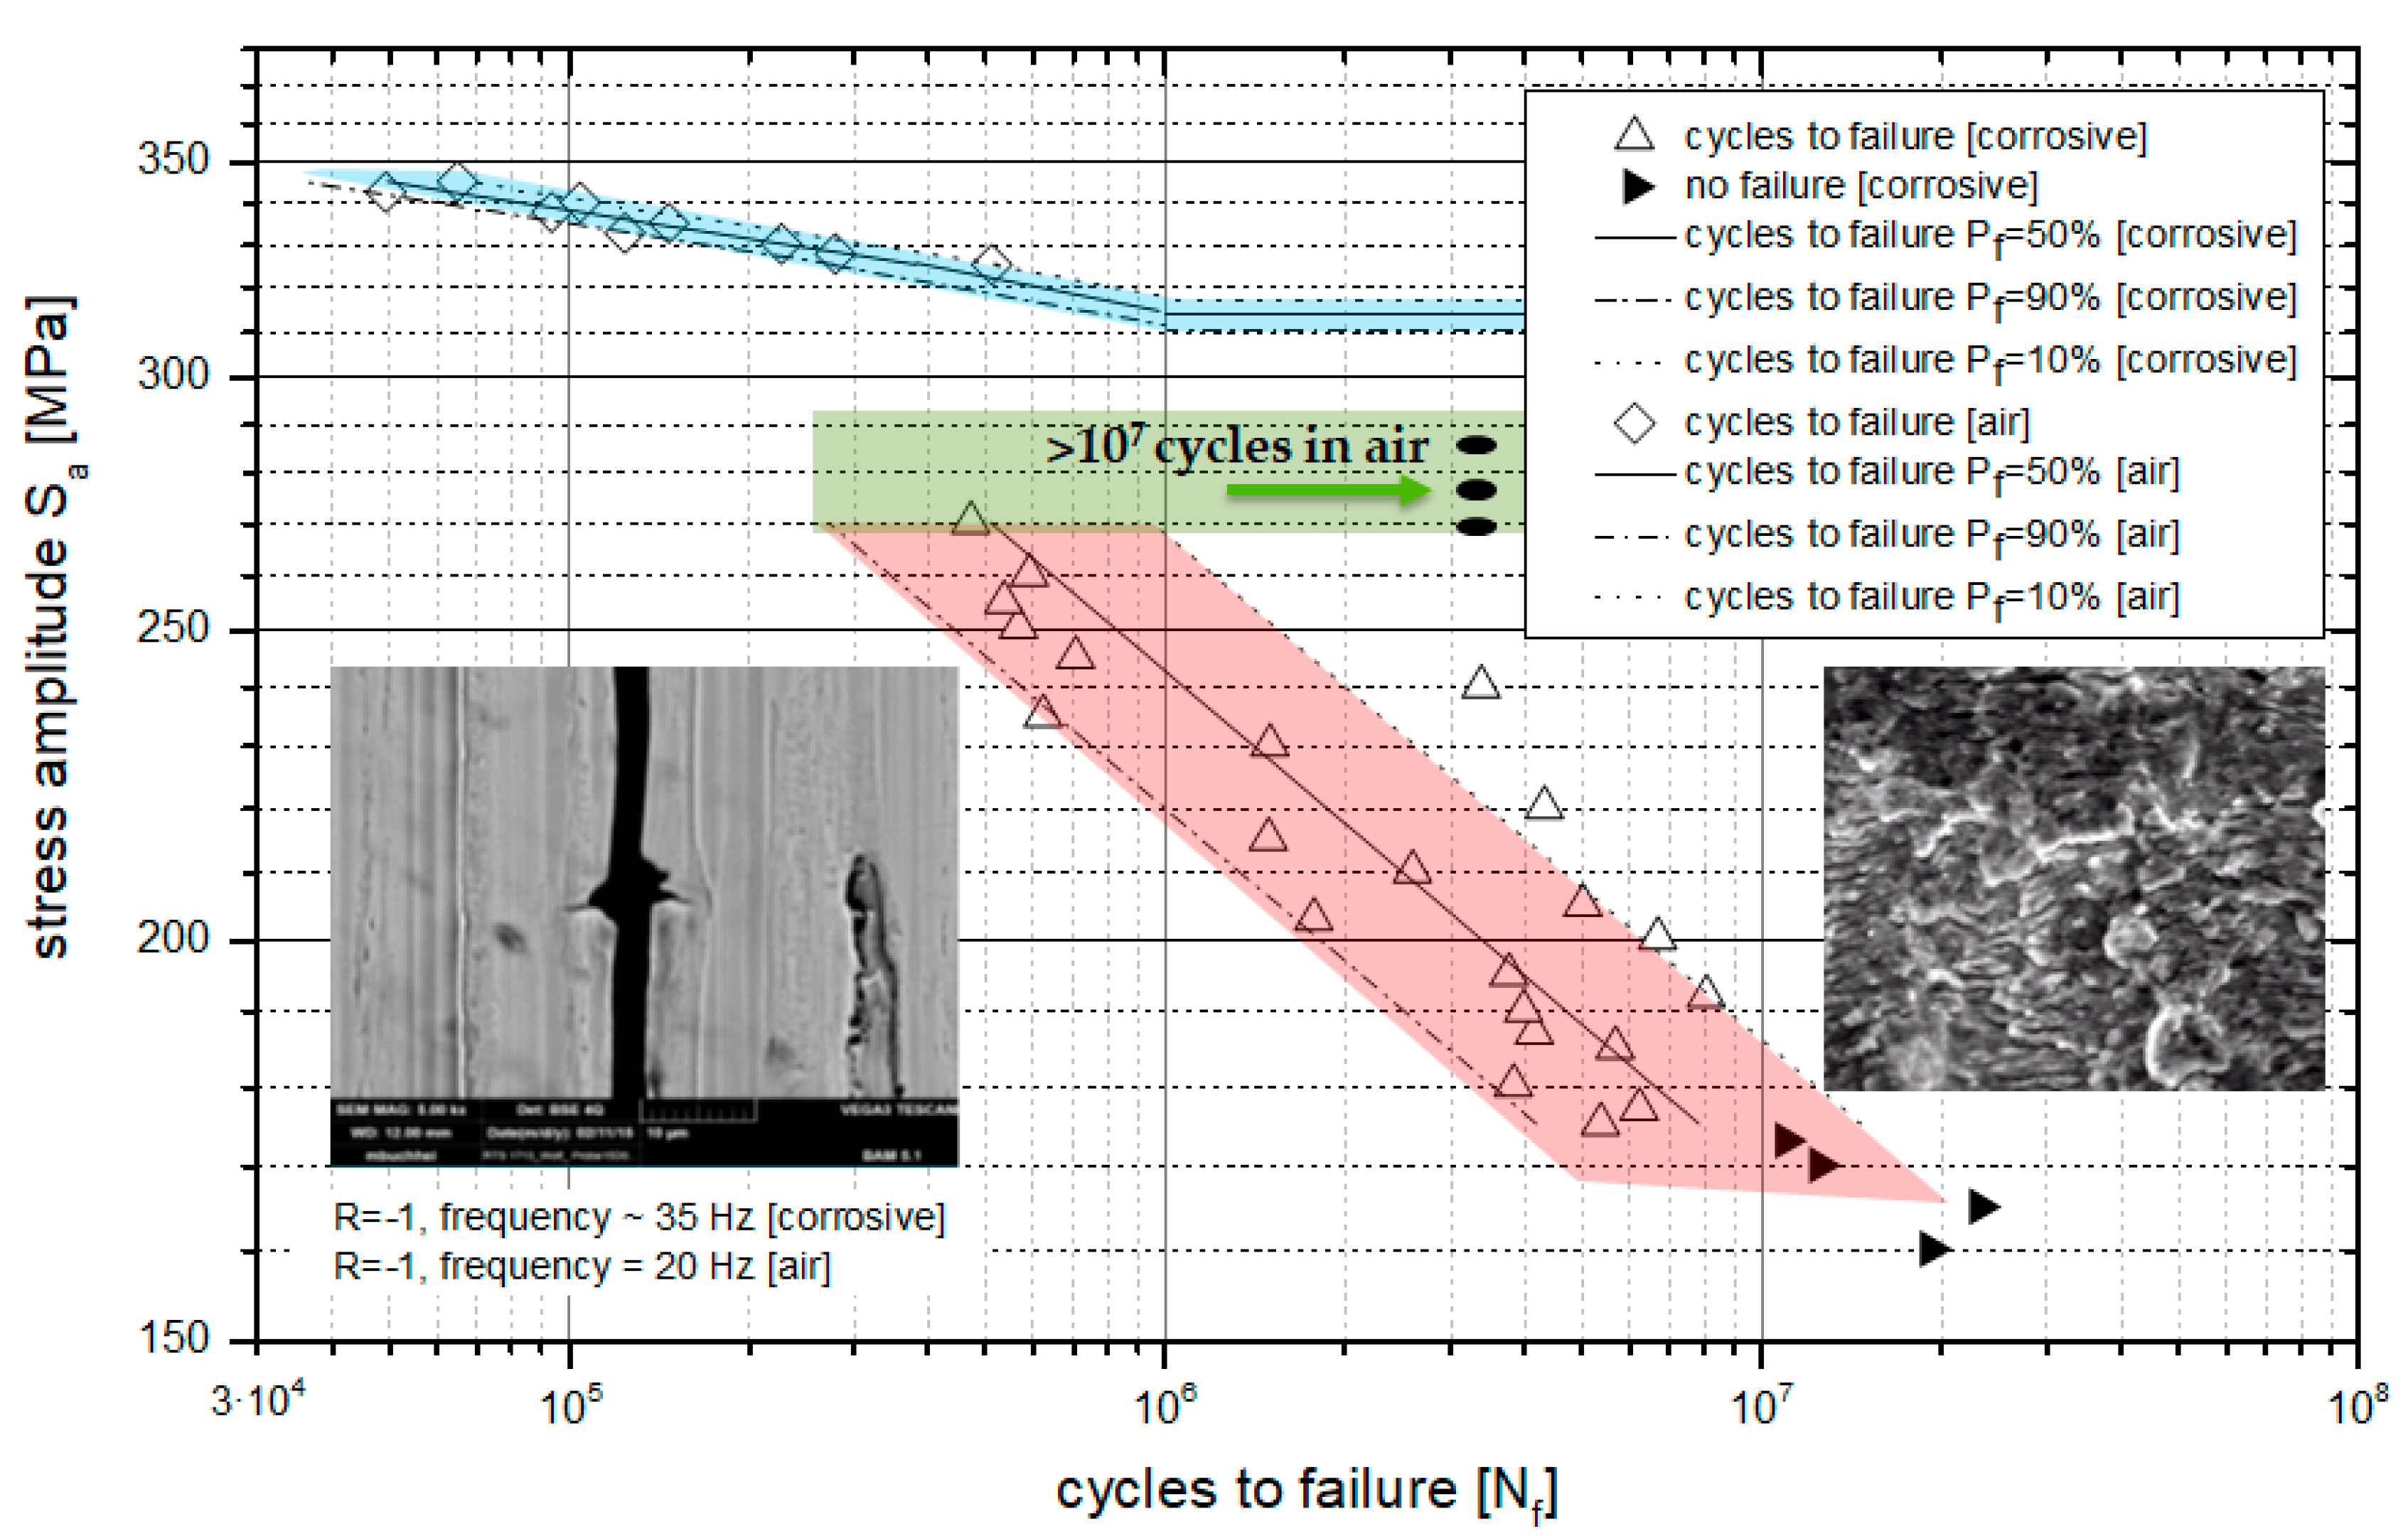
3.7. Corrosion Fatigue of X2CrNiMo22-5-3 (Air: Fatigue Limit: 485 MPa)
3.7.1. Influence of Machine Insulation
3.7.2. Influence of Electrochemical Potential
3.7.3. Influence of Load Type
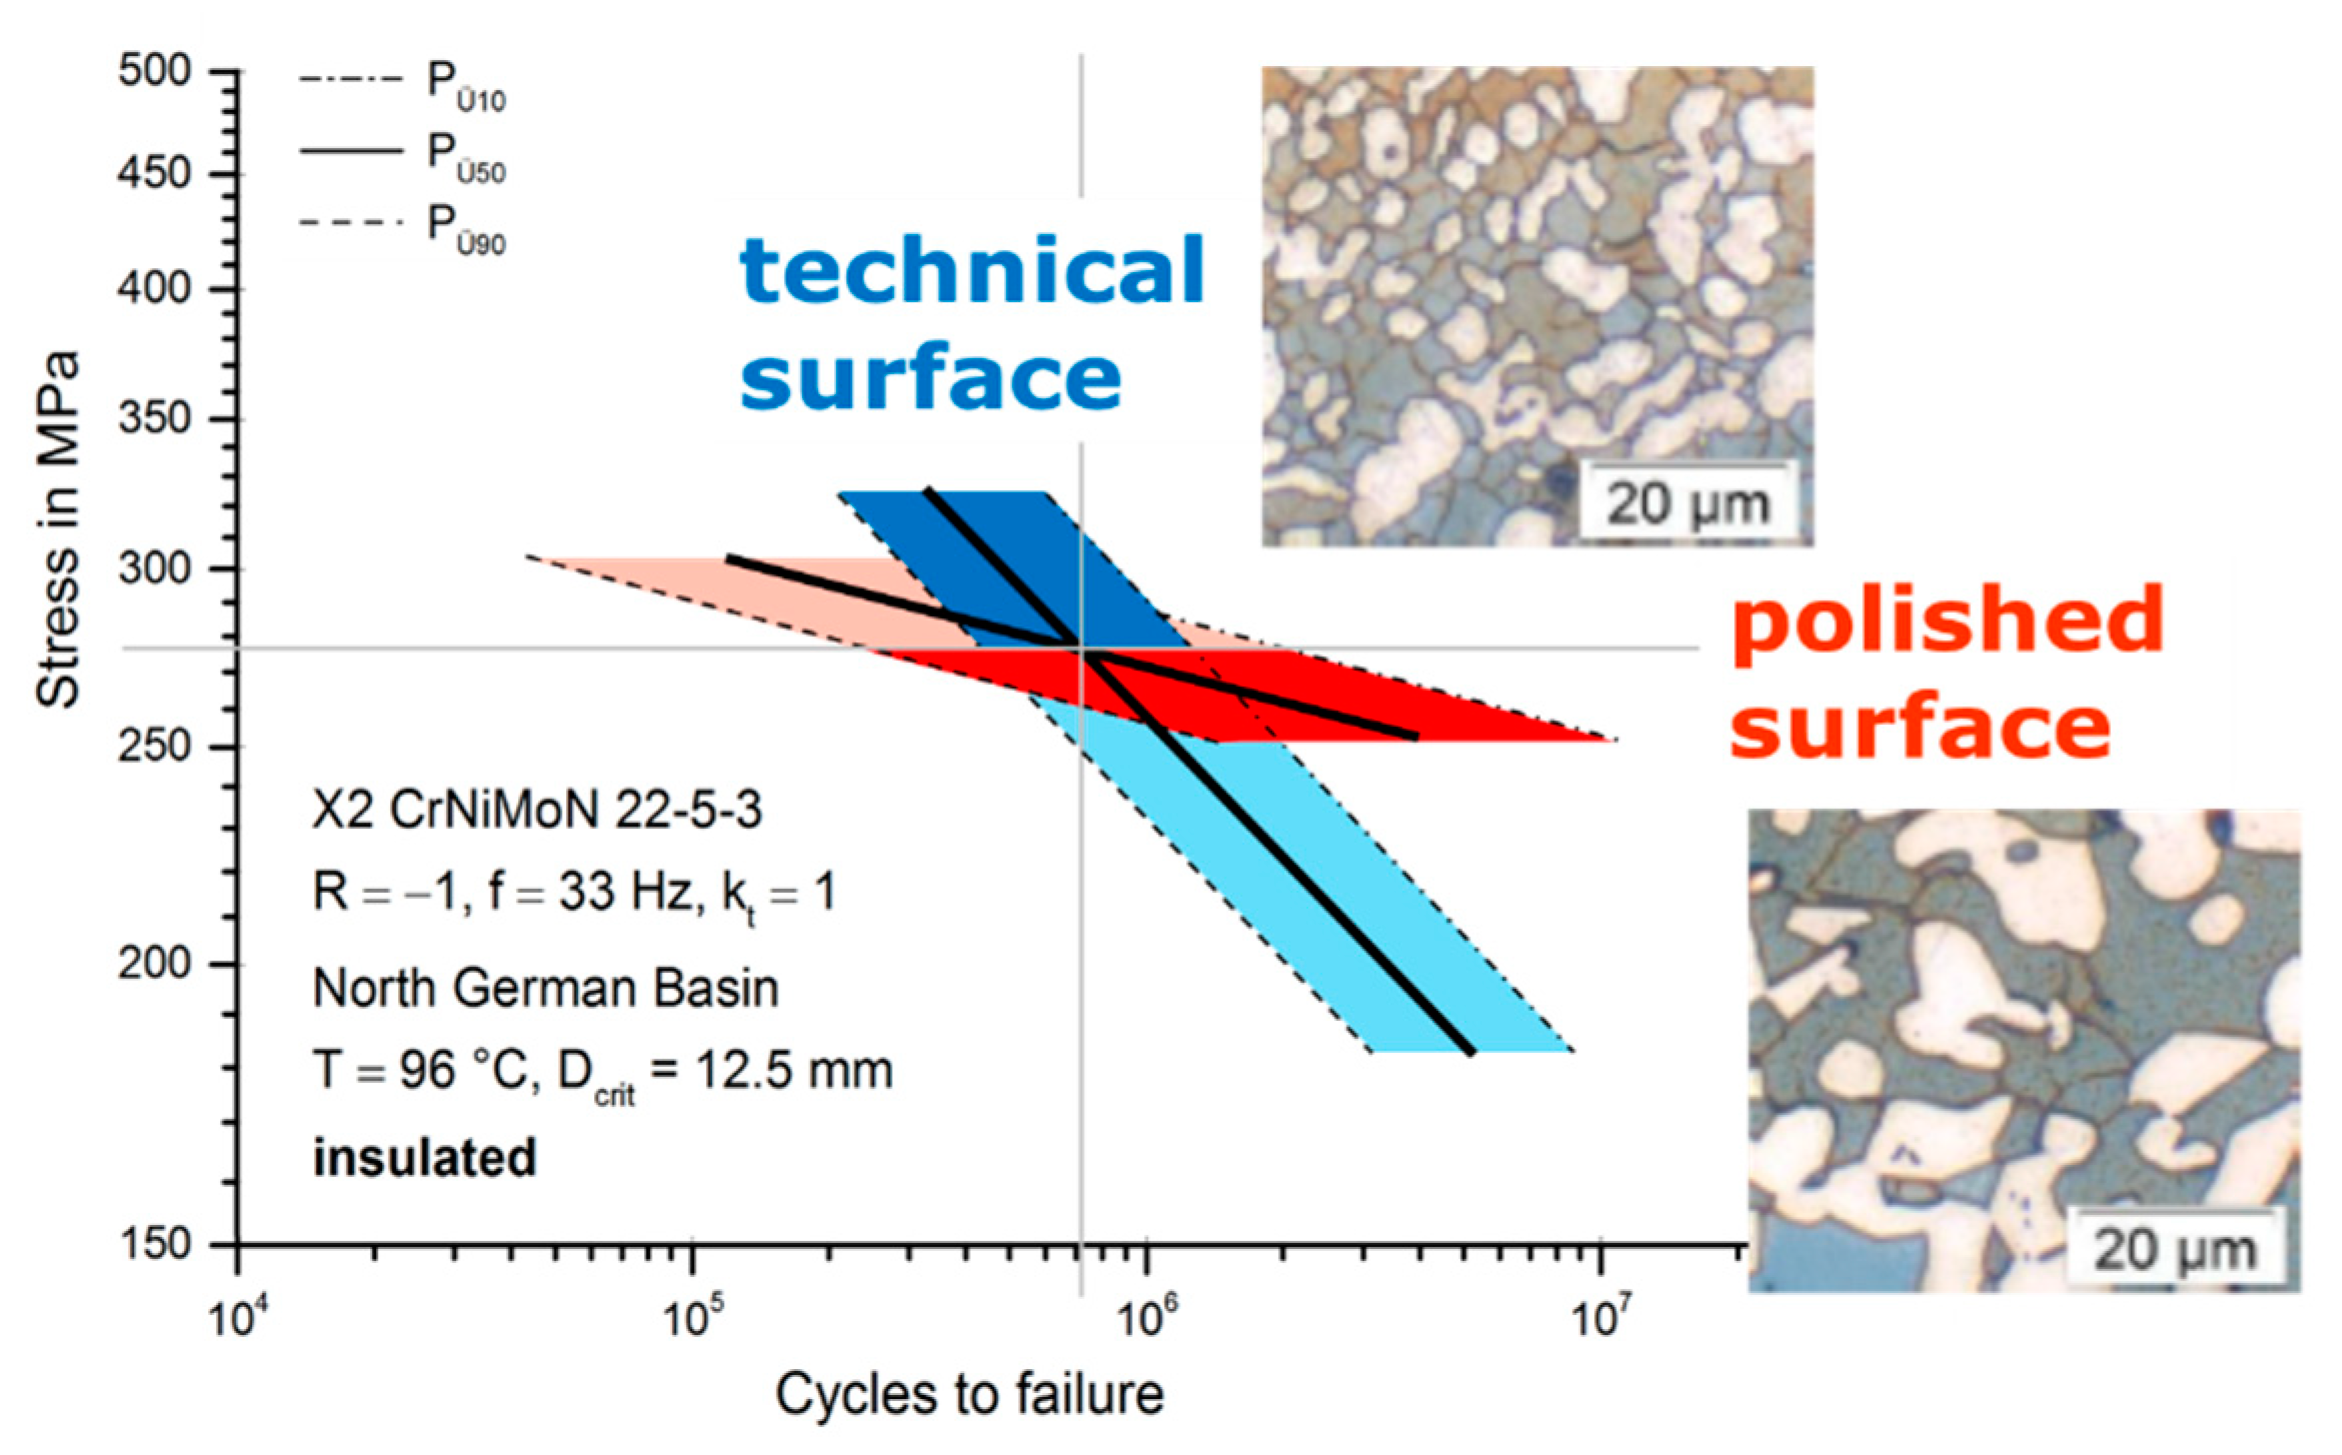
3.7.4. Influence of Surface Conditions
4. Discussion
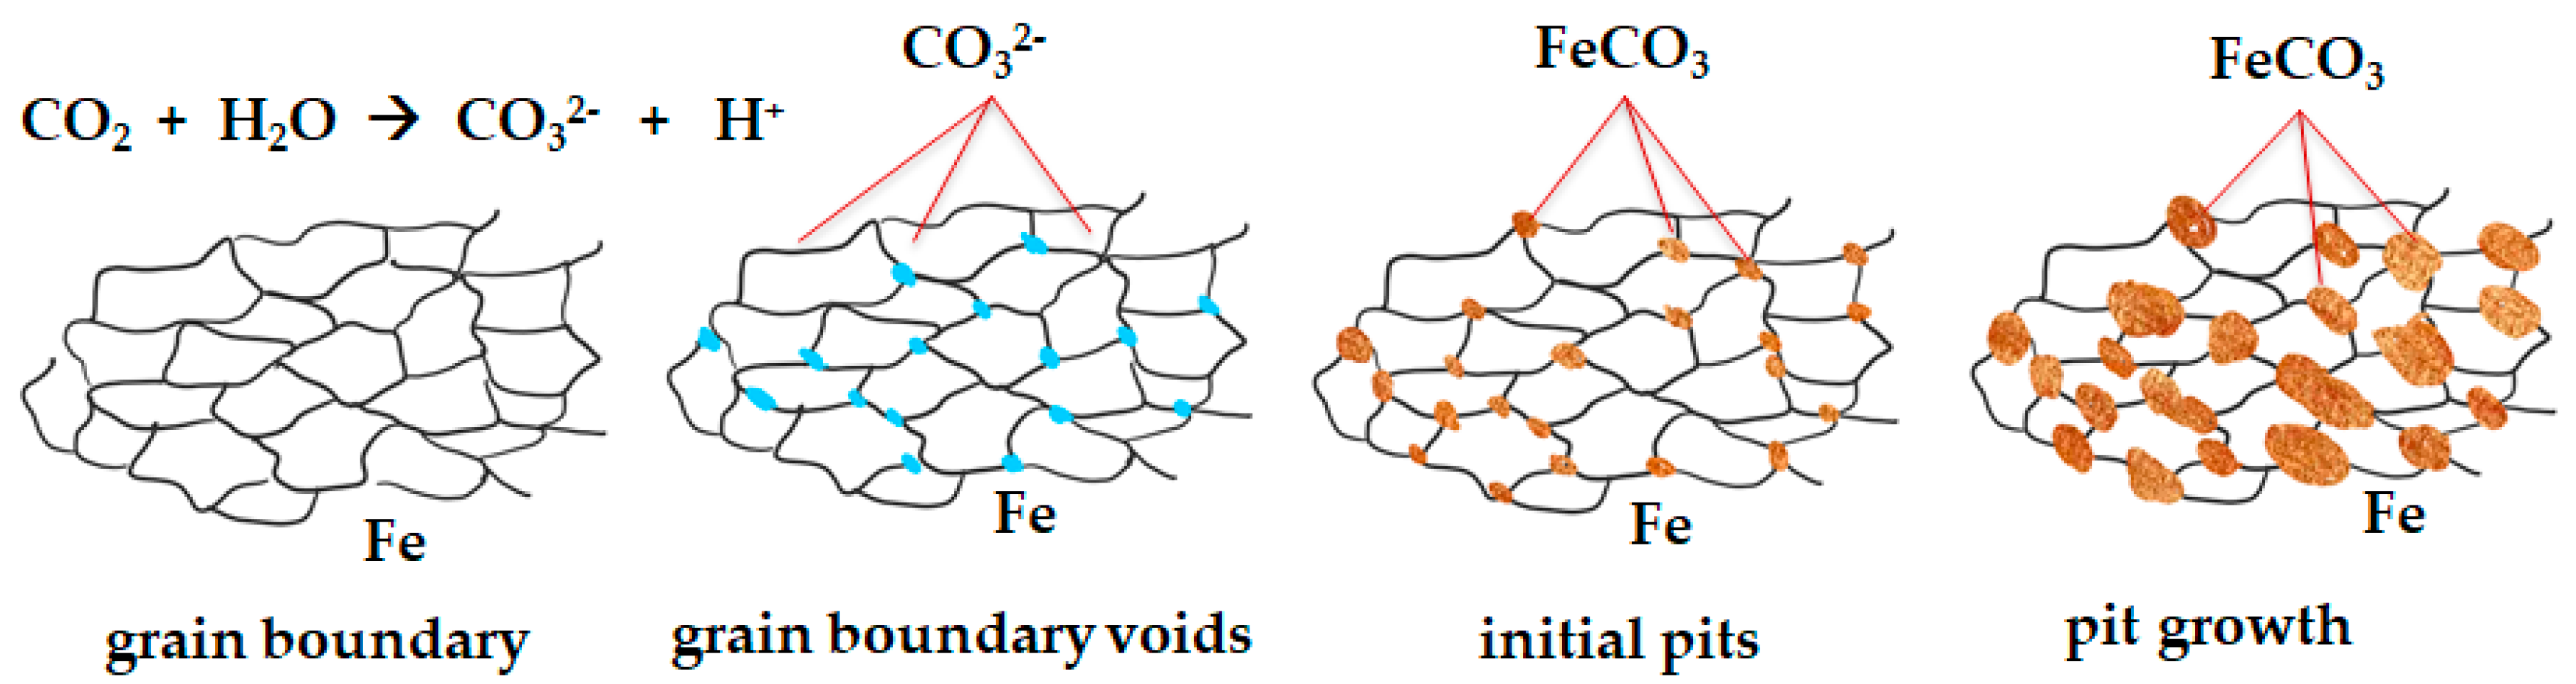
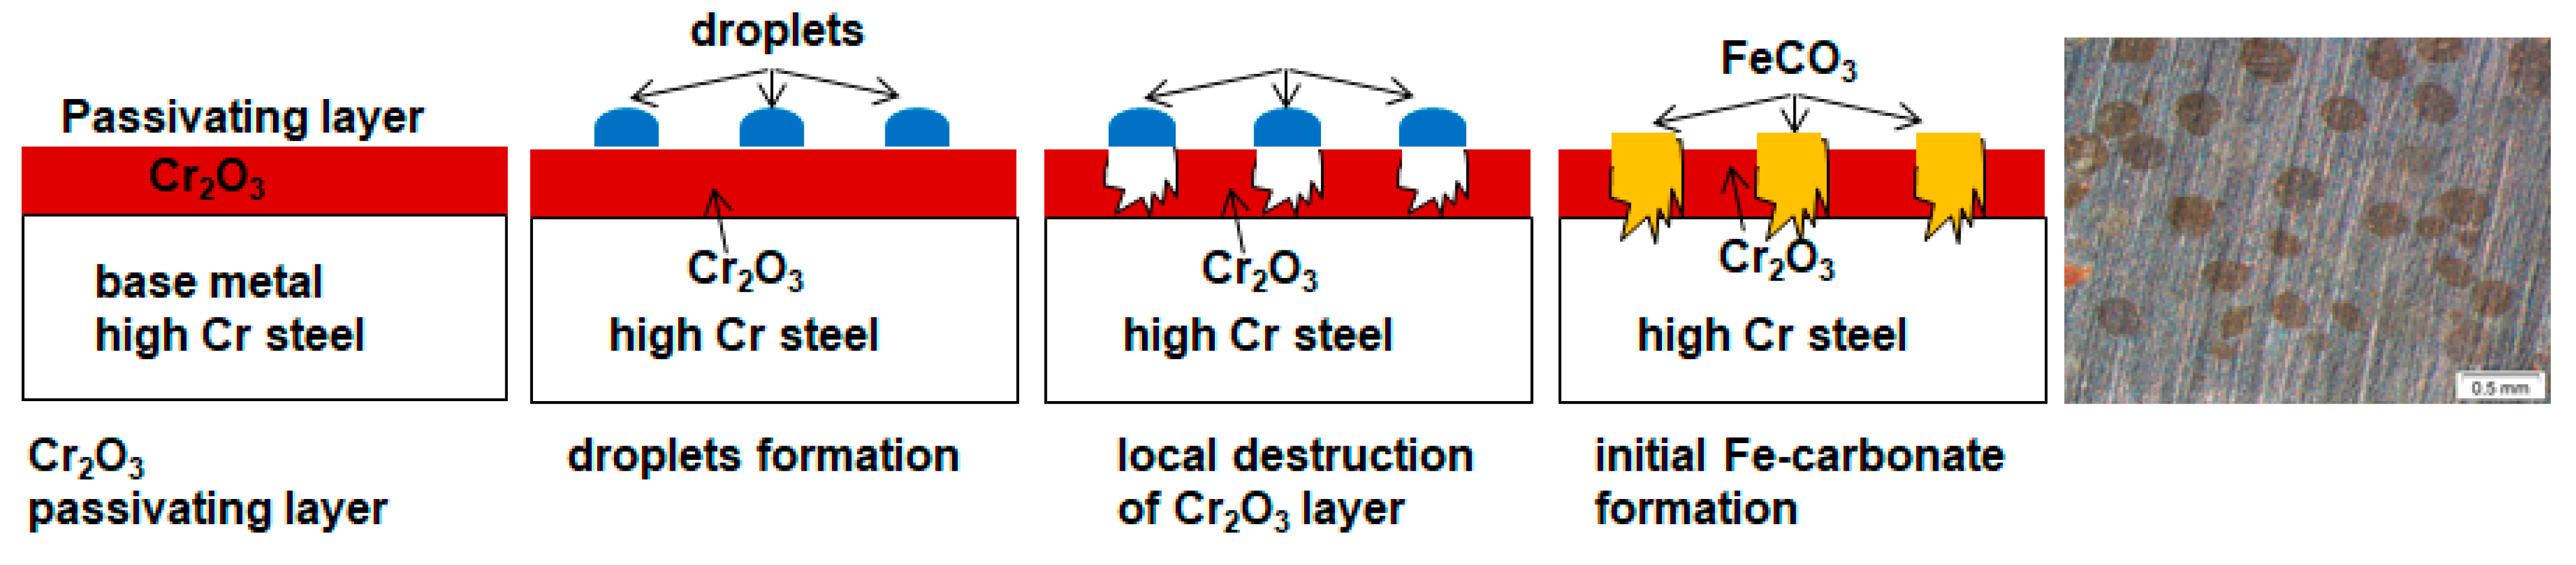
4.1. Precipitation of Corrosion Scales in a Geothermal Environment
4.2. Influence of Austenitizing
4.3. Crack Initiation and Corrosion Fatigue Failure of High Alloyed Steels X46Cr13 and X5CrNiCuNb16-4
4.4. Influence of Surface Quality on the Corrosion Fatigue of Duplex Stainless Steel X2CrNiMoN22-5-3
4.5. Failure of Duplex Stainless Steel X2CrNiMoN22-5-3 in a Geothermal Environment
5. Conclusions
5.1. Static Corrosion
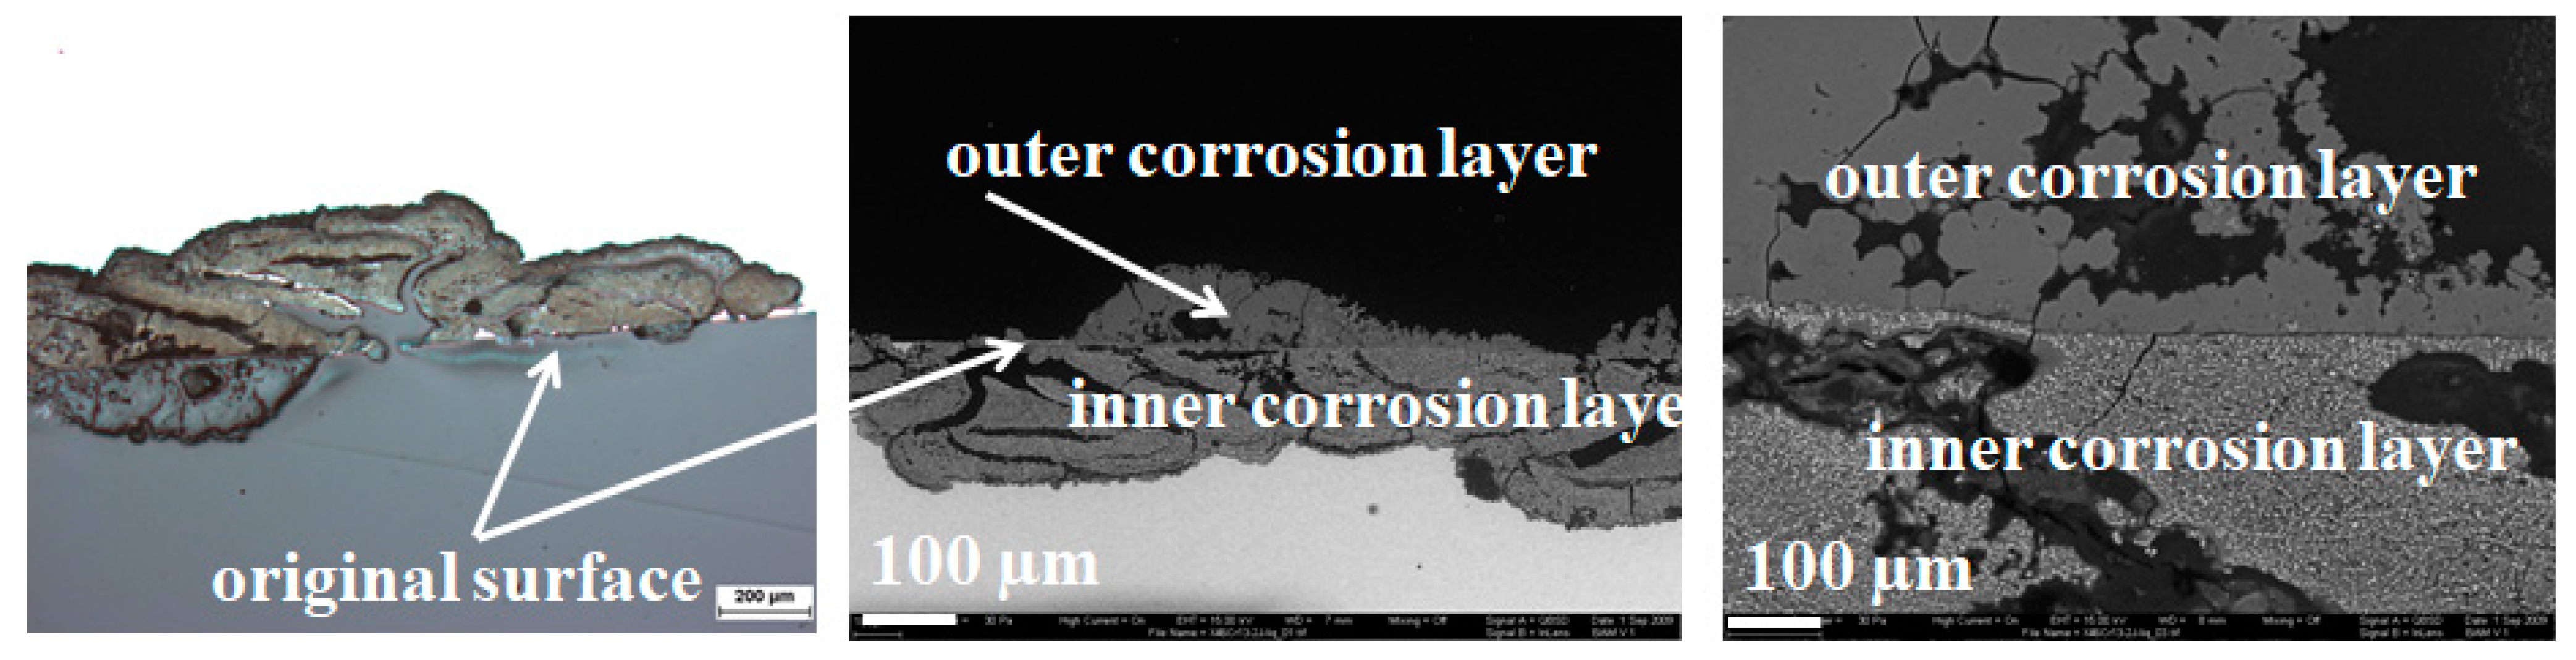
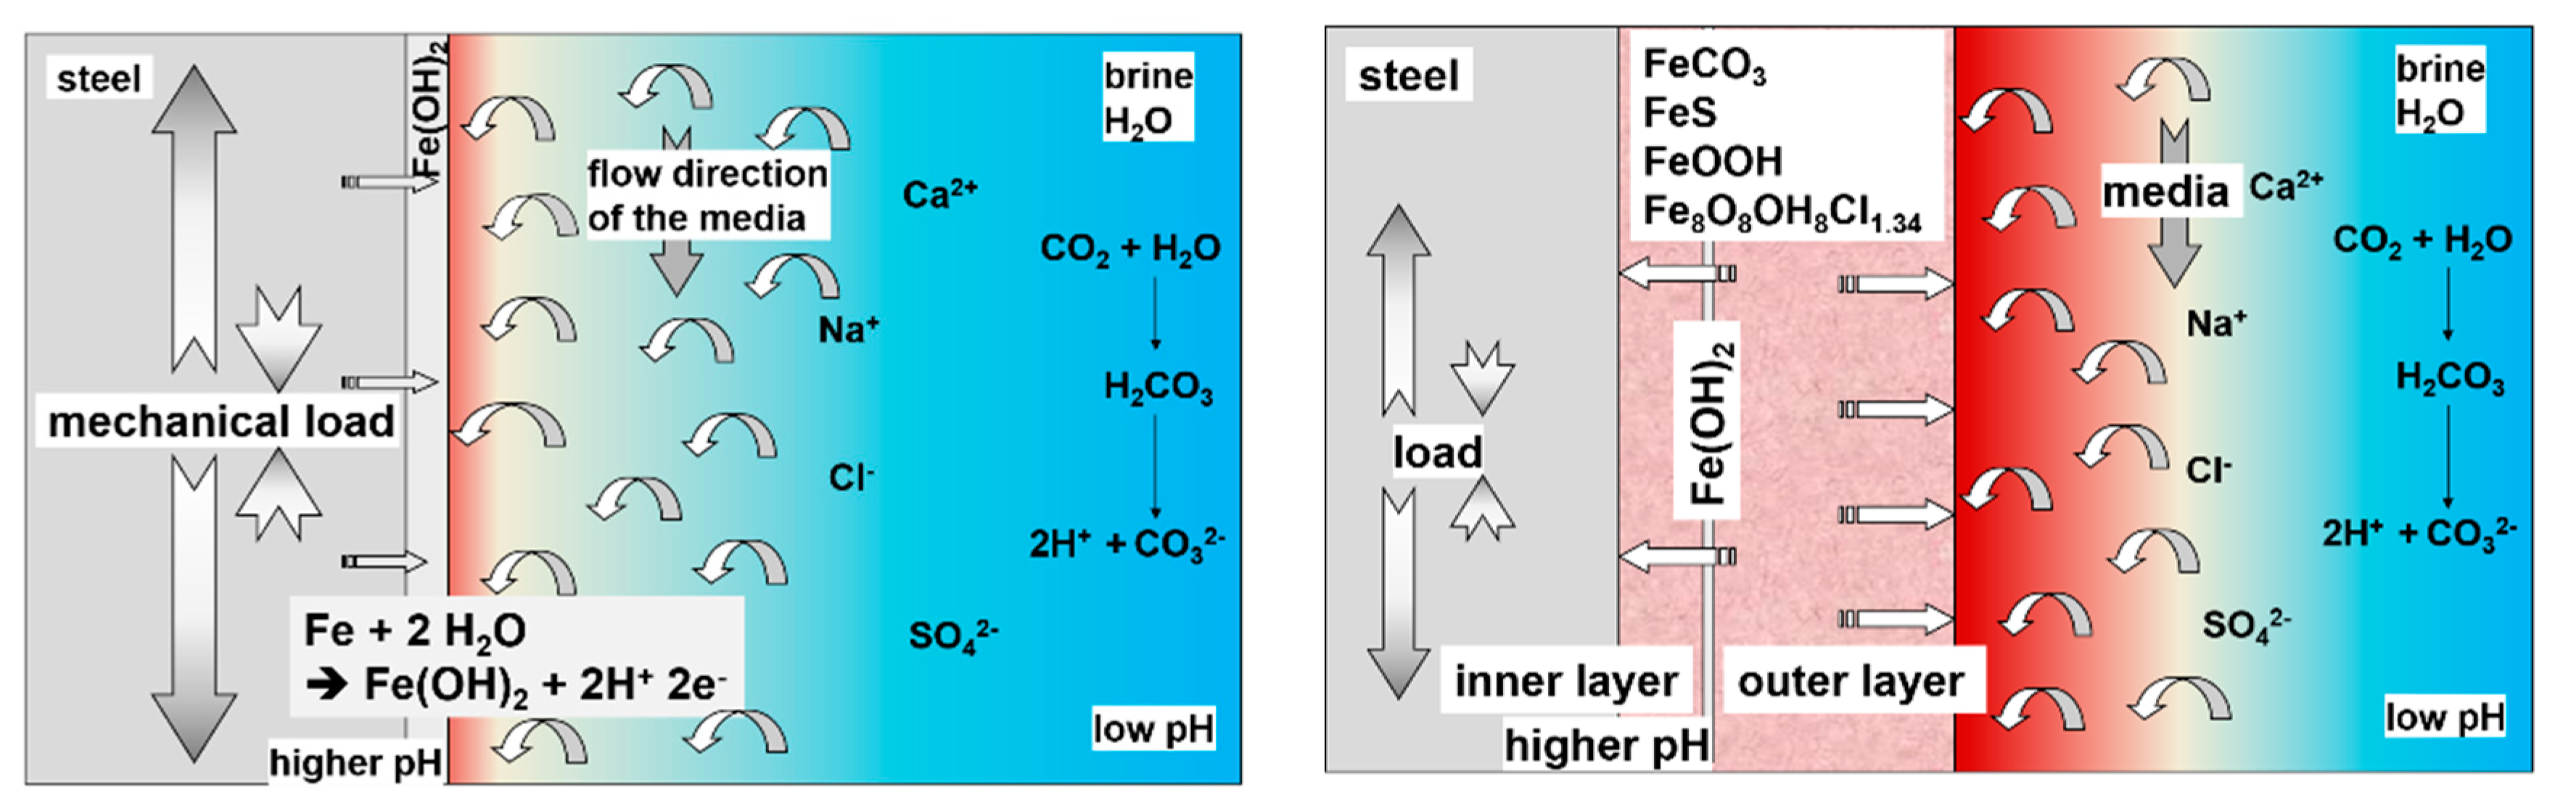
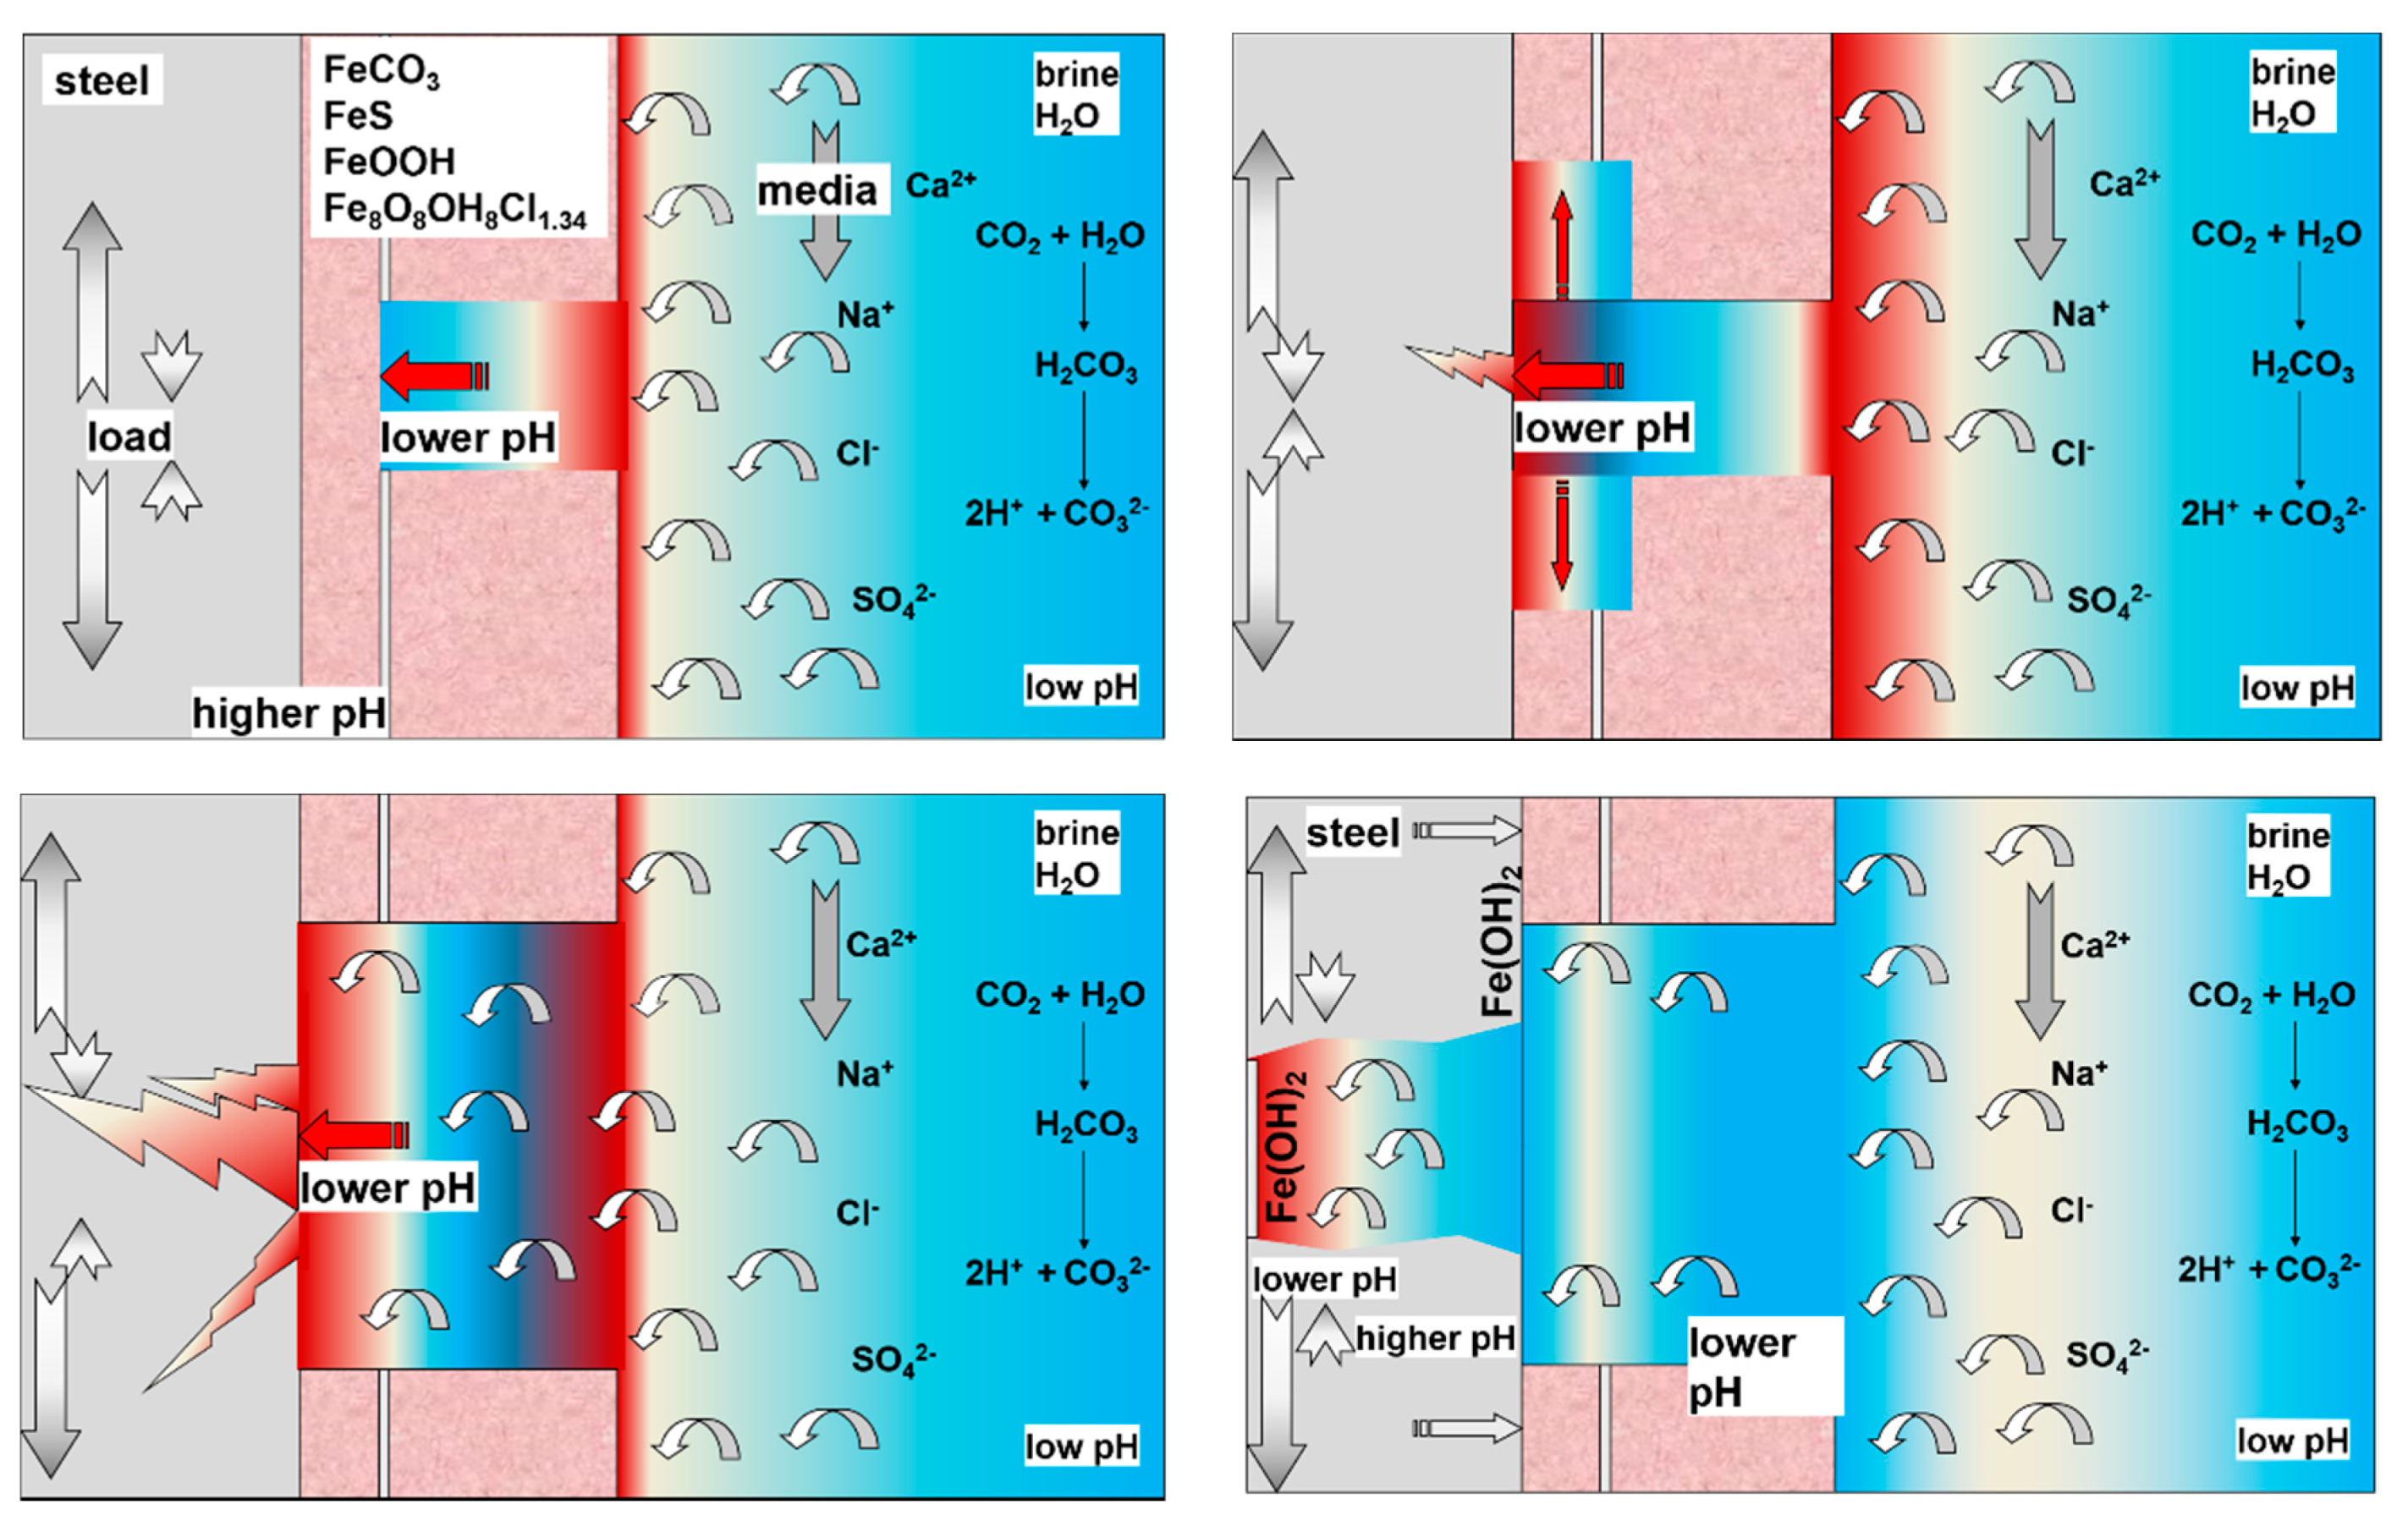
- Corrosion products: The continuous corrosion scale and pits of all steels mainly comprises of FeCO3 and FeOOH at ambient pressure as well as 100 bar. X5CrNiCuNb 16-4 shows an unusual non-uniform ellipsoidal corrosion layer additionally containing Fe3C and in the center Fe2O3 and FeSO4.
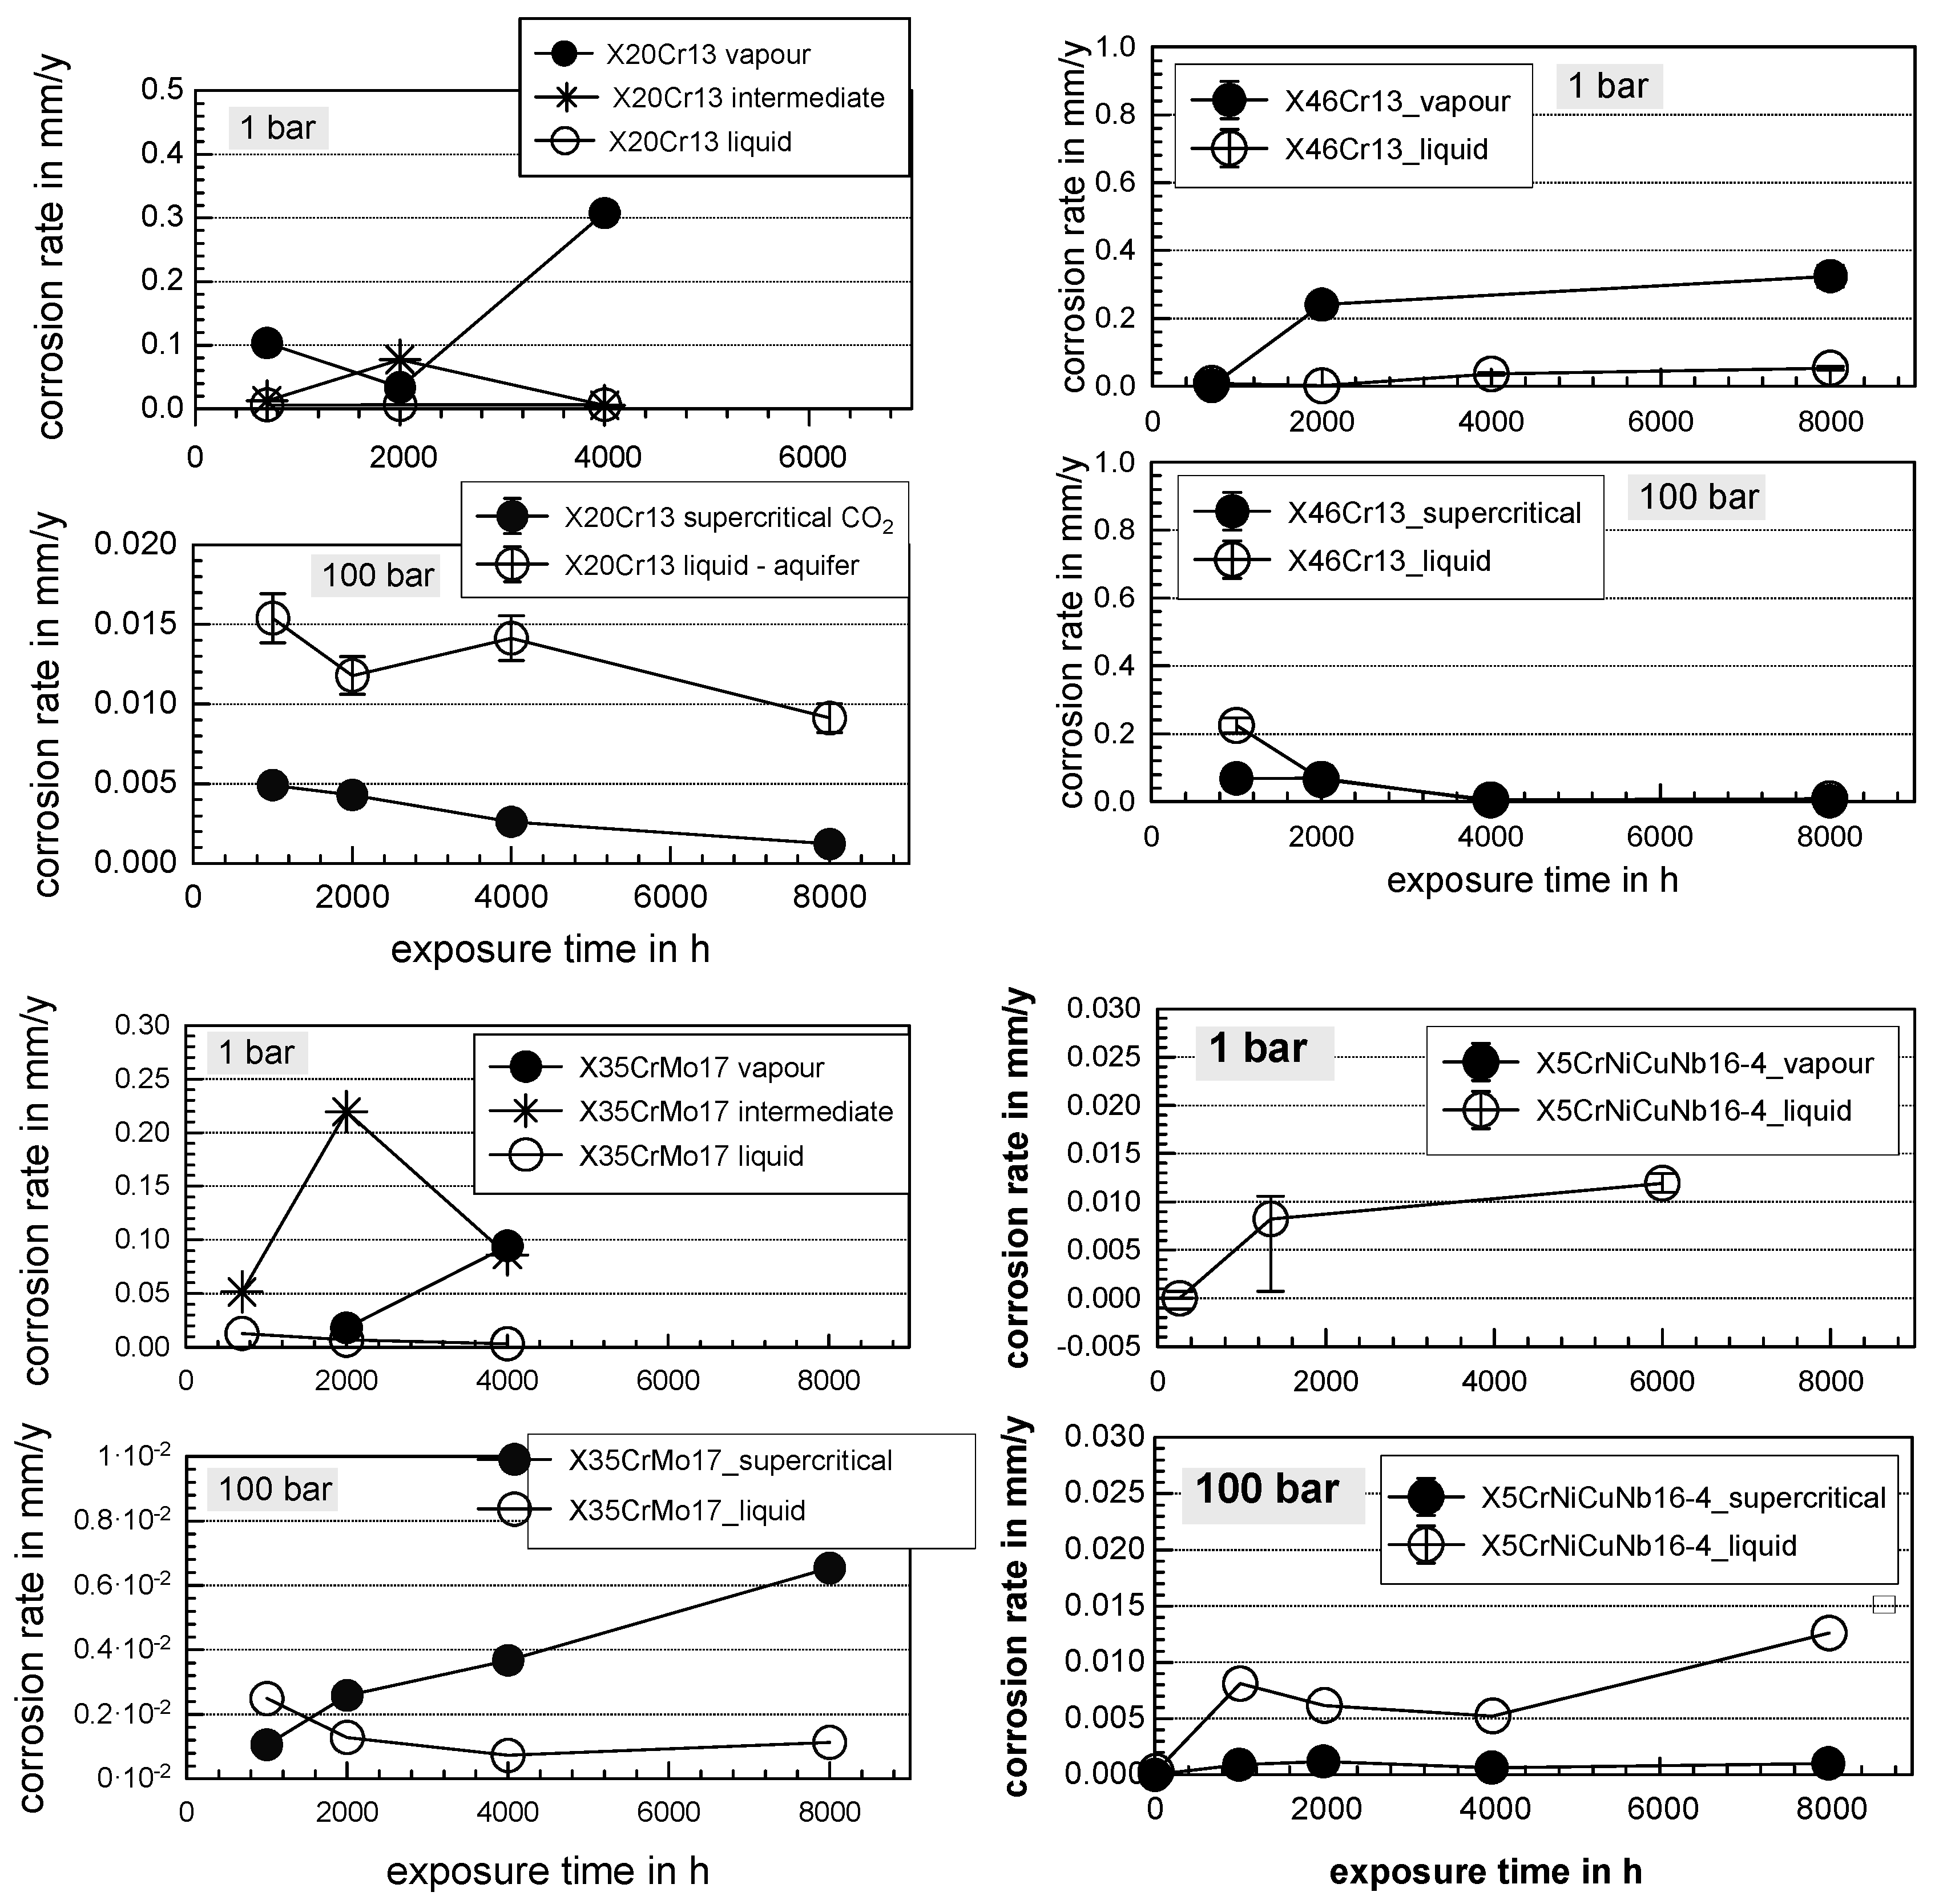
- Influence of pressure: After 8000 h of exposure, corrosion rates are generally much lower at 100 bar than at ambient pressure (depending on the atmosphere: (Vapor or liquid) by a factor of ca. 10–80 for 42CrMo4, a factor of ca. 1.5–30 for X46Cr13, a factor of ca. 10–100 for X20Cr13, and a factor of ca. 10 for X35CrMo17-1. (Note that X5CrNiCuNb16-4 shows similar surface corrosion rates in the liquid phase).
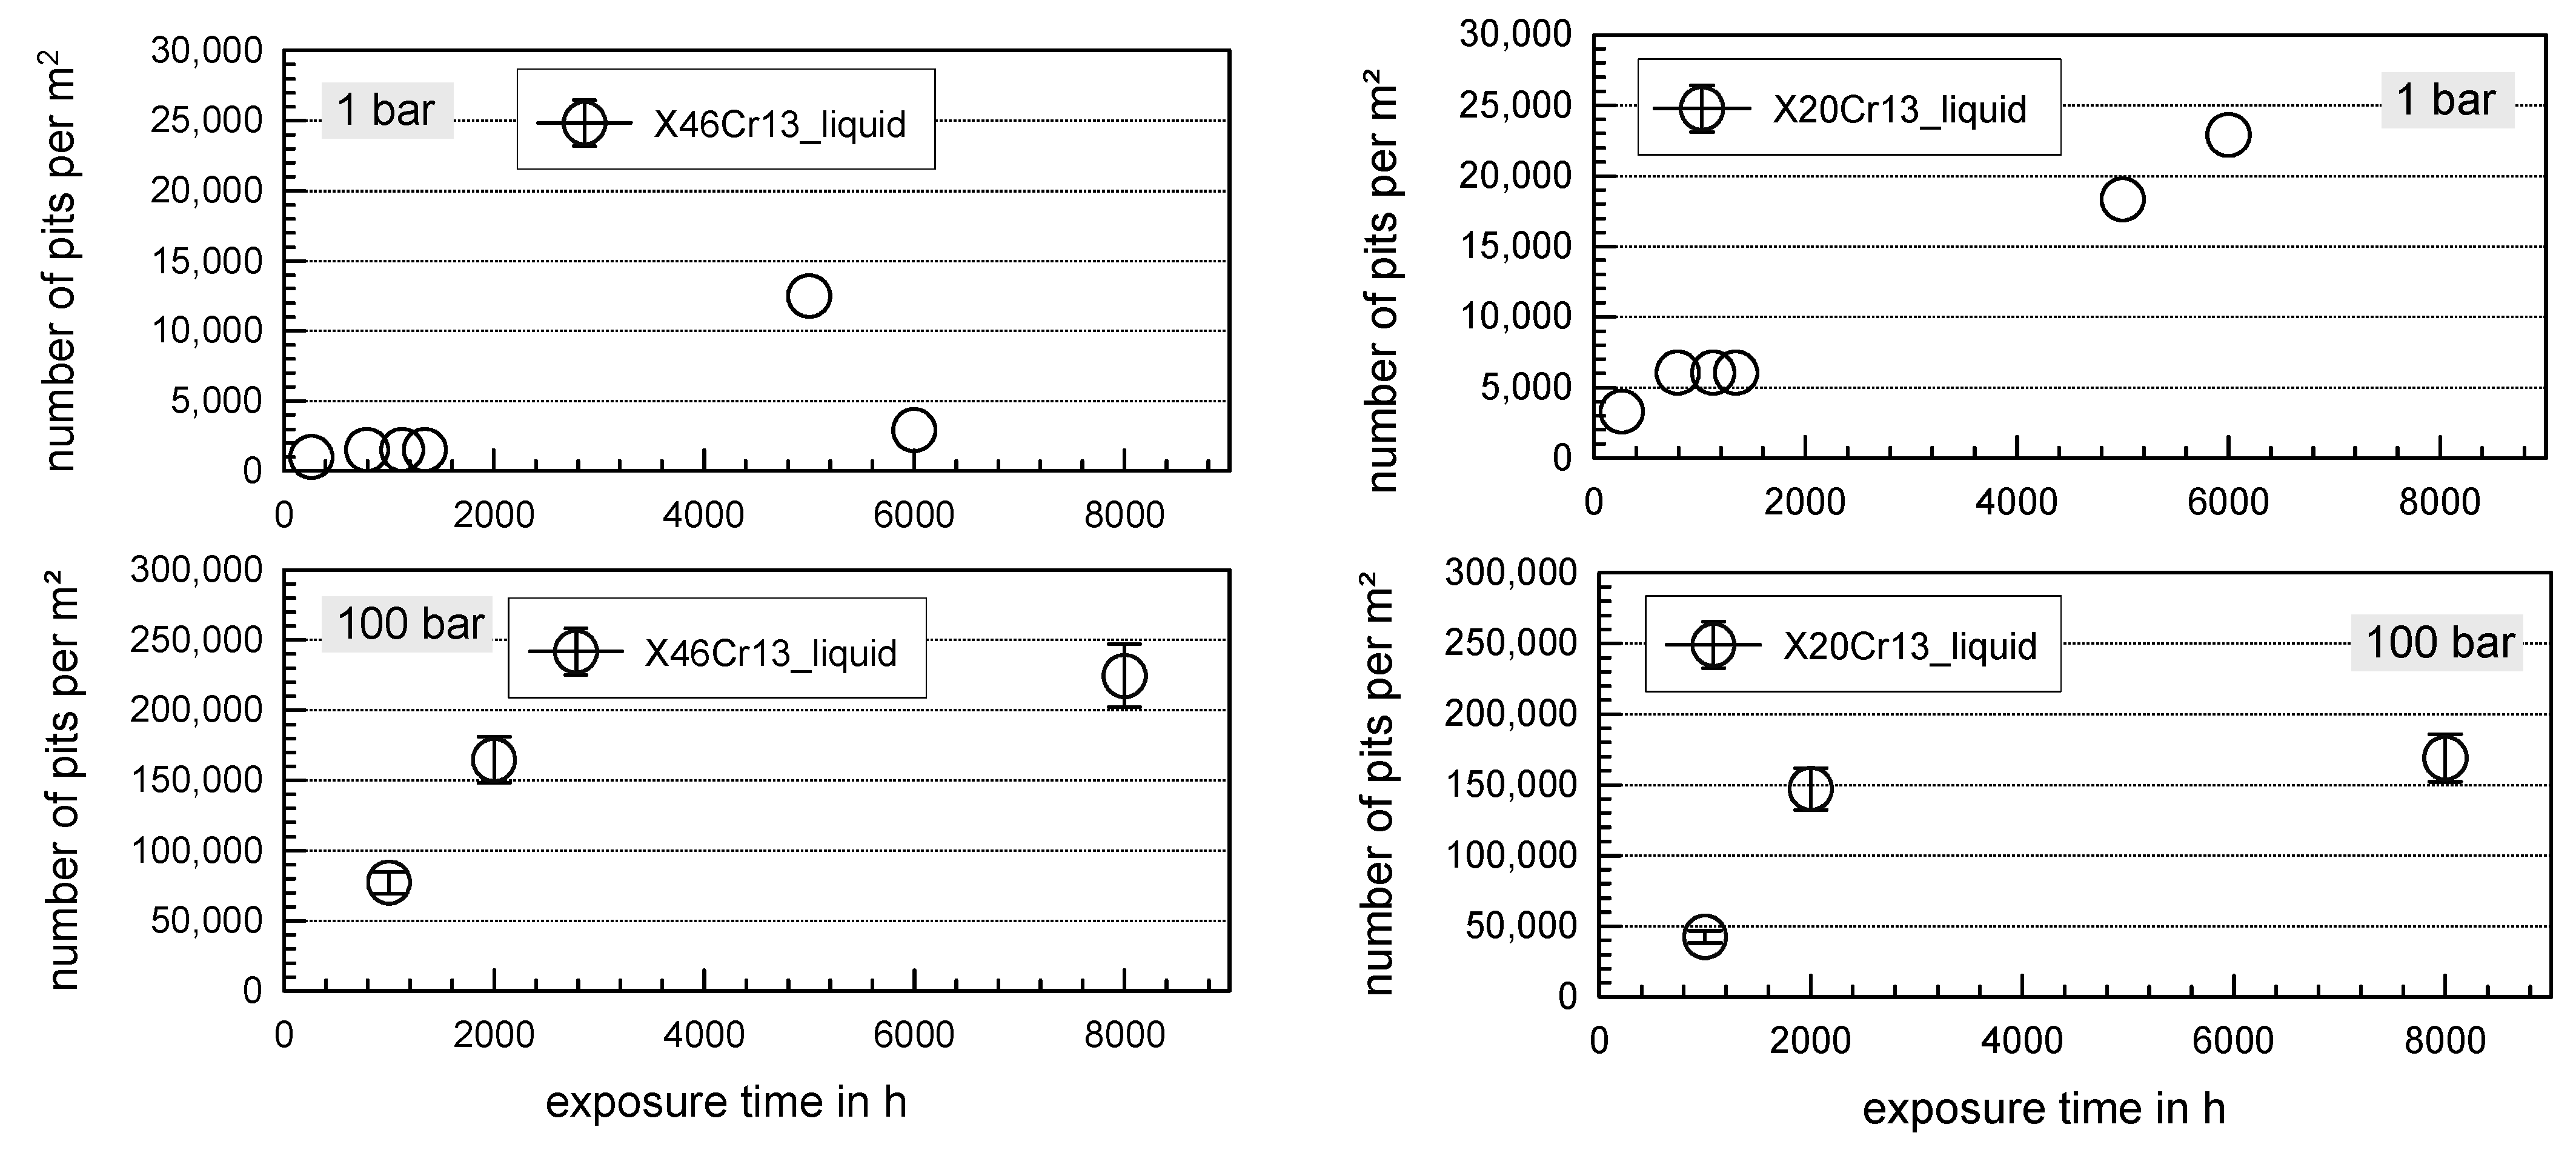
- Influence of atmosphere: Generally, the corrosion rates at ambient pressure are higher in the vapor phase, at 100 bar higher corrosion rates are found in the liquid phase. Independent of pressure the higher number of pits was found for the liquid phase.
- Influence of alloy composition: Higher chromium content increases surface corrosion resistance, while carbon has no significant influence (ambient pressure, vapor phase: 0.8 mm/year for 42CrMo4 (1% Cr), 0.3 mm/year for X46Cr13 (13% Cr), 0.3 mm/year for X20Cr13 (13% Cr), 0.1 mm/year for X35CrMo17-1 (17% Cr), and 0.01 mm/year for X5CrNiCuNb16-4 (16% Cr)). However, the local corrosion behavior of X35CrMo17-1 and X5CrNiCuNb16-4 compares to the less costly X20Cr13 and X46Cr13. At 100 bar and 8000 h of exposure with no significant regard of atmosphere, the highest corrosion rates are 0.01 mm/year for 42CrMo4, X20Cr13 (liquid phase) X46Cr13, and less than 0.01 mm/year for X35CrMo4 and X5CrNiCuNb16-4.
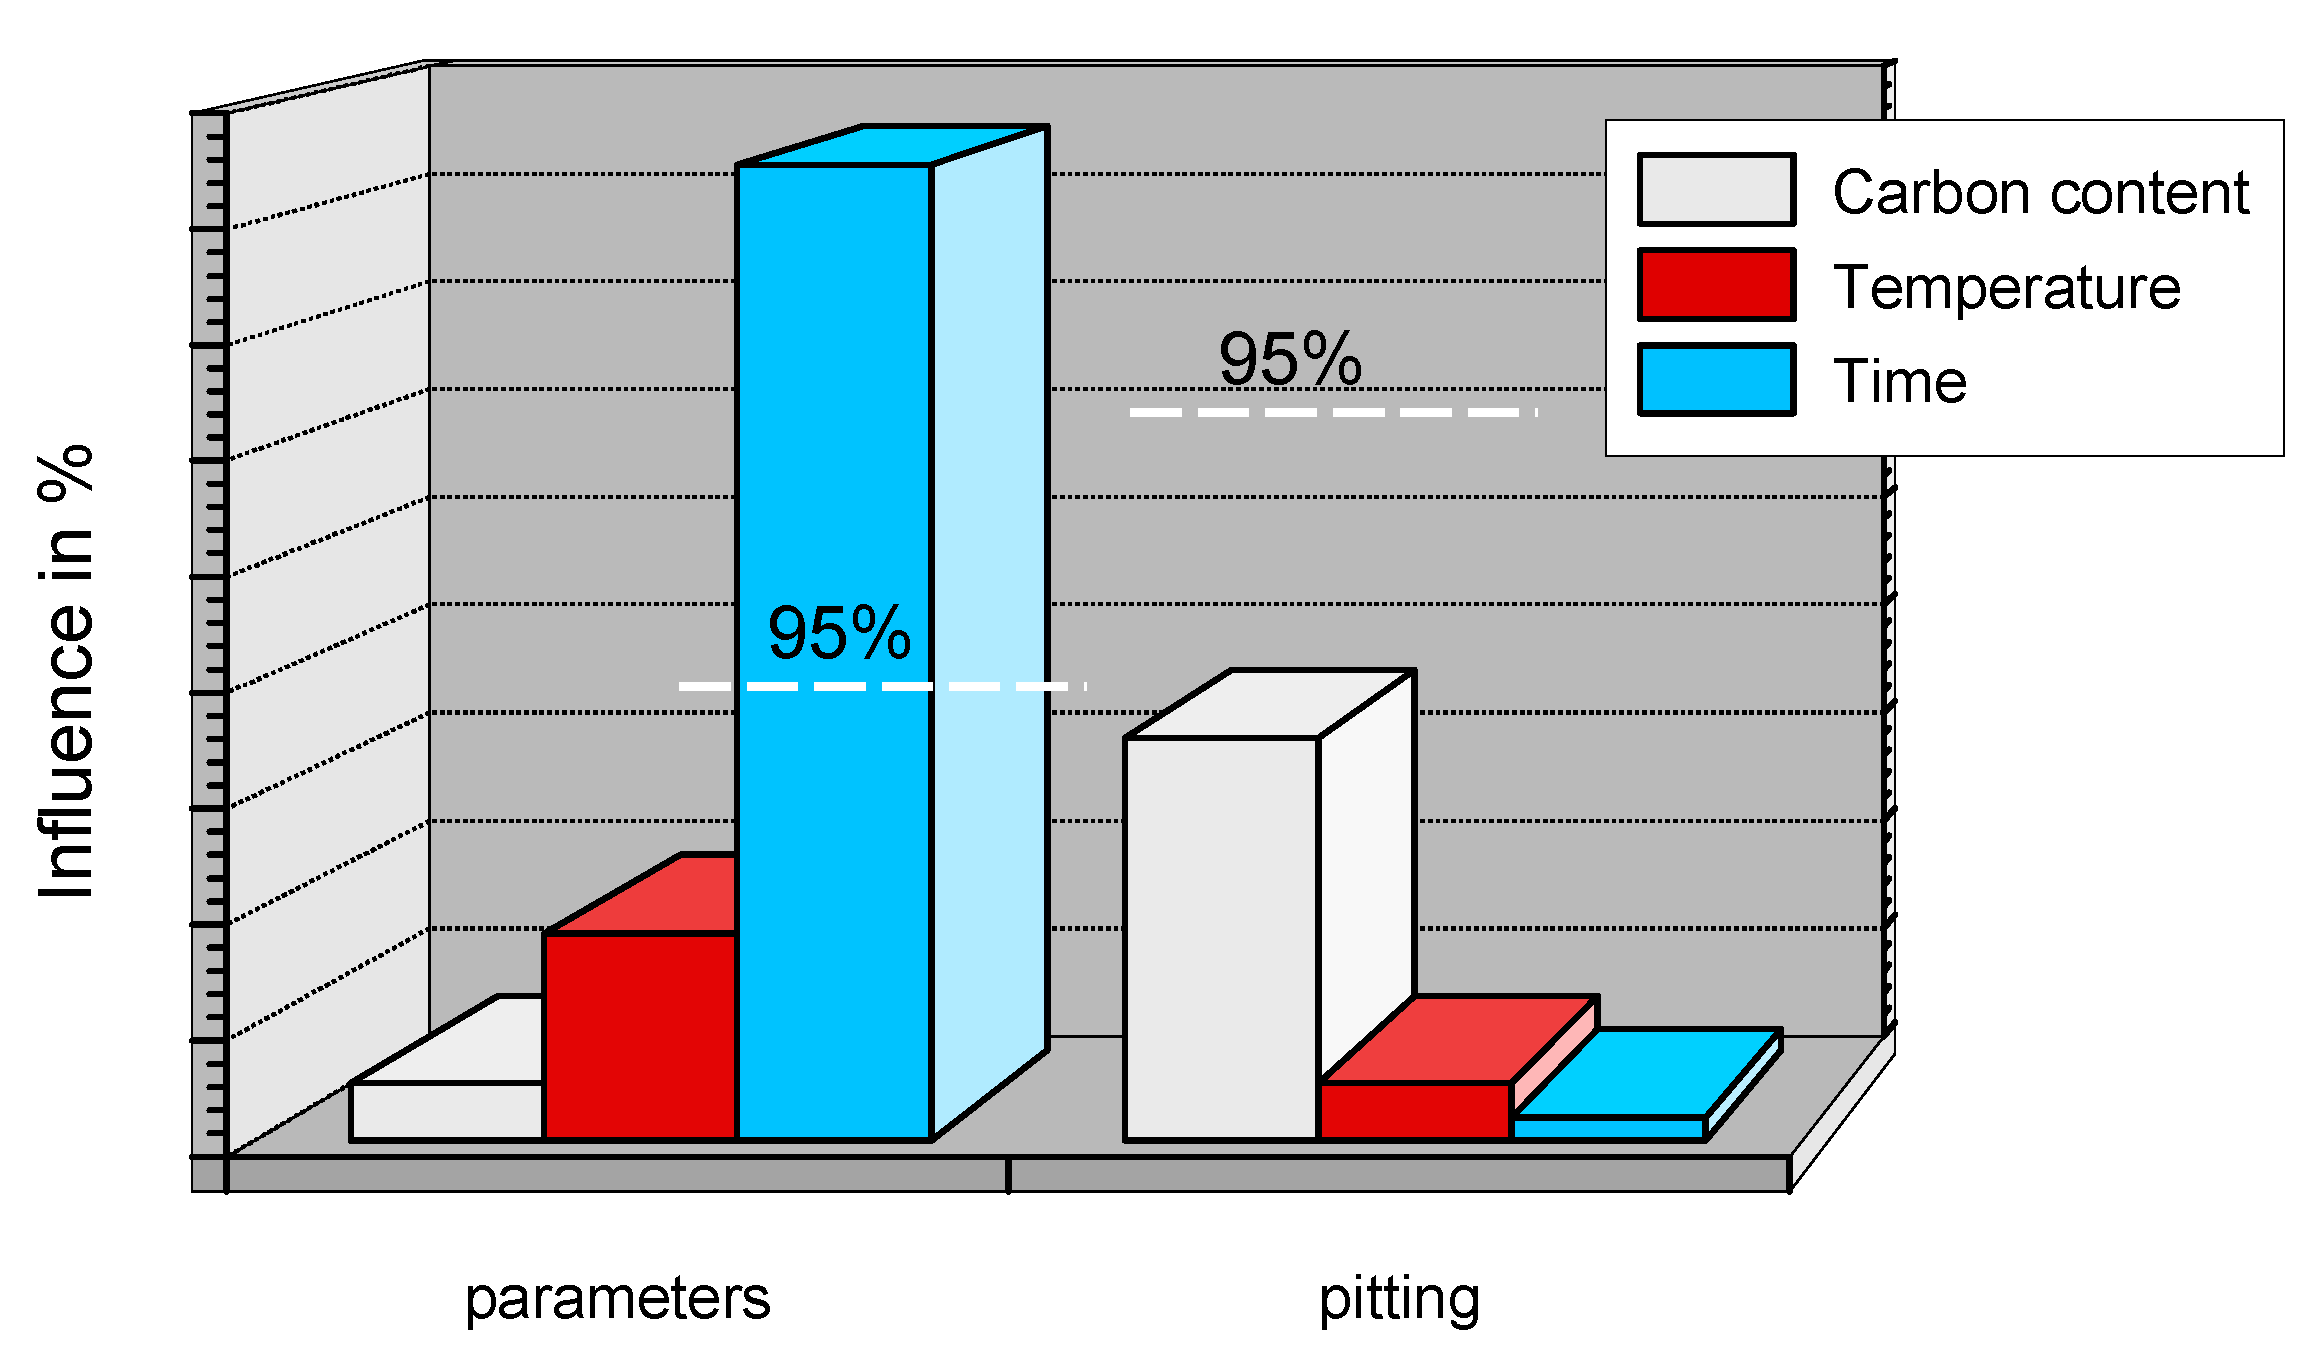
- Influence of heat treatment: In general, the shorter austenitizing time and lower austenitizing temperature result in better corrosion resistance regarding surface corrosion, but has no significant impact on the number of pit and pit sizes. At 100 bar as well as at ambient pressure and 60 °C, hardening and tempering at low temperatures (600 to 670 °C) for X20Cr13, X46Cr13, and X5CrNiCuNb16-4 result in the lowest corrosion rates and reveal good resistance against local corrosion. Therefore, the best corrosion resistance is achieved by a continuous martensitic microstructure.
5.2. Corrosion Fatigue
Author Contributions
Funding
Institutional Review Board Statement
Informed Consent Statement
Conflicts of Interest
References
- Thomas, C. Carbon Dioxide Capture for Storage in Deep Geologic Formations—Results from CO2 Capture Project; Elsevier Ltd.: London, UK, 2005; ISBN 0080445748. [Google Scholar]
- Broek, M.V.D.; Hoefnagels, R.; Rubin, E.; Turkenburg, W.; Faaij, A. Effects of technological learning on future cost and performance of power plants with CO2 capture. Prog. Energy Combust. Sci. 2009, 35, 457–480. [Google Scholar] [CrossRef]
- Nešić, S. Key issues related to modelling of internal corrosion of oil and gas pipelines—A review. Corros. Sci. 2007, 49, 4308–4338. [Google Scholar] [CrossRef]
- Hurter, S. Impact of Mutual Solubility of H2O and CO2 on Injection Operations for Geological Storage of CO2. In Proceedings of the International Conference of the Properties of Water and Steem ICPWS, Berlin, Germany, 8–11 September 2012. [Google Scholar]
- Zhang, L.; Yang, J.; Sun, J.S.; Lu, M. Effect of pressure on wet H2S/CO2 corrosion of pipeline steel. No. 09565. In Proceedings of the NACE Corrosion 2008 Conference and Expo, New Orleans, LA, USA, 16–20 March 2008. [Google Scholar]
- Mu, L.J.; Zhao, W.Z. Investigation on Carbon Dioxide Corrosion Behaviors of 13Cr Stainless Steel in Simulated Strum Water. Corros. Sci. 2010, 2, 82–89. [Google Scholar] [CrossRef]
- Seiersten, M. Material selection for separation, transportation and disposal of CO2. In CORROSION/2001; Paper no. 01042; NACE International: Houston, TX, USA, 2001. [Google Scholar]
- Cui, Z.D.; Wu, S.L.; Zhu, S.L.; Yang, X.J. Study on corrosion properties of pipelines in simulated produced water saturat-ed with supercritical CO2. Appl. Surf. Sci. 2006, 252, 2368–2374. [Google Scholar] [CrossRef]
- Pfennig, A.; Kranzmann, A. Reliability of pipe steels with different amounts of C and Cr during onshore carbon dioxide injection. Int. J. Greenh. Gas Control 2011, 5, 757–769. [Google Scholar] [CrossRef]
- Zhang, H.; Zhao, Y.L.; Jiang, Z.D. Effects of temperature on the corrosion behavior of 13Cr martensitic stainless steel dur-ing exposure to CO2 and Cl environment. Mat. Let. 2005, 59, 3370–3374. [Google Scholar] [CrossRef]
- Alhajji, J.; Reda, M. The effect of alloying elements on the electrochemical corrosion of low residual carbon steels in stagnant CO2-saturated brine. Corros. Sci. 1993, 34, 1899–1911. [Google Scholar] [CrossRef]
- Choi, Y.-S.; Nešić, S. Corrosion behavior of carbon steel in supercritical CO2-water environments. No. 09256. In Proceedings of the NACE Corrosion 2008 Conference and Expo, New Orleans, LA, USA, 16–20 March 2008. [Google Scholar]
- Jiang, X.; Nešić, S.; Huet, F. The Effect of Electrode Size on Electrochemical Noise Measurements and the Role of Chloride on Localized CO2 Corrosion of Mild Steel. Paper No. 09575. In Proceedings of the NACE Corrosion 2008 Conference and Expo, New Orleans, LA, USA, 16–20 March 2008. [Google Scholar]
- Ahmad, Z.; Allam, I.M.; Abdul, B.; Aleem, J. Effect of environmental factors on the atmospheric corrosion of mild steel in aggressive sea coastal environment. Anti Corros. Methods Mater. 2000, 47, 215–225. [Google Scholar] [CrossRef]
- Pfennig, A.L.; Bäßler, R. Effect of CO2 on the stability of steels with 1% and 13% Cr in saline water. Corros. Sci. 2009, 51, 931–940. [Google Scholar] [CrossRef]
- Pfennig, A.; Kranzmann, A. The role of pit corrosion in engineering the carbon storage site at Ketzin, Germany. AIR Pollut. 2010, 136, 109–119. [Google Scholar] [CrossRef]
- Pfennig, A.; Zastrow, P.; Kranzmann, A. Influence of heat treatment on the corrosion behavior of stainless steels during CO2-sequestration into saline aquifer. Int. J. Greenh. Gas Control 2013, 15, 213–224. [Google Scholar] [CrossRef]
- Nyborg, R. Controlling Internal Corrosion in Oil and Gas Pipelines. Business Briefing: Exploration & Production. Oil Gas Rev. 2005, 2, 70–74. [Google Scholar]
- Carvalho, D.S.; Joia, C.; Mattos, O. Corrosion rate of iron and iron–chromium alloys in CO2 medium. Corros. Sci. 2005, 47, 2974–2986. [Google Scholar] [CrossRef]
- Linter, B.R.; Burstein, G.T. Reactions of pipeline steels in carbon dioxide solutions. Corr. Sci. 1999, 41, 117–139. [Google Scholar] [CrossRef]
- Wu, S.L.; Cui, Z.D.; Zhao, G.X.; Yan, M.L.; Zhu, S.L.; Yang, X.J. EIS study of the surface film on the surface of carbon steel form supercritical carbon dioxide corrosion. Appl. Surf. Sci. 2004, 228, 17–25. [Google Scholar] [CrossRef]
- Bülbül, Ş.; Sun, Y. Corrosion behavior of high Cr-Ni cast steels in the HCl solution. J. Alloys Compd. 2010, 598, 143–147. [Google Scholar] [CrossRef]
- Hou, B.; Li, Y.; Li, Y.; Zhang, J. Effect of alloy elements on the anti-corrosion properties of low alloy steel. Bull. Mater. Sci 2000, 23, 189–192. [Google Scholar] [CrossRef]
- Cvijović, Z.; Radenković, G. Microstructure and pitting corrosion resistance of annealed duplex stainless steel. Corros. Sci. 2006, 48, 3887–3906. [Google Scholar] [CrossRef]
- Park, J.-Y.; Park, Y.-S. The effects of heat-treatment parameters on corrosion resistance and phase transformations of 14Cr–3Mo martensitic stainless steel. Mater. Sci. Eng. A 2007, 449–451, 1131–1134. [Google Scholar] [CrossRef]
- Banaś, J.; Lelek-Borkowska, U.; Mazurkiewicz, B.; Solarski, W. Effect of CO2 and H2S on the composition and stability of passive film on iron alloys in geothermal water. Electrochimica Acta 2007, 52, 5704–5714. [Google Scholar] [CrossRef]
- Bilmes, P.; Llorente, C.; Méndez, C.; Gervasi, C. Microstructure, heat treatment and pitting corrosion of 13CrNiMo plate and weld metals. Corros. Sci. 2009, 51, 876–881. [Google Scholar] [CrossRef]
- Zhang, L.; Zhang, W.; Jiang, Y.; Deng, B.; Sun, D.; Li, J. Influence of annealing treatment on the corrosion resistance of lean duplex stainless steel 2101. Electrochimica Acta 2009, 54, 5387–5392. [Google Scholar] [CrossRef]
- Brown, B.; Parakala, S.R.; Nešić, S. CO2 corrosion in the presence of trace amounts of H2S. paper No. 04736. In Proceedings of the NACE International Corrosion Conference Series: Corrosion 2004, New Orleans, LA, USA, 28 March–1 April 2004. [Google Scholar]
- Isfahany, A.N.; Saghafian, H.; Borhani, G. The effect of heat treatment on mechanical properties and corrosion behavior of AISI420 martensitic stainless steel. J. Alloys Compd. 2011, 509, 3931–3936. [Google Scholar] [CrossRef]
- Lucio-Garcia, M.; Gonzalez-Rodriguez, J.; Casales, M.; Martinez, L.; Chacon-Nava, J.; Neri-Flores, M.; Martinez-Villafañe, A. Effect of heat treatment on H2S corrosion of a micro-alloyed C–Mn steel. Corros. Sci. 2009, 51, 2380–2386. [Google Scholar] [CrossRef]
- Madduri, C.; Prakash, R.V. Corrosion Fatigue Crack Growth Studies in Ni-Cr-Mn steels. Int. J. Mech. Mat. Eng. 2010, 1, 20–25. [Google Scholar]
- Seo, M. Initiation and stability of localized corrosion processes on stainless steels. Electrochemical Society. Corrosion Division, Passivity and localized corrosion: An International Symposium in Honour of Professor Norio Sato. Electrochem. Soc. 1999, 99–27, 483–492. [Google Scholar]
- Vignal, V.; Delrue, O.; Peultier, J.; Oltra, R. Critical Factors in Localized Corrosion 5: A Symposium in Honour of Hugh Isaacs. In Local Mechanical-Electrochemical Behavior of Duplex Stainless Steels; The Electrochemical Society: Pennington, NJ, USA, 2007; pp. 102–104. [Google Scholar]
- Pfennig, A.; Wolf, M.; Böllinghaus, T. Corrosion Fatigue of X46Cr13 in CCS Environment. In Energy Technology 2016; Springer Science and Business Media LLC.: New York, NY, USA, 2016; pp. 49–56. [Google Scholar]
- Pfennig, A.; Wiegand, R.; Wolf, M.; Bork, C.-P. Corrosion and corrosion fatigue of AISI 420C (X46Cr13) at 60 °C in CO2-saturated artificial geothermal brine. Corros. Sci. 2013, 68, 134–143. [Google Scholar] [CrossRef]
- Han, J.; Yang, Y.; Nešić, S.; Brown, N.B. Roles of passivation and galvanic effects in localized CO2 corrosion of mild steel. Paper No. 08332. In Proceedings of the NACE Corrosion 2008, New Orleans, LA, USA, 16–20 March 2008. [Google Scholar]
- Pfennig, A.; Wolthusen, H.; Zastrow, P.; Kranzmann, A. Evaluation of heat treatment performance of potential pipe steels in CCS-environment. In Energy Technology 2015; Springer: Cham, Switzerland, 2015; pp. 15–22. [Google Scholar]
- Thomas, J.P.; Wei, R.P. Corrosion fatigue crack growth of steels in aqueous solutions I: Experimental results and mod-eling the effects of frequency and temperature. Mater. Sci. Eng. 1992, A159, 205–221. [Google Scholar] [CrossRef]
- Wei, R.P.; Chiou, S. Corrosion fatigue crack growth and electrochemical reactions for an X-70 linepipe steel in car-bonate-bicarbonate solution. Eng. Fract. Mech. 1992, 41, 463–473. [Google Scholar] [CrossRef]
- Cerisola, G.; Busca, G.; de Anna, P.L. Corrosion fatigue behavior of iron in different aqueous environments. Mater. Chem. Phys. 1983, 9, 387–403. [Google Scholar] [CrossRef]
- Palin-Luc, T.; Pérez-Mora, R.; Bathias, C.; Domínguez, G.; Paris, P.C.; Arana, J.L. Fatigue crack initiation and growth on a steel in the very high cycle regime with sea water corrosion. Eng. Fract. Mech. 2010, 77, 1953–1962. [Google Scholar] [CrossRef]
- Yeske, R.A.; Roth, L.D. Environmental effects on fatigue of stainless steel at very high frequencies. In Ultrasonic Fatigue; The Metallurgical Society of AIME: New York, NY, USA, 1982; pp. 349–364. [Google Scholar]
- Macek, W.; Branco, R.; Szala, M.; Marciniak, Z.; Ulewicz, R.; Sczygiol, N.; Kardasz, P. Profile and Areal Surface Parameters for Fatigue Fracture Characterisation. Materials 2020, 13, 3691. [Google Scholar] [CrossRef]
- Mazzola, L.; Regazzi, D.; Beretta, S.; Bruni, S. Fatigue assessment of old design axles: Service simulation and life extension. Proc. Inst. Mech. Eng. Part F J. Rail Rapid Transit 2014, 230, 572–584. [Google Scholar] [CrossRef]
- Beretta, S.; Carboni, M.; Conte, A.L.; Regazzi, D.; Trasatti, S.; Rizzi, M. Crack Growth Studies in Railway Axles under Corrosion Fatigue: Full-scale Experiments and Model Validation. Procedia Eng. 2011, 10, 3650–3655. [Google Scholar] [CrossRef]
- Carboni, M.; Beretta, S.; Conte, A.L. Research on corrosion fatigue of railway axles. Insight Non-Destructive Test. Cond. Monit. 2011, 53, 361–367. [Google Scholar] [CrossRef]
- Beretta, S.; Carboni, M.; Regazzi, D. Load interaction effects in propagation lifetime and inspections of railway axles. Int. J. Fatigue 2016, 91, 423–433. [Google Scholar] [CrossRef]
- Hassani-Gangaraj, S.; Carboni, M.; Guagliano, M. Finite element approach toward an advanced understanding of deep rolling induced residual stresses, and an application to railway axles. Mater. Des. 2015, 83, 689–703. [Google Scholar] [CrossRef]
- Hu, Y.; Wu, S.; Withers, P.J.; Cao, H.; Chen, P.; Zhang, Y.; Shen, Z.; Vojtek, T.; Hutař, P. Corrosion fatigue lifetime assessment of high-speed railway axle EA4T steel with artificial scratch. Eng. Fract. Mech. 2021, 245, 107588. [Google Scholar] [CrossRef]
- Wu, S.; Xu, Z.; Kang, G.; He, W. Probabilistic fatigue assessment for high-speed railway axles due to foreign object damages. Int. J. Fatigue 2018, 117, 90–100. [Google Scholar] [CrossRef]
- Pfennig, A.; Wolf, M. Influence of geothermal environment on the corrosion fatigue behavior of standard duplex stainless steel X2CrNiMoN22-5-32. J. Phys. Conf. Ser. 2019, 1425, 012183. [Google Scholar]
- Yevtushenko, O.; Bäßler, R.; Pfennig, A. Corrosion behavior of Cr13steel in CO2 saturated brine with high chloride con-centration. Mater. Corros. 2012, 62, 517–521. [Google Scholar] [CrossRef]
- Unigovski, Y.B.; Lothongkum, G.; Gutman, E.M.; Alush, D.; Cohen, R. Low-cycle fatigue behavior of 316L-type stain-less steel in chloride solutions. Corr. Sci. 2009, 51, 3014–3120. [Google Scholar] [CrossRef]
- Brück, S.; Schippl, V.; Schwarz, M.; Christ, H.-J.; Fritzen, C.-P.; Weihe, S. Hydrogen Embrittlement Mechanism in Fatigue Behavior of Austenitic and Martensitic Stainless Steels. Metals 2018, 8, 339. [Google Scholar] [CrossRef]
- Holtam, C.M.; Baxter, D.P.; Ashcroft, I.A.; Thomson, R.C. Effect of crack depth on fatigue crack growth rates for a C–Mn pipeline steel in a sour environment. Int. J. Fatigue 2010, 32, 288–296. [Google Scholar] [CrossRef]
- Li, M.-Q.; Wei, Z.-W.; Zhang, F.-S.; Tang, J.-Q. The corrosion fatigue of medium strength structural steels. Corros. Sci. 1993, 34, 1403–1410. [Google Scholar] [CrossRef]
- Thorbjörnsson, I. Corrosion fatigue testing of eight different steels in an Icelandic geothermal environment. Mater. Des. 1995, 16, 97–102. [Google Scholar] [CrossRef]
- Russick, E.M.; Poulter, G.A.; Adkins, C.L.J.; Sorensen, N.R. Corrosive Effects of Supercritical Carbon Dioxide and Cosolvents on Metals. J. Supercrit. Fluids 1996, 9, 43–50. [Google Scholar] [CrossRef]
- Fang, B.Y.; Atrens, A.; Wang, J.Q.; Han, E.H.; Zhu, Z.Y.; Ke, W. Review of stress corrosion cracking of pipeline steels in “low” and “high” pH solutions. J. Mat. Sci. 2003, 38, 127–132. [Google Scholar] [CrossRef]
- Schmitt-Thomas, K.G. Schwingungsrisskorrosionsanfälligkeit Verschiedener Werkstoffe in. Korrosion Verstehen—Korrosionsschäden vermeiden, Band 2; Verlag Irene Kuron: Bonn, Germany, 1994. [Google Scholar]
- Roeder, E.; Bassler, H.-J.; Huber, M.; Vollmar, J. Vollmar. Schwingungsrisskorrosionsverhalten des austenitischen Stahles X6CrNiMoTi 17 12 2 in 3%iger NaCl-Lösung unter Umlaufbiegebelastung. Mater. Corros. 1992, 43, 426–431. [Google Scholar] [CrossRef]
- Spähn, R. Mechanismen der Schwingungsrisskorrosion und Prüfungen in: Korrosion Verstehen Korrosionsschäden Vermeiden, Band 2; Verlag Irene Kuron: Bonn, Germany, 1994. [Google Scholar]
- Lipp, H.-J. Schwingungsrißkorrosionsuntersuchungen an ferritischen rostfreien Stählen. Mater. Corros. 1975, 26, 825–831. [Google Scholar] [CrossRef]
- Schmitt-Thomas, K.G.; Häpple, T.; Wunderlich, R. Untersuchung des SwRK-Verhaltens des hochreinen martensitaushärtenden Stahles X5CrNiCuNb 17 4 PH im Vergleich zum weichmartensitischen Stahl X4CrNiMo 16 5 1 ESU in chloridhaltigen wässrigen Lösungen. Mater. Corros. 1989, 40, 427–436. [Google Scholar] [CrossRef]
- Huneau, B.; Mendez, J. Evaluation of environmental effects on fatigue crack growth behavior of a high strength steel in a saline solution with cathodic protection. Int. J. Fatigue 2006, 28, 124–131. [Google Scholar] [CrossRef]
- Ebara, R. Corrosion fatigue crack initiation behavior of stainless steels. Procedia Eng. 2010, 2, 1297–1306. [Google Scholar] [CrossRef]
- Alvarez-Armas, I. Duplex Stainless Steels: Brief History and Some Recent Alloys. Recent Pat. Mech. Eng. 2008, 1, 51–57. [Google Scholar] [CrossRef]
- Prosek, T.; Le Gac, A.; Thierry, D.; Le Manchet, S.; Lojewski, C.; Fanica, A.; Johansson, E.; Canderyd, C.; Dupoiron, F.; Snauwaert, T.; et al. Low-Temperature Stress Corrosion Cracking of Austenitic and Duplex Stainless Steels Under Chloride Deposits. Corrosion 2014, 70, 1052–1063. [Google Scholar] [CrossRef]
- Schultze, S.; Göllner, J.; Eick, K.; Veit, P.; Heyse, H. Selektive Korrosion von Duplexstahl. Teil 1: Aussagekraft herkömmlicher und neuartiger Methoden zur Untersuchung des Korrosionsverhaltens von Duplexstahl X2CrNiMoN22-5-3 unter besonderer Berücksichtigung der Mikrostruktur. Mater. Corros. 2010, 52/1, 26–36. [Google Scholar] [CrossRef]
- Arnold, N.; Gümpel, P.; Heitz, T.W. Chloride induced corrosion on stainless steels at indoor swimming pools atmos-pheres Part 2: Influence of hypochlorite. Mater. Corros. 1999, 49, 140–145. [Google Scholar] [CrossRef]
- Zhang, W.; Fang, K.; Hu, Y.; Wang, S.; Wang, X. Effect of machining-induced surface residual stress on initiation of stress corrosion cracking in 316 austenitic stainless steel. Corros. Sci. 2016, 108, 173–184. [Google Scholar] [CrossRef]
- Shahryari, A.; Kamal, W.; Omanovic, S. The effect of surface roughness on the efficiency of the cyclic potentiodynamic passivation (CPP) method in the improvement of general and pitting corrosion resistance of 316LVM stainless steel. Mater. Lett. 2008, 62, 3906–3909. [Google Scholar] [CrossRef]
- Ahmed, A.A.; Mhaede, M.; Basha, M.; Wollmann, M.; Wagner, L. The effect of shot peening parameters and hydroxyap-atite coating on surface properties and corrosion behavior of medical grade AISI 316L stainless steel. Surf. Coat. Technol. 2015, 280, 347–358. [Google Scholar] [CrossRef]
- Lee, S.M.; Lee, W.G.; Kim, Y.H.; Jang, H. Surface roughness and the corrosion resistance of 21Cr ferritic stainless steel. Corros. Sci. 2012, 63, 404–409. [Google Scholar] [CrossRef]
- Takemoto, M. Study on the Failure Threshold Stress Criteria for the Prevention and Mechanism of Stress Corrosion Cracking; Faculty of Science and Engineering, Aoyama Gakuin University: Tokyo, Japan, 1984. [Google Scholar]
- Asma, R.N.; Yuli, P.; Mokhtar, C. Study on the Effect of Surface Finish on Corrosion of Carbon Steel in CO2 Environment. J. Appl. Sci. 2011, 11, 2053–2057. [Google Scholar] [CrossRef]
- Lv, J.; Guo, W.; Liang, T. The effect of pre-deformation on corrosion resistance of the passive film formed on 2205 duplex stainless steel. J. Alloys Compd. 2016, 686, 176–183. [Google Scholar] [CrossRef]
- Pfennig, A.; Wolf, M.; Bork, C.-P.; Trenner, S.; Wiegand, R. Comparison between X5CrNiCuNb16-4 and X46Cr13 under Corrosion Fatigue. Paper No. 3776; In Corrosion; NACE International: San Antonio, TX, USA, 2014. [Google Scholar]
- Vollmar, J.; Roeder, E. Auswirkungen des elektrochemischen Probenpotentials auf das SwRK-Verhalten des Duplexstahls X2CrNiMoN22-5-3 in NaCl-Lösung. Werkstoffe und Korrosion 1994, 45, 378–386. [Google Scholar] [CrossRef]
- Evgenya, B.; Hughesa, T.; Eskinba, D. Effect of surface roughness on corrosion behavior of low carbon steelin inhibited 4 M hydrochloric acid under laminar and turbulent flow conditions. Corr. Sci. 2016, 103, 196–205. [Google Scholar] [CrossRef]
- Sanjurjo, P.; Rodríguez, C.; Pariente, I.F.; Belzunce, F.J.; Canteli, A.F. The influence of shot peening on the fatigue behav-ior of duplex stainless steels. Procedia Eng. 2010, 2, 1539–1546. [Google Scholar] [CrossRef]
- Abdulstaar, M.; Mhaede, M.; Wollmann, M.; Wagner, L. Investigating the effects of bulk and surface severe plastic de-formation on the fatigue, corrosion behavior and corrosion fatigue of AA5083. Surf. Coat. Technol. 2014, 254, 244–251. [Google Scholar] [CrossRef]
- Wu, X.; Guan, H.; Han, E.H.; Ke, W.; Katada, Y. Influence of surface finish on fatigue cracking behavior of reactor pressure vessel steel in high temperature water. Mater. Corros. 2006, 57, 868–871. [Google Scholar] [CrossRef]
- Lo, I.-H.; Tsai, W.-T. Effect of selective dissolution on fatigue crack initiation in 2205 duplex stainless steel. Corros. Sci. 2007, 49, 1847–1861. [Google Scholar] [CrossRef]
- Mathis, R. Initiation and early growth mechanisms of corrosion fatigue cracks in stainless steels. J. Mater. Sci. 1987, 22, 907–914. [Google Scholar] [CrossRef]
- Garcia, R.L.; Muñoz-Portero, M.; Garcia-Anton, J. Corrosion behaviour of sensitized and unsensitized Alloy 900 (UNS 1.4462) in concentrated aqueous lithium bromide solutions at different temperatures. Corros. Sci. 2010, 52, 950–959. [Google Scholar] [CrossRef]
- Forster, A.; Schoner, R.; Förster, H.-J.; Norden, B.; Blaschke, A.-W.; Luckert, J.; Beutler, G.; Gaupp, R.; Rhede, D. Reservoir characterization of a CO2 storage aquifer: The Upper Triassic Stuttgart Formation in the Northeast German Basin. Mar. Pet. Geol. 2010, 27, 2156–2172. [Google Scholar] [CrossRef]
- Pfennig, A.; Trenner, S.; Wolf, M.; Bork, C. Vibration Tests for Determination of Mechanical Behavior in CO2-Containing Solutionsin European Corrosion Congress EuroCorr 2013; Estoril Congress Center: Estoril, Portugal, 2013. [Google Scholar]
- Wolf, M.; Afanasiev, R.; Böllinghaus, T.; Pfennig, A. Investigation of Corrosion Fatigue of Duplex Steel X2CrNiMoN22-5 3 Exposed to a Geothermal Environment under Different Electrochemical Conditions and Load Types. Energy Procedia 2017, 114, 5337–5345. [Google Scholar] [CrossRef]
- Pfennig, A.; Gröber, A.; Simkin, R.; Kranzmann, A. Influence of Surface Qualıty on the Corrosıon and Corrosıon Fatıgue Behavıor of Hıgh Alloyed Steels Exposed to Dıfferent Salıne Aquıfer Water Envıronments. Matter Int. J. Sci.; Tech. 2019, 5, 609–631. [Google Scholar] [CrossRef]
- Pfennig, A.; Simkin, R.; Gröber, A.; Kranzmann, A. The Role of Surface Texture on the Corrosion Behavior of High Al-loyed Steels Exposed to Different Saline Aquifer Water Environments. In Proceedings of the 14th Greenhouse Gas Control Technologies Conference, Melbourne, Australia, 21–26 October 2018; (GHGT-14). SSRN’s eLibrary ISSN 1556-5068. Available online: https://ssrn.com/abstract=3365580 (accessed on 26 March 2021).
- Pfennig, A.; Kranzmann, A. Failure of standard duplex stainless steel X2CrNiMoN22-5-3 under corrosion fatigue in geother-mal environment. IOP Conf. Ser. Mater. Sci. Eng. 2020, 894, 93–98. [Google Scholar]
- López, D.; Pérez, T.; Simison, S. The influence of microstructure and chemical composition of carbon and low alloy steels in CO2 corrosion. A state-of-the-art appraisal. Mater. Des. 2003, 24, 561–575. [Google Scholar] [CrossRef]
- Enerhaug, J. A study of localized corrosion in super martensitic stainless steel weldments. Ph.D. Thesis, Norwegian University of Science and Technology (NTNU), Trondheim, Norway, 2002. [Google Scholar]
- Mousavi, S.A.; Sufizadeh, A. Metallurgical investigations of pulsed Nd:YAG laser welding of AISI 321 and AISI 630 stainless steels. Mater. Des. 2009, 30, 3150–3157. [Google Scholar] [CrossRef]
- Wang, J.; Zou, H. Relationship of microstructure transformation and hardening behavior of type 630 stainless steel. J. Univ. Sci. Tech. Beijing 2006, 3, 213–221. [Google Scholar] [CrossRef]
- Pfennig, A.; Wolthusen, H.; Kranzmann, A. Unusual Corrosion Behavior of 1.4542 Exposed a Laboratory Saline Aquifer Water CCS-environment. Energy Procedia 2017, 114, 5229–5240. [Google Scholar] [CrossRef]
- Pfennig, A.; Kranzmann, A. Potential of martensitic stainless steel X5CrNiCuNb 16-4 as pipe steel in corrosive CCS envi-ronment. Int. J. Env. Sci. Dev. 2017, 8, 466–473. [Google Scholar] [CrossRef][Green Version]
- Pfennig, A.; Heynert, K.; Wolf, M.; Böllinghaus, T. First in-situ Electrochemical Measurement During Fatigue Testing of In-jection Pipe Steels to Determine the Reliability of a Saline Aquifer Water CCS-site in the Northern German Basin Original. Energy Procedia 2014, 63, 5773–5786. [Google Scholar] [CrossRef]
- Förster, A.; Norden, B.; Zinck-Jørgensen, K.; Frykman, P.; Kulenkampff, J.; Spangenberg, E.; Erzinger, J.; Zimmer, M.; Kopp, J.; Borm, G.; et al. Baseline characterization of the CO2SINK geological storage site at Ketzin, Germany. Environ. Geosci. 2006, 13, 145–161. [Google Scholar] [CrossRef]
- Bäßler, R.; Sobetzki, J.; Klapper, H.S. Corrosion Resistance of High-Alloyed Materials in Artificial Geothermal Fluids. In Proceedings of the Corrosion 2013, Orlando, FL, USA, 17 March 2013. [Google Scholar]
- Pfennig, A.; HTW University of Applied Sciences Berlin; Kranzmann, A. BAM Federal Institute of Materials Research and Testing Borehole Integrity of Austenitized and Annealed Pipe Steels Suitable for Carbon Capture and Storage (CCS). Int. J. Mater. Mech. Manuf. 2017, 5, 213–218. [Google Scholar] [CrossRef]
- Pfennig, A.; Wolthusen, H.; Wolf, M.; Kranzmann, A. Effect of heat Treatment of Injection Pipe Steels on the Reliability of a Saline Aquifer Water CCS-site in the Northern German Basin. Energy Procedia 2014, 63, 5762–5772. [Google Scholar] [CrossRef]
- Pfennig, A.; Kranzmann, A. Effect of CO2 and pressure on the stability of steels with different amounts of chromium in saline water. Corros. Sci. 2012, 65, 441–452. [Google Scholar] [CrossRef]
- Pfennig, A.; Wolf, M.; Kranzmann, A. Evaluating corrosion and corrosion fatigue behavior via laboratory testing tech-niques in highly corrosive CCS-environment. In Proceedings of the GHGT15 the Greenhouse Gas Control Technologies Conference, Abu Dhabi, United Arab Emirates, 15–18 March 2021. [Google Scholar]
- Kraus, S.W.; Nolze, G. POWDER CELL—A program for the representation and manipulation of crystal structures and calculation of the resulting X-ray powder patterns. J. Appl. Cryst. 1996, 29, 301–303. [Google Scholar] [CrossRef]
- Pfennig, A.; Wolf, M.; Kranzmann, A. Effects of saline aquifer water on the corrosion behavior of martensitic stainless steels during exposure to CO2 environment. In Proceedings of the GHGT15 the Greenhouse Gas Control Technologies Conference, Abu Dhabi, United Arab Emirates, 15–18 March 2021. [Google Scholar]
- Pfennig, A.; Wolf, M.; Kranzmann, A. The Role of Surface Texture on the Corrosion Fatigue Behavior of High Alloyed Stainless Steel Exposed to Saline Aquifer Water Environment. Int. J. Mater. Sci. Eng. 2019, 7, 26–33. [Google Scholar] [CrossRef]
- Kranzmann, A.; Huenert, D.; Rooch, H.; Urban, I.; Schulz, W.; Österle, W. Reactions at the Interface between Steel and Oxide Scale in wet CO2 Containing Atmospheres; NACE Corrosion Conference & Expo: Atlanta, GA, USA, 22–26 March 2009. [Google Scholar]
- Zhang, Y.; Gao, K.; Schmitt, G. Corrosion inhibition of steels in aqueous media in contact with supercritical carbon diox-ide. In Proceedings of the EUROCORR 2011 Conference—The European Corrosion Congress, Stockholm, Sweden, Switzerland, 5–8 September 2011. [Google Scholar]
- Wei, L.; Pang, X.; Liu, C.; Gao, K. Formation mechanism and protective property of corrosion product scale on X70 steel under supercritical CO2 environment. Corr. Sci. 2015, 100, 404–420. [Google Scholar] [CrossRef]
- Pfennig, A.; Kranzmann, A. Corrosion And Fatigue Of Heat Treated Martensitic Stainless Steel 1.4542 Used For Geothermal Applications. Matter Int. J. Sci. Technol. 2019, 5, 138–158. [Google Scholar] [CrossRef]
- Schiz, J. Einfluss der Austenitisierungsparameter auf die Korrosionsbeständigkeit von Stählen in CCS-Umgebung. Bachelor’s Thesis, HTW Berlin, FB2 Mechanical Engineering, Berlin, Germany, 2011. [Google Scholar]
- Pfennig, A.; Wolf, M.; Kranzmann, A. In-situ testing of corrosion and corrosion fatigue behavior of stainless steels in ge-othermal environment. Int. Proc. Chem. Biol. Env. Eng. 2018, 103, 13–20. [Google Scholar]
- Pfennig, A.; Marcus, W.; Gröber, A.; Böllinghaus, T.; Kranzmann, A. Corrosion Fatigue of 1.4542 Exposed to a Laboratory Saline Aquifer Water CCS-environment. Energy Procedia 2017, 114, 5219–5228. [Google Scholar] [CrossRef]
- Klein, B. Versuchsplanung DoE. Edition: 4 Label: De Gruyter Oldenbourg; De Gruyter Oldenbourg Medium: Berlin, Germany, 2014; p. 371. [Google Scholar]
- Choi, Y.-S.; Kim, J.-G.; Park, Y.-S.; Park, J.-Y. Austenitzing treatment influence on the electrochemical corrosion behavior of 0.3C-14Cr-3Mo martensitic stainless steel. Mater. Lett. 2007, 61, 244–247. [Google Scholar] [CrossRef]


| Elements | C | Si | Mn | P | S | Cr | Mo | Ni | Co | Fe |
|---|---|---|---|---|---|---|---|---|---|---|
| acc standard a | 0.38–0.45 | <0.40 | 0.6–0.9 | ≤0.035 | ≤0.035 | 0.90–1.20 | 0.15–0.30 | rest | ||
| analysed b | 0.43 | 0.32 | 0.70 | 0.014 | 0.025 | 1.05 | 0.22 | 0.04 | <0.01 | 97.1 |
| Elements | C | Si | Mn | P | S | Cr | Mo | Ni | Co | Fe |
|---|---|---|---|---|---|---|---|---|---|---|
| acc standard a | 0.17–0.25 | <1.00 | ≤1.00 | ≤0.045 | ≤0.03 | 12.0–14.0 | 0.20–0.45 | |||
| analysed b | 0.22 | 0.39 | 0.32 | 0.007 | 0.006 | 13.3 | - | 0.123 | - | rest |
| Elements | C | Si | Mn | P | S | Cr | Mo | Ni | Co | Fe |
|---|---|---|---|---|---|---|---|---|---|---|
| acc standard a | 0.42–0.5 | <1.00 | ≤1.00 | ≤0.045 | ≤0.03 | 12.5–14.5 | 0.20–0.45 | |||
| analysed b | 0.46 | 0.25 | 0.45 | 0.018 | 0.003 | 13.39 | 0.03 | 0.13 | 0.03 | 85.4 |
| Elements | C | Si | Mn | P | S | Cr | Mo | Ni | Co | Fe |
|---|---|---|---|---|---|---|---|---|---|---|
| acc standard a | 0.33–0.45 | <1.00 | ≤1.00 | ≤0.045 | ≤0.03 | 15.5–17.5 | 0.8–1.3 | ≤1.00 | 0.20–0.45 |
| Elements | C | Si | Mn | P | S | Cr | Mo | Ni | Cu | Nb |
|---|---|---|---|---|---|---|---|---|---|---|
| acc standard a | ≤0.07 | ≤0.70 | ≤1.50 | ≤0.04 | ≤0.015 | 15.0–17.0 | ≤0.60 | 3.00–5.00 | 3.00–5.00 | 0.20–0.45 |
| analysed b | 0.03 | 0.42 | 0.68 | 0.018 | 0.002 | 15.75 | 0.11 | 4.54 | 3.00 | 0.242 |
| Phases | C | Si | Mn | Cr | Mo | Ni | N |
|---|---|---|---|---|---|---|---|
| α & γ ** | 0.023 | 0.48 | 1.83 | 22.53 | 2.92 | 5.64 | 0.15 |
| α * | 0.02 | 0.55 | 1.59 | 24.31 | 3.62 | 3.81 | 0.07 |
| γ * | 0.03 | 0.47 | 1.99 | 20.69 | 2.17 | 6.54 | 0.28 |
| According to the Northern German Basin or according to Stuttgart Formation | ||||||||||
| NaCl | KCl | CaCl2 × 2H2O | MgCl2 × 6H2O | NH4Cl | ZnCl2 | SrCl2 × 6H2O | PbCl2 | Na2SO4 | Ph Value | |
| g/L | 98.22 | 5.93 | 207.24 | 4.18 | 0.59 | 0.33 | 4.72 | 0.30 | 0.07 | 5.4–6 |
| NaCl | KCl | CaCl2 × 2H2O | MgCl2 × 6H2O | Na2SO4 × 10H2O | KOH | NaHCO3 | ||||
| g/L | 224.6 | 0.39 | 6.45 | 10.62 | 12.07 | 0.321 | 0.048 | |||
| Ca+ | K2+ | Mg2+ | Na2+ | Cl− | SO42− | HCO3− | pH value | |||
| g/L | 1.76 | 0.43 | 1.27 | 90.1 | 14.33 | 3.6 | 0.04 | 8.2–9 | ||
| Heat Treatment | TAustenitizing/°C | TAustenitizing/°C | TAnnealing/°C | TAnnealing/°C | Time | Cooling |
|---|---|---|---|---|---|---|
| X20Cr13/X46Cr13 | X5CrNiCuNb16-4 | X20Cr13 and X46Cr13 | X5CrNiCuNb16-4 | Min | Medium | |
| HT1 normalizing HT1 | 785 | 850 | 30 | oil | ||
| HT2 hardening | 1000 | 1040 | 30 | oil | ||
| HT3 hardening + tempering 1 | 1040 | 100 | 550 | 655 | 30 | oil |
| HT4 hardening + tempering 2 | 1040 | 1000 | 650 | 670 | 30 | oil |
| HT5 hardening + tempering 3 | 1040 | 1000 | 700 | 755 | 30 | oil |
Publisher’s Note: MDPI stays neutral with regard to jurisdictional claims in published maps and institutional affiliations. |
© 2021 by the authors. Licensee MDPI, Basel, Switzerland. This article is an open access article distributed under the terms and conditions of the Creative Commons Attribution (CC BY) license (http://creativecommons.org/licenses/by/4.0/).
Share and Cite
Pfennig, A.; Wolf, M.; Kranzmann, A. Corrosion and Corrosion Fatigue of Steels in Downhole CCS Environment—A Summary. Processes 2021, 9, 594. https://doi.org/10.3390/pr9040594
Pfennig A, Wolf M, Kranzmann A. Corrosion and Corrosion Fatigue of Steels in Downhole CCS Environment—A Summary. Processes. 2021; 9(4):594. https://doi.org/10.3390/pr9040594
Chicago/Turabian StylePfennig, Anja, Marcus Wolf, and Axel Kranzmann. 2021. "Corrosion and Corrosion Fatigue of Steels in Downhole CCS Environment—A Summary" Processes 9, no. 4: 594. https://doi.org/10.3390/pr9040594
APA StylePfennig, A., Wolf, M., & Kranzmann, A. (2021). Corrosion and Corrosion Fatigue of Steels in Downhole CCS Environment—A Summary. Processes, 9(4), 594. https://doi.org/10.3390/pr9040594