1. Introduction
The world population is projected to reach 8.5 billion people by 2030, contributing, along with the strong economic growth, to a rise in energy demand and consumption. According to the US 2016 Report [
1], the world energy demand is expected to rise by approximately 50% by 2030, on a global scale, whilst, according to the BP Energy Outlook Report (2015) [
2], world energy consumption will increase by 41% between 2012 and 2035. Nonmember countries of the OECD, such as China and India, are believed to contribute to this total rise, except a small, but noticeable, share of 5% by EU countries [
2].
Currently, the world’s energy use is covered mainly by fossil fuels (approximately 80%). Due to international and EU regulations for the reduction in energy use and carbon emissions by at least 50% over the next 20 years, there is a rising trend of using renewable energy technologies. On an EU level, renewables based generation will reach a share of 50% by 2040 [
3], leaving a portfolio of certain solutions to achieve this goal. Apart from the up and coming trend of renewable energy technologies and the use of nuclear power, promising alternatives in the context of climate change mitigation options include fuel switch, energy efficiency, and CCS. The implementation of CCS is of great interest to the power production sector, given that coal fired thermal plants, in particular, are responsible for the highest share of anthropogenic CO
2 emissions worldwide [
4,
5,
6,
7].
In 2005, the IPCC released a report that shows that the potential of CO
2 capture and storage is considerable, and the costs for mitigating climate change can be reduced compared to strategies where only other climate change mitigation options are considered [
8]. The importance of the future use of CCS technologies for climate change mitigation will depend on various determinants, such as financial incentives provided for deployment, and whether the risks of storage can be successfully tackled. CCS is appealing, due to the fact that it has the potential to lessen overall mitigation costs and boost flexibility, while contributing to GHG emission reductions [
5]. Nevertheless, factors such as technical maturity, installation and maintenance costs, uncertainty, the diffusion and transfer of the technology to developing countries and their capacity to apply the technology, regulation restrictions, environmental issues, public perception and engagement with the technology, as well as future competitiveness with other low carbon options, play a key role in its widespread deployment [
9,
10,
11,
12].
On an EU level, only few countries have been actively involved in the implementation of CCS technology. Indicative examples include the Ketzin pilot site in Germany [
13], the contract for two specific CCS projects in the UK [
14] and the planned development of large scale CCS facilities by three large industries in Norway [
15]. At this point, it is noted by Inderber and Wettestad [
14] that politicians and industry have largely abandoned CCS in Germany, whereas there is a solid political commitment to bring CCS forward in the UK. However, the efforts to launch technology demonstration programs have suffered significant delays, thus affecting the commercial availability of CCS infrastructure in the UK [
16]. On the other hand, Norway already stores more than 1.5 million tons of CO
2 on an annual basis and is currently working towards the capture and storage of an additional million tons per year by 2020 [
15].
Greece is one of the countries with great potential for implementation. The extensive use of lignite as a primary energy source in the country’s energy mix, and the corresponding commitments to the reduction of GHG emissions from 2013 and afterwards, especially in the electricity sector, make the use of CCS an attractive option that could drastically help this issue. However, relatively little work has been conducted regarding the implementation of CCS technology in Greece and the lignite sector [
17,
18,
19,
20,
21]. Specifically, Capros et al. [
17] analyze the prospects of CCS technology in the EU energy system up to 2030 by using the PRIMES model for all member states, while the works in [
22,
23] employed the integrated MARKAL-EFOM system (TIMES) to assess energy policy scenarios with respect to the implementation of CCS in the Greek electricity sector up to 2040.
The present paper builds upon the selected policy scenarios examined in the latter works to provide further insight into the energy situation and the implementation of CCS technology in Greece. In this direction, the main contributions of this paper include the elaborate analysis of the existing and future technologies for modeling the reference energy system in Greece using the bottom up approach of TIMES, as well as the detailed presentation of the results with respect to the scenarios for the implementation of CCS to the new licensed power plants from 2010 and onwards. In addition, since this study was performed in 2010 by the authors as a possible way to implement CCS in the Greek electricity sector, a further present complimentary study and checking was also considered, to see the changes that might have taken place in this 10-year span, and if that study and methodology would be able to be further used and implemented by the current or other governments, if the case of CCS as a solution in the Greek energy mixture, especially that of lignite, were considered.
2. The Case Study of Greece
Greece is located at the southern tip of the Balkan Peninsula and is surrounded by the Ionian, the Mediterranean, and the Aegean Seas, and borders with Turkey in the north east, as well as with Bulgaria, FYROM and Albania in the north. The terrain of the country is mainly mountainous, with ranges extending into the sea as peninsulas or chains of islands. It is indicative that Greece has extensive coastlines (15,021 km) and roughly 2000 islands, most of which have no interconnection with the continental power grid [
24].
The Greek climate is primarily Mediterranean, and the country has great potential for implementing RES, such as solar energy, wind power or geothermal. The 2011 census data showed that the population of Greece is 10.8 million [
25], with a slight decrease even in 2020, most of which live in urban areas. In addition, more than a third of the population lives in the Attica peninsula, and mainly in Athens (the capital of Greece), followed by Thessaloniki, the second largest city of the country, which is located in the northern region. Due to the characteristic of the geographical concentration of the population, Greece has two main electricity load centers in the aforementioned cities. In this context, the electricity load of the noninterconnected islands amounts to approximately 8% of the total electricity demand [
24].
The average annual population growth rate in Greece during the period 1991–2001 was 0.67%, while the corresponding growth rate for the period 2000–2020 is estimated to be approximately 0.4%. More specifically, this rate is higher during the period 2000–2005 (approximately 0.6%) and is assumed to drop below the level of 0.4% after 2010. In addition, it is estimated that the average household size (expressed in the number of individuals per household) decreased by approximately 0.8% on an annual basis during the period 2000–2020, reflecting the ageing of the population as well as the progressive adoption of new living standards. In this context, the total number of households increased by 43.8% during the period 1990–2020, reaching 4,574,104 households by 2020 [
20].
2.1. Reference Energy System in Greece
At the end of 2009, the EU imported 54% of its primary energy, with 30% of its oil coming from Russia and 61% of its natural gas from various countries (i.e., 42% from Russia, 24% from Norway, 18% from Algeria and 16% from other countries) with predictions of 73% for 2020 [
19]. The EU also produced 4721 Mt CO
2 p.a. (10.22 tons/capita in 2006), with a total of 273,221 Mt CO
2 from 1900–2004, while there was a commitment to reduce this by 20% in 2020, compared to the 1990 level. These details related to the EU-27 energy dependency serve as a base of comparison, between the current Greek energy dependency and mix of energy sources [
19].
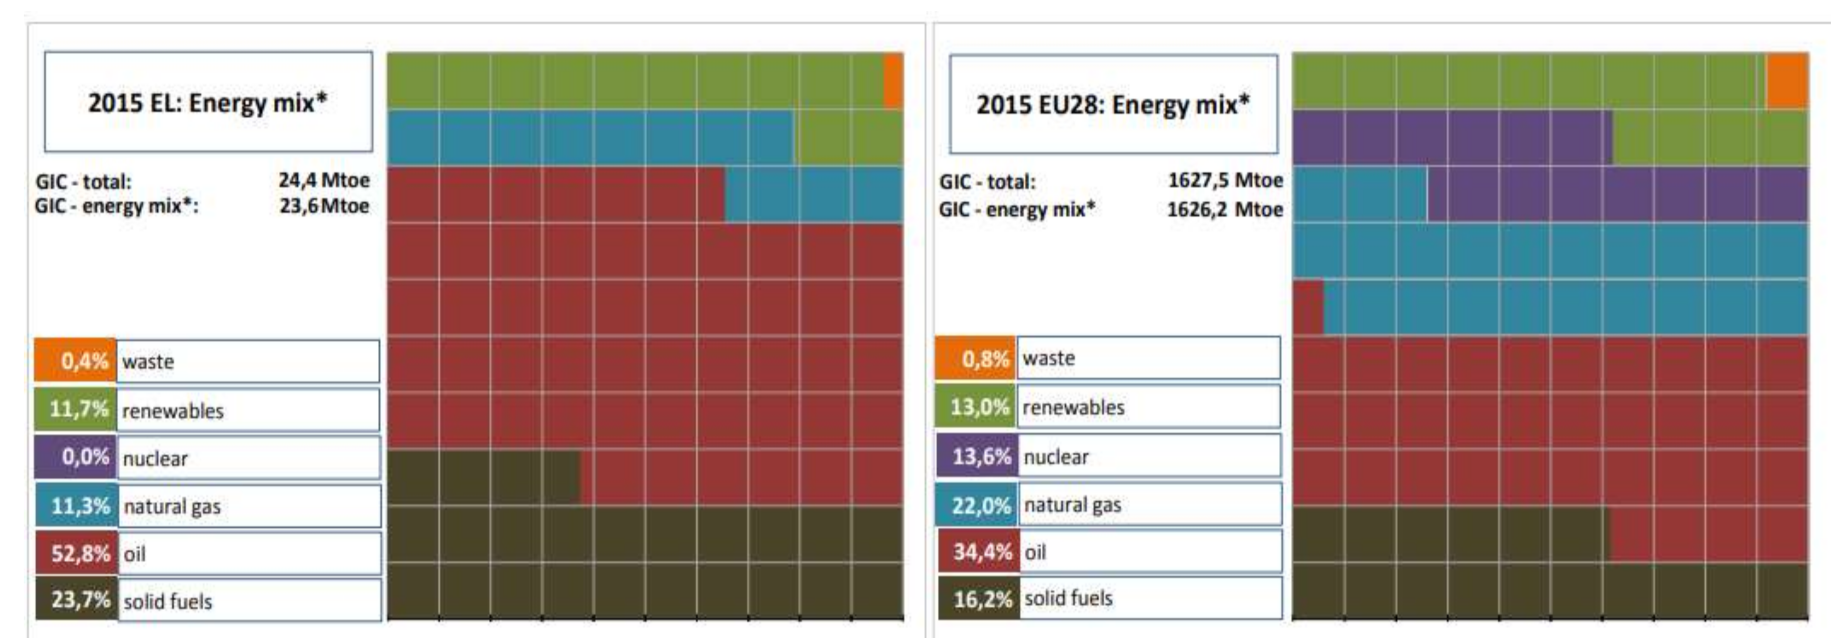
The energy mix of primary products in Greece shows some differences compared to the EU28 average, i.e., a higher use of petroleum and solid fuels (52.8% and 23.7%, respectively, versus an EU28 average of 34.4% and 16.2%), and a lower use of natural gas (11.3% versus an EU average of 22%, mainly due to the late penetration that began in 2009) and no nuclear (due to the country’s national energy policy,
Figure 1) [
26].
2.1.1. Installed Power Capacity and Energy Sources in Greece
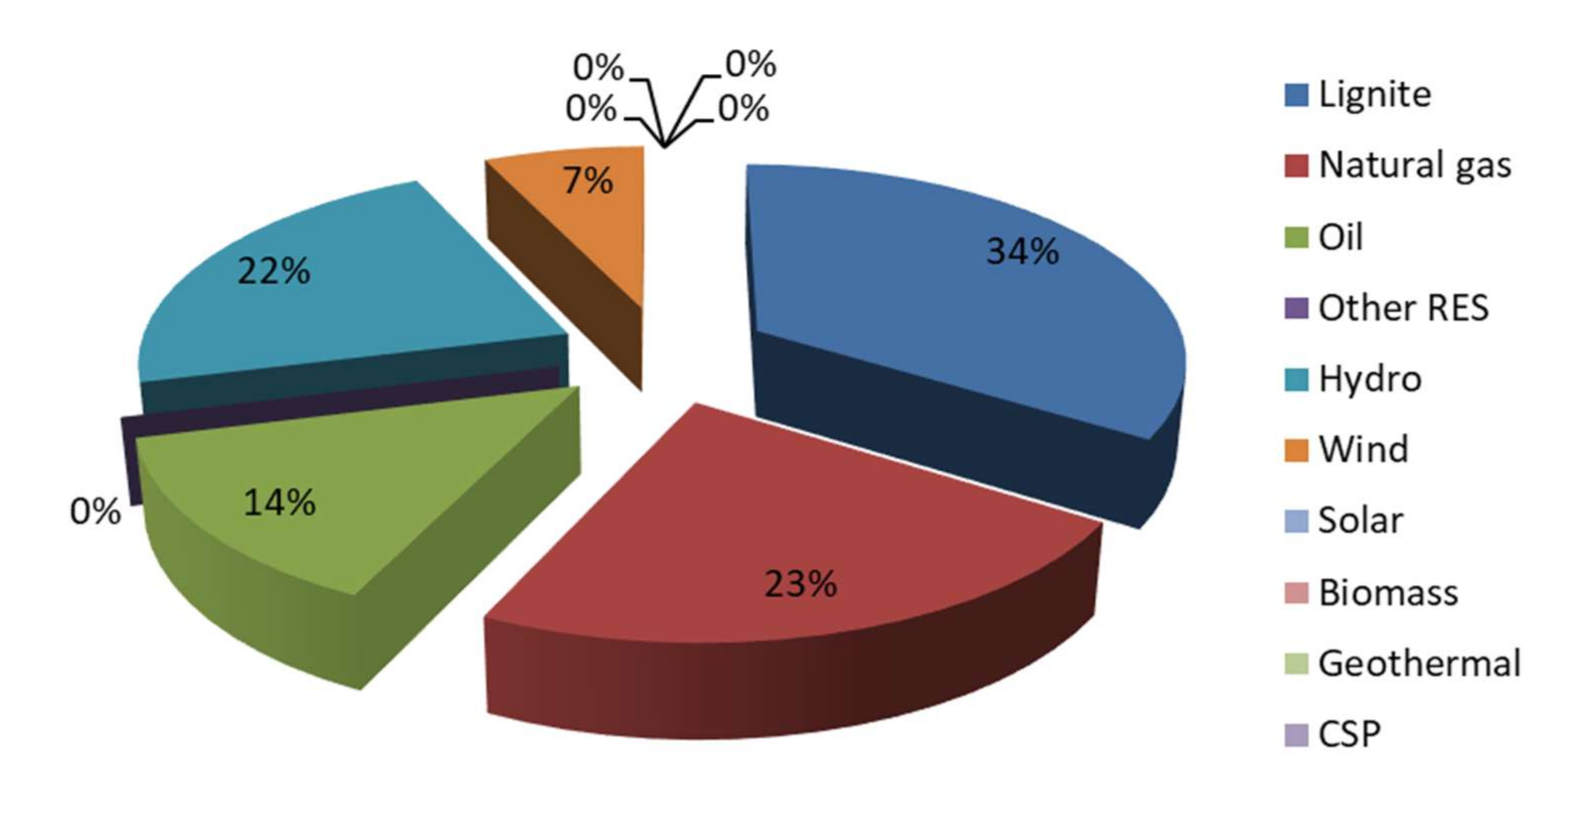
The total installed power capacity in Greece at the end of 2009 was 14,584 MW (compared to 19,065 MW in 2020, thus, a 23.5% increase), specifically, 12,884 MW in the “interconnected system” and 1700 MW in the “noninterconnected system” or “autonomous islands”. The electricity production was based on lignite, with a capacity of 4953 MW from 22 existing power plants, on natural gas plants, of 3349 MW, on oil plants, of 2109 MW, and on RES, of 4339 MW (Hydro: 3170 MW—Wind: 1087 MW—Solar: 42 MW—Biomass: 40 MW—Geothermal: 0 MW—Concentrated solar (CSP): 0 MW), as shown in
Figure 2. Between 1995 and 2009, the total nominal installed capacity in the interconnected system of the electricity generation system rose from 9198 MW to 12,884 MW. However, because of the high increase in electricity demand, Greece was lacking sufficient power capacity. Investments in power generation, particularly during the time period of the first steps towards market liberalization, were not sufficient to allow for a normal reserve margin (
Figure 2 and
Figure 3 [
27]).
The main energy form used, up to now, to generate power in the interconnected system is indigenous lignite, which is mainly extracted by the Public Power Corporation (PPC) from surface mines located in the northwestern part of Greece, such as in Ptolemaida, Kozani, and, secondarily, in Megalopolis and Peloponnesus. Lignite plants cover the main baseload.
2.1.2. Electricity Consumption in Greece
Total annual electricity consumption in Greece amounted to 59.2 TWh in 2009, according to the energy source contribution presented in
Figure 4. While consumption grew rather quickly over the period 1999–2004 (4.7% per annum), the consumption growth rate has decreased during the period 2004–2006 (on average 1.8% per annum). Consumption is essentially covered by domestic generation and 4.37 TWh of net imports. Imports have been on rise since 2003.
Table 1 shows the annual generation, net electricity exchanges with foreign networks and total consumption in 2009. Electricity demand and, in particular, the growth in peak load have been growing at a pace of 4% p.a. on average. Given the absence of significant generation facilities competing with those of PPC, imports theoretically represent a source of competition to PPC. However, imports represent a rather modest share of total consumption (8%).
In comparison to the previous paragraph and the annual consumption in 2009, in 2020 natural gas has now become the greatest source of energy used for electricity production in Greece. Between January and June 2020, some eight-terawatt hours of electricity were generated using the fossil fuel. This was followed by renewables, such as wind and solar, which accounted for 6.4 terawatt hours of electricity produced. Renewables also had the greatest share of installed capacity in Greece (
Figure 5) [
28].
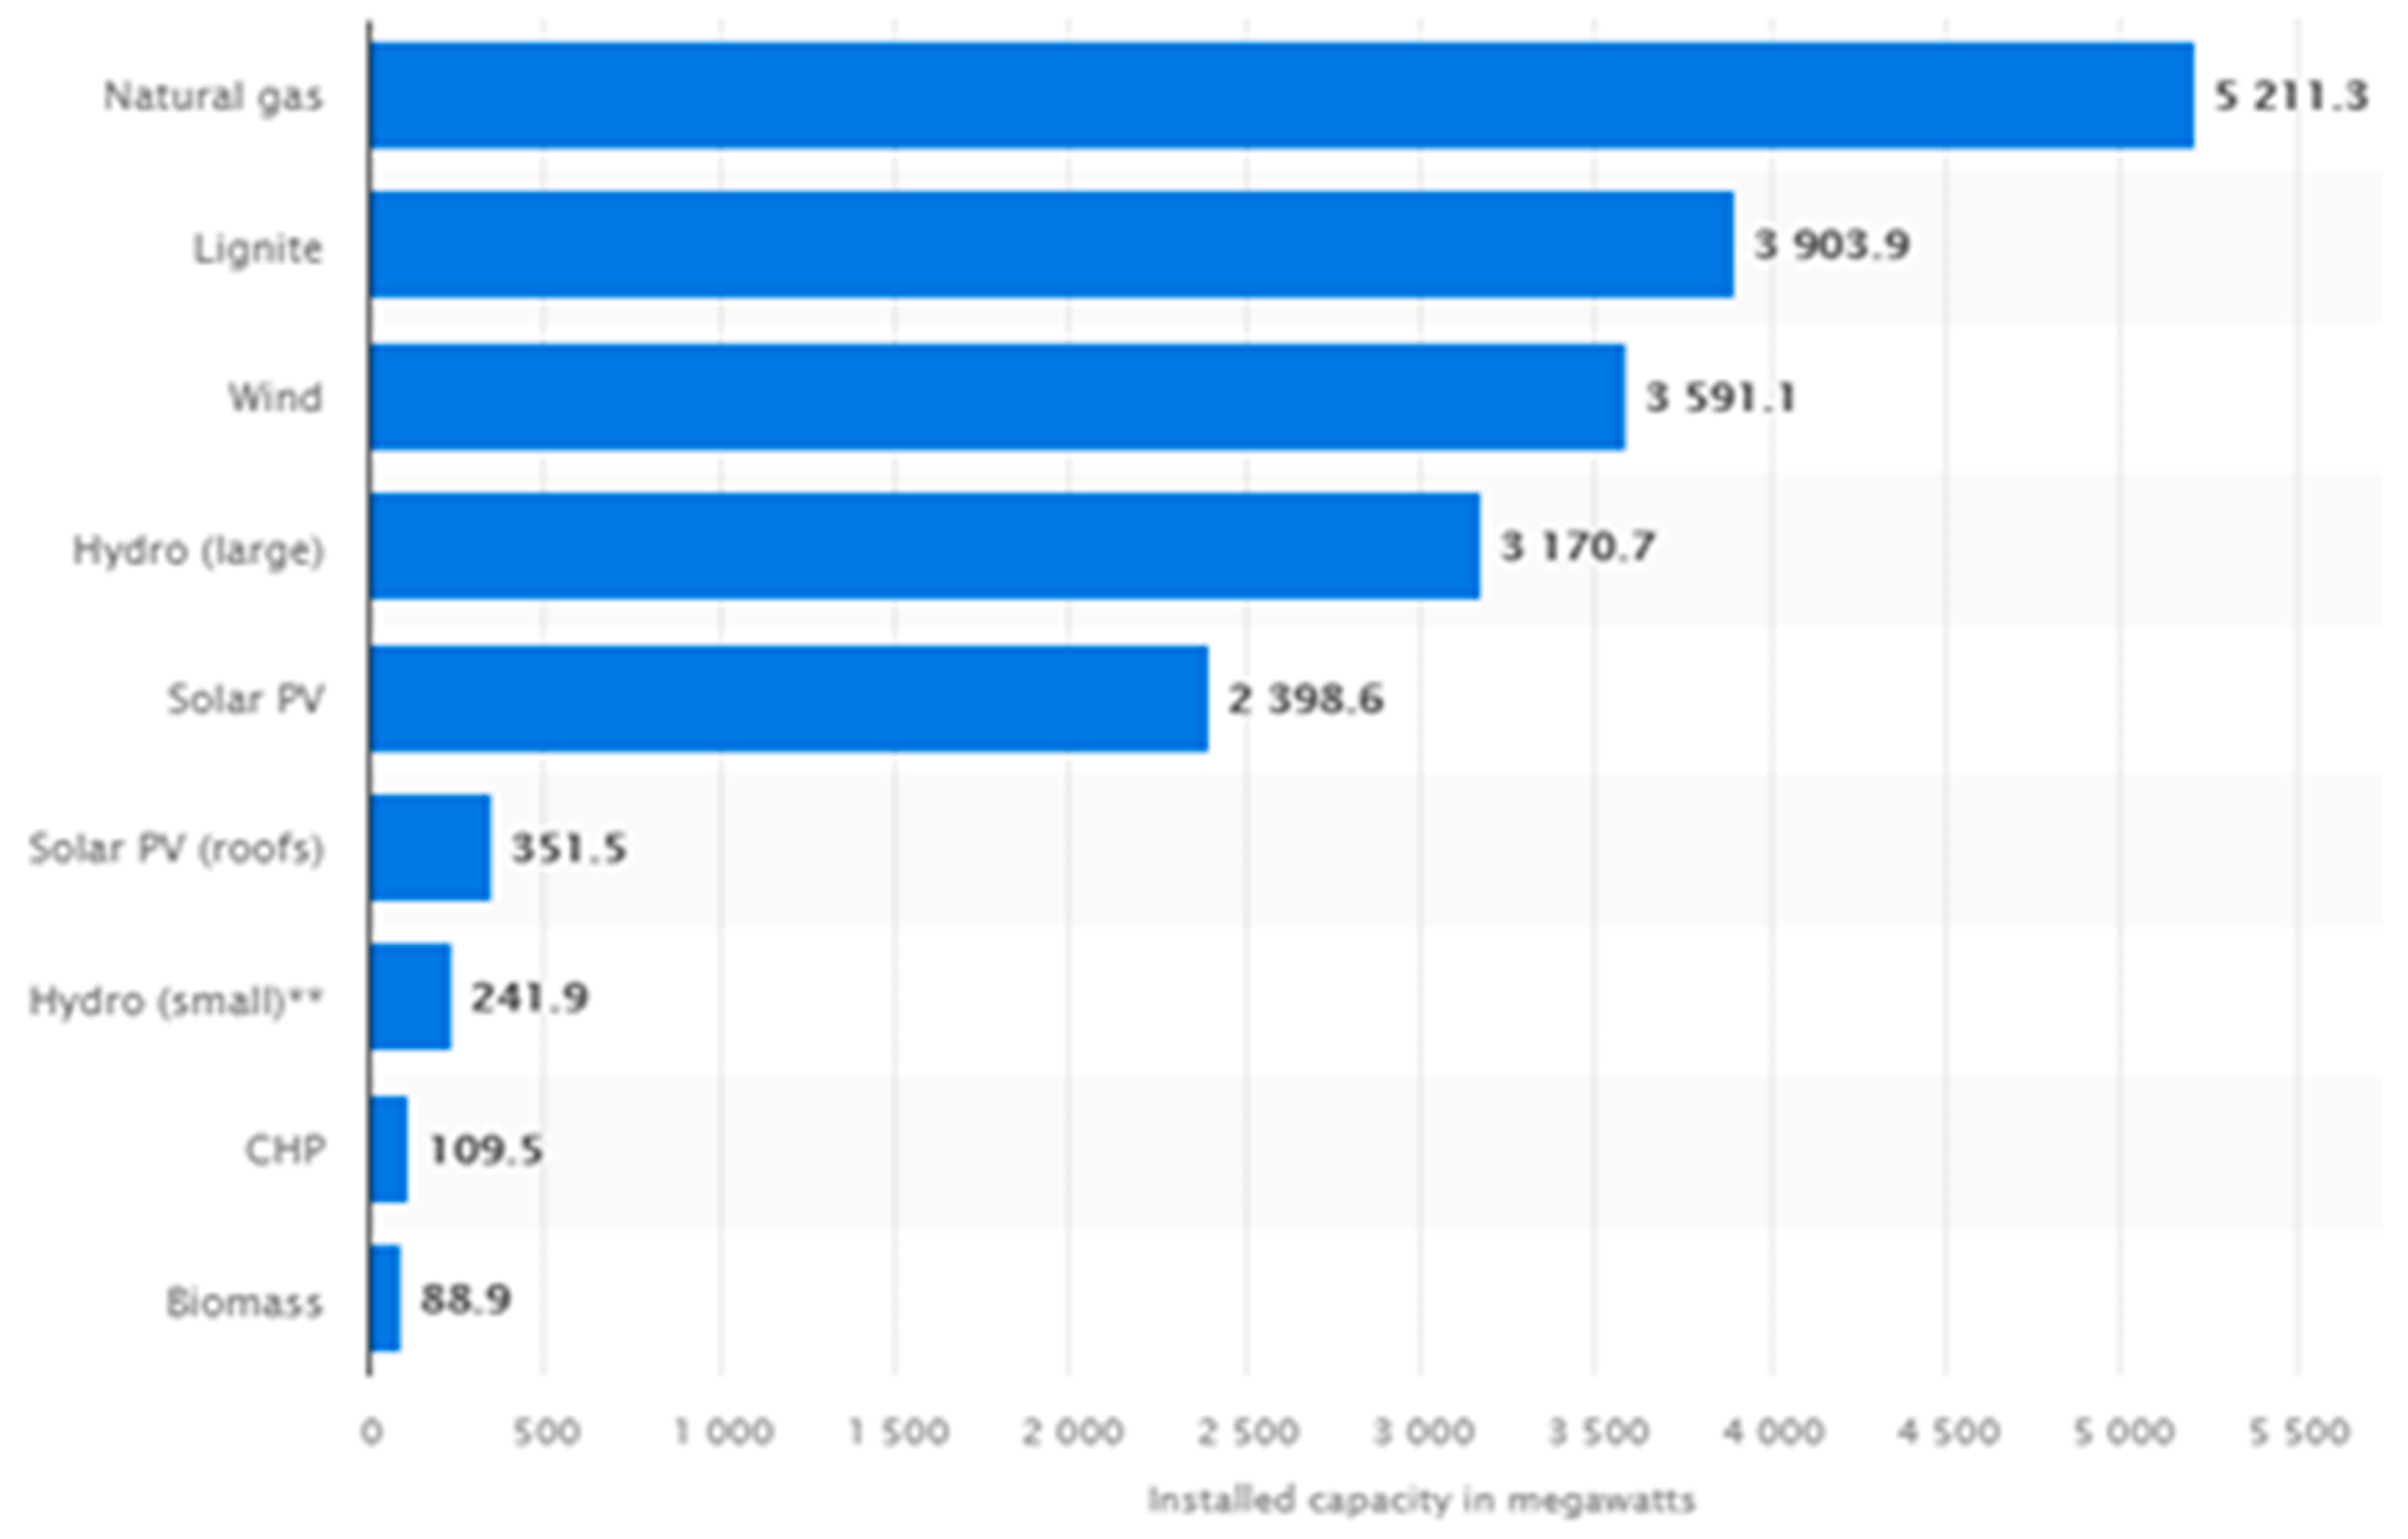
The majority of Greece’s installed energy capacity is linked to renewable sources. As of June 2020, renewable energy, such as wind, solar PV, and small-scale hydro, accounted for 35.6 percent of the country’s total energy capacity. Large hydro units, also known as reversible pumping stations, had an installed capacity of 3.2 gigawatts, or 16.6 percent of Greece’s total installed capacity (
Figure 6) [
27].
The Greek interconnected transmission system is connected with the transmission systems of Albania, Bulgaria, and FYROM in the north of Greece, as well as with that of Italy to the west. The total capacity of northern interconnectors at the end of 2009 was 925 MW (
Table 2). Importers can either be large eligible customers or wholesale suppliers. Suppliers need to obtain a supply import license from the Hellenic Ministry of Development. While any licensed supplier can import electricity into Greece, only PPC can export electricity from Greece. Nevertheless, the transport of imported electricity is restricted because of the limited capacity of the electricity interconnectors. In addition, PPC enjoys reserved import capacity rights over most of the interconnection capacity at the northern borders.
2.2. Reference Energy Resources in Greece
This section presents a more detailed description of the available RES in Greece and their initial installed capacity for this study in 2009 and then, for comparison reasons, in 2019.
2.2.1. Wind Power in Greece
The wind power installed in EU-27 by the end of 2009 was 74,767 MW, with Greece having a small share of 1087 MW (1.5% of the total) [
29]. Specifically, there were 1028 wind turbines installed throughout Greece and the number was set to reach 2587 wind turbines before the end of 2010, with a nameplate capacity of 3372 MW, an expansion of 352% compared to the previous year. According to the Hellenic Ministry for the Environment, Physical Planning and Public Works, the target for the system was set to a nameplate capacity of 6500–8500 MW of solely wind energy by 2020, thus, an average annual growth of 460–626 MW p.a. Greece mainly invested in wind power, 77%, while the rest of renewable sources comprise the remaining 23% of production, with hydroelectric power being second, with 11%. The same public authority also reported that many locations had been selected in Greece based on their potential to install offshore wind parks. According to figures provided from the HWEA, Greece added 727 MW of new wind capacity in 2019, bringing its total to 4115 MW (
Figure 7 and
Figure 8) [
30], an impressive total increase by 230% in a 10-year span, though not achieving the number stated in 2009.
2.2.2. Solar Power and Thermal Energy in Greece
From 2005 and afterwards, the installed capacity of solar power in the EU rose rapidly, and observed an increase by more than 300% until 2009. At the end of 2009, the installed solar PVs capacity in the EU-27 was 15,860 MWp, with 80% in Germany only, and a very small amount (42 MWp or just 0.002%) in Greece, despite its favorable climatic and solar conditions. At the same time (2009), a major PV installation of 50 MW in the old lignite power plant area of Megalopolis, as well as a 200–300 MW photovoltaic power plant in the northwest city of Kozani (i.e., the major lignite and electricity production area), were under consideration for construction. By 2011, more than 7000 applications were submitted to the RAE for PV installation licenses, since the tariffs for a PV system with an installed capacity of less than 100 kW were €0.45/kWh for grid connected systems (on the mainland) and €0.50/kWh for off grid systems (on Greek islands), while, for more than 100 kW installed capacity, the rates were €0.40/kWh and €0.50/kWh, respectively. The Hellenic Ministry of Development then set a minimum national target to have an installed PV capacity of no less than 800 MWp or 2500 MW of PVs with solar in the energy mix of the country by the year 2020. The solar association Helapco has published figures that show the increase in this technology related to Greece, that 913 MW of new solar generation capacity was completed by 2020, showing that the vast majority of the new projects consisted of solar arrays with a generation capacity of up to 500 kW [
28].
A large number of the country’s solar thermal systems were installed in the early 1980s. These was the foundation for building a strong solar industry in the country. In 2019, a capacity of 253 MWth, corresponding to 361,500 m2 of solar collectors, was installed in Greece. This means an increase in new collector installations by 10%, compared to the year 2018. The Greek solar thermal market mostly consists of individual thermosiphon type solar water heaters. A typical system is composed of 150–300 L of hot water storage, in combination with 2–4 m2 of highly selective flat plate collectors with antifreeze protection. Their success in Greece can be attributed to several factors. First, the country has a favorable climate, so the system typically covers 80–90% of the yearly hot water needs. Second, a major reason for the country’s long-term success, is local manufacturing. The solar thermal industry began in the mid-1970s and expanded rapidly to where it is today, producing affordable systems with a demonstrated 25-year life span for both the domestic and export markets.
On the other hand, regarding the solar heating and hot water systems in 2009, the Greek market contracted dramatically—by almost a third, from approximately 300,000 m2 to 206,000 m2—and reverted to the 2004 level. Following several years of strong growth, the market was expected to undergo some form of adjustment; however, this was much more drastic than anticipated, and intensified by the financial and economic crisis. The support schemes available, covering energy efficiency measures and the replacement of older heating equipment, turned out to be poorly funded and rather ineffective for the solar thermal sector. In view of Greece’s instability, the market further declined in 2010, albeit not to the extent of 2009, remaining at a much more stable level.
In 2020, Weiss and Spork-Dur [
29] categorized Greece, with 309 kWth/1000 inhabitants, as one of the leading countries in installed capacity per capita and as having a well-established market for decades that was even able to record growth rates in times of economic crisis.
2.2.3. Geothermal Power in Greece
Geothermal power generation in Europe quickly surpassed the initial target of 1000 MW, while the target value of 2000 MW for 2010, from the Ferrara Declaration [
30], appeared to be attainable. The installed capacity of geothermal heating from medium to low temperature sources exceeds 6600 MWt, having an increasing trend of about 50 MWt per year. The installation growth rate of shallow geothermal energy, such as GSHP, was even more spectacular, and it was anticipated that a capacity of 8000 MWt could be reached with a 10% growth per year. This hints to the fact that geothermal energy has an enormous potential in Europe and, for the heating sector in particular, even the ambitious target of 15,000 MWt set forth in the Ferrara Declaration could be attained with the combination of deep and shallow energy production [
31].
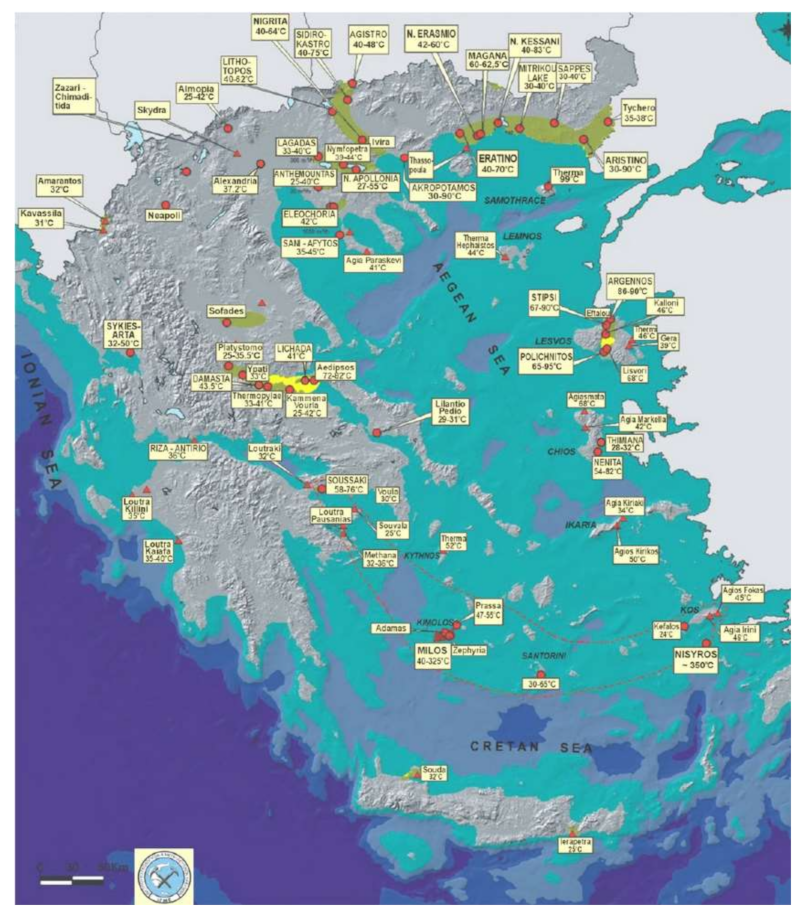
In Greece, there were 30 geothermal fields, among them the last five were found at Aridaia and Sperxios, according to the Greek Institute of Geology and Mineral Exploration [
32] (
Figure 9). From the remaining 25 geothermal fields, 23 are of low temperature, whilst the total known capacity is of 220,000 tons of oil, compared to 180,000 in 2002. The main renewable geothermal capacity in Greece is mostly produced in the areas of Central Macedonia, East Thrace–Macedonia, the north Aegean Sea and the south Aegean Sea. Additionally, two more important geofields have been discovered on the islands of Milos and Nisiros. Despite the high potential, there is no electricity produced by geothermal energy, though, in economic terms and according to the hydrocarbon price, this potential could be translated into €30 million, if it was fully used. The existing installed capacity in the country is only for the direct utilization of geothermal energy and is approximately 75 MWt [
33]. About a half of this capacity (with a capacity factor of 0.24) is for thermal spas (in a few cases combined with space heating) and the heating of open and closed pools.
2.2.4. Hydropower Stations in Greece
Hydropower is the most widely used RES worldwide, contributing almost 20% to the fulfillment of the planet electricity demand [
34]. The average load factors of large-scale hydropower plants range from 2200 to 6200 full load hours per annum in Europe, with an average of about 3500 h. In 2011, installed capacity in the EU-27 for hydropower was about 102 GW, excluding hydro pumped storage. Approximately 90% of this potential was covered by large hydropower plants. Over 21,000 SHP account for more than 12 GW of installed capacity in the EU-27. The annual net electricity production in the EU-27 during the last decade has varied between 300 and 370 TWh, with SHP covering 13% of the total amount [
35].
Greece, in 2009, especially the western and northern part of the mainland, has significant hydropower potential that is partially exploited. This can mainly be attributed to the fact that electricity generation has not been a priority of the national water management policy and most Greek hydropower stations are used mainly to meet the corresponding peak load demand.
Table 3 provides an overview of existing 15 LHP and approximately 50 SHP stations operating in Greece, as reported in [
36,
37]. The total installed hydropower at the end of 2009 was 3170 MW. According to the existing nomenclature, a hydropower plant is characterized as small if its rated power is less than 10 MW. The available data in
Table 3 shows that the rated power of the 21 SHP plants is in the range of 1–10 MW, while the remaining 29 stations are mini-installations with rated power of less than 1 MW.
The total hydropower capacity in Greece has increased in the least years, reaching 3412 megawatts in 2020. From 2008 to 2020, the total hydropower capacity increased 336 megawatts [
38] a 7.1% increase.
2.2.5. Lignite Power Plants in Greece
Lignite is a solid fuel mostly used for electricity generation, although it can be consumed for household heating and some industrial processes. Available figures in 2009 for the EU-27 show that electricity generation represents around 93.3% of total lignite consumption, industrial processes 2.4%, patent fuel plants 3.6% and domestic heating 0.4%. In Greece, virtually all lignite is used for electricity generation [
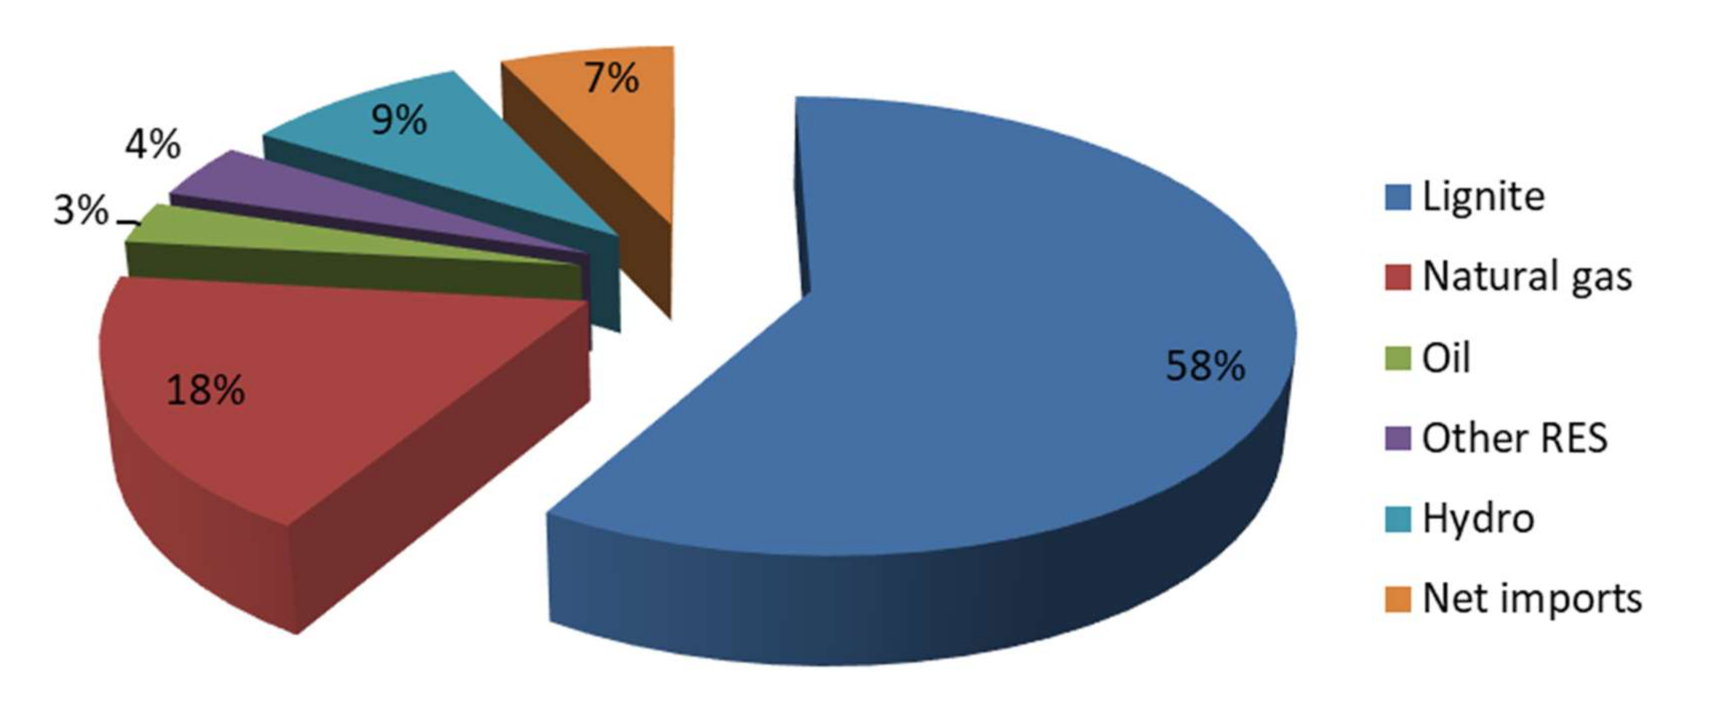
39]. With a total lignite production of 35.4 million tons in 2017, PPC’s lignite fired generation continues to be one of the main suppliers, accounting for 23% of the installed capacity (4337 MW) and 33% of the electricity generation in 2017, while renewable energy sources and natural gas accounted for 32% and 30%, respectively. Low efficiency, old units with a total installed capacity of 913 MW have already been decommissioned, and another 2112 MW will be decommissioned by 2025. However, a new unit of 660 MW (Ptolemais V) is under construction, with a target to operate in 2020, while an additional unit in a Meliti power plant is expected to be commissioned by 2025.
Lignite is the least calorific of all categories of coal (anthracite, bituminous, subbituminous, brown coal/lignite): this is due to its high moisture and volatile content and to its low carbon content. As a result, lignite fired plants are designed to specifically burn lignite and it is also expensive to turn them into coal fired plants. Therefore, lignite is unsuitable for transportation over long distances. Naturally, all lignite fired plants in the EU are close to lignite mines and there is virtually no export of lignite between EU member states (such exports represented less than 0.1% of total consumption). Greece itself has neither imported nor exported any lignite, in recent years. Thus, lignite is essentially a locally produced solid fuel used for electricity generation at power plants situated close to lignite mines. The possibility of building new coal fired power plants, which could be fed with imported coal, has been discussed in the past; thus, this option is strongly exploited in this paper (the reader is referred to
Section 4).
Greece is the fifth largest producer of lignite in the world and the second largest producer of lignite in the EU, after Germany (
Figure 10) [
40]. Generally, imports and exports of lignite are rather limited, implying that consumption in each member state almost equals production. Lignite is an abundant resource in Greece, with the reserves of all deposits estimated at 4590 Mt by the Greek Institute of Geology and Mineral Exploration, while only 3656 Mt of these reserves were exploitable at that time, as defined by the Hellenic Republic and the PPC [
41].
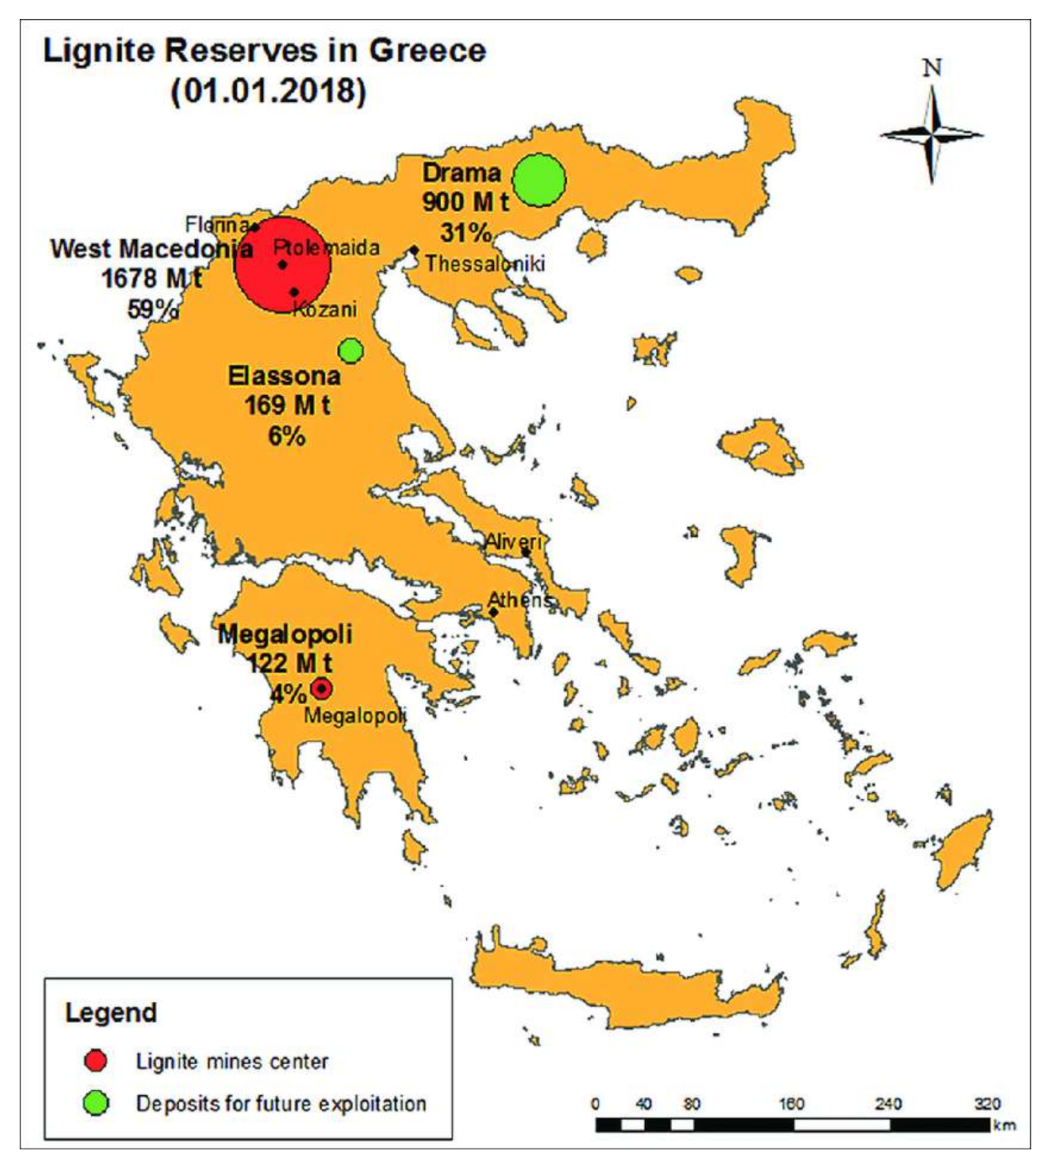
Figure 10 illustrates the main areas of exploited deposits and exploitable reserves of lignite in Greece, as identified by PPC [
42]. Most deposits are located in the northern part of Greece, mostly in Western Macedonia, while the three PPC deposits of Megalopolis and the majority of the privately owned deposits are located in the Peloponnesus, in the southern part of Greece. In the center of the country, as well as in the islands of Crete and Rhodes, there are some small deposits, whose exploitation rights have not yet been given (
Figure 11) [
42].
The annual production of lignite is approximately 60 Mt, 80% of which derives from the coal fields of northern Greece (Ptolemais, Amynteo and Florina). According to the PPC, based on Greece’s total deposits and the anticipated future consumption rate, it is estimated that the domestic supply of lignite will be sufficient for more than 45 years.
Table 4 lists the existing lignite power plants (along with other thermal power plants) and details their operational characteristics (2009 data).
3. Materials and Methods
The implementation of CCS will influence the local electric power production, share of emissions reduction available from the electricity generation sector and cost of meeting emissions targets. To this end, the TIMES model generator, developed and maintained by the ETSAP of the IEA, is chosen in this paper as an energy modelling tool capable of capturing the potential benefits from deploying the CCS technology, as well as assessing alternative scenarios for the future development paths of the national energy system in Greece. More specifically, TIMES employs a dynamic approach, to simultaneously determine the energy system configuration over multiple periods of a certain time horizon, assuming that the market players have perfect foresight. This implies that the known parameters include the future evolution of the demands, the attributes of the technologies (e.g., techno–economic data) and energy carriers needed to serve these demands [
41]. TIMES takes into account the total lifetime costs of competing technology alternatives, along with the constraints imposed on the system, such as limits on resource availability and the potential market penetration of technologies and emission caps, in order to compute the energy flows and commodity prices. At this point, it is noted that TIMES generates a partial equilibrium model of the energy system under consideration, where only the relevant parts of the economy are represented, e.g., the energy sector, in contrast to general equilibrium approaches that model the whole economy [
42]. Given that TIMES provides a bottom up framework for representing the available (either existing or future) technology options, this energy systems analysis tool is particularly suitable for the purposes of the present study.
A TIMES model determines the least cost configuration of an energy system (in terms of technologies and energy flows), while satisfying the constraints of supply and demand, by optimizing the following objective function [
42] (Equation (1)):
where
Ctot,
Cinv,
Csun,
Cfix, and
Cvar, are the total, investment, sunk material, fixed and variable costs, respectively,
T is the taxes,
Csur is the surveillance costs,
Cdec is the decommissioning costs,
S is the subsidies,
M is the recuperation of sunk material costs and
V is the salvage value.
To satisfy the demand for energy services at the minimum system cost, the decisions concerning equipment investment and operation, primary energy supply and energy trade are made simultaneously in a TIMES model, while all cost elements are appropriately discounted to a selected year, according to the Equation (2):
where
NPV is the net present value of the total costs,
ANNCOST is the total annual cost,
d is the general discount rate,
R is the set of regions under study,
REFYR is the reference year for discounting and
YEARS is the set of years for which costs occur.
In this context, the model of the Greek energy system developed in TIMES is demand driven and technology oriented. Given a set of technological options to meet supply and demand, along with assumptions of energy prices and resource availabilities, the model optimizes the total energy system costs to meet the sectoral energy demand. The supply side of the developed model covers fossil fuels (oil), mazut, natural gas, hard coal, lignite and RES (hydro, wind, geothermal, solar, biomass). The techno–economic data for supply side technologies include various parameters, such as availability factor, capacity factor, electrical efficiency, self-consumption rate, technical lifetime, specific capital costs, etc. In addition, the model makes assumptions of several factors, such as energy prices, resource availabilities and energy trade.
4. Scenarios
The first step to begin the progress of implementing the CCS technology in a country is to set up the environmental and regulatory assessment of this new technology at a national level. For the entire design of national energy systems, it is necessary to consider specific factors, including regional resource endowments, conversion technologies, information, time, prices and investment finance, operating costs and the age of infrastructures. Therefore, through the developed TIMES model, scenarios of the Greek energy mix until 2040 are developed and further analyzed.
4.1. Business as Usual Scenario
In this study, the model analyzes the behavior of the electricity sector in detail. The base year of the model is 2005 with the horizon up to 2040, with a resolution period of one year. The model has been calibrated for the base year of 2005 and has been validated by experimental runs from 2005 to 2008. Upon the application of moderate boundaries, the model showed a sufficient match with the real performance of the electricity system during the given period of time.
The supply side of the model addresses the electricity production, such as fossil fuel and cogeneration power plants. In the base year, each fossil fuel power plant is regarded as an individual technology. Other technologies are divided into different groups, depending on the source that generates electricity. The techno–economic data of the supply side technologies are installed capacity, technical lifetime, electrical efficiency, availability factor, capital costs, fixed costs and variable costs (see
Table 4 for thermal stations). A homogenous discount rate of 5% is applied for all economic values.
In order to satisfy the required electricity demand, importing electric energy from the Balkan market is allowed, while the electricity price based on the historic database and the trend noted between 2005 to 2010 is linearly extrapolated up to 55 €/MWh in 2050. In addition, assumptions are based on fuel prices, resources availability and CO
2 permit trade. Assumptions regarding future fossil fuel prices are adopted from the reference scenario of the World Energy Outlook [
40] until 2030 and then prices are maintained constant.
Table 5 summarizes the evolution of the estimated prices for electricity and fuels. Throughout the time period under study, the import of fossil fuels without limitations is assumed. In addition, the model considers no limitations on availability of domestic natural resources. The environmental trend of the scenario under study is incorporated based on the regulatory restrictions of the Greek national allocation plan [
41]. Between 2005 and 2008, the maximum value of the emitted CO
2 by the electricity sector is limited to 22.5 Tg/year. Then, this value is reduced to 15.4 Tg p.a. until 2050, however, the emissions exceeding this limit can be exported under the EU—ETS, with a cost of 20 €/Mg of CO
2 up to 7.1 Tg p.a. over the target. Moreover, from 2013 onwards, all CO
2 emissions are taxed with the price equal to allowance permits purchased under the EU—ETS trading system. Therefore, in this period, a double cost is incurred from exceeding the CO
2 limit, which equals to the one in the period from 2008 to 2012.
The national targets by 2020, as stated in various sources regarding the increase in RES in the energy mix of Greece and completing also the EU targets of 20–20–20, are the following:
Every year 1500 MW of RES will be installed to reinforce the existing level of 4410 MW for the year 2010. Thus, from 2010–2020, a total of 15,000 MW of new capacity will be gradually installed, according to the suggested development plan by the Hellenic Ministry of Environment, Energy and Climate Change.
The new 1500 MW/year of installed RES capacity, from the existing level of 4410 MW in 2010, includes the following implementations in total: 7500 MW from wind, 2500 MW from PVs–solar, 250 MW from biomass, and another 120 MW from geothermal sources.
From 2012 up to 2020, the oil price is to be kept in the range of 90–100 USD/barrel.
A strategic plan for the period 2010–2024 regarding the gradual future decommissioning of 24 units of PPC electricity power plants with a total capacity of 5378 MW, of which 4288 MW correspond to, at present, 20 lignite units (out of the total 22) and 1100 MW to 4 units of natural gas (Lavrio III (180 MW) and Lavrio IV (560 MW), Keratsini 8 (160 MW) and Keratsini 9 (200 MW)).
A total of 5484 MW of newly installed capacity from thermal power stations, of which 2112 MW is from private companies and 3372 MW from PPC, as shown in
Table 6.
The initial results obtained from the TIMES model for the above RES mix, regarding the required future capacity investments, are presented in
Table 7. At this point, it is noted that the BAU scenario assumes no CO
2 taxation of any order, as well as no price and no limits on CO
2 emissions [
23].
4.2. Scenarios Implementing CCS Technologies and Carbon Emission Costs
As already pointed out, this paper further analyzes selected scenarios for implementing CCS technologies and policy measures, as discussed in [
22,
23]. Specifically, the present work examines three scenarios, namely, SC1, SC2, and SC3, with different taxations and permit prices for CO
2 emissions, according to the schema presented in
Table 8, under the assumption that the lignite/hard coal power plants, which are already licensed to be built (
Table 6), employ CCS technology from 2010 and afterwards.
5. Results and Discussion
In the time period of 2005–2020, the electricity demand in Greece is set to grow rapidly, according to a study of the national transmission operator.
Figure 12 shows the annual demand, as extracted from the BAU scenario, while
Figure 13 presents the development of electricity generation by the introduction of different technology groups for the BAU scenario during the period under study, satisfying the required electricity demand.
There are certain technologies that maintain practically constant electricity production throughout the time period under study, namely, the hydro power plants, waste combustion, biofuels power plants and cogeneration plants (both combusting fuel oil and natural gas). The wind power plants and their corresponding technology are progressing in the near future in a very economical way, according to the model, and in 2020 they are expected to generate considerably more electricity compared to the base year, as also verified in 2020. As a result, they occupy a higher percentage of the electricity mix. On the contrary, the lifetime of the fossil fuel power plants has come to an end, and none are reconstructed or participate in the electricity mix. The mazut power plants, which are substituted by natural gas after a small period of time (5 years), are afterwards substituted by COA. Constraints on CO2 emissions lead to a reduction in the lignite power plants that are also being compensated by coal power plants, although they do not entirely disappear. The deficits in electricity needs that appeared are complemented by imported electricity, and, until 2025, these are limited to zero. The quantity of electricity produced by solar power plants technology is small compared with the total electricity system, but is very significant compared to pre-2010 values. The cost of generating electricity as a function of carbon price for this mix of technologies is EUR 43,203 million.
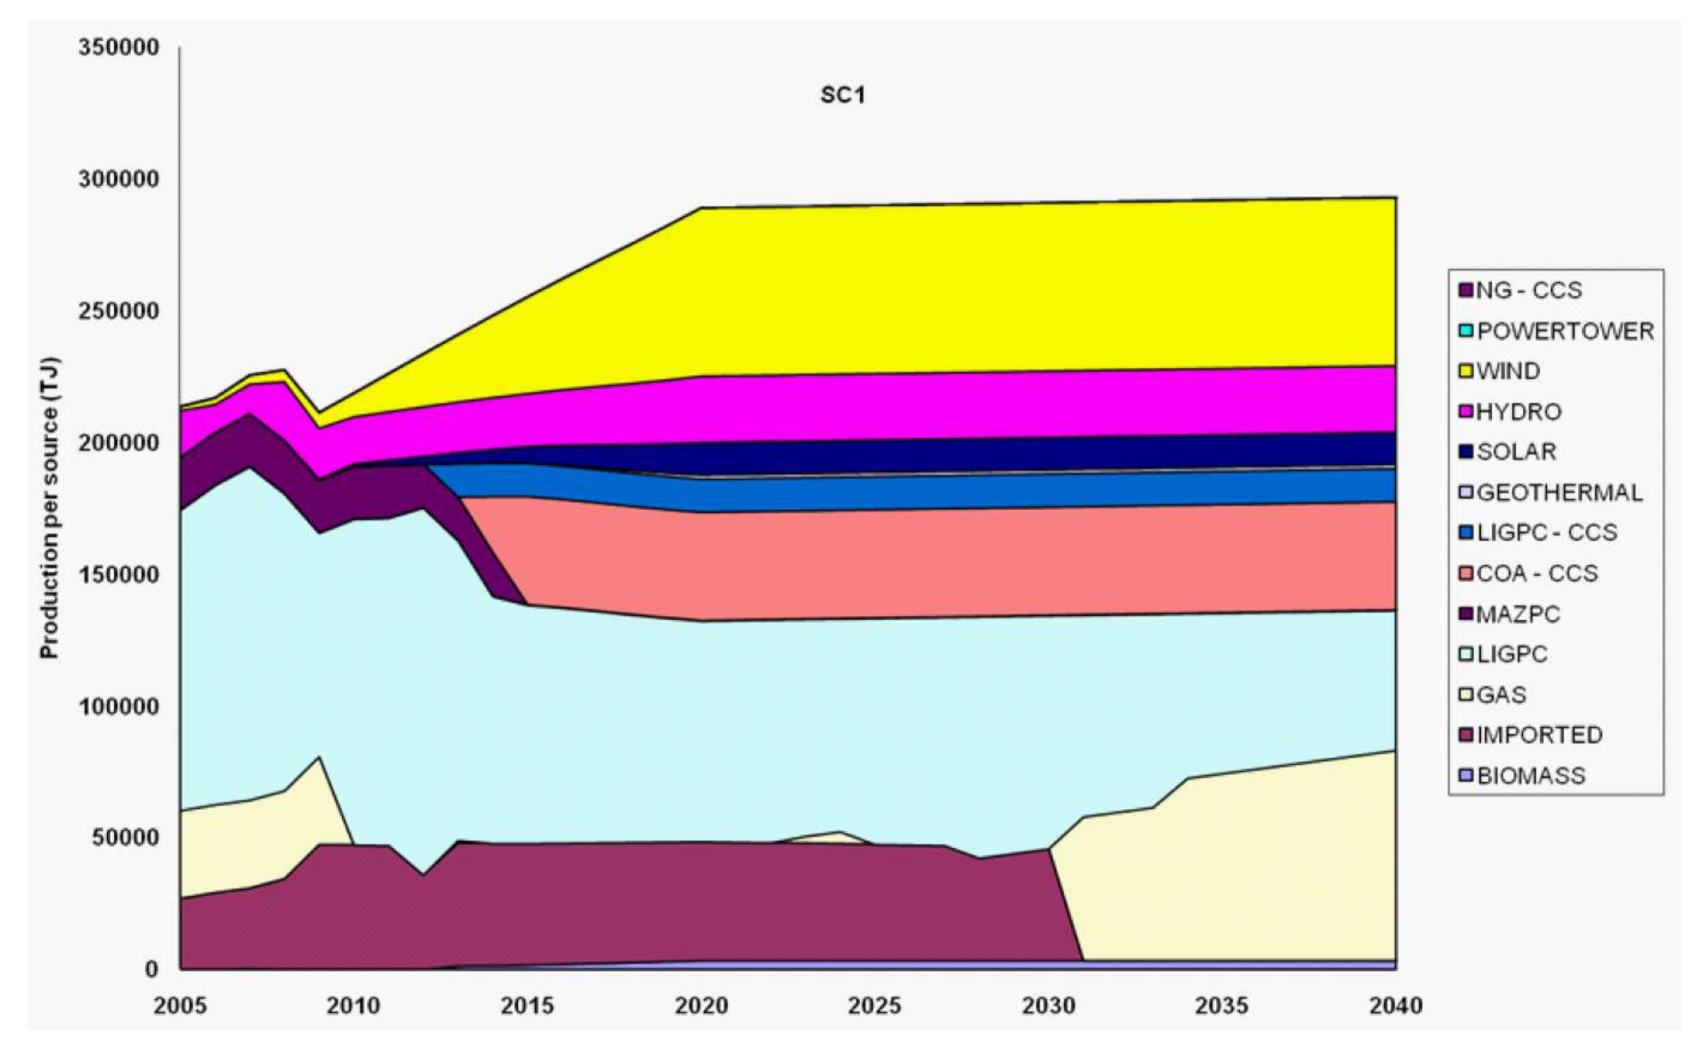
In scenarios SC1–SC3, the lignite/hard coal (imported) power plants that are already licensed to be built are assumed to have CCS. As illustrated in
Figure 14, for the scenario SC1, the imports are cut after 2030 (a few years later compared to the BAU scenario) and natural gas is part of the energy mix. Therefore, it is rather safe to assume that the introduction of the CO
2 tax can make the price of the imported electricity more competitive, until 2030, while it simultaneously substitutes the lignite production, thus reducing the CO
2 emissions. Additionally, the use of lignite is further decreased, thus, CO
2 emissions also decline from 2030 until 2040, due to the higher use of natural gas and coal power plants. The incorporation of CCS in the energy mix of the country results in the further reduction of CO
2, since the new lignite power plants are also under a CCS prospect. The corresponding cost of the energy mix technologies under the referred scenario is EUR 50,828 million.
In scenarios SC2 and SC3 (
Figure 15), the use of lignite is eliminated by the year 2020, while the solar power tower plants are progressing rapidly from that year and onwards, and are generating almost half of the required renewable energy production. Moreover, there is a rapid reduction in lignite-based production in the energy mix, as well as that of the CO
2 emissions. Additionally, the time frame of electricity imports is further extended compared to the BAU and SC1 scenarios, and these are eliminated only after 2037, while, during that period, this energy substitutes the energy that would be produced by lignite or natural gas power plants. The rest of the percentages of the renewables in the energy mix remain the same, thus, the tax increase on CO
2 favors the larger penetration of the power tower technology, because of the renewables’ percentage in the energy mix. In addition, having the natural gas with CCS power plants substitute the lignite power plants is positive, since the latter are no longer economically competitive. The costs for generating electricity, as a function of the carbon price under this mix of technologies that has been involved within the model for 2030 and of SC2 and SC3, are EUR 53,363 and EUR 53,488 million, respectively. A noticeable fact is that there is no significant difference between SC2 and SC3, mainly because the CO
2 price is high enough to make the applied technologies competitive against the lignite and natural gas. In turn, this contributes to increasing the percentage of RES in the energy mix, and especially of the power tower that relates with solar energy.
6. Conclusions
This paper examined the strategic planning of CCS implementation in Greece if considered in the starting year 2010, with a special focus on the electricity sector. Firstly, context information is provided by giving an insight into the status of the Greek energy mix for the base year, the available RES, as well as information about lignite use in the years when the model was considered and as a checking point of validity of these calculations in 2020. Following, the TIMES model is presented and further implemented, resulting in three main scenarios, namely, SC1, SC2, and SC3, which are extended from 2010 till 2050.
In detail, the analysis of the results shows that the implementation of CCS to the new and then considered licensed power plants from 2010 and onwards could significantly reduce the use of lignite and imported hard coal power production, while making the process towards a carbon/lignite free economy in Greece smoother and faster. This is showed to be covered either by cheaper imported electricity and/or the higher penetration of RES, something that the last has indeed proved to do as stated, especially by wind and CSP. The cost of a CCS energy policy implementation under a CO2 tax scheme would be an extra amount of EUR 7.6 billion up to EUR 10.3 billion to the electricity generation, compared to the BAU scenario, if that had been considered in 2010 as a good solution, while at the same time completing the suggested energy mix targets of the Hellenic Ministry for the Environment, Physical Planning and Public Works, as well as that of the reduction in CO2 emissions according to the EU regulations. The validity of the study after a 10-year period shows that the proposed model and methodology would be a great tool to be used in similar cases by any current or future governmental bodies, or industry itself, on national or individual energy policy scenarios, as well as other cases of interest not only regarding lignite or carbon but also other forms of projected energy policy.
Author Contributions
Conceptualization, C.S.I., H.G. and N.K.; methodology, C.S.I., H.G. and N.K.; software, C.S.I. and H.G.; validation, C.S.I., H.G. and N.K.; formal analysis, A.B. and S.K.; investigation, C.S.I., H.G., A.B., S.K. and N.K.; resources, C.S.I. and N.K.; data curation, C.S.I., H.G., A.B. and S.K.; writing—original draft preparation, C.S.I., H.G. and S.K.; writing—review and editing, A.B., N.K. and S.K.; visualization, C.S.I. and N.K.; supervision, C.S.I. and N.K.; project administration, C.S.I. and N.K.; funding acquisition, C.S.I. All authors have read and agreed to the published version of the manuscript.
Funding
This work was supported in part by EU through project FENCO-ERANET/0001/2008.
Institutional Review Board Statement
Not applicable.
Informed Consent Statement
Not applicable.
Data Availability Statement
Not applicable.
Conflicts of Interest
The authors declare no conflict of interest.
Nomenclature
| CCS | Carbon capture and storage |
| MARKAL/EFOM | Market allocation/energy flow optimization model |
| TIMES | The Integrated MARKAL-EFOM System |
| EU | European Union |
| US | United States |
| BP | Beyond Petroleum |
| OECD | Organization for Economic Cooperation and Development |
| IPCC | Intergovernmental Panel on Climate Change |
| GHG | Greenhouse Gas Emissions |
| UK | United Kingdom |
| PRIMES | Price-Induced Market Equilibrium System |
| FYROM | Former Yugoslav Republic of Macedonia (presently Northern Macedonia) |
| RES | Renewable energy sources |
| MW | Megawatt |
| TWh | TeraWatt hour(s) |
| CSP | Concentrated solar power |
| GWh | Gigawatt hours |
| PVs | Photovoltaics |
| PPC | Public Power Corporation |
| HWEA | Hellenic Wind Energy Association |
| RAE | Regulatory Authority of Energy |
| Helapco | Hellenic Association of Photovoltaic Companies |
| GSHP | Ground source heat pumps |
| SHP | Small hydropower plants |
| LHP | Large hydropower plants |
| CHP | Combined heat and power |
| FGD | Flue gas desulphurization |
| ETSAP | Energy Technology System Analysis Program |
| IEA | International Energy Agency |
| Tg | Teragrams |
| ETS | Emissions trading system |
| TJ | TeraJoule |
| SC | Scenario(s) |
| OCGT | Open cycle gas turbine |
| NGCC | Natural gas combined cycle |
| TERNA | Energy Finance Single Person Societe Anonyme |
| HELPE | Hellenic Petroleum |
| TBC | To be confirmed |
| BAU | Business as usual |
| COA | Coal power plants |
References
- UN Energy Information Administration, Office of Energy Analysis. Energy Outlook 2016 with Projections to 2040. 2016. Available online: http://www.eia.gov/outlooks/ieo/pdf/0484(2016).pdf (accessed on 30 July 2018).
- BP. BP Energy Outlook 2035. 2015. Available online: http://www.bp.com/content/dam/bp/en/corporate/pdf/energy-economics/energy-outlook/bp-energy-outlook-2015.pdf (accessed on 30 July 2018).
- International Energy Agency (IEA). World Energy Outlook 2015. Executive Summary. 2015. Available online: http://www.iea.org/publications/freepublications/publication/WEB_WorldEnergyOutlook2015ExecutiveSummaryEnglishFinal.pdf (accessed on 30 July 2018).
- Capros, P.; Tasios, N.; De Vita, A.; Mantzos, L.; Paroussos, L. Model-based analysis of decarbonising the EU economy in the time horizon to 2050. Energy Strateg. Rev. 2012, 1, 76–84. [Google Scholar] [CrossRef]
- Nichols, C.; Victor, N. Examining the relationship between shale gas production and carbon capture and storage under CO2 taxes based on the social cost of carbon. Energy Strateg. Rev. 2014, 7, 39–54. [Google Scholar] [CrossRef]
- Atsonios, K.; Panopoulos, P. Exergetic comparison of CO2 capture techniques from solid fossil fuel power plants. Int. J. Greenh. Gas Control 2015, 45, 106–117. [Google Scholar] [CrossRef]
- Bond, C.E.; Kremer, Y.; Johnson, G.; Hicks, N.; Lister, R.; Jones, D.G.; Haszeldine, R.S.; Saunders, I.; Gilfillan, S.M.V.; Shipton, Z.K.; et al. The physical characteristics of a CO2 seeping fault: The implications of fracture permeability for carbon capture and storage integrity. Int. J. Greenh. Gas Control 2017, 61, 49–60. [Google Scholar] [CrossRef]
- Intergovernmental Panel on Climate Change (IPCC). IPCC Special Report on Carbon Dioxide Capture and Storage; Intergovernmental Panel on Climate Change (IPCC): Geneva, Switzerland, 2005. [Google Scholar]
- Oltra, C.; Sala, R.; Di Masso, M.; Rowe, G. Lay perceptions of carbon capture and storage technology. Gas Control 2010, 4, 698–706. [Google Scholar] [CrossRef]
- Koebl, B.S.; Van den Broek, M.A.; Van Ruijven, B.J.; Faaij, A.; Van Vuuren, D.P. Uncertainty in the deployment of Carbon Capture and Storage. Int. J. Greenh. Gas Control 2014, 27, 81–102. [Google Scholar] [CrossRef]
- L’Orange, S.; Arvai, J.; Dohle, S.; Siegrist, M. Predictors of risk and benefit perception of Carbon Capture and Storage. Int. J. Gas Control 2014, 25, 23–32. [Google Scholar] [CrossRef]
- Fais, S.; Keppo, I.; Zeyringer, M.; Usher, W.; Daly, H. Impact of technology uncertainty on future low-carbon pathways in the UK. Energy Strateg. Rev. 2016, 13, 154–168. [Google Scholar] [CrossRef]
- Barth, J.A.C.; Nowak, M.E.; Zimmer, M.; Norden, B.; Van Geldern, R. Monitoring of cap-rock integrity during CCS from field data at the Ketzin pilot site (Germany): Evidence from gas composition and stable carbon isotopes. Int. J. Greenh. Gas Control 2015, 43, 133–140. [Google Scholar] [CrossRef]
- Inderberg, T.H.; Wettestad, J. Carbon capture and storage in the UK and Germany: Easier task, stronger commitment? Int. J. Greenh. Gas Control 2015, 24, 1014–1033. [Google Scholar] [CrossRef]
- Egging, R. Norway’s role in the European energy transition. Energy Strateg. Rev. 2018, 20, 99–101. [Google Scholar] [CrossRef]
- Li, F.G.N. Actors behaving badly: Exploring the modelling of non-optimal behaviour in energy transitions. Energy Strateg. Rev. 2017, 15, 57–71. [Google Scholar] [CrossRef]
- Capros, P.; Mantzos, L.; Papandreou, V.; Tasios, N.; Klaassen, G. Energy systems analysis of CCS development in Europe. In Proceedings of the 5th International Conference on the European Electricity Market, Lisboa, Portugal, 28–30 May 2008. [Google Scholar]
- Greenpeace. Green Revolution without Coal, without Nuclear, without Problem; Greenpeace: Amsterdam, The Netherlands, 2006. [Google Scholar]
- Hellenic Ministry of Development. 1st Report for Greece’s Long-Term Energy Planning 2008–2020; Hellenic Ministry of Development: Athens, Greece, 2007.
- Hellenic Ministry of Development. Physical Planning and Public Works, National Allocation Plan for Period 2005–2007; Hellenic Ministry of Development: Athens, Greece, 2004.
- Hellenic Ministry of Development. Physical Planning and Public Works, National Allocation Plan Program for the Period 2008–2012: Demonstrable Progress under the Kyoto Protocol; Hellenic Ministry of Development: Athens, Greece, 2006.
- Ioakimidis, C.S.; Koukouzas, N.; Chatzimichali, A.; Casimiro, S.; Itskos, G. Assessment for Carbon Capture and Storage: Opportunites in Greek case study. Comput. Aided Chem. Eng. 2011, 29, 1939–1943. [Google Scholar]
- Ioakimidis, C.S.; Koukouzas, N.; Chatzimichali, A.; Casimiro, S.; Macarulla, A. Energy policy scenarios of CCS implementations in the greek electricity sector. Energy Procedia 2012, 23, 354–359. [Google Scholar] [CrossRef]
- Iliadou, E.N. Electricity sector reform in Greece. Util. Policy 2009, 17, 76–87. [Google Scholar] [CrossRef]
- Hellenic Statistical Authority. Population-Housing Census. 2011. Available online: http://www.statistics.gr/en/2011-census-pop-hous (accessed on 30 July 2018).
- European Wind Energy Association. Wind in Power 2009: European Statistics. 2009. Available online: http://www.ewea.org/fileadmin/ewea_documents/documents/statistics/general_stats_2009.pdf (accessed on 30 July 2018).
- HWEA Wind Energy Statistics. Spatial Distribution of Wind Capacity in Greece. 2020. Available online: https://eletaen.gr/wp-content/uploads/2021/01/2021-01-26-2020-HWEA-Statistics-Greece.pdf (accessed on 25 August 2021).
- Tsagas, I. Greece Developed 1GW of Solar in 2020 and Has Linked Crete to the Mainland Grid; pv Magazine: Berlin, Germany, 2021. [Google Scholar]
- Weiss, W.; Spork-Dur, M. Solar Heat Worldwide: Global Market Development and Trends in 2019. Detailed Market Figures 2018. 2020. Available online: https://www.iea-shc.org/Data/Sites/1/publications/Solar-Heat-Worldwide-2020.pdf (accessed on 25 August 2021).
- European Geothermal Energy Council. A Geothermal Europe-the Ferrera Declaration. 1999. Available online: https://www.yumpu.com/en/document/read/33437337/a-geothermal-europe-the-ferrara-declaration-in-pursuit-egec (accessed on 30 July 2018).
- Renewable Energy Policy Network for the 21st Century (REN21). Renewables Global Status Report 2006 Update. 2007. Available online: https://www.ren21.net/Portals/0/documents/activities/gsr/RE2007_Global_Status_Report.pdf (accessed on 30 July 2018).
- European Small Hydropower Association. Strategic Study for Development of Small Hydropower in the European Union (Report on Status of SHP Policy Framework and Market Development in EU-27); European Small Hydropower Association: Brussels, Belgium, 2008. [Google Scholar]
- Kaldelliis, J.K. The contribution of small hydro power stations to the electricity generation in Greece: Technical and economic considerations. Energy Policy 2007, 35, 2187–2196. [Google Scholar] [CrossRef]
- Kaldelliis, J.K. Critical evaluation of the hydropower applications in Greece. Renew. Sustain. Energy Rev. 2008, 12, 218–234. [Google Scholar] [CrossRef]
- Jaganmohan, M. Total Hydropower Capacity in Greece. 2020. Available online: https://www.statista.com/statistics/864352/total-hydropower-capacity-in-greece/ (accessed on 24 August 2021).
- European Commission. 2003–2004 Coal Report; European Commission: Brussels, Belgium, 2005. [Google Scholar]
- European Association for Coal and Lignite. Coal in Europe 2010. 2010. Available online: http://euracoal2.org/download/Public-Archive/Library/Charts-Maps/Coal-in-Europe/EURACOAL-Coal-in-Europe-2010.pdf (accessed on 24 August 2021).
- DEI. Public Power Corporation. 2018. Available online: https://www.eurofound.europa.eu/observatories/emcc/erm/factsheets/public-power-corporation-dei-1 (accessed on 1 September 2021).
- Alfstad, T. Development of a Least Cost Energy Supply Model for the SADC Region; University of Cape Town: Cape Town, South Africa, 2005. [Google Scholar]
- Nakicenovic, N. World Energy Outlook 2007: China and India Insights. 2007. Available online: http://pure.iiasa.ac.at/id/eprint/12557/ (accessed on 30 July 2018).
- P.P.; Hellenic Ministry for the Environment. National Allocation Plan for the Period 2008–2012. 2006. Available online: https://ec.europa.eu/clima/sites/clima/files/ets/pre2013/nap/docs/greece_en.pdf (accessed on 30 July 2018).
- Papakonstantinou, D. PPC Business Plan 2009–2014 in Greek-Albanian Cooperation in the Energy Sector. Tirana, Albania. 2009. Available online: https://www.iene.gr/albaniaconference/articlefiles/session2/electricity/papakonstantinou.pdf (accessed on 20 September 2021).
Figure 1.
Energy mix in Greece and EU28 for 2015.
Figure 1.
Energy mix in Greece and EU28 for 2015.
Figure 2.
Percentage breakdown of installed power capacity in Greece by energy source, in 2009.
Figure 2.
Percentage breakdown of installed power capacity in Greece by energy source, in 2009.
Figure 3.
Sources of large scale energy capacity (MW) installed in Greece, as of June 2020 **.
Figure 3.
Sources of large scale energy capacity (MW) installed in Greece, as of June 2020 **.
Figure 4.
Percentage breakdown of electricity consumption in Greece by energy source, in 2009.
Figure 4.
Percentage breakdown of electricity consumption in Greece by energy source, in 2009.
Figure 5.
Sources of net energy production in Greece between January and June 2020 ** (in gigawatt hours).
Figure 5.
Sources of net energy production in Greece between January and June 2020 ** (in gigawatt hours).
Figure 6.
Distribution of installed energy capacity in Greece as of June 2020, by source ** (in megawatts).
Figure 6.
Distribution of installed energy capacity in Greece as of June 2020, by source ** (in megawatts).
Figure 7.
Wind capacity per region in Greece (2019).
Figure 7.
Wind capacity per region in Greece (2019).
Figure 8.
Spatial distribution of wind capacity in Greece (2020) [
30].
Figure 8.
Spatial distribution of wind capacity in Greece (2020) [
30].
Figure 9.
Geothermal fields and areas of geothermal interest in Greece. (This map has been compiled by I.G.M.E.—Division of Geothermal Energy and Thermal Mineral Waters).
Figure 9.
Geothermal fields and areas of geothermal interest in Greece. (This map has been compiled by I.G.M.E.—Division of Geothermal Energy and Thermal Mineral Waters).
Figure 10.
Geographical distribution of the main remaining lignite reserves in Greece.
Figure 10.
Geographical distribution of the main remaining lignite reserves in Greece.
Figure 11.
Coal map of Europe [
40].
Figure 11.
Coal map of Europe [
40].
Figure 12.
Estimated electricity demand according to the BAU scenario.
Figure 12.
Estimated electricity demand according to the BAU scenario.
Figure 13.
Electricity power generation by technology groups according to the BAU scenario.
Figure 13.
Electricity power generation by technology groups according to the BAU scenario.
Figure 14.
Electricity generation by technology groups, according to scenario SC1.
Figure 14.
Electricity generation by technology groups, according to scenario SC1.
Figure 15.
Electricity generation by technology groups according to scenarios SC2 and SC3.
Figure 15.
Electricity generation by technology groups according to scenarios SC2 and SC3.
Table 1.
Electricity consumption and generation analysis in Greece, in 2009.
Table 1.
Electricity consumption and generation analysis in Greece, in 2009.
| | Total Electricity Consumption (GWh) | Total Electricity Consumption (GWh) by Source | Electricity Consumption Fuel Source |
|---|
| | Net produced (GWh) | Imported (GWh) | Net (with imports) consumption interconnected (GWh) | |
| | 50,137 | 9057 | 48,455 | |
| Lignite | 30,542 (51.6%) | | | 30,542 (63%) | Domestic |
| Natural gas | 7764 (13.1%) | | | 9377 (18%) | Imported |
| Oil | 6629 (11.2%) | | | 1697 (3.5%) | Imported |
| RES (+ hydro) | | | | 1884 (3.9%) | Domestic |
| Hydro | 5202 (8.8%) | | | 4955 (10.2%) | Domestic |
| PPC imports | | 2774 (4.7%) | | 4368 (8%) | Imported |
| Energy purchases | | | 6283 (10.6%) | | Imported |
| Total | 59,194 | 52,823 | |
| Electricity sold to consumers | 53,000 | | |
Table 2.
Maximum availability of energy import and connection points.
Table 2.
Maximum availability of energy import and connection points.
| Counterpart Country | Capacity in
2008 (MW) | Capacity in
2009 (MW) |
|---|
| Bulgaria | 275 | 350 |
| FYROM/North Macedonia | 100 | 75 |
| Albania | 100 | 250 |
| Italy | 250 | 250 |
| Total | 725 | 925 |
Table 3.
Main characteristics of existing large, small, and mini hydropower plants in Greece.
Table 3.
Main characteristics of existing large, small, and mini hydropower plants in Greece.
| Large Hydroplants (LHP) in Greece | Small Hydroplants (SHP) in Greece | Mini Hydroplants in Greece |
|---|
| Location | Start-up time | Power (MW) | Turbine # | Head mH2O | Capacity factor | Location | Property | Power (MW) | Location | Property | Power (MW) |
| Agras | 1954 | 50 | 2 | 158 | 0.045 | Vermio I | PPC | 1.8 | Xerias, Kavala | Municipality | 0.938 |
| Asomata | 1985 | 108 | 2 | 38.7 | 0.14 | Giona, Fokida | PPC | 8.5 | Piges Goura, Ioannina | Private | 0.930 |
| Piges Aoou | 1990 | 210 | 2 | 652 | 0.085 | Patra, Glafkos | PPC | 3.6 | Gioura-Anatolikis, Ioannnina | Private | 0.700 |
| Edeseos | 1969 | 19 | 1 | 120 | 0.105 | Stratos II | PPC | 6.0 | Gioura-Peristeri, Ioannina | Private | 0.990 |
| Thisavros | 1997 | 300 (rev) | 3 | 160 | 0.15 | Tsivlos, Akrata | Private | 2.82 | Piges Klifki, Ioannina | Municipality | 0.100 |
| Kastraki | 1969 | 320 | 4 | 76 | 0.25 | Agia Marina, Lakonia | Private | 1.0 | Vatsounia-2, Karditsa | Private | 0.600 |
| Kremastra | 1966 | 437.2 | 4 | 124 | 0.25 | Klitoria, Achaia | Private | 1.3 | Rema Gonnon, Larissa | Private | 0.650 |
| Ladonas | 1955 | 70 | 2 | 239 | 0.36 | Makrochori, Veria | PPC | 10.8 | Rema Prodromo, Larissa | PPC | 0.995 |
| Plastiras | 1960 | 129.9 | 3 | 577 | 0.165 | Louros | PPC | 10.3 | Sarakinos, Volos | Municipality | 0.750 |
| Platanovrisi | 1999 | 100 | 22 | - | 0.165 | Keramitis, Achaia | Private | 2.6 | Arapitsas, Imathia | Private | 0.625 |
| Polifito | 1974 | 375 | 3 | 146.5 | 0.11 | Lambia, Ilia | Private | 1.47 | Sarantovrises, Imathia | Private | 0.570 |
| Pournari I | 1981 | 300 | 6 | 68 | 0.11 | KatarraktisArta | Private | 2.4 | Agios Ioannis, Imathia | PPC | 0.700 |
| Pournari II | 1985 | 36.5 | 2 | - | 0.13 | Ano Goura, Arta | Private | 3.9 | Limnes Panagitisis-1, Pella | Private | 0.500 |
| Stratos I | 1989 | 150 | 2 | 36 | 0.21 | NerotriviIoannina | Private | 1.94 | Limnes Panagitisis-2, Pella | Private | 0.60 |
| Sfikia | 1985 | 315 (rev) | 3 | 58.5 | 0.15 | Kastaniotiko, Trikala | Private | 1.95 | Limnes Panagitisis-3, Pella | Private | 0.150 |
| | | | | | | Merlika Garefiou, Pella | Private | 1.83 | Arkoudorema, Pella | Private | 0.350 |
| | | | | | | Roufraktis, Serres | Private | 3.0 | Technites Limnes, Pella | Private | 0.560 |
| | | | | | | Moni Panagias, Serres | Private | 1.2 | Mpistritsa, Pella | Private | 0.220 |
| | | | | | | Inachos, Fthiotida | Private | 4.5 | Touplitsa, Pella | Private | 0.830 |
| | | | | | | Thermorema, Fthiotida | Private | 3.5 | Patinta, Pella | Private | 0.560 |
| | | | | | | Agioranitiko, Fokida | Private | 1.9 | Krasochoritiko, Serres | Private | 0.650 |
| | | | | | | | | | Agkistro, Serres | Municipality | 0.500 |
| | | | | | | | | | Kirfi, Viotia | Private | 0.760 |
| | | | | | | | | | Elikon, Viotia | Private | 0.650 |
| | | | | | | | | | Monastiraki, Evritania | Private | 0.980 |
| | | | | | | | | | Pougkakia, Fthiotida | Private | 0.850 |
| | | | | | | | | | Gorgopotamos, Fthiotida | Private | 0.155 |
| | | | | | | | | | Agia, Crete | PPC | 0.300 |
| | | | | | | | | | Almitos, Crete | PPC | 0.300 |
Table 4.
Thermal power stations in Greece and their operational characteristics (interconnected system).
Table 4.
Thermal power stations in Greece and their operational characteristics (interconnected system).
| Power Station | Location | Fuel | Id. Unit # | Year | Installed
Capacity | Output
Capacity | Operation
(h/y) | Availability
(%) | Efficiency
(%) | Lifespan | Comments |
|---|
| LIPTOL | Kozani | Lignite | 1-Phased out | 1959 | 10 | 8 | 1458 | 16.6 | 24.7 | [2010–2030] | (1) |
| Ptolemaida | Kozani | Lignite | 1-Operational | 1959 | 70 | 64 | 8202 | 93.6 | 26.1 | [2010–2030] | |
| Ptolemaida | Kozani | Lignite | 2-Operational | 1962 | 125 | 117 | 4843 | 55.3 | 26.1 | [2010–2030] | (2) |
| LIPTOL | Kozani | Lignite | 2-Operational | 1965 | 33 | 33 | 2807 | 32 | 24.7 | [2010–2030] | |
| Ptolemaida | Kozani | Lignite | 3-Operational | 1965 | 125 | 117 | 8161 | 93.2 | 30.3 | [2010–2030] | (1) |
| Megalopolis | Arkadia | Lignite | 1-Operational | 1970 | 125 | 113 | 7057 | 80.6 | 30.7 | [2010–2020] | |
| Megalopolis | Arkadia | Lignite | 2-Operational | 1970 | 125 | 113 | 8065 | 92.1 | 30.7 | [2010–2020] | |
| Ptolemaida | Kozani | Lignite | 4-Operational | 1973 | 300 | 276 | 6742 | 77 | 30.4 | [2010–2030] | (2) |
| Kardia | Kozani | Lignite | 1-Operational | 1974 | 300 | 275 | 8457 | 96.5 | 31.7 | [2010–2030] | (3) |
| Kardia | Kozani | Lignite | 2-Operational | 1975 | 300 | 275 | 7929 | 90.5 | 31.2 | [2010–2030] | |
| Megalopolis | Arkadia | Lignite | 3-Operational | 1975 | 300 | 270 | 7057 | 80.6 | 29.5 | [2010–2020] | |
| Kardia | Kozani | Lignite | 3-Operational | 1980 | 300 | 300 | 7268 | 83 | 32.7 | [2010–2030] | (1), (3) |
| Kardia | Kozani | Lignite | 4-Operational | 1981 | 300 | 275 | 6990 | 79.8 | 31.5 | [2010–2030] | (1), (3) |
| Agios Dimitrios | Kozani | Lignite | 1-Operational | 1984 | 300 | 274 | 8427 | 96.2 | 33.4 | [2020–2040] | (3) |
| Agios Dimitrios | Kozani | Lignite | 2-Operational | 1984 | 300 | 274 | 5845 | 66.7 | 33.7 | [2020–2040] | (3) |
| Agios Dimitrios | Kozani | Lignite | 3-Operational | 1985 | 310 | 283 | 8143 | 93 | 31.9 | [2020–2040] | (1), (3) |
| Agios Dimitrios | Kozani | Lignite | 4-Operational | 1986 | 310 | 283 | 7689 | 87.8 | 32.4 | [2020–2040] | (1), (3) |
| Amyndeon | Florina | Lignite | 1-Operational | 1987 | 300 | 273 | 7227 | 82.5 | 31.9 | [2020–2040] | (1) |
| Amyndeon | Florina | Lignite | 2-Operational | 1987 | 300 | 273 | 8094 | 92.4 | 32.8 | [2020–2040] | (1) |
| Megalopolis | Arkadia | Lignite | 4-Operational | 1992 | 300 | 260 | 7783 | 88.8 | 30.4 | [2020–2040] | (4) |
| Agios Dimitrios | Kozani | Lignite | 5-Operational | 1997 | 365 | 333 | 1602 | 18.3 | 36.0 | [2030–2050] | (5) |
| Meliti | Florina | Ligniten(Xylite type) | 1-Operational | 2003 | 300 | 273 | N/A | N/A | N/A | [2030–2050] | |
| Aliveri | Attica | Lignite | 3-Operational | | | 144 | N/A | N/A | N/A | | |
| Aliveri | Attica | Lignite | 4-Operational | | | 145 | N/A | N/A | N/A | | |
| Lavrio | Attica | Natural gas | 1-Operational | | 145 | | | | | | |
| Lavrio | Attica | Mazut | 2-Operational | | 285 | | | | | | |
| Lavrio | Attica | Mazut | 3-Operational | 1998 (1997) | 173 | | | | | | (6) |
| Lavrio | Attica | Natural gas | 4-Operational | 1999 | 560 | | | | 50.79 | | (7) |
| Lavrio | Attica | Natural gas | 5-Operational | 2005 (2006) | 385 | | | | 55.52 | | |
| Agios Georgios | Kozani | Natural gas | 8-Operational | 1997 (2000) | | 153 | | | 34–35 | | (8) |
| Agios Georgios | Kozani | Natural gas | 9-Operational | 1998 (2000) | | 185 | | | 34–35 | | (8) |
Table 5.
Assumption of prices.
Table 5.
Assumption of prices.
| | 2005
(€/TJ) | 2010
(€/TJ) | 2015
(€/TJ) | 2030
(€/TJ) | 2050
(€/TJ) |
|---|
| Electricity | 11,111 | 11,574 | 12,037 | 13,426 | 15,278 |
| Coal (bituminous) | 1400 | 1339 | 1243 | 1249 | 1249 |
| Natural gas | 4830 | 4361 | 3955 | 3966 | 3966 |
| Lignite | 1104 | 1104 | 1104 | 1104 | 1104 |
Table 6.
Future thermal power stations (interconnected system) in Greece [
42].
Table 6.
Future thermal power stations (interconnected system) in Greece [
42].
| Units | Fuel | Goal Year | Installed Capacity (MW) | Company |
|---|
| FUTURE NEW LICENCED POWER PLANTS BY PPC WITH CCS (CAPTURE READY) |
| Aliveri V | Natural gas | 2011–2012 | 417 | PPC |
| Megalopolis V | Natural gas | 2012–2013 | 800 | PPC-METKA |
| Florina II | Lignite | 2013 | 450 | PPC |
| Ptolemaida V | Lignite | 2014–2017 | 600 | PPC |
| Ag.Dimitrios VI | Lignite | 2025 | 600 | PPC |
| Total 2010–2024 | | | 2787 (2127) | |
| POSSIBLE FUTURE NEW POWER PLANTS BY PPC—WITH CCS? |
| Aliveri VI | Hard-coal—imported | 2014 | 700–800 | PPC |
| Larimna I | Hard-coal—imported | 2015 | 550–650, 700–800 | PPC |
| Kozani (region) I | Lignite | N/A | 250–400 | PPC |
| Crete I | Natural gas | N/A | 250 | PPC |
| Crete II | Oil | N/A | 250 | PPC |
| Total 2010–2024 | | | 2100 (2500) | |
| PRESENT PRIVATE POWER PLANTS—NO CCS YET |
| Thiva | Natural gas (OCGT) | 2004 | 147 | TERNA |
| Thessaloniki | Natural gas | 2005 | 390 | Edison/HELPE |
| Ag. Nikolaos | CHP | 2008 | 334 | Mytilineos/Endesa |
| Total | | | 871 | |
| FUTURE NEW LICENCED POWER PLANTS BY PRIVATE COMPANIES—NO CCS |
| Ag. Nektarios | Natural gas (NGCC) | 2010 | 425 | TERNA/Iron II |
| Korinthos | Natural gas (NGOC) | 2010 | 150 | Blue Aegean |
| Thisvi | Natural gas (NGCC) | 2011 | 421 | HELPE/Edison |
| Peloponnisos | Natural gas | 2011 | 396 | Korinthos Power |
| Ag. Nikolaos | Natural gas | 2011 | 412 | Endesa II |
| Livadia | Natural gas | 2011–2013 | 447 | Enel/Prometheus |
| Ag. Theodoroi | Natural gas | 2011–2012 | 437 | Motor Oil-Mytilineos |
| Volos | Natural gas | 2012 | 437 | Mytilineos/Endesa |
| Timothea | Natural gas (CCGT) | 2013 | 153 | EGL |
| Total 2010–2024 | | | 3278 | |
| FUTURE PLANNED NEW POWER PLANTS BY PRIVATE COMPANIES—NO CCS |
| Nea Karvali | Natural gas (CCGT) | TBC | 440 | Edison/HE&DPFI |
| Alexandroupolis | Natural gas (CCGT) | TBC | 440 | Enel/Prometheus |
| Elefsina | Natural gas (CCGT) | TBC | 880 | PPC/Halyvourgiki |
| Mantoudi | Coal | TBC | 840 | TERNA |
| Domokos | Natural gas | TBC | 830 | TERNA |
| Amyndeon | Lignite | TBC | 460 | TERNA |
| Ag. Nektarios | Natural gas | TBC | 450 | TERNA |
| Ag. Theodoroi | Natural gas | TBC | 440 | Motor Oil-Mytilineos |
Table 7.
Installed capacity in the future.
Table 7.
Installed capacity in the future.
| | 2010
(MW) | 2011
(MW) | 2012
(MW) | 2013
(MW) | 2014
(MW) | 2015
(MW) | 2016
(MW) | 2017
(MW) | 2018
(MW) | 2019
(MW) | 2020
(MW) |
|---|
| Wind | 1042 | 1694 | 2346 | 2999 | 3651 | 4303 | 4942 | 5582 | 6221 | 6861 | 7500 |
| PV | 184 | 401 | 618 | 836 | 1053 | 1270 | 1529 | 1789 | 2048 | 2308 | 2567 |
| Biomass | 60 | 72 | 84 | 96 | 108 | 120 | 146 | 172 | 198 | 224 | 250 |
| Geo | 0 | 4 | 8 | 12 | 16 | 20 | 40 | 60 | 80 | 100 | 120 |
| Hydro | 3237 | 3313 | 3388 | 3464 | 3539 | 3615 | 3798 | 3981 | 4165 | 4348 | 4531 |
| Others | 0 | 539 | 1078 | 1617 | 2156 | 2695 | 3067 | 3439 | 3811 | 4183 | 4555 |
Table 8.
Price evolution for taxes and permits (€/Mg).
Table 8.
Price evolution for taxes and permits (€/Mg).
| | | SC1 | SC2 | SC3 |
|---|
| 2005–2007 | Tax | 0 | 0 | 0 |
| Permits | n.a | n.a. | n.a. |
| 2008–2012 | Tax | 0 | 0 | 0 |
| Permits | 20 | 20 | 20 |
| 2013–2019 | Tax | 20 | 20 | 20 |
| Permits | 20 | 20 | 20 |
| 2020–2029 | Tax | 20 | 50 | 50 |
| Permits | 20 | 50 | 50 |
| 2030–2050 | Tax | 20 | 50 | 80 |
| Permits | 20 | 50 | 80 |
| Publisher’s Note: MDPI stays neutral with regard to jurisdictional claims in published maps and institutional affiliations. |
© 2021 by the authors. Licensee MDPI, Basel, Switzerland. This article is an open access article distributed under the terms and conditions of the Creative Commons Attribution (CC BY) license (https://creativecommons.org/licenses/by/4.0/).


 ,
, 


