Article

Multiscale Characterization of Isotropic Pyrolytic Carbon Used for Mechanical Heart Valve Production

by
Gianpaolo Serino
1,2,*,
Mattia Gusmini
1,2,
Alberto Luigi Audenino
1,2,
Giovanni Bergamasco
3,
Ornella Ieropoli
3 and
Cristina Bignardi
1,2
1
Department of Mechanical and Aerospace Engineering (DIMEAS), Politecnico di Torino, 10129 Turin, Italy
2
PolitoBIOMed Lab, Politecnico di Torino, 10129 Turin, Italy
3
LivaNova (Sorin Group Italia s.r.l.), 13040 Saluggia, Italy
*
Author to whom correspondence should be addressed.
Processes 2021, 9(2), 338; https://doi.org/10.3390/pr9020338
Submission received: 4 January 2021 / Revised: 4 February 2021 / Accepted: 9 February 2021 / Published: 12 February 2021
(This article belongs to the Section Biological Processes and Systems)

Abstract

:
Usage of pyrolytic carbon (PyC) to produce mechanical heart valves (MHVs) has led to heart valve replacement being a very successful procedure. Thus, the mechanical properties of employed materials for MHV production are fundamental to obtain the required characteristics of biocompatibility and wear resistance. In this study, two deposition methods of PyC were compared through a multiscale approach, performing three-point bending tests and nanoindentation tests. Adopted deposition processes produced materials that were slightly different. Significant differences were found at the characteristic scale lengths of the deposited layers. Setting changes of the deposition process permitted obtaining PyC characterized by a more uniform microstructure, conferring to the bulk material superior mechanical properties.

1. Introduction

Heart valve dysfunction affects the physiological working conditions of the heart, causing serious damage and heart failure. It is estimated in 2009 that, worldwide, 300,000 patients per year undergo heart valve replacement [1,2,3]. Moreover the percentage of valve replacement is expected to increase at a rate of 10–12% per year [4]. According to data found in the literature, 55% of total implanted valves are mechanical heart valves (MHVs). The remaining demand is covered for the 45% by the biological heart valves (BHVs), and 5% is fulfilled by autograft or homograft valves [5,6,7]. Even if BHVs can restore the blood flow into the heart, ensuring physiological hemodynamics, their working lives have a limited time span of 15/20 years [2,8]. Instead, the functionality of a MHV remains unchanged over time, more than the life span of the patient [8]. Although progressive improvements in MHV design made the replacement of native heart valves an efficient and successful surgical intervention [7,9], patients need anticoagulant therapy over their entire lifespans. Indeed, the risk of extreme bleeding cannot be underestimated [8].
Pyrolytic carbon (PyC), thanks to its hemocompatibility [10,11] and high mechanical properties [12,13,14], is the main material used for MHV fabrication. In late 1969, PyC was firstly used for the realization of an MHV component [9]. Since then, further studies were was conducted, and, in 1977, the implantation of the first MHV entirely fabricated with PyC took place [9]. PyC coating used for heart valve production is obtained through the steady state fluidized bed carbon deposition process [15,16,17], which takes place in a fluidized bed reactor [14,18]. PyC used for MHV production is highly isotropic and its microstructure is characterized by ultrafine grain [14]. However, proper wear resistance can be achieved by adding a small amount of silicon (10%) [13,17,19,20], obtaining what is known as alloyed PyC. In the following, authors use PyC to indicate alloyed PyC, and references to other types of PyC will be clearly declared. After the deposition process of PyC, due to the impossibility of real time monitoring of coating growth, a machinery procedure is required to obtain MHVs with proper shape and geometry [17]. Moreover, further surface treatment is necessary to achieve appropriate roughness values of the exposed surfaces, conferring the required thromboresistance characteristics to the device [21,22,23].
Mechanical characterization of the deposited and machined PyC played a crucial role in the development of MHV production and, even today, covers a crucial role. Furthermore, knowledge of the mechanical properties of the deposited material is fundamental for quality control purposes and to ensure a successful assembly procedure of MHVs [24]. Different types of tests and studies were carried out during the past 60 years in order to assess the mechanical properties of deposited PyC. Three-point bending tests were carried out to determine Young’s modulus, fracture stress, fracture strain, and fracture mode of tiny rectangular strips [25,26]. Prior to 1972, the fatigue behavior of PyC was unexplored [12], but its application for MHV production required a more detailed comprehension of the material response when subjected to cyclic stress conditions. Since then, there has been interest in studying the fatigue behavior of this material and several works were carried out [13,14,27].
Thanks to technological and theoretical advancements, the nanoindentation technique was increasingly applied to mechanical characterization of bulk materials and coating. Being able to measure force less than mN and displacement smaller than nm, the nanoindentation test permits obtaining information at a very local level [28,29]. Thus, a single layer of deposited PyC can be characterized [30,31], allowing a very precise identification of its mechanical properties. As found in the literature, studies on the mechanical properties of highly oriented PyC were carried out, combining the information obtained through nanoindentation tests and computational methods [32,33].
Mechanical properties of PyC (at macro and micro nanoscales) were extensively (but not exhaustively) studied, due to high sensibility regarding the setting parameters of the PyC deposition process [34]. The deposition process of PyC for the biomedical application is affected by several factors. Among them, those with the most impact are: temperature of the reaction, type of reactor, duration of exposure, type of hydrocarbon injected in the reactor chamber, type of inert gas, dimensions of the substrate being coated, and injection rate of gases [17,20]. Slightly changing one of these factors causes little alteration of the mechano–physical properties of the final product. Based on a previous study conducted by the LivaNova company (Sorin Group Italia s.r.l.), to decrease the number of rejected devices at the end of the manufacturing chain, modifying the coating rate during the deposition process permitted a more compact coating characterized by a reduced number of pores. Indeed, PyC microlayers were deposited on graphite substrates adopting two different deposition processes: the historical process and the modified process characterized by a reduced coating rate. To compare the quality of the PyC deposited through the two deposition processes, the mechanical properties were evaluated at the macro and micro scale.
To the authors’ knowledge, no studies were carried out adopting a multiscale mechanical characterization approach, on low temperature deposited PyC, varying the coating rate. Indeed, the focus of this work is to study PyC at the macro and micro scale in order to understand how the variation of coating rate impacts the mechanical properties of the deposited PyC layers.

2. Materials and Methods

2.1. Sample Preparation

Three types of orifices (components where the leaflets of the MHVs are housed), were prepared by LivaNova company (Sorin Group Italia s.r.l.) in a fluidized bed reactor. Gases inflated in the reactor were propane, methyltrichlorosilane, and nitrogen as inert gas. The temperature of the reactor was set at about 1300 °C. Graphite mandrel, i.e., the substrate adopted for the PyC deposition, was used to produce MHV orifices. Three different sizes: 21 mm, 25 mm, and 29 mm (corresponding to the external diameter of the orifice) were produced. PyC was deposited on the graphite substrates following two different deposition processes: the historical process and the modified process. The historical process is characterized by a constant coating rate of about 0.042 μm/s and a duration of about 8 h. The modified deposition process is characterized by a halved coating rate (0.021 μm/s) only during the first hour of deposition. The duration of the two processes were the same. Obtained specimens are summarized in Table 1.
MHV orifices were properly machined and polished to obtain the optimal surface characteristics needed to confer thromboresistance characteristics. After that, the orifices were cut along the centerline, eliminating the leaflet housing, in order to be tested through the three-point bending test procedure (Figure 1a).
Specimens that underwent to nanoindentation tests were embedded in epoxy resin and properly polished. To obtain the required surface roughness the samples were firstly coarse grinded using increasingly fine-grained grinding wheels. The last one was characterized by a grain size of 15 μm. The optimal roughness was obtained using a lapping cloth and a diamond paste of decreasing granulometry, from 6 μm to 1 μm (Figure 1b).

2.2. Three-Point Bending Test

To obtain the approval from the Food and Drug Administration (FDA), three-point bending tests were performed following the ASTM F 417–78.
The schematization of the experimental set-up is shown in Figure 2.
The set-up settings and the mean values of the dimensions, as reported in Figure 2, are summarized for all kinds of specimens in Table A1 and Table A2 of Appendix A.
A total of 78 specimens, 13 for each size and deposition process, were tested. The load P was continuously registered through a load cell placed above the loading roller.
Since sample geometry slight differs from the parallelepipedal one provided by the normative, the maximum flexural stress was calculated through the following relation [35]:
σMAX = (PMAX × tan(α)/2) × [1/A − (R/I) × yint],
where yint is the distance from the neutral axis of the cross section to the position of the fiber where the stresses are maximum. R is the curvature radius of the centerline of the specimen, A is the cross section, PMAX is the load registered before the specimen failure, I is the moment of inertia of the cross section, and α is the angle where the normal stress and the bending moment are maximum. The position of the neutral axis, considering the geometry of the samples, can be assumed coincident with the center of gravity of the transverse section.
The maximum stress, as reported in Equation (1), is the summation of two contributions: the normal stress and bending stress. Moreover, due to the geometry of the samples cross section and the large radius of curvature, the contribution of the normal stress can be neglected.
Young’s modulus was calculated by comparing the work done by the internal and external force that, as stated by the principle of the virtual work, must be equal. Indeed, neglecting the contribution of the normal stress, the following expression was derived:
E = (PMAX × R3/4δI) × [(α − sin(α)cos(α))/(cos2(α))],
where δ is the displacement registered in correspondence of the maximum load.

2.3. Nanoindentation Test

Indentation tests were performed with the Nanoindenter XP (MTS system Corporation, Eden Prairie, MN, USA), equipped with a modified Berkovich indenter, opportunely calibrated on a standard silica specimen. Thus, the area function of the indenter cross section was obtained through the standard procedure [36,37]. A fine calibration of the offset between the optical system, used to identify the indentation site, and the indentation column, was performed before every indentation matrix.
For each specimen, a matrix of 30 indentations (6 rows and 5 columns) was generated. Specifically, the indentations were performed normally to the direction of the PyC deposition. The matrix was built to characterize the inner layers obtained during the first hour of deposition and the outer layers obtained during the following hours. Such a matrix can be divided into two submatrices, as represented in Figure 3.
The first point of the indentation matrix was chosen 20 μm far from the interface between the graphite substrate and PyC. The indentation matrix was designed in such a way that the columns were perpendicular to the deposition layers. To do that, the indentation matrix was rotated at an opportune angle calculated, considering the radial direction of the deposition layers and the position of the specimen mounted in the sample try of the indenter.
Tests were performed in displacement control, setting the indentation depth to 800 nm. This value guarantees an indentation contact area large enough to reduce the uncertainty related to its calibration process, but sufficiently small to characterize only one layer.
The strain rate, for both the loading and unloading phase of the indentation process (Figure 4), was kept constant at 0.01 s−1. Before the onset of the unloading phase, the maximum load, reached in correspondence of the fixed maximum values of the indentation depth, was held for 30 s.
The holding time necessary to stabilize the viscous phenomena was precautionary set, even if the time dependent phenomena for this type of material are negligible. The Oliver and Pharr method [36] was applied to extrapolate the mechanical properties by the experimental curves, namely the nanoindentation modulus and the nanoindentation hardness.

2.4. Statistical Analysis

The outliers were discarded through the modified Thompson’s Tau method results. After the normality of data were checked, they were analyzed by using the analysis of variance (ANOVA). The statistical analysis of variance was carried out through the program MATLAB® (R2019b, The MathWorks Inc., Natick, MA, USA, 1994–2021) with a significance level of 5%.

3. Results

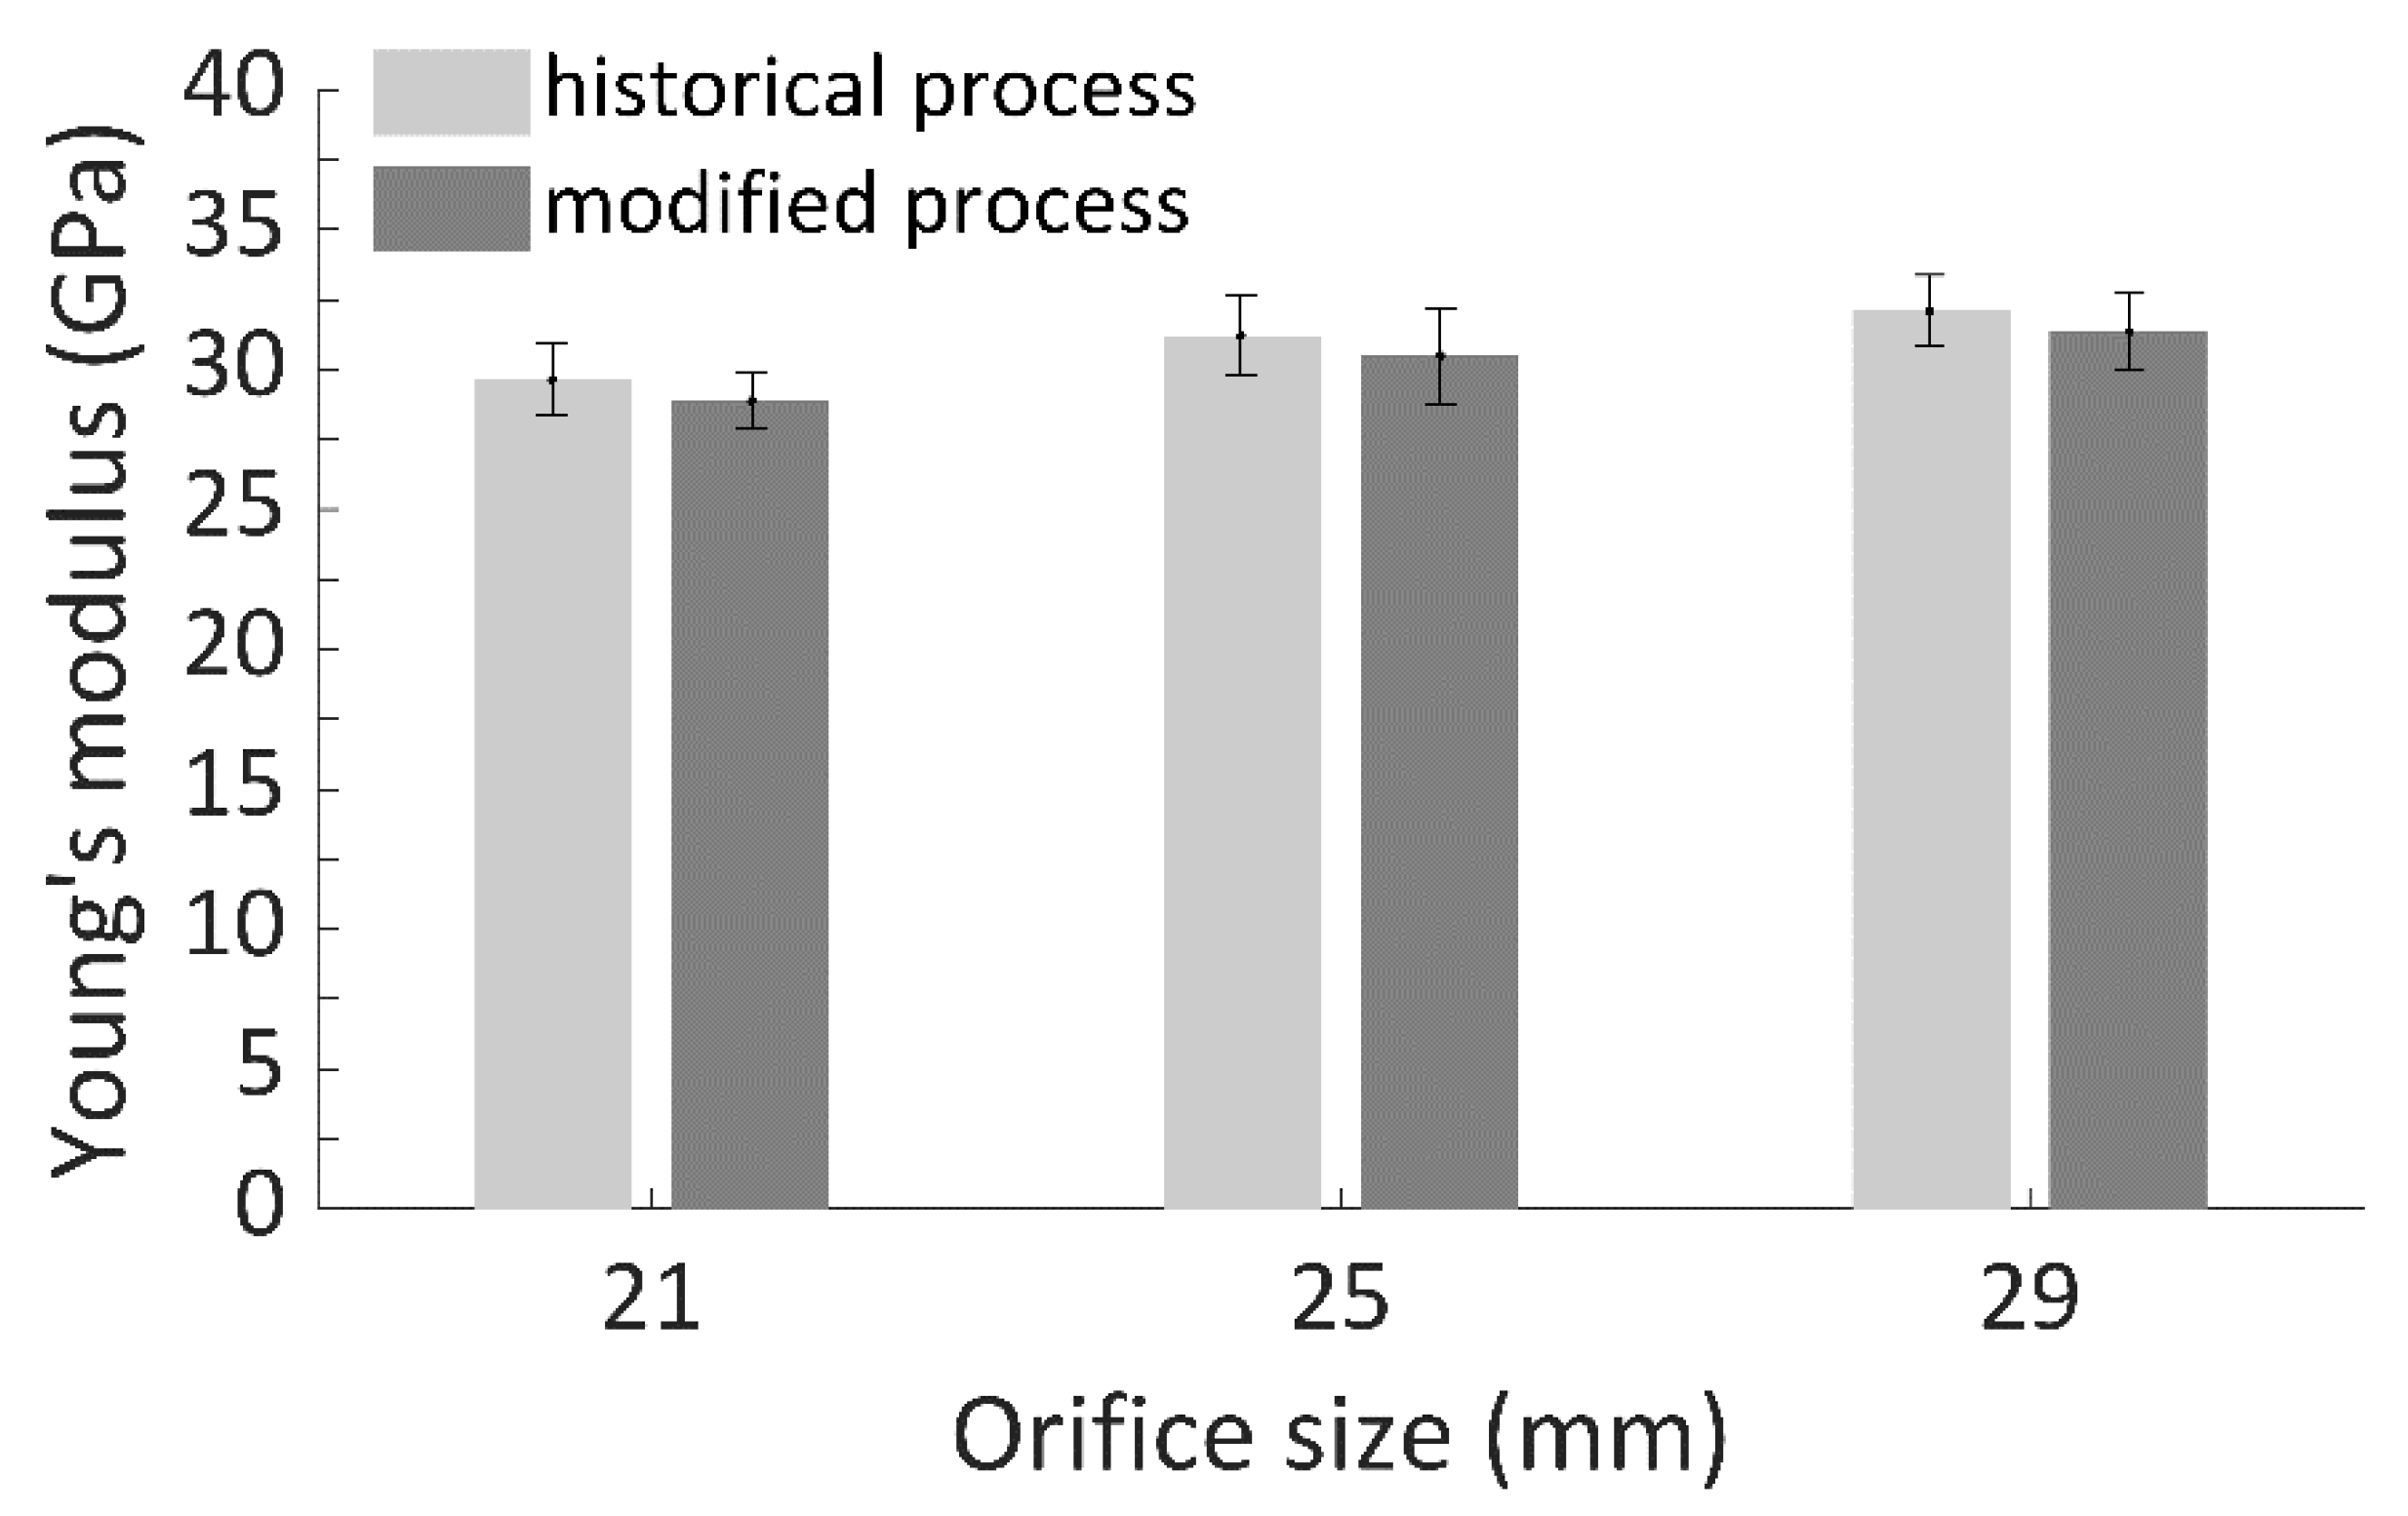
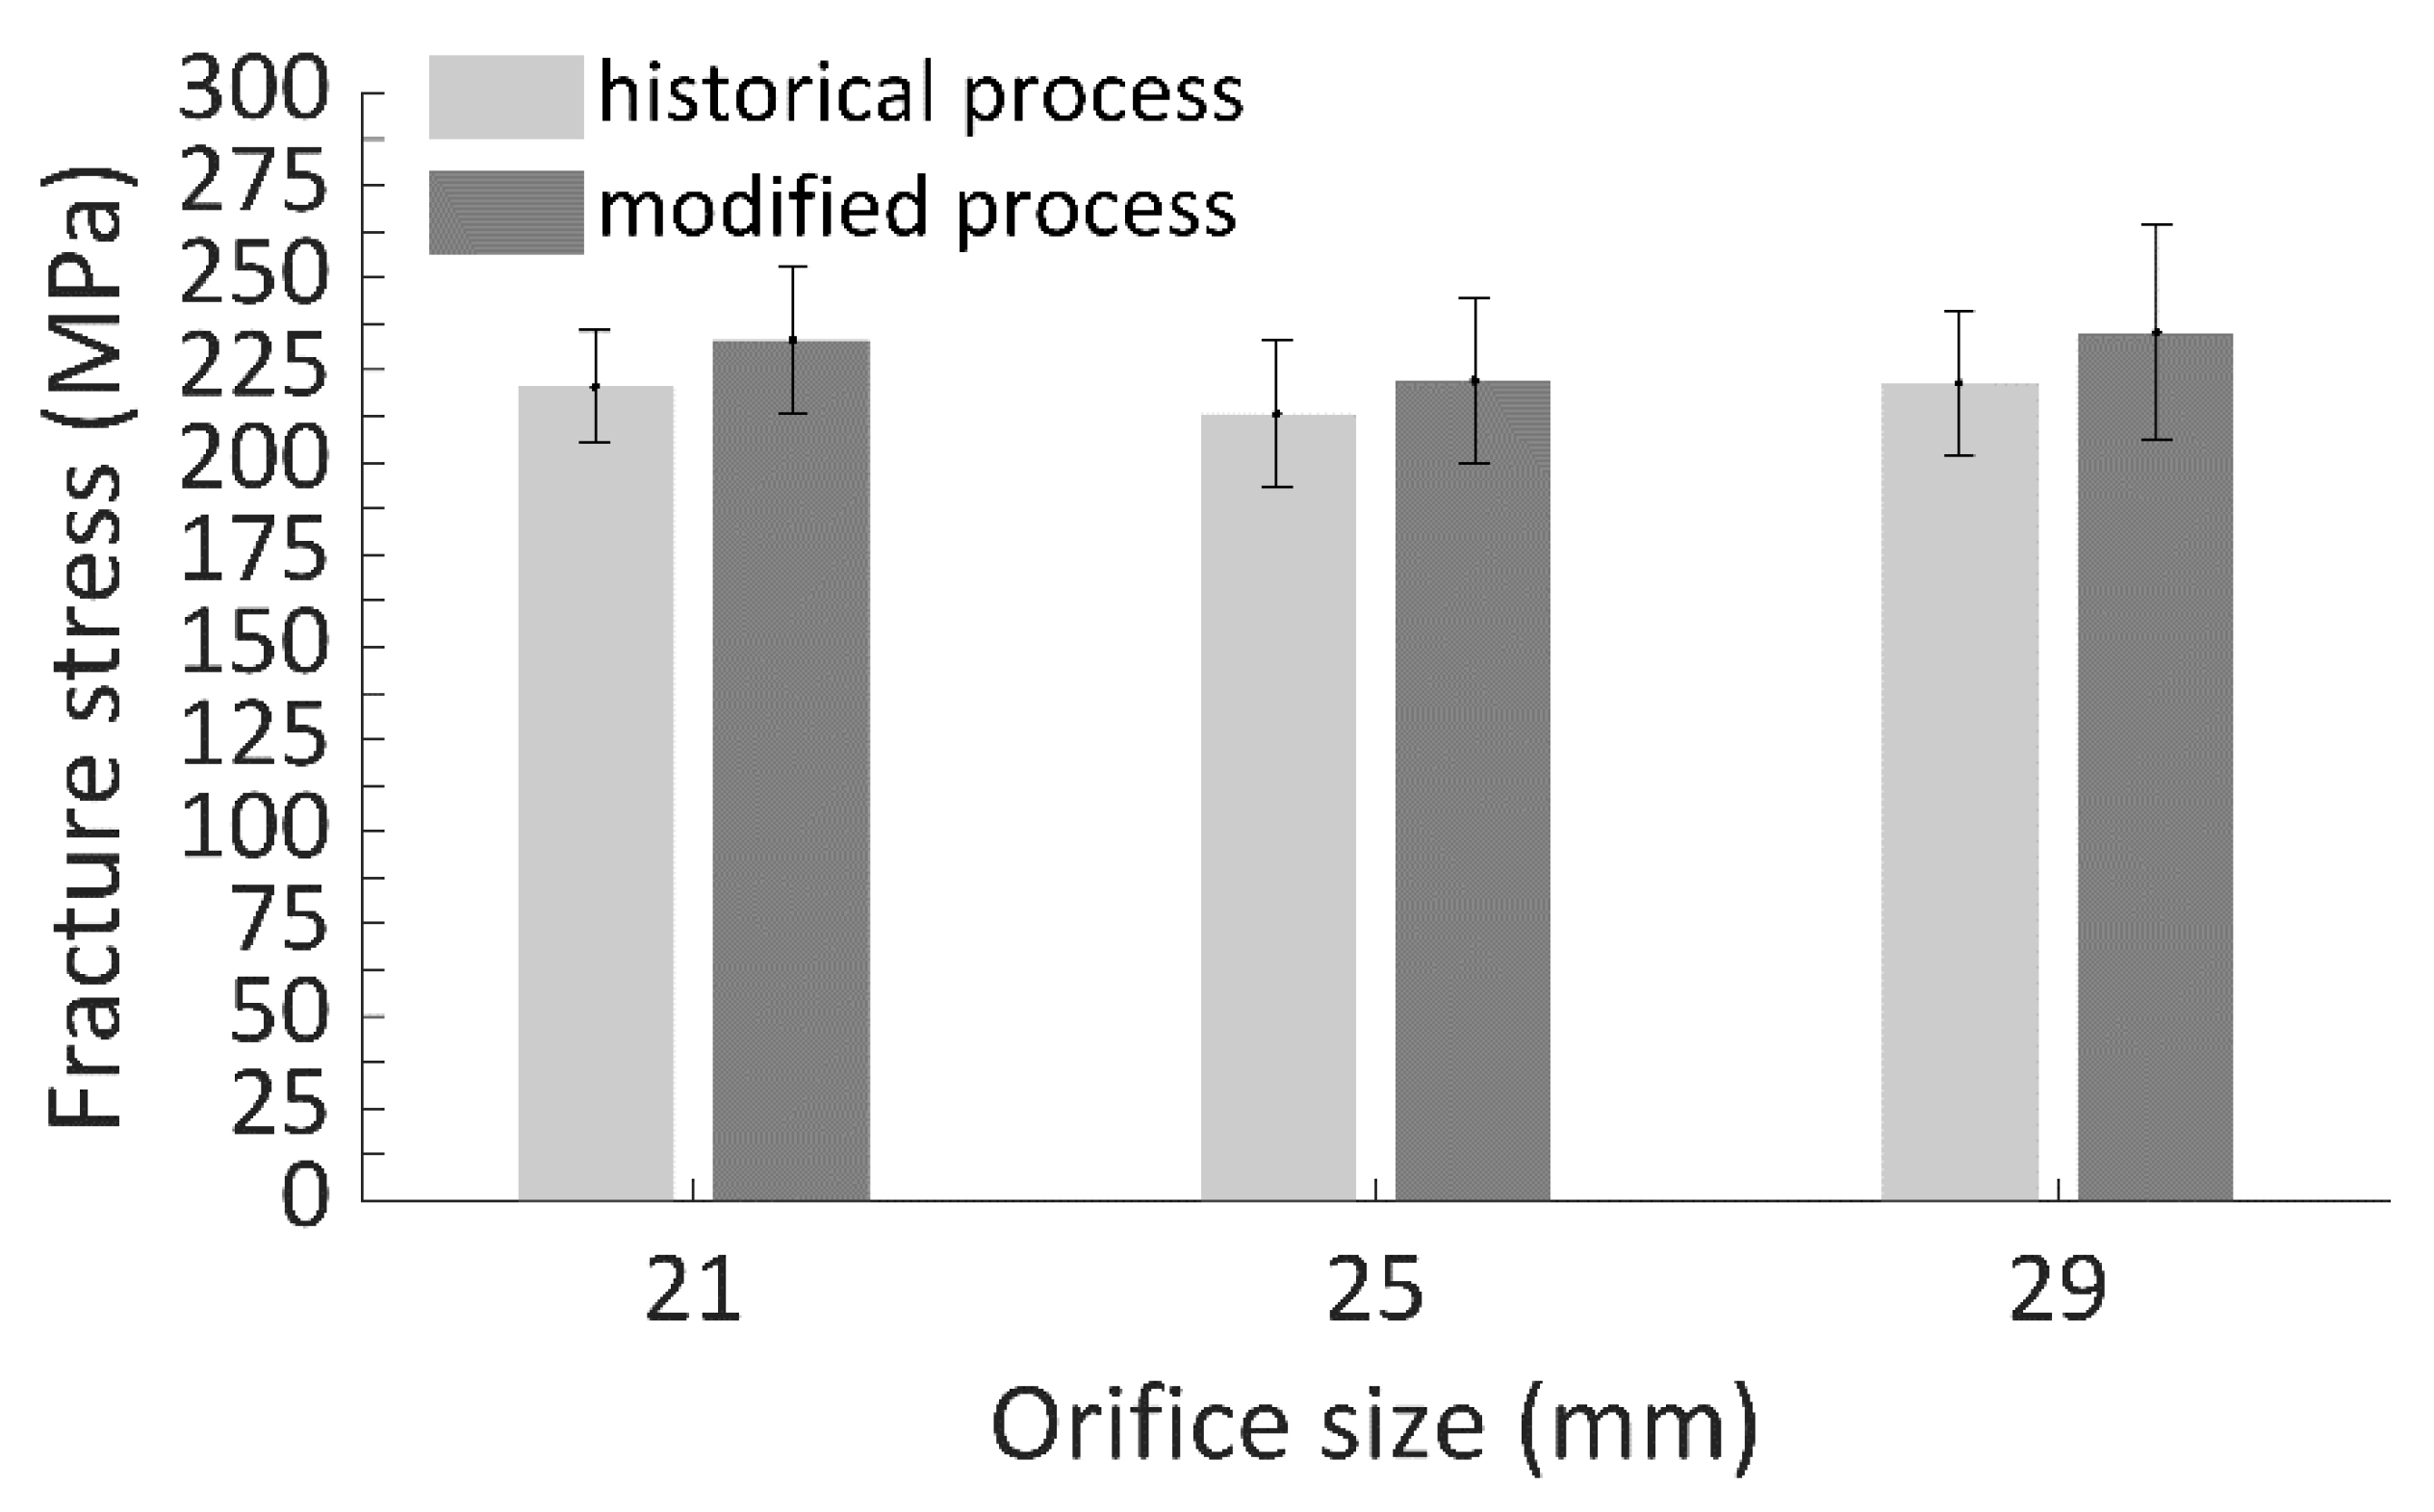
3.1. Three-Point Bending Test

Young’s modulus and fracture stress mean values obtained from three-point bending tests are shown in Figure 5 and Figure 6, respectively. The mean values of the maximum load (value of load before the failure of the specimens) and the corresponding displacement for the three sizes of the samples are reported in Table A3 and Table A4 of Appendix A.
Obtained mean values of the Young’s modulus are in accordance with those found in literature [13,25,26,38]. Instead, fracture stress values resulted in being slightly lower if compared with that found in literature [14,25,26,38]. The fact that the obtained fracture stress values are lower than that found in literature is probably due to the different geometry of the specimens. Samples here tested are the orifices of the MHVs characterized by the typical geometry of the depressed arch, which are different from the standard PyC sheets usually tested.
Statistical analysis has revealed no significant difference (p > 0.05) between the two deposition processes at the macroscopic level. Moreover, the mean values of the Young’s modulus obtained for PyC deposited through the modified deposition process resulted in a slight reduction, with respect to the modified process. On the contrary, for mean values of the fracture stress obtained by adopting the modified deposition process, an increase was registered, with respect to the values obtained through the historical one.

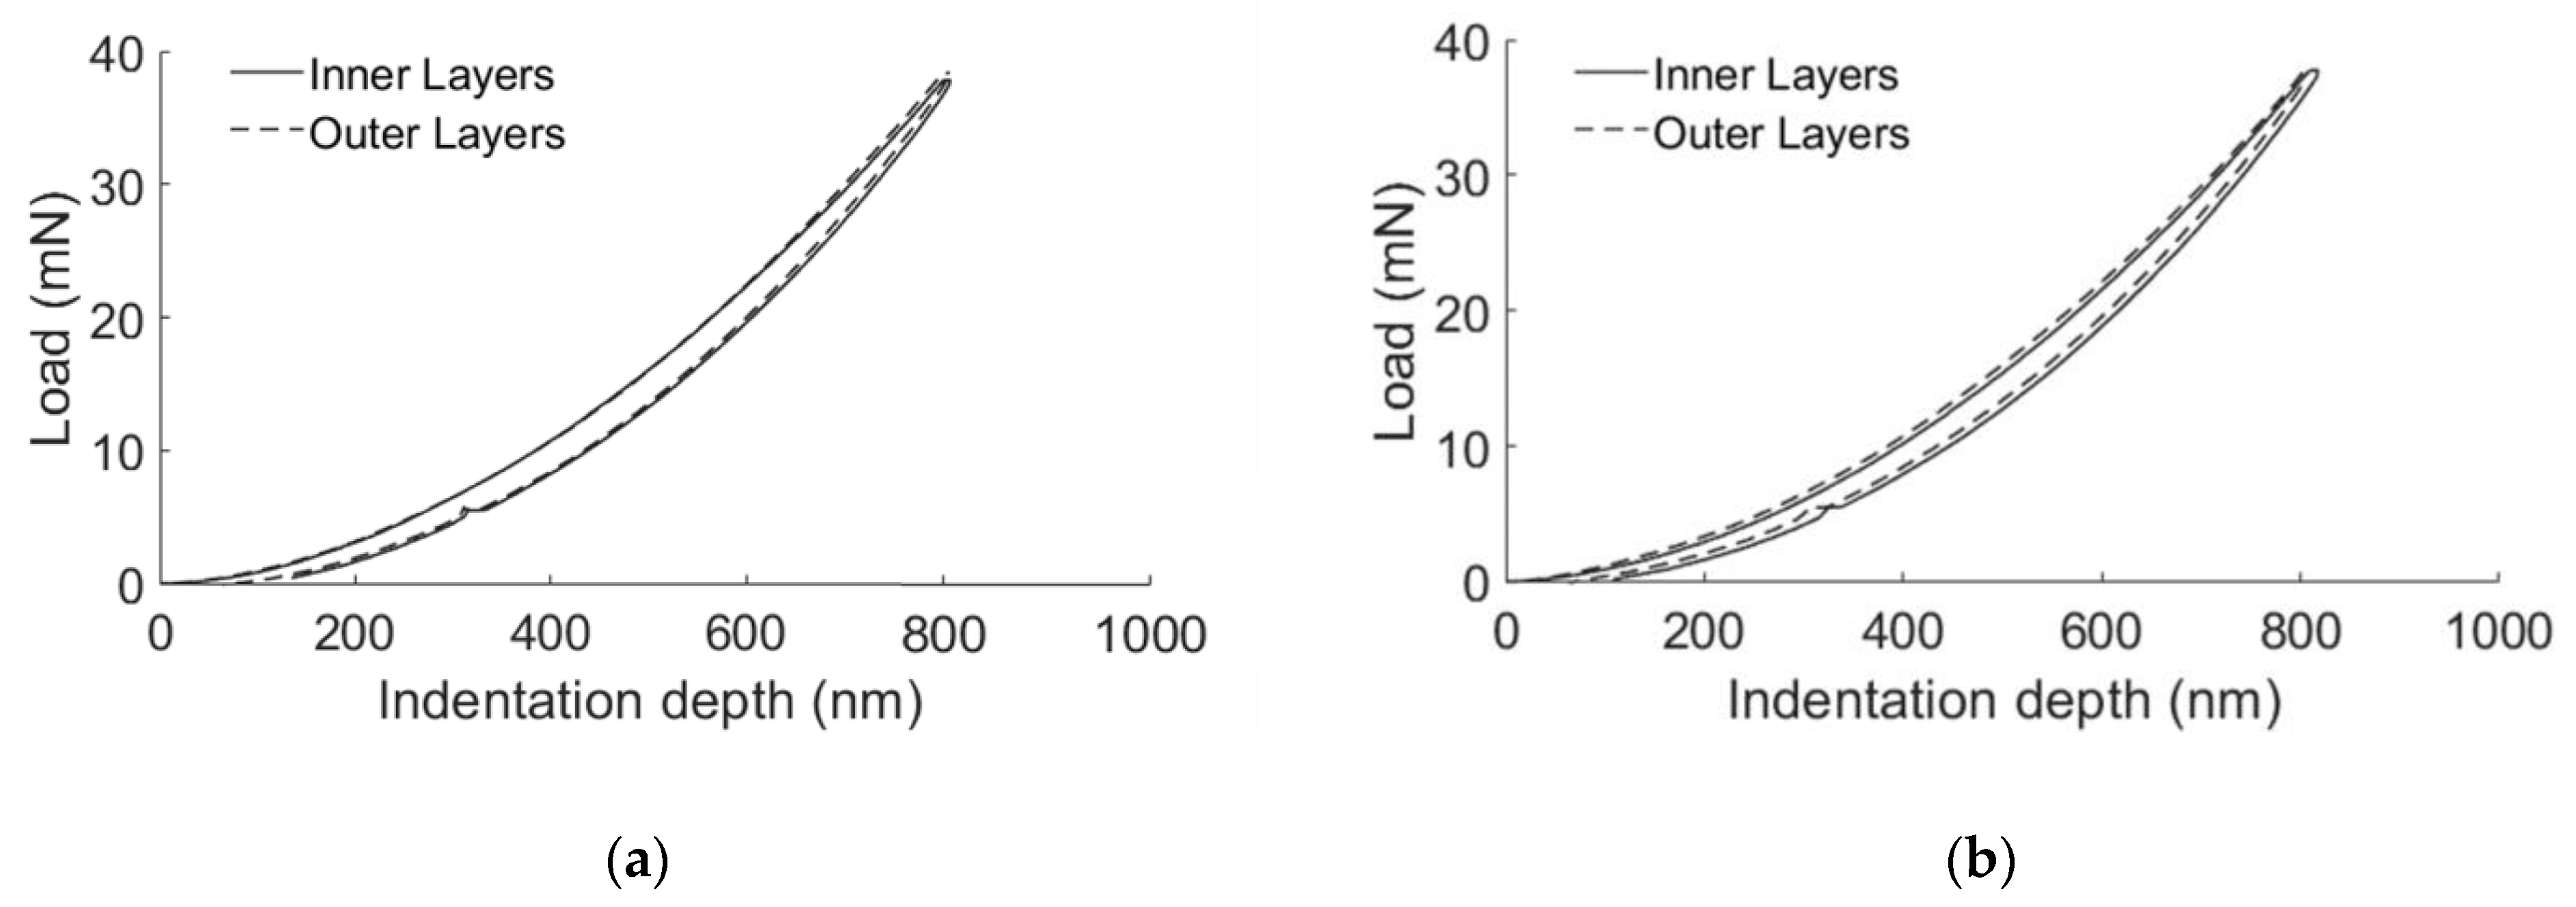
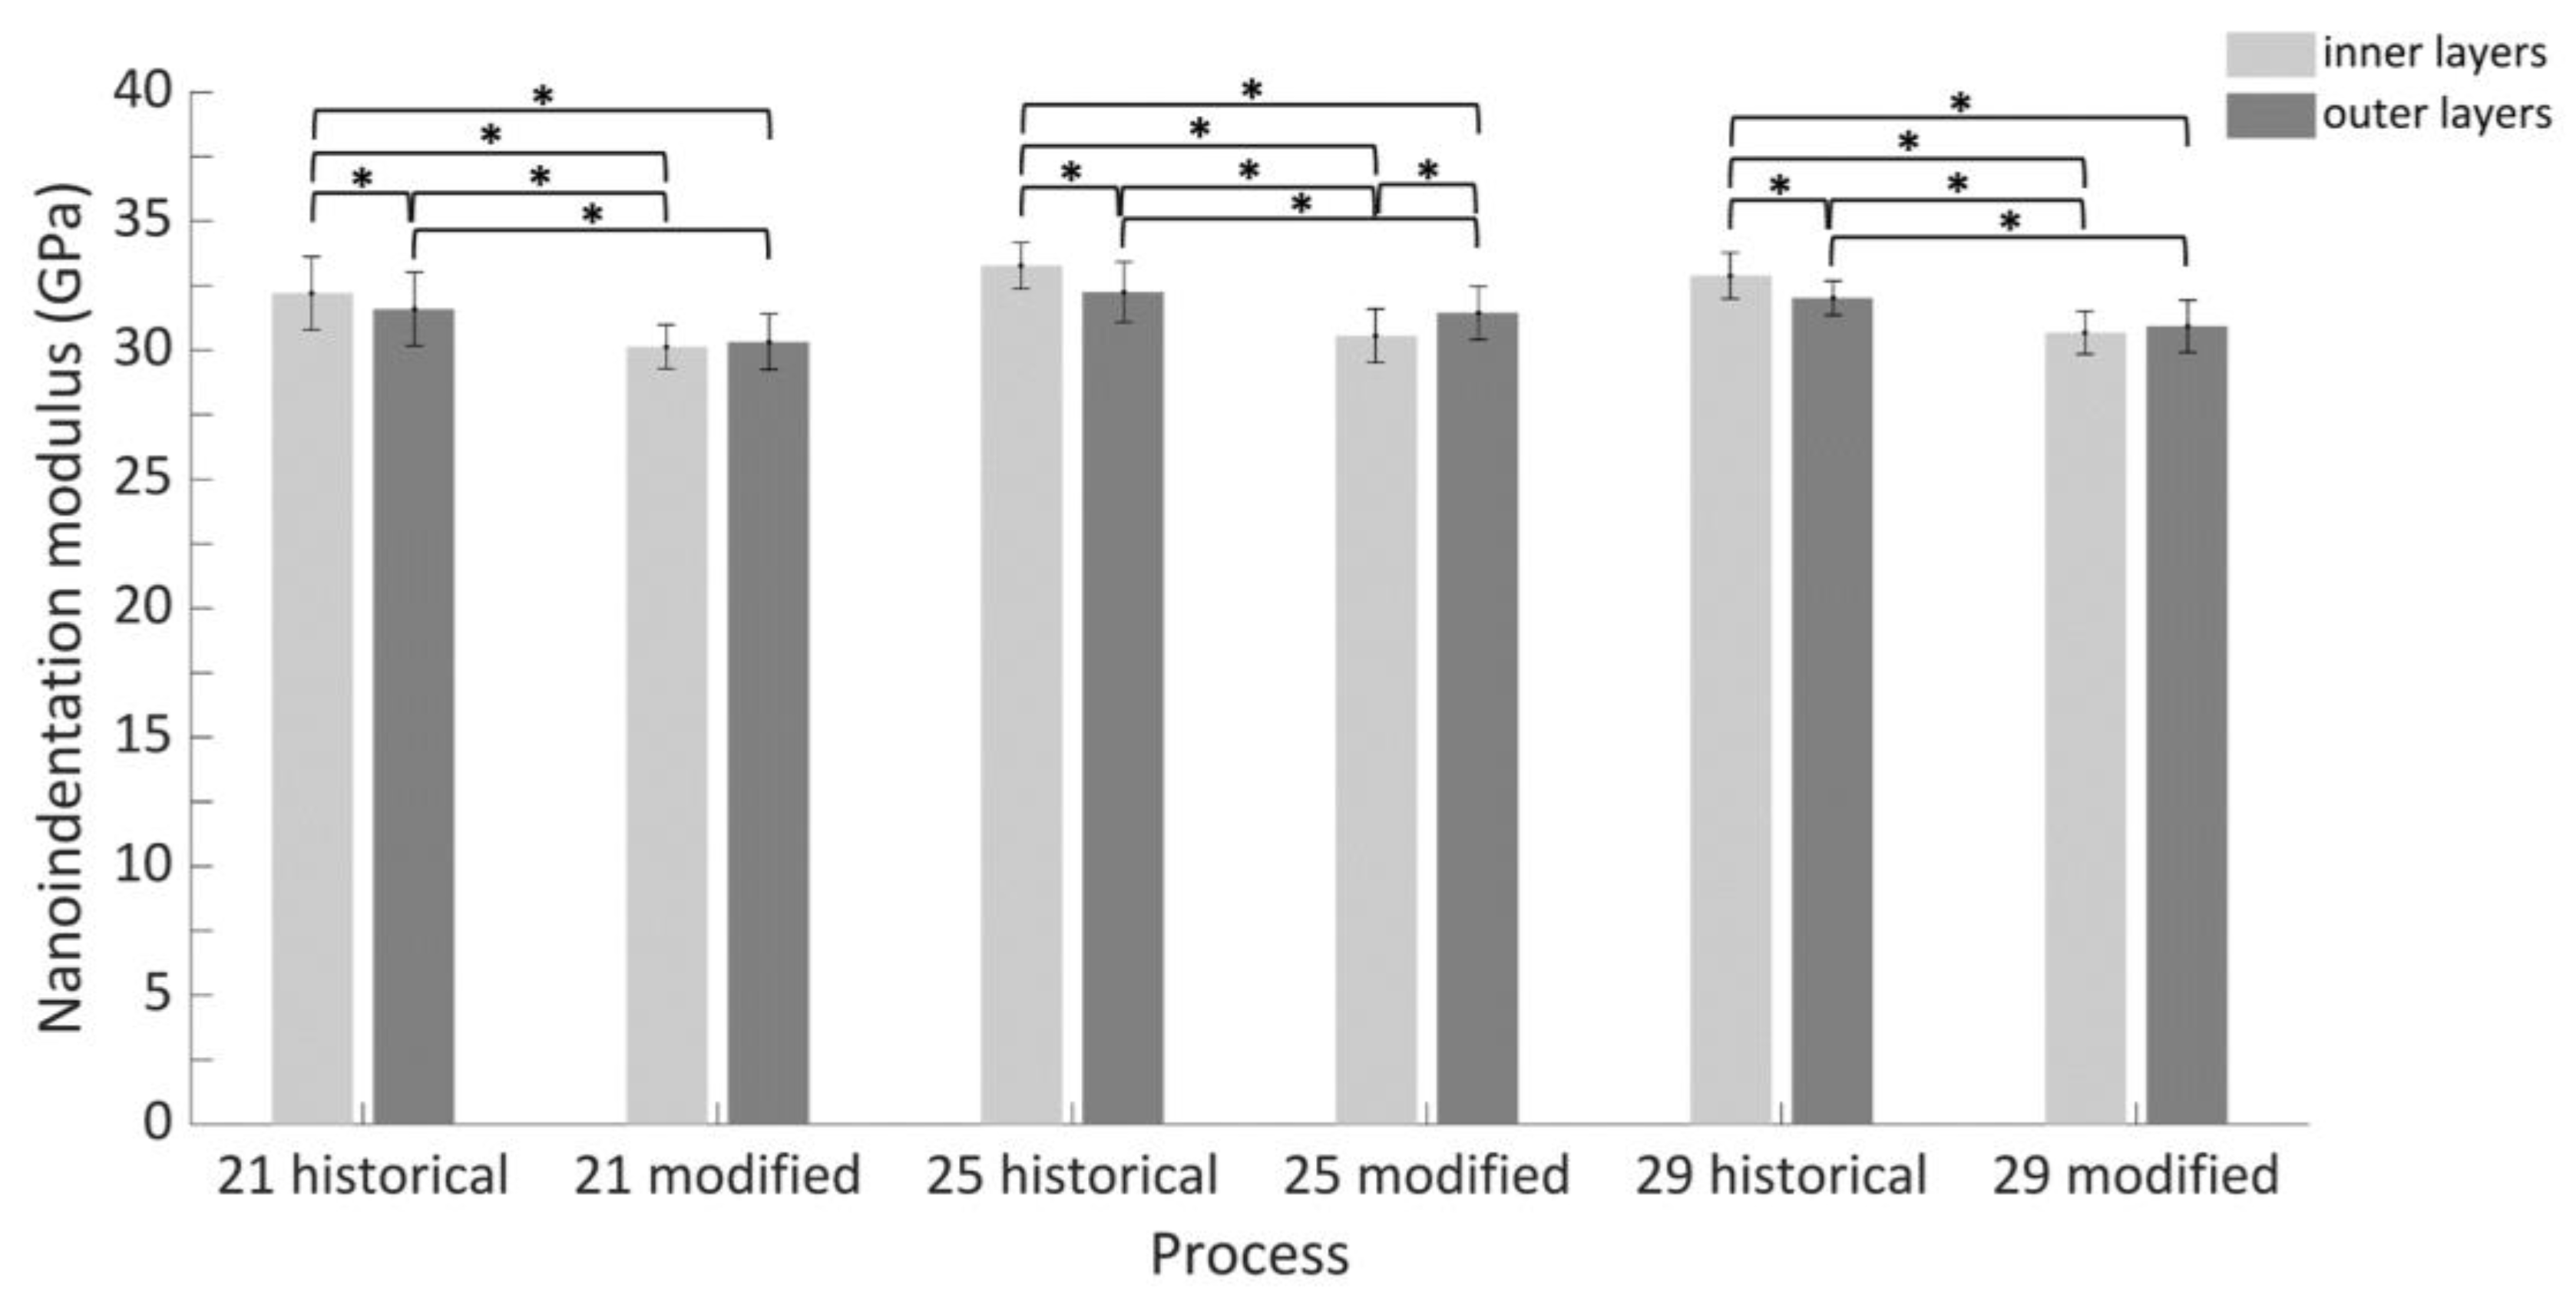
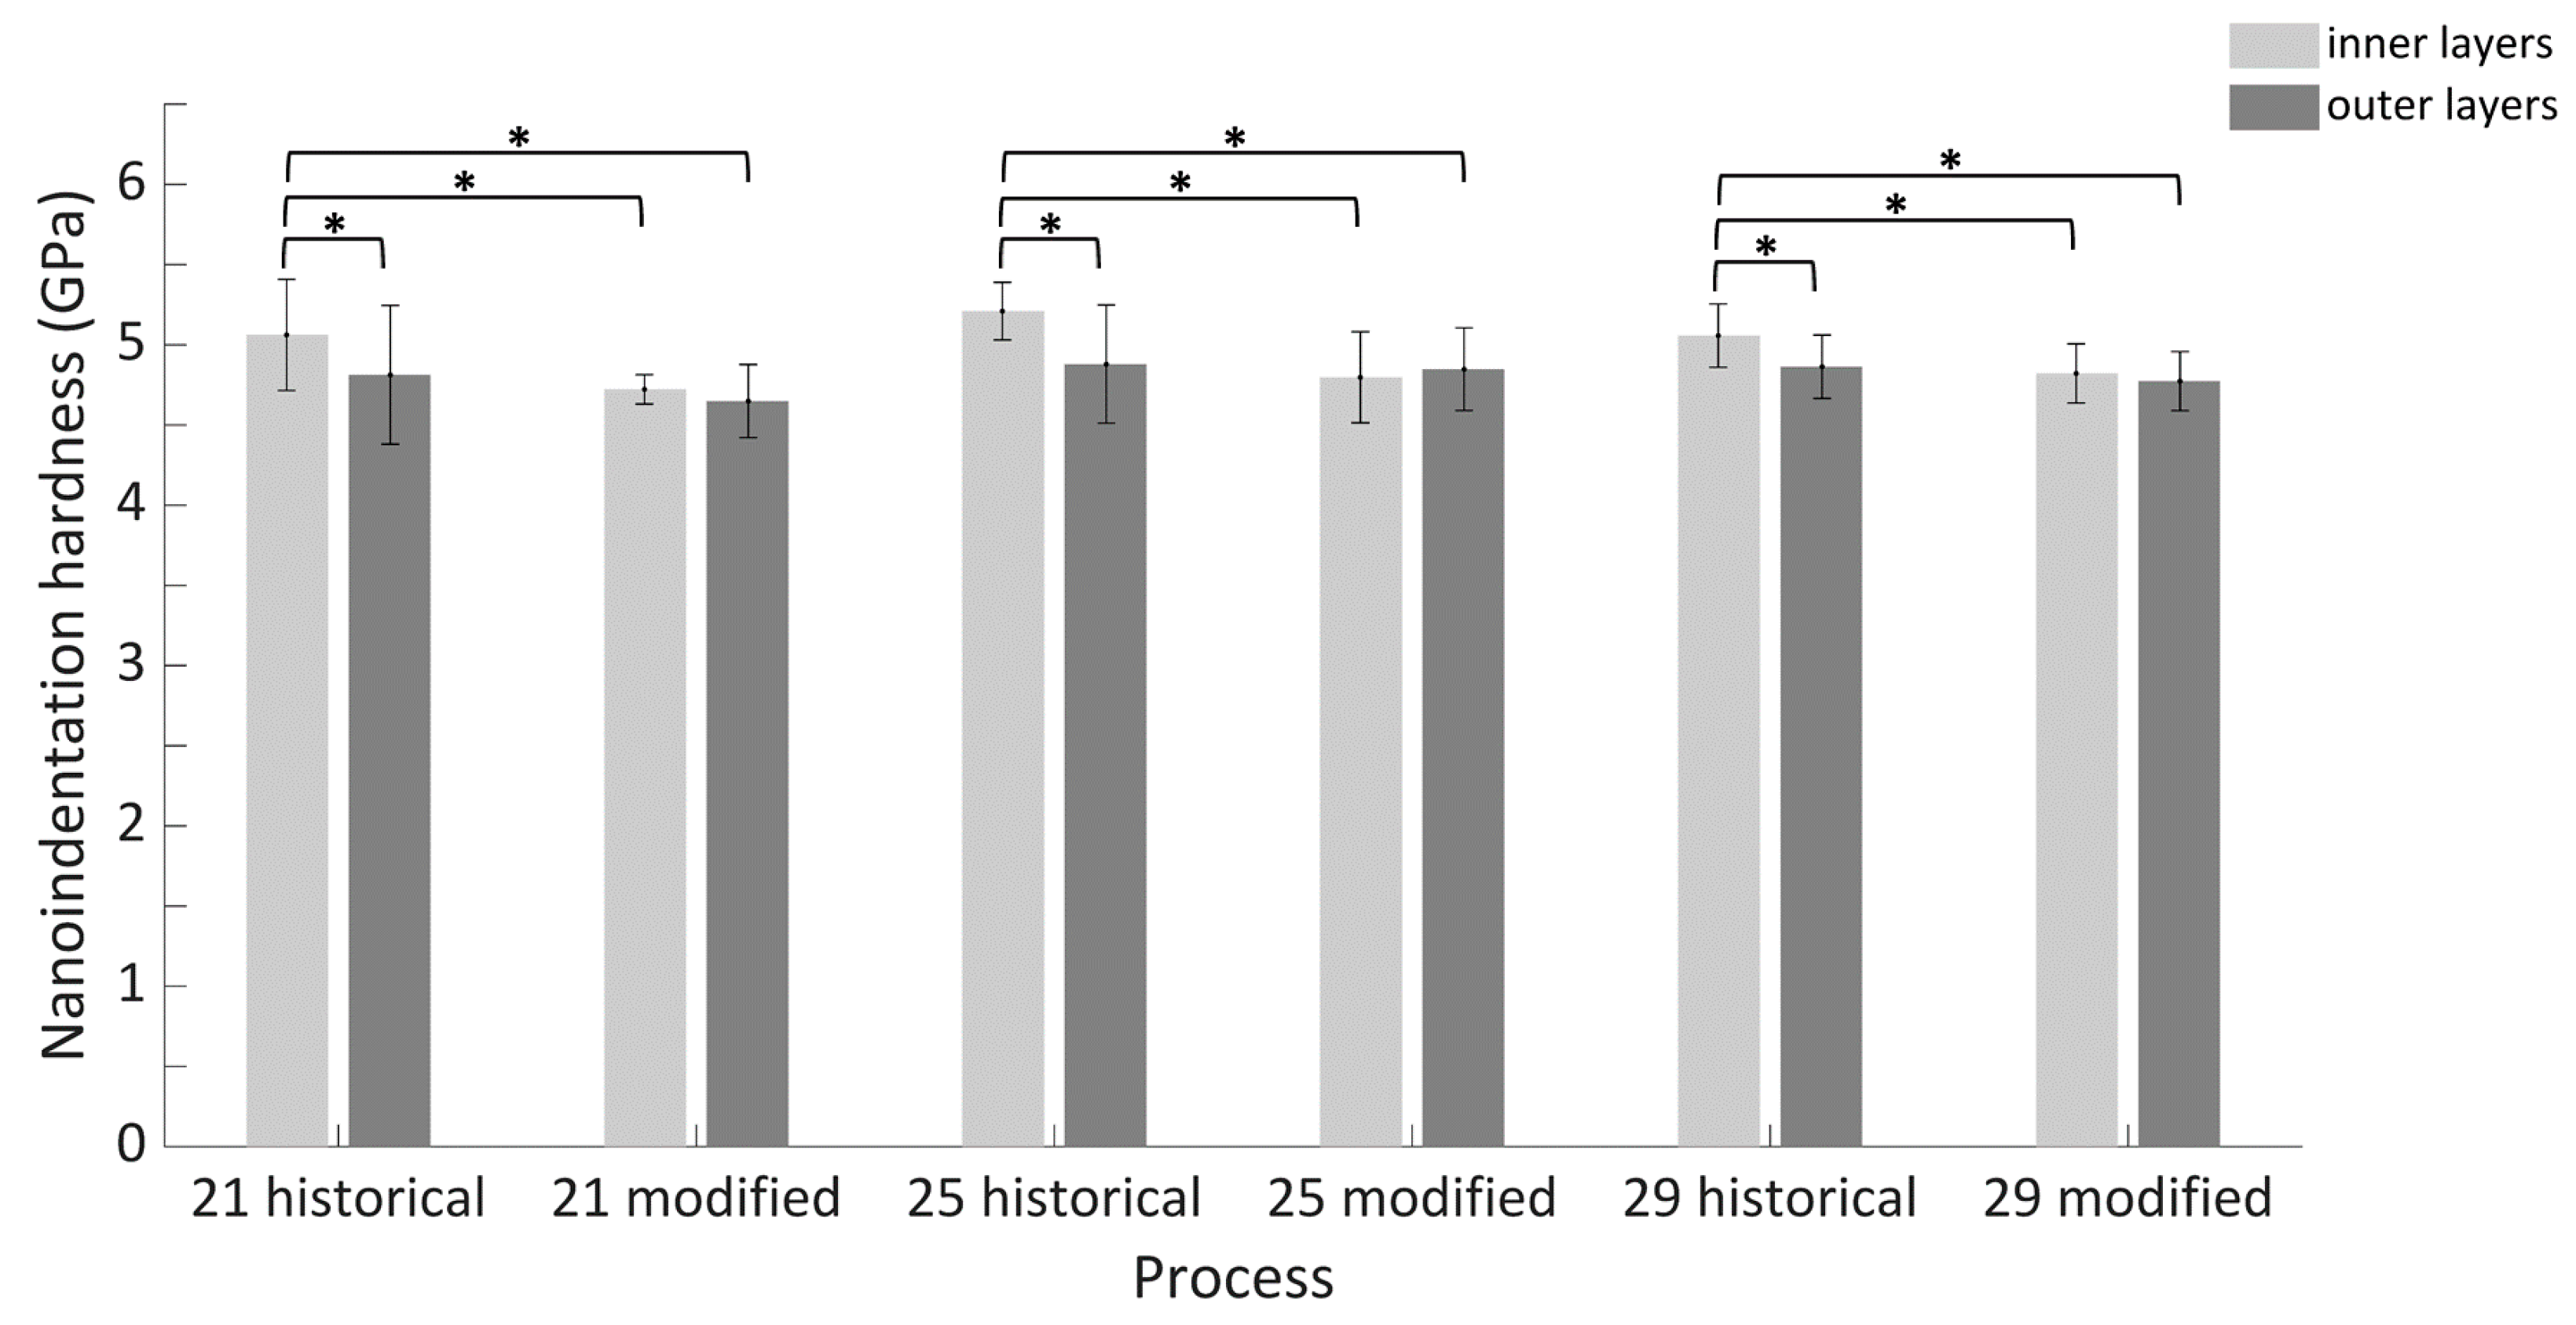
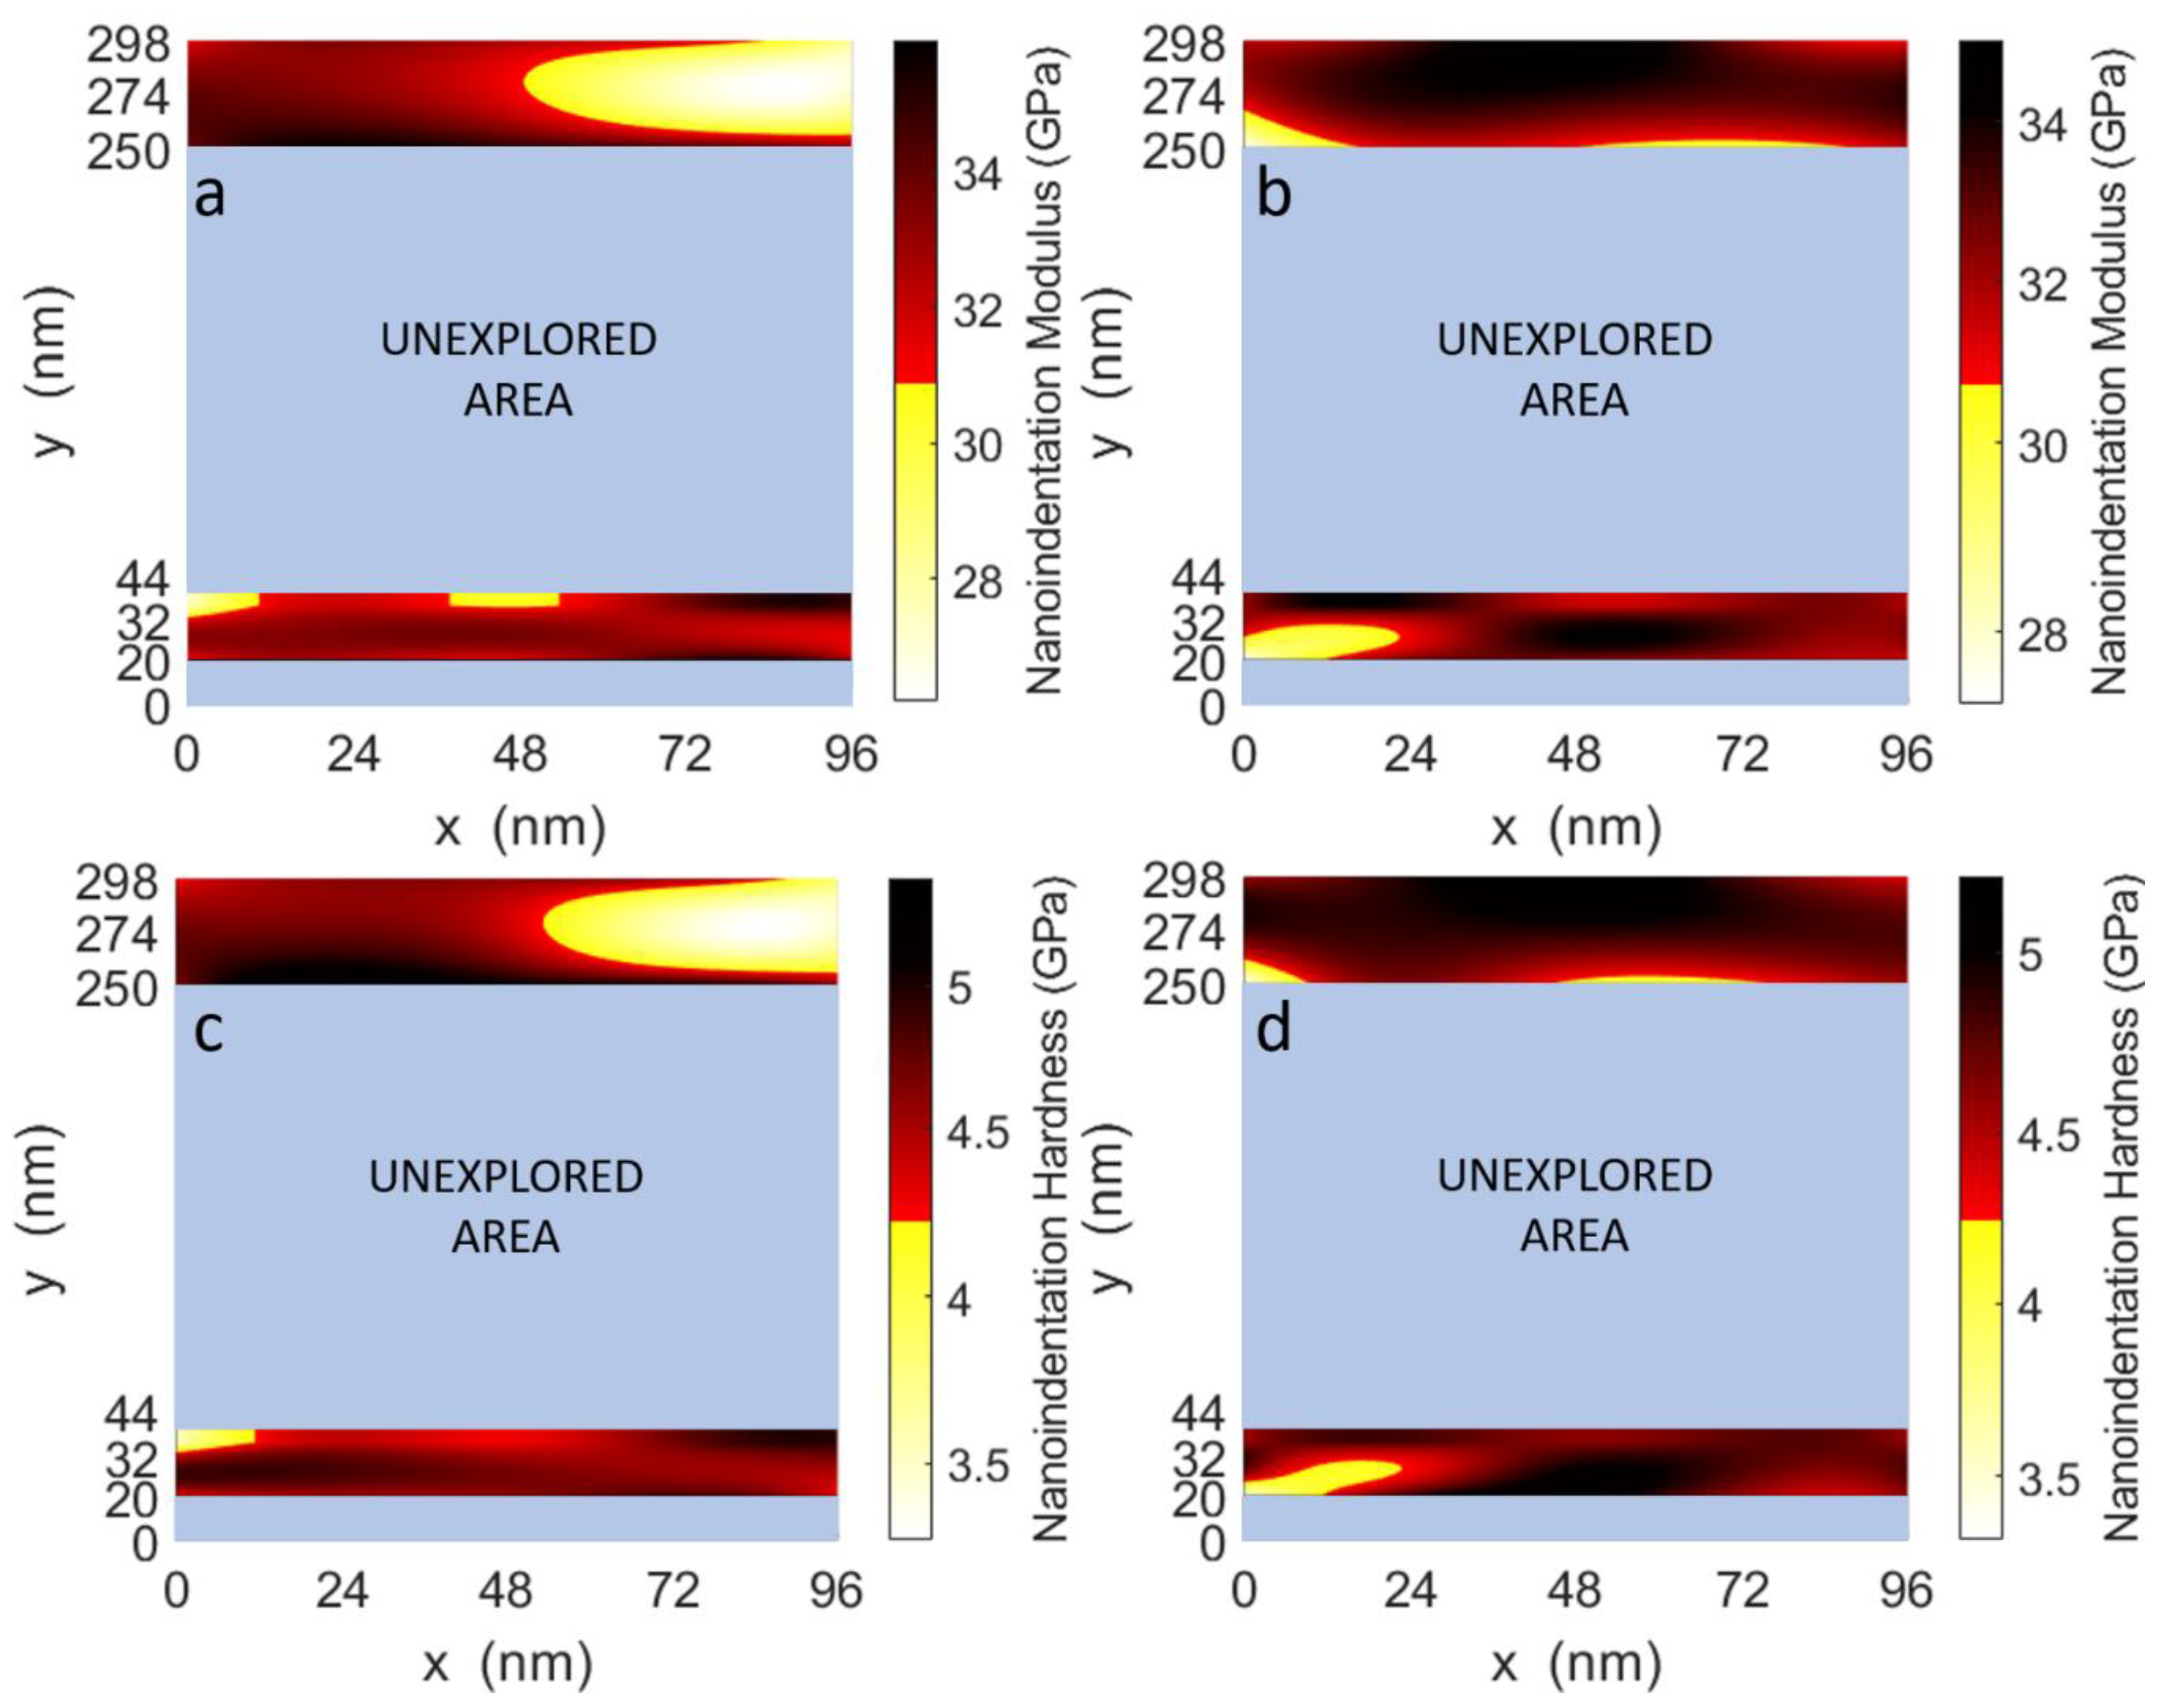
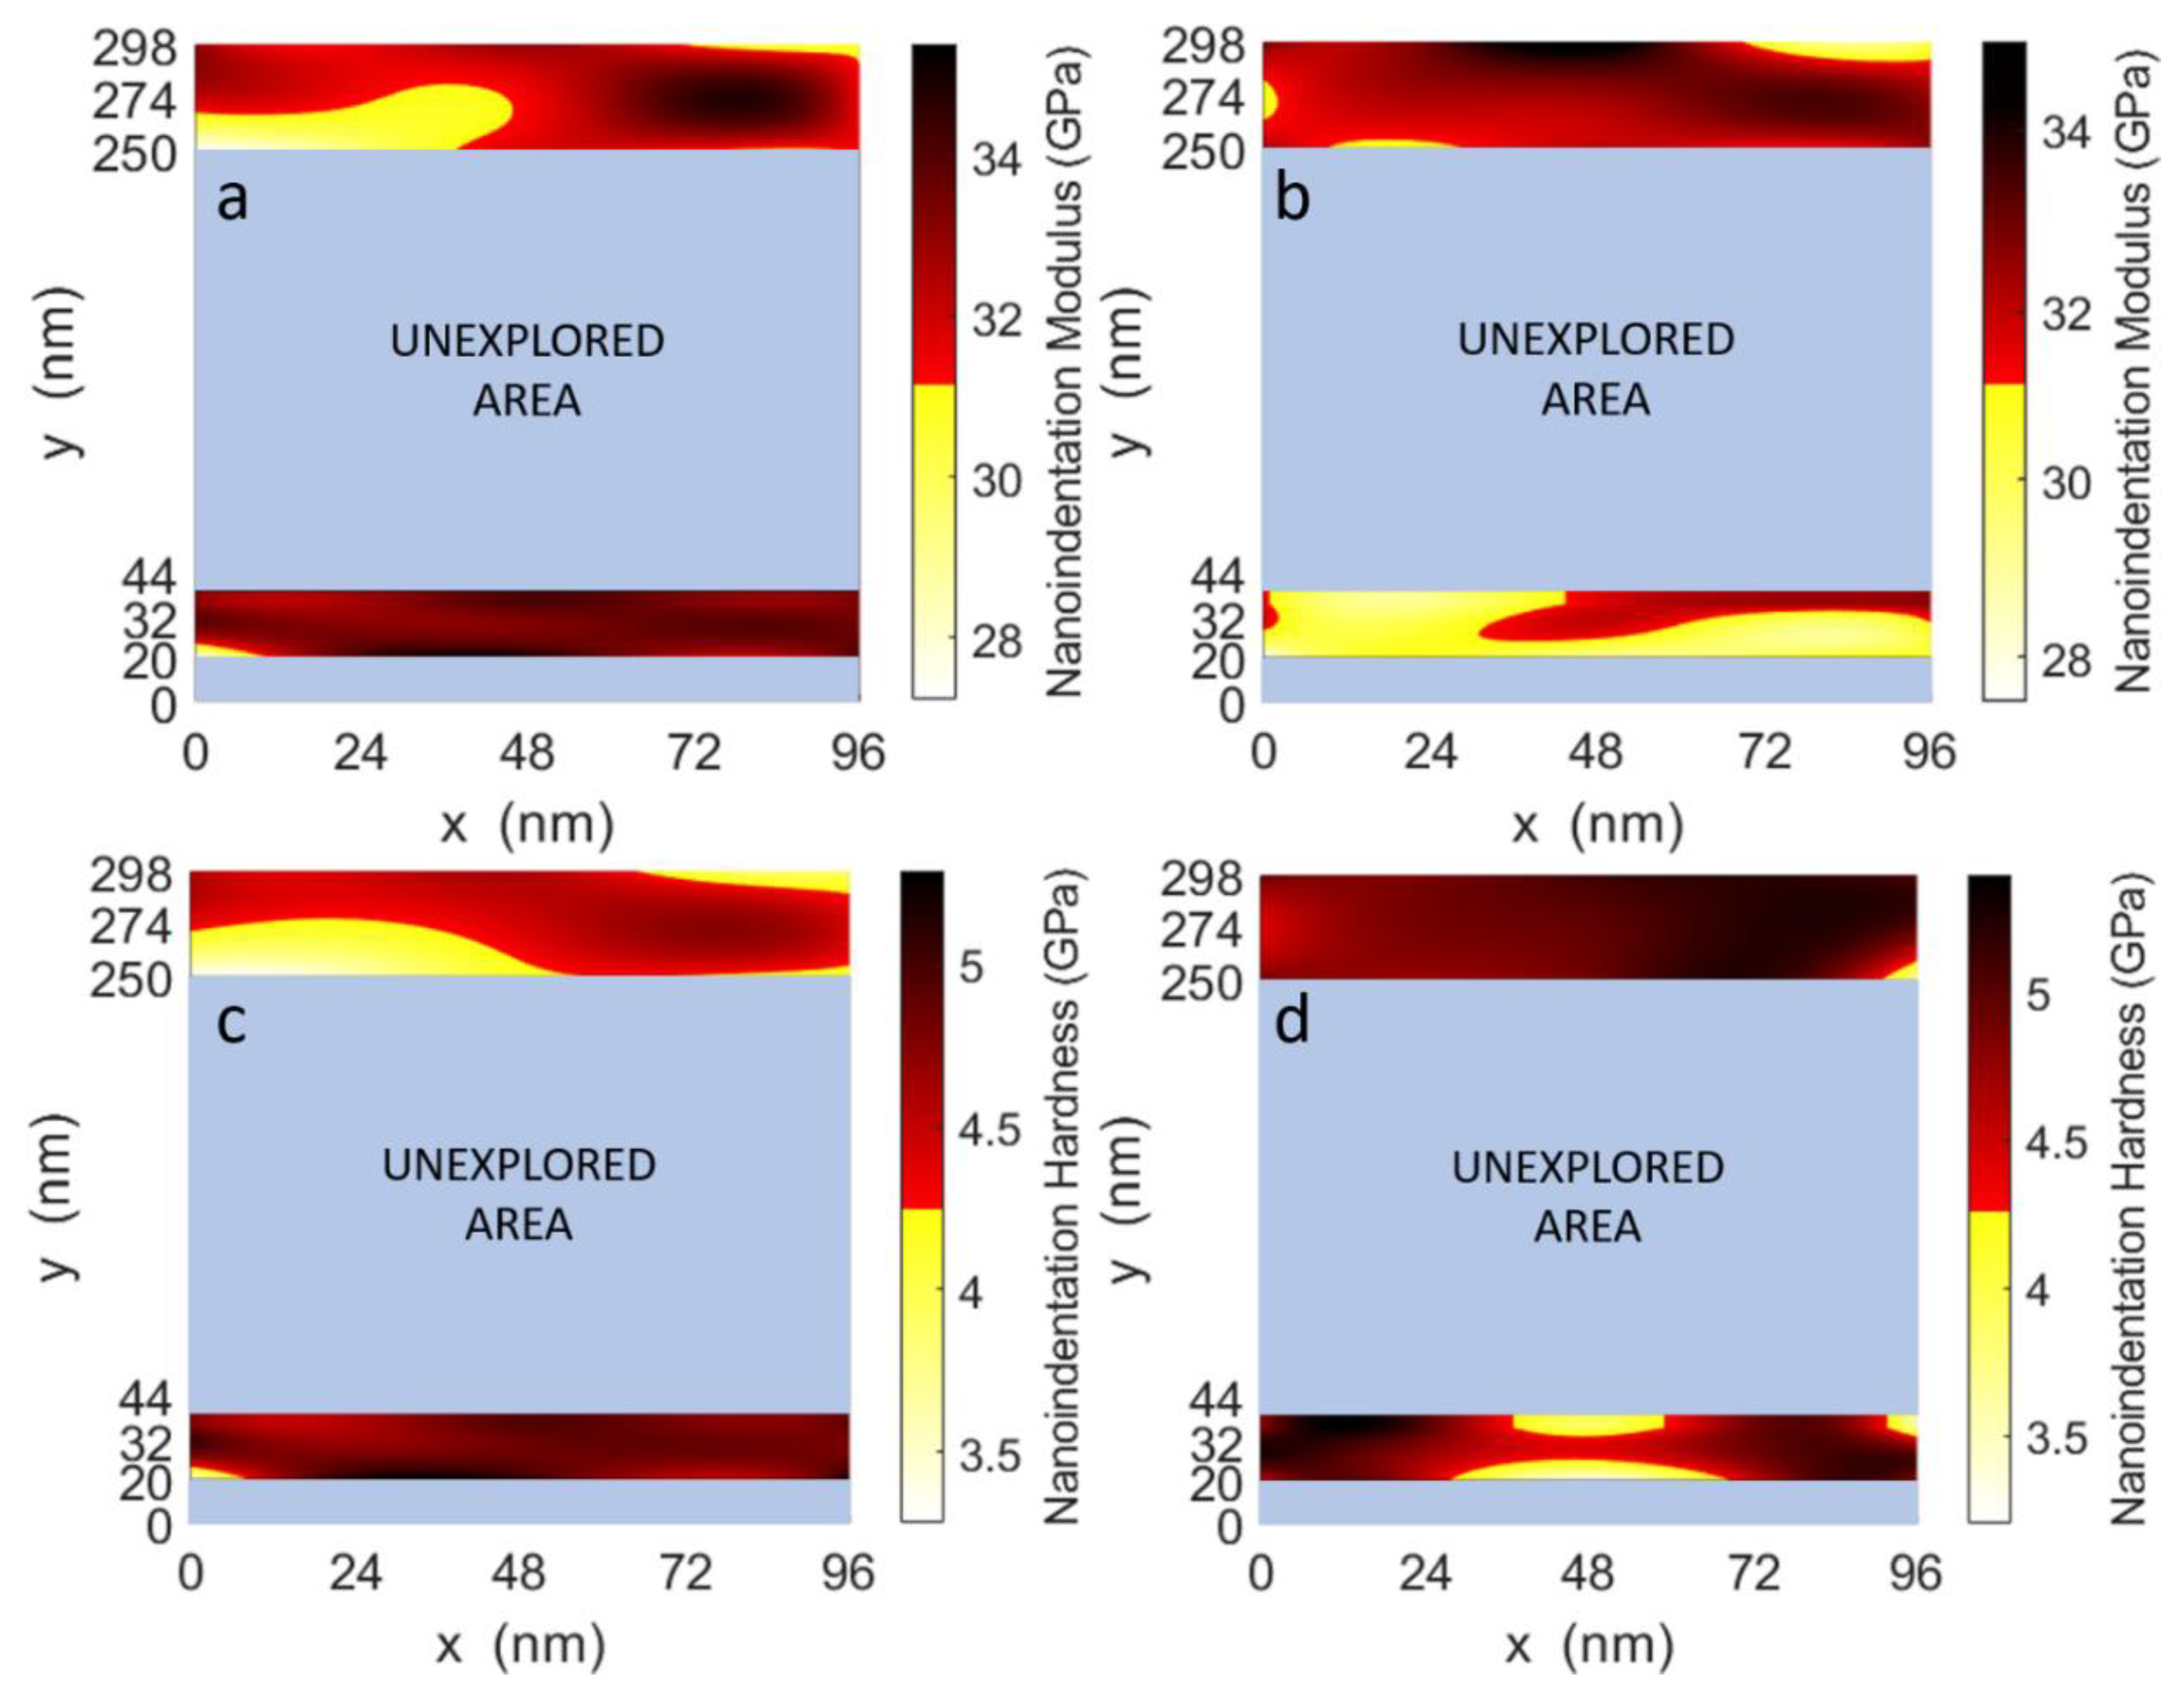
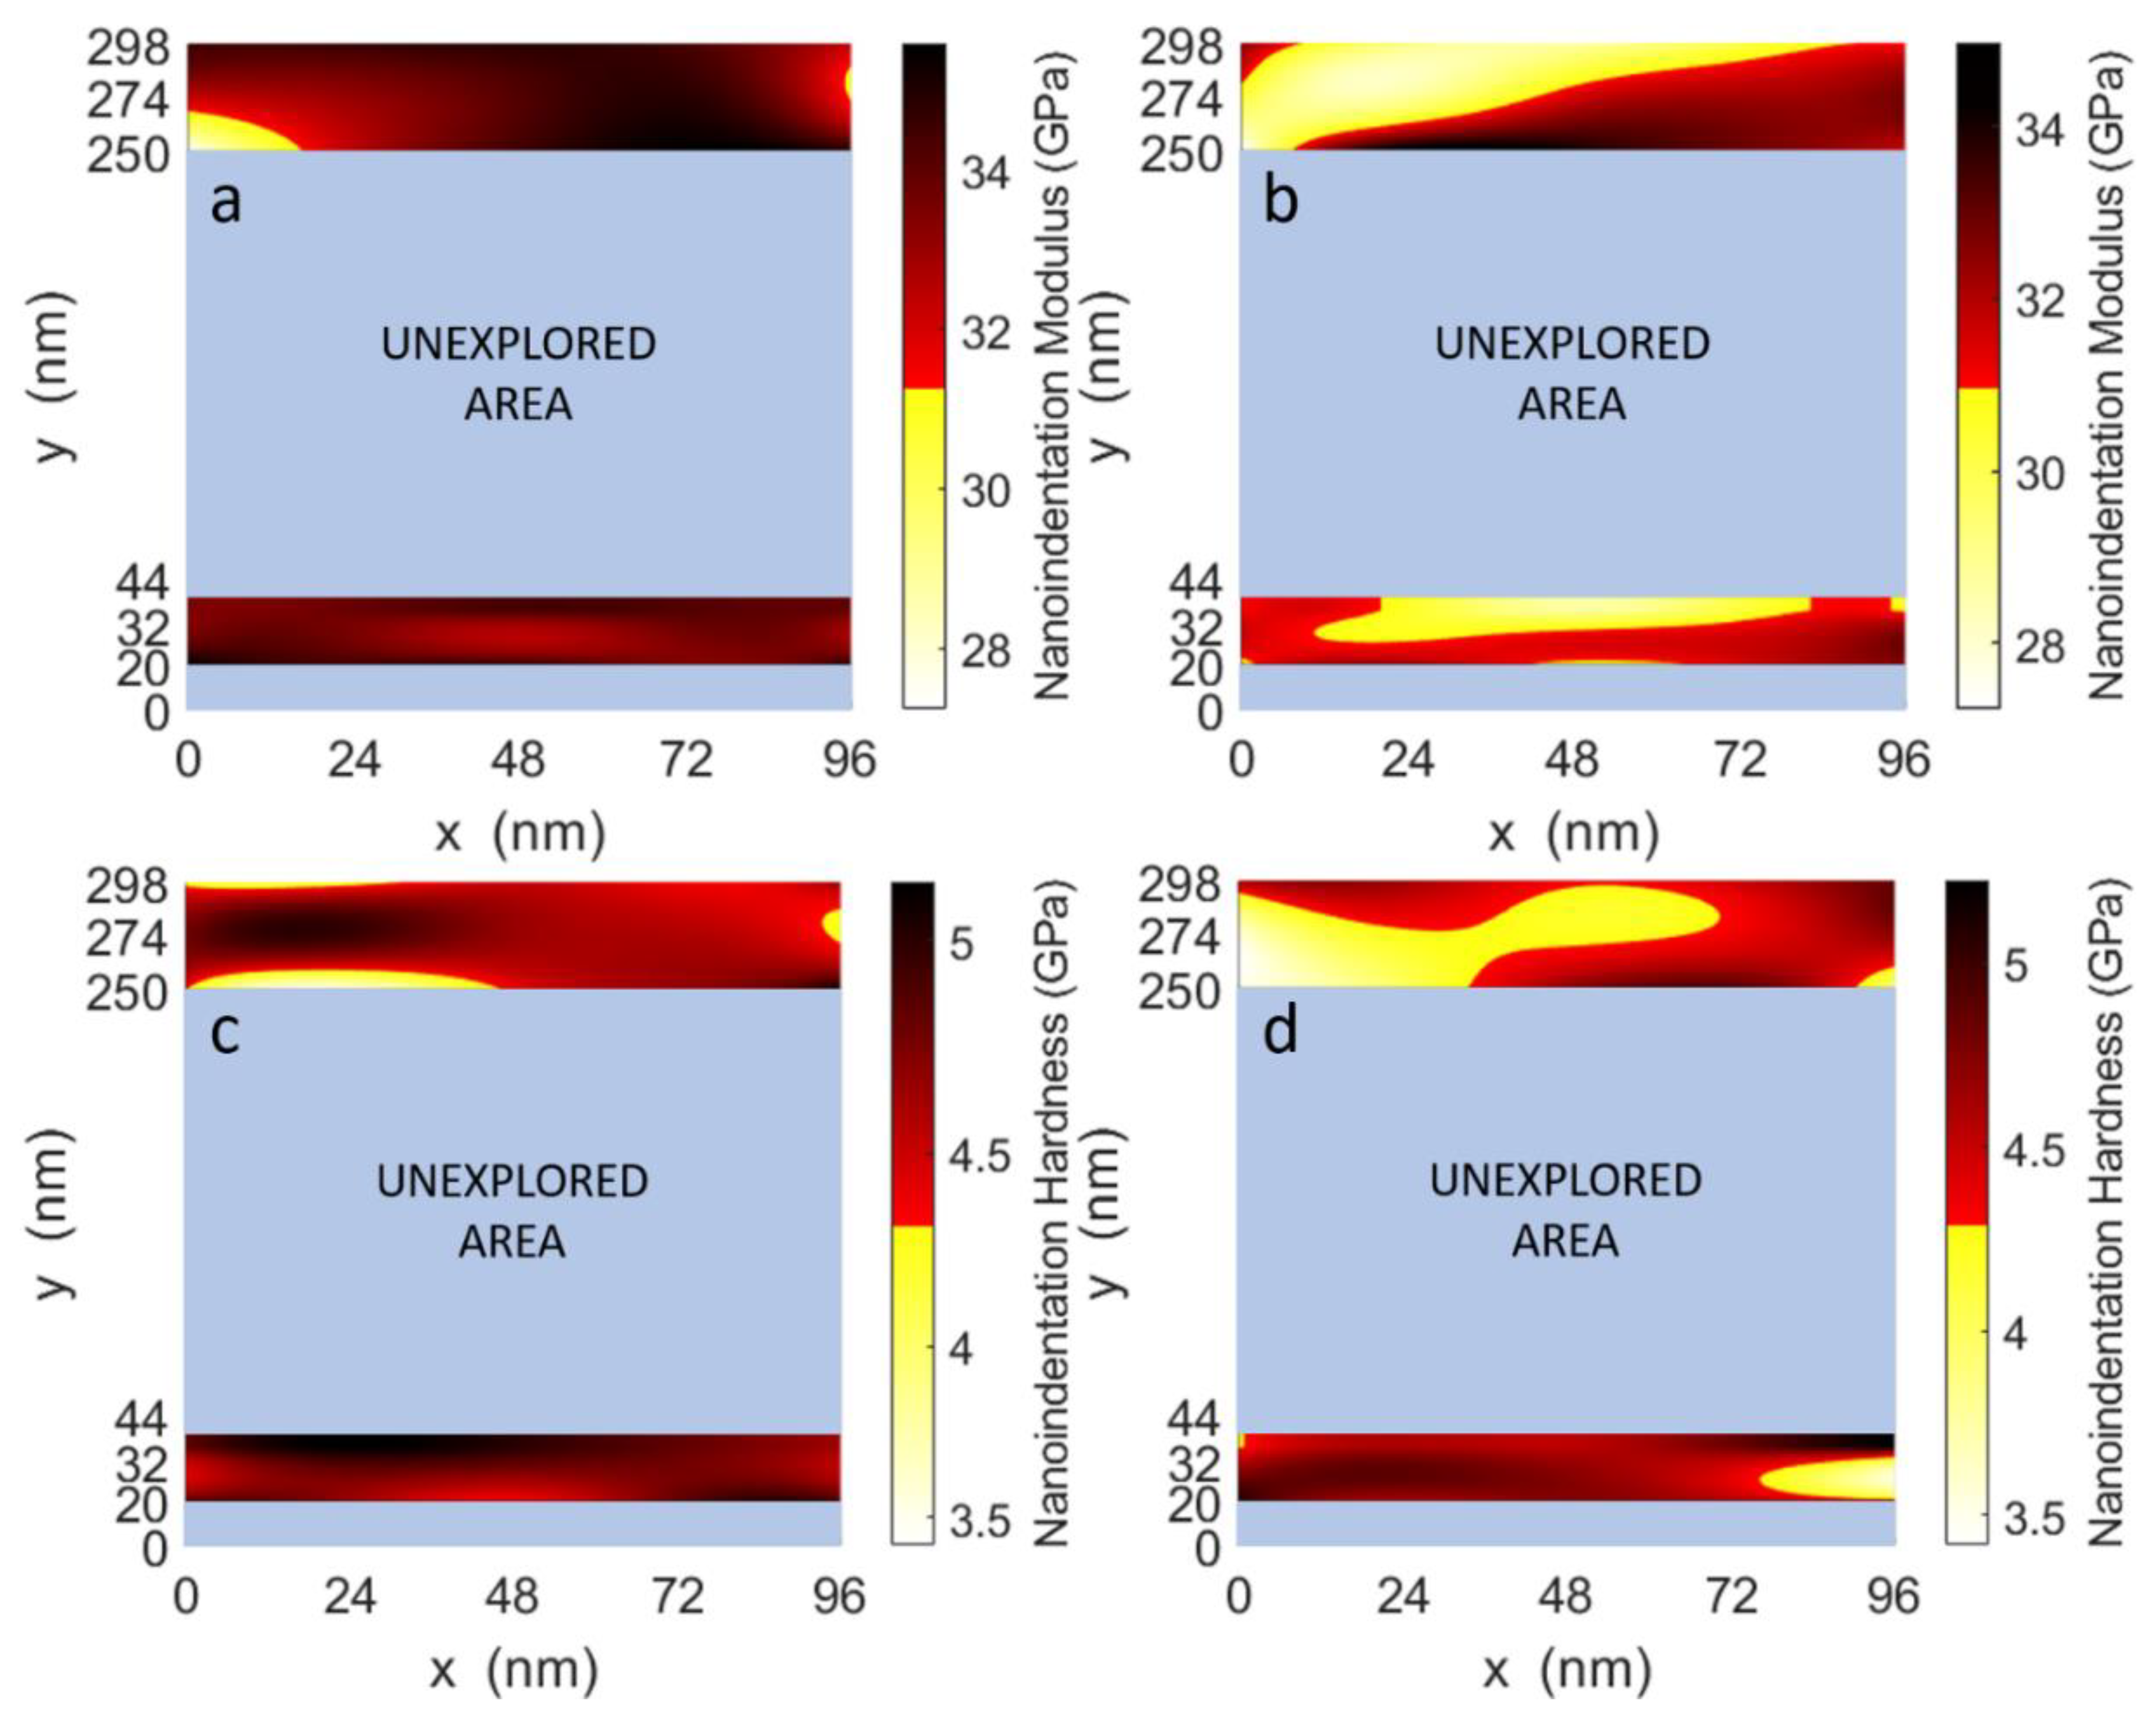
3.2. Nanoindentation Test

Two representative curves, respectively for the inner layer and the outer layer, obtained for the samples produced through both the deposition processes, are shown in Figure 7.
Reported curves obtained through the indentation tests carried out in our laboratory are in agreement with similar indentation experiments found in the literature [30,31,32,39]. Thus, unsurprisingly, the deposited PyC recovers more than 90% of the deformation. A little hysteresis loop, which could be addressed to energy dissipation due to the friction phenomena, characterizes all of the curves. Here, no discontinuities in the indentation curves were observed, indicating the absence of crack initiation.
The mean values of the nanoindentation modulus and of the nanoindentation hardness for all of the samples are reported in Figure 8 and Figure 9, respectively.
The reported values agree with those found in the literature [30,39].
Color maps reported in Figure 10 were obtained through a smoothing procedure of the nanoindentation data (other representative color maps, Figure A1 and Figure A2, are reported in Appendix A), in order to give a better representation of the distribution of the mechanical properties at the microscopic scale, and to better explain the nanoindentation results. The new setting of the chemical vapor deposition (CVD) process reduces the differences between the inner and outer layers.
PyC deposited through the new process shows a slight decrease of elastic properties in the analyzed areas. For the nanoindentation hardness, a reduction of the mean values obtained for the inner layers was observed. In general, through the new deposition process, a significant reduction of the difference of the nanomechanical properties between the inner and outer layers was registered.

4. Discussion

In this study, two different deposition processes adopted to produce MHVs were compared. As reported in the literature, changing the parameters of the deposition process impacts the mechanical properties of the deposited layers [31]. To verify if some significant variations in mechanical properties occurred, three-point bending and nanoindentation tests were performed.
PyC analyzed here was produced through a deposition process at low temperatures (about 1300 °C) to obtain isotropic PyC [40]. In this case, the crystallite orientation of the PyC is completely random, generating the so-called random texture, characterized, thus, by a chaotic microstructure [41]. Moreover, comparable values of the elastic properties obtained at the macro and micro scale is a direct consequence of the PyC microstructure.
Three-point bending tests measure the bulk properties of the deposited PyC. At this scale level, due to the tiny layer deposited during the first hour of the process, possible changes of the mechanical properties are difficult to detect. Furthermore, the results of the three-point bending tests indicate that the two deposition processes lead to a PyC with comparable mechanical properties. Interestingly, the slight reduction of the mean values of Young’s modulus and the increase of the fracture stress values, even if not significant, point out that reducing the coating rate allows improving the performance of the deposited material. PyC that can be easily deformed with a higher fracture resistance reduces the probability of orifice damaging during the assembling procedure.
The mechanical properties of the analyzed areas, at microscale length, are significantly influenced by the indentation site and the deposition process. Thus, the nanoindentation technique was able to reveal the effectiveness of setting variations of the deposition process. Even though both indentation sites and deposition processes significantly impact the nanoindentation results, it can be speculated that reducing the coating rate during the first hour of the deposition permits reducing the inhomogeneities between the layers. Indeed, at this scale level, no significant difference was found between the inner and outer layers obtained through the modified deposition process.
The CVD process adopted here is very sensitive to the parameters setting. A slight variation of the set parameters permits modification of the microstructure of the PyC without impacting its macroscopic characteristics, as revealed by the performed tests. A halved deposition rate improved the quality of deposited pyrolytic carbon, obtaining a material characterized by a finer granulometry than that deposited through the historical deposition process. A reduced granulometry permitted to: (i) obtain layers that better copy the geometry of the substrate, which is critical where the substrate presents complex geometry, i.e., at the housing of the leaflet; (ii) reduce the presence of voids that are the main reason of rejection since they could generate crack and clot. Furthermore, reduction of discrepancies between the mechanical properties of the deposited layers through the new deposition method reduces stress concentration and the probability of crack generation and propagation. As matter of fact, the fracture stress evaluated through the three-point bending tests increases.

5. Conclusions

The study presented here provides a multiscale approach for the mechanical characterization of deposited PyC. Information of the nanoscale was crucial in order to assess improvements introduced by the modified deposition process—improvements that were impossible to detect through the three-point bending approach. In such a manufacturing process, where the global characteristics strictly depends on the quality of the single deposited layer, it was crucial to characterize the devices at a different scale length.
Reduction of the deposition rate drastically reduced the number of rejected devices at the end of the manufacturing process. A slower deposition rate set during the first hour of deposition made possible to obtain layers characterized by a high grade of homogeneity. The high quality of the final products, before the introduction of the new deposition method, was achieved, rejecting an enormous number of devices at the end of the manufacturing process. The introduction of a modified deposition process drastically reduced the number of rejections.
The presence of voids and inhomogeneity in the PyC microstructure affects the characteristics of the final products. Indeed, the design and the manufacturing of MHVs would benefit from further understandings of the role of defects in determining the microstructure of the deposited materials and, thus, the characteristics of the final product.

Author Contributions

Nanoindentation tests and data analysis, three-point bending data analysis, and article writing, G.S.; three-point bending model validation, M.G.; aiding in data interpretation and comments, A.L.A., C.B. and G.B.; three-point bending data provision, G.B. and O.I. All authors have read and agreed to the published version of the manuscript.

Funding

This research received no external funding.

Institutional Review Board Statement

Not applicable.

Informed Consent Statement

Not applicable.

Data Availability Statement

Not applicable.

Conflicts of Interest

Nanoindentation tests on the deposited PyC were carried out for the LivaNova company (Sorin Group Italia s.r.l.) by Politecnico di Torino. Three-point bending tests were carried out by LivaNova (Sorin Group Italia s.r.l.) through an ad hoc experimental set-up. No conflict of interest is reported by the authors.

Appendix A

Dimension mean values reported in Table A1 and Table A2 were obtained measuring all tested specimens through the optical measurement system SmartScope® VR208 (Optical Gaging Products, Inc.) and a caliper VR226 (Mitutoyo).
Table A1. Settings values of the experimental set-up and characteristic dimensions of samples produced through the historical deposition process that underwent the three-point bending test. Ri, t, b, d; α and s indicate, respectively: the internal radius, the thickness, the width, the roller diameter, the support angle, and the half distance between the supporting rollers.
Size ∅ (mm)Ri (mm)t (mm)b (mm)d (mm)α (°)s (mm)
218.59 ± (0.01)0.73 ± (0.01)6.64 ± (0.02)1.534.95 ± (0.06)4.47
2510.56 ± (0.03)0.74 ± (0.01)7.70 ± (0.02)1.526.93 ± (0.09)4.47
2912.51 ± (0.02)0.75 ± (0.01)8.67 ± (0.02)1.530.37 ± (0.07)5.97
Table A2. Settings values of the experimental set-up and characteristic dimensions of samples produced through the modified deposition process that underwent the three-point bending test. Ri, t, b, d; α and s indicate, respectively: the internal radius, the thickness, the width, the roller diameter, the support angle, and the half distance between the supporting rollers.
Size ∅ (mm)Ri (mm)t (mm)b (mm)d (mm)α (°)s (mm)
218.57 ± (0.01)0.73 ± (0.01)6.65 ± (0.01)1.534.95 ± (0.06)4.47
2510.56 ± (0.01)0.73 ± (0.01)7.70 ± (0.02)1.526.93 ± (0.02)4.47
2912.54 ± (0.01)0.72 ± (0.01)8.66 ± (0.01)1.530.37 ± (0.03)5.97
Table A3 and Table A4 report the mean values of the load P and the displacement δ registered before the failure of the specimen.
Table A3. Mean values of maximum load and corresponding displacement obtained through the three-point bending test procedure before the failure of the sample produced through the historical deposition process.
Size ∅ (mm)P (N)δ (mm)
2141.12 ± (2.74)0.24 ± (0.02)
2553.34 ± (5.83)0.18 ± (0.01)
2946.71 ± (4.49)0.33 ± (0.03)
Table A4. Mean values of maximum load and corresponding displacement obtained through the three-point bending test procedure before the failure of the sample produced through the modified deposition process.
Size ∅ (mm)P (N)δ (mm)
2143.52 ± (4.24)0.26 ± (0.02)
2554.01 ± (6.12)0.20 ± (0.02)
2946.55 ± (6.51)0.37 ± (0.04)
Figure A1. Representative color maps of the micromechanical properties obtained for orifice samples characterized by a diameter of 25 mm. (a,b) represent the distribution of the nanoindentation modulus obtained for the old deposition process and the new deposition process, respectively. (c,d) Represent the distribution of the nanoindentation hardness obtained for the old deposition process and the new deposition process, respectively.
Processes 09 00338 g0a1
Figure A2. Representative color maps of the micromechanical properties obtained for orifice samples characterized by a diameter of 29 mm. (a,b) represent the distribution of the nanoindentation modulus obtained for the old deposition process and the new deposition process respectively. (c,d) Represent the distribution of the nanoindentation hardness obtained for the old deposition process and the new deposition process, respectively.
Processes 09 00338 g0a2

References

  1. Dasi, L.P.; Simon, H.A.; Sucosky, P.; Yoganathan, A.P. Fluid mechanics of artificial heart valves. Clin. Exp. Pharmacol. Physiol. 2009, 36, 225–237. [Google Scholar] [CrossRef] [PubMed] [Green Version]
  2. Sun, J.C.; Davidson, M.J.; Lamy, A.; Eikelboom, J.W. Antithrombotic management of patients with prosthetic heart valves: Current evidence and future trends. Lancet 2009, 374, 565–576. [Google Scholar] [CrossRef]
  3. Yacoub, M.H.; Takkenberg, J.J.M. Will heart valve tissue engineering change the world? Nat. Clin. Pract. Cardiovasc. Med. 2005, 2, 60–61. [Google Scholar] [CrossRef] [PubMed]
  4. Black, M.M.; Drury, P.J. Mechanical and Other Problems of Artificial Valves. In The Pathology of Devices; Berry, C., Ed.; Springer: Berlin/Heidelberg, Germany, 1994; pp. 127–159. ISBN 978-3-642-76846-0. [Google Scholar]
  5. Schoen, F.J.; Levy, R.J. Founder’s Award, 25th Annual Meeting of the Society for Biomaterials, perspectives. Providence, RI, April 28–May 2, 1999. Tissue heart valves: Current challenges and future research perspectives. J. Biomed. Mater. Res. 1999, 47, 439–465. [Google Scholar] [CrossRef]
  6. Fioretta, E.S.; Dijkman, P.E.; Emmert, M.Y.; Hoerstrup, S.P. The future of heart valve replacement: Recent developments and translational challenges for heart valve tissue engineering. J. Tissue Eng. Regen. Med. 2018, 12, e323–e335. [Google Scholar] [CrossRef] [PubMed]
  7. Mohammadi, H.; Mequanint, K. Prosthetic aortic heart valves: Modeling and design. Med Eng. Phys. 2011, 33, 131–147. [Google Scholar] [CrossRef] [PubMed]
  8. Ohlmann, L.; Mohammadi, H. Soft robotic in the construction of prosthetic heart valve: A novel approach. J. Med. Eng. Technol. 2020, 44, 76–81. [Google Scholar] [CrossRef] [PubMed]
  9. Gott, V.L.; Alejo, D.E.; Cameron, D.E. Mechanical Heart Valves: 50 Years of Evolution. Ann. Thorac. Surg. 2003, 76. [Google Scholar] [CrossRef]
  10. Bokros, J.C.; Gott, V.L.; La Grange, L.D.; Fadall, A.M.; Vos, K.D.; Ramos, M.D. Correlations between blood compatibility and heparin adsorptivity for an impermeable isotropic pyrolytic carbon. J. Biomed. Mater. Res. 1969, 3, 497–528. [Google Scholar] [CrossRef]
  11. Oveissi, F.; Naficy, S.; Lee, A.; Winlaw, D.S.; Dehghani, F. Materials and manufacturing perspectives in engineering heart valves: A review. Mater. Today Bio 2020, 5. [Google Scholar] [CrossRef]
  12. Schoen, F.J. On the fatigue behavior of pyrolytic carbon. Carbon 1973, 11, 413–414. [Google Scholar] [CrossRef]
  13. Ritchie, R.O.; Dauskardt, R.H.; Yu, W.; Brendzel, A.M. Cyclic fatigue-crack propagation, stress-corrosion, and fracture-toughness behavior in pyrolytic carbon-coated graphite for prosthetic heart valve applications. J. Biomed. Mater. Res. 1990, 24, 189–206. [Google Scholar] [CrossRef]
  14. Ma, L.; Sines, G. Fatigue behavior of a pyrolytic carbon. J. Biomed. Mater. Res. 2000, 51, 61–68. [Google Scholar] [CrossRef]
  15. Pierson, H.O. Pyrolytic Graphite. Handb. Carbon, Graph. Diam. Fuller. 1993, 141–165. [Google Scholar] [CrossRef]
  16. Akins, R.J.; Bokros, J.C. The deposition of pure and alloyed isotropic carbons in steady-state fluidized beds. Carbon 1974, 12, 439–452. [Google Scholar] [CrossRef]
  17. Ely, J.L.; Emken, M.R.; Accuntius, J.A.; Wilde, D.S.; Haubold, A.D.; More, R.B.; Bokros, J.C. Pure pyrolyric carbon: Preparation and properties of a new material, on- X® carbon for mechanical heart valve prostheses. J. Heart Valve Dis. 1998, 7, 626–632. [Google Scholar] [PubMed]
  18. Gwinnett, A.J.; Matsui, A. A study of enamel adhesives. The physical relationship between enamel and adhesive. Arch. Oral Biol. 1967. [Google Scholar] [CrossRef]
  19. Bokros, C.J. Control of Structure of Carbon for Use in Bioengineering. Chem. Phys. Carbon 1972, 9, 103–171. [Google Scholar]
  20. DeWall, R.A.; Qasim, N.; Carr, L. Evolution of mechanical heart valves. Ann. Thoracic Surg. 2000, 69, 1612–1621. [Google Scholar] [CrossRef]
  21. Wium, E.; Jordaan, C.J.; Botes, L.; Smit, F.E. Alternative mechanical heart valves for the developing world. Asian Cardiovasc. Thorac. Ann. 2020, 28, 431–443. [Google Scholar] [CrossRef]
  22. Mitamura, Y.; Hosooka, K.; Matsumoto, T.; Otaki, K.; Sakai, K.; Tanabe, T.; Yuta, T.; Mikami, T. Development of a Ceramic Heart Valve. J. Biomater. Appl. 1989, 4, 33–55. [Google Scholar] [CrossRef]
  23. Bokros, J.C. JACK C. BOKROS The fourth Charles, E. Pettinos Award was presented at the Twelfth Biennial Conference on Carbon in Pittsburgh, Pennsylvania to J. C. Bokros in recognition of his. Carbon 1971, 15, 353–371. [Google Scholar] [CrossRef]
  24. Ryder, J.K.; Cao, H. Structural integrity assessment of heart valve prostheses: A damage tolerance analysis of the CarboMedics Prosthetic Heart Valve. J. Heart Valve Dis. 1996, 5 (Suppl. 1), S86–S96. [Google Scholar]
  25. Kaae, J.L. Structure and mechanical properties of isotropic pyrolytic carbons deposited below 1600 °C. J. Nucl. Mat. 1971, 38, 42–50. [Google Scholar] [CrossRef]
  26. Price, J. Deformation and Fracture of Pyrolytic Bed. Carbon 1965, 3, 503–519. [Google Scholar]
  27. Shim, H.S. The Behavior of isotropic Pyroiytic Carbons under Cyclic Loading. Biomater. Med. Devices Artif. Organs 1974, 2, 55–64. [Google Scholar] [CrossRef] [PubMed]
  28. Peluccio, M.S.; Bignardi, C.; Lombardo, S.; Montevecchi, F.M.; Carossa, S. Comparative study of nanomechanical properties of cements used in teeth restoration. J. Phys. Condens. Matter 2007, 19. [Google Scholar] [CrossRef]
  29. Bignardi, C.; Petraroli, M.; Pugno, N. Nanoindentations on Conch Shells of Gastropoda and Bivalvia Molluscs Reveal Anisotropic Evolution Against External Attacks. J. Nanosci. Nanotechnol. 2010, 10, 6453–6460. [Google Scholar] [CrossRef] [Green Version]
  30. Hofmann, G.; Wiedenmeier, M.; Freund, M.; Beavan, A.; Hay, J.; Pharr, G.M. Investigation of the relationship between position within coater and pyrolytic carbon characteristics using nanoindentation. Carbon 2000, 38, 645–653. [Google Scholar] [CrossRef]
  31. López-Honorato, E.; Meadows, P.J.; Xiao, P.; Marsh, G.; Abram, T.J. Structure and mechanical properties of pyrolytic carbon produced by fluidized bed chemical vapor deposition. Nucl. Eng. Des. 2008, 238, 3121–3128. [Google Scholar] [CrossRef]
  32. Gross, T.S.; Timoshchuk, N.; Tsukrov, I.I.; Piat, R.; Reznik, B. On the ability of nanoindentation to measure anisotropic elastic constants of pyrolytic carbon. ZAMM Z. Angew. Math. Mech. 2013, 93, 301–312. [Google Scholar] [CrossRef]
  33. Gross, T.S.; Timoshchuk, N.; Tsukrov, I.; Reznik, B. Unique nanoindentation damage for highly textured pyrolytic carbon. Carbon 2013, 60, 273–279. [Google Scholar] [CrossRef]
  34. Zhang, H.; López-Honorato, E.; Xiao, P. Fluidized bed chemical vapor deposition of pyrolytic carbon-III. Relationship between microstructure and mechanical properties. Carbon 2015, 91, 346–357. [Google Scholar] [CrossRef]
  35. Beer, F.P.; Jhonston, R.E.; DeWolf, J.T. Mechanics of Materials; McGraw-Hill: New York, NY, USA, 1992. [Google Scholar]
  36. Oliver, W.C.; Pharr, G.M. An improved technique for determining hardness and elastic modulus using load and displacement sensing indentation experiments. J. Mater. Res. 1992, 7, 1564–1583. [Google Scholar] [CrossRef]
  37. Oliver, W.C.; Pharr, G.M. Measurement of hardness and elastic modulus by instrumented indentation: Advances in understanding and refinements to methodology. J. Mater. Res. 2004, 19, 3–20. [Google Scholar] [CrossRef]
  38. Kaae, J.L. Relations between the structure and the mechanical properties of fluidized-bed pyrolytic carbons. Carbon 1971, 9, 291–299. [Google Scholar] [CrossRef]
  39. Marx, D.T.; Riester, L. Mechanical properties of carbon-carbon composite components determined using nanoindentation. Carbon 1999, 37, 1679–1684. [Google Scholar] [CrossRef]
  40. Stanley, J.; Klawitter, J.; More, R. Replacing joints with pyrolytic carbon. Jt. Replace. Technol. 2008, 631–656. [Google Scholar] [CrossRef]
  41. Reznik, B.; Hüttinger, K.J. On the terminology for pyrolytic carbon. Carbon 2002, 40, 621–624. [Google Scholar] [CrossRef]
Figure 1. Representation of a typical specimen for: (a) three-point bending test; (b) nanoindentation test.
Processes 09 00338 g001
Figure 2. Representation of the experimental set-up for the three-point bending test. The specimen is represented by the arch, which lays on the support rollers. On the top of the specimen is the loading roller that transmits the force applied by the testing machine.
Processes 09 00338 g002
Figure 3. Schematization of the indentation points: (a) on the pyrolytic carbon (PyC) deposited through the historical process; (b) on the PyC deposited through the modified process. In yellow, the inner layers (deposited during the first hour of the process) in light blue, the outer layers (deposited after one hour the beginning of the process). d1 is the distance between the graphite substrate interface and the first indentation equal to 20 µm. d2 is the distance between the graphite substrate interface and the indentation sites on the outer layers equal to 250 µm. px is the distance between indentations along the matrix raw equal to 24 µm. py1 is the distance between two consecutive indentations on the inner layers equal to 12 µm. py2 is the distance between two consecutive indentations on the outer layers equal to 24 µm.
Processes 09 00338 g003
Figure 4. Explanatory curve of the indentation process. The discontinuities in the last part of the unloading phase is characteristics of the thermal drift measurement process.
Processes 09 00338 g004
Figure 5. Mean values of Young’s modulus obtained from the three-point bending test for the three different orifice sizes.
Processes 09 00338 g005
Figure 6. Mean values of the fracture stress obtained from the three-point bending test for the three different orifice sizes.
Processes 09 00338 g006
Figure 7. Explanatory curves of nanoindentation tests performed on: (a) specimens obtained with the historical deposition process; (b) specimens obtained with the modified deposition process.
Processes 09 00338 g007
Figure 8. Mean values of nanoindentation modulus, for the inner layers and the outer layers. On the abscissa the diameter (mm) of the orifice and the deposition method. Where the * indicates significant differences between the mean values (p < 0.05).
Processes 09 00338 g008
Figure 9. Mean values of nanoindentation hardness, for the inner layers and the outer layers. On the abscissa the diameter (mm) of the orifice and the deposition method. Where the * indicates significant differences between the mean values (p < 0.05).
Processes 09 00338 g009
Figure 10. Representative color maps of the micromechanical properties obtained for orifice samples characterized by a diameter of 21 mm. (a,b) represent the distribution of the nanoindentation modulus obtained for the old deposition process and the new deposition process, respectively; (c,d) represent the distribution of the nanoindentation hardness obtained for the old deposition process and the new deposition process, respectively.
Processes 09 00338 g010
Table 1. Number of specimens of mechanical heart valve (MHV) orifices obtained through the two deposition processes.
Size ∅ (mm)
Deposition process212529
Historical262626
Modified262626
Publisher’s Note: MDPI stays neutral with regard to jurisdictional claims in published maps and institutional affiliations.

