Article

The Impact of Moisture and Number of Contact Points on the Process of Friction in Plant Granular Materials

Department of Mechanical Engineering and Agrophysics, Faculty of Production and Power Engineering, University of Agriculture in Cracow, Balicka 120, 30-149 Cracow, Poland
*
Author to whom correspondence should be addressed.
Processes 2021, 9(2), 215; https://doi.org/10.3390/pr9020215
Submission received: 28 December 2020 / Revised: 19 January 2021 / Accepted: 22 January 2021 / Published: 25 January 2021
(This article belongs to the Special Issue Technical Aspects of Renewable Energy Sources (RES))

Abstract

:
Friction occurs in the processes of transport and storage of granular plant materials used in the energy (RES—Renewable Energy Sources) and food sectors. This paper presents the results of a study on the impact of the moisture content of the material and the number of its contact points with a smooth surface (a steel sheet) on the process of friction in grains of wheat and buckwheat. The friction process was studied for four different levels of moisture (9.5%, 13.5%, 17.5% and 21.5%) and three different average numbers of contact points. To measure the force of friction, an universal testing machine with appropriate instrumentation was used. To determine the number of contact points, computer imaging analysis was conducted. An increase in static and kinetic friction was observed along with the increase in moisture level and the increase in the number of contact points. Correlation and regression analysis was performed for the data obtained.

1. Introduction

Friction is a complex of physical phenomena which occurs in cases of contact between two bodies. It causes grinding of surface asperities, and in order to overcome it, energy must be exerted [1]. Friction is a complicated process, and its exact course is still being studied by many researchers.
The most well-known relationship in friction is the one developed by Guillaume Amontons
T = μ⋅P
where: T—force of friction, μ—coefficient of proportionality, later renamed as the coefficient of friction, and P—normal force.
However, for a more precise understanding of this process it is necessary to analyze additional factors. For this reason, over the years there have been numerous theories of friction, which can be in the most general terms divided into three groups: mechanical theories, molecular theories, and mechanical-molecular theories. The mechanical theories assume that friction results from the mechanical action of surfaces rubbing against one another. This group of theories includes the Amonton-Coulomb theory and Euler’s theory. The second group of theories, molecular theories, assumes that the phenomenon of friction is caused by the molecular action of surfaces rubbing against one another. This group includes such theories as Tomlinson’s model and Derjaguin’s theory. The Kragielski model attempts to combine the groups of mechanical and molecular theories [2,3,4].
Materials and objects with a granular form are a particular type of material. Granular materials are defined as a system of macroscopic particles in which the space between particles is filled with a liquid or a gas [5]. They are characterized by the ability to flow and to take on the shape of the container in which they reside. Some researchers believe that they represent a separate state of matter [6]. These materials occur in many branches of industry, mainly in the food industry, but also in construction, ceramics, pharmaceuticals, gardening, and the chemical and energy sectors. Plant granular materials are additionally characterized by the low repeatability of the particles and relatively high susceptibility to the action of environmental factors, mainly atmospheric moisture, as in the case of plant fuel materials such as wood pellets, sawdust, or woodchips. Both granular products and plant fuel products are subjected to numerous technological processes such as transport, storage, and warehousing, as well as collection, cleaning, and sorting.
In order to correctly design technical means to process, transport, and store these materials, it is necessary to understand their physical properties [7,8,9]. One of the most relevant physical properties of these materials which impacts the course of these technical processes is the external friction of the materials [10,11,12,13,14]. External friction in these types of materials means the friction which occurs between the construction material and the granular material [4]. In this case, the construction material is understood to be the material of the machine components that are in contact with the granular material. This phenomenon continues to hold the interest of contemporary researchers, as it is determined by many mutually related factors [15]. Many researchers have attempted to describe the phenomenon of friction of granular materials but have only taken into account individual factors from among the entire set of factors which influence this phenomenon. The main factor which has been studied up to this point has been the water content of the materials. The impact of moisture on the value of the force of friction in plant granular materials has been studied by numerous researchers [10,11,12,13,16,17,18,19,20]. All of these studies have indicated an increase in static and kinetic friction along with an increase in moisture for plant granular materials. Many authors have taken into account the type of construction material as a factor influencing the value of the force of friction in their works [10,12,16,17,19,21,22,23,24]. A further factor whose influence on force of friction has been studied is the speed of motion across a surface. Researchers have observed an increase in the force of static and kinetic friction along with an increase in speed [25,26]. An analysis of the literature conducted by the authors of this paper did not reveal information on studies which take into account the number of contact points of the granular material with the construction surface as a factor influencing the value of the force of friction. Thus, this study was intended to research the impact of this factor in relation to the moisture of the material.

2. Materials and Methods

The study material comprised grains of two plants, wheat and buckwheat. Both are highly popular and commonly encountered in the food industry. The grains of wheat have a roughly ellipsoid shape while the grains of buckwheat are roughly triangular in shape. Figure 1 presents individual particles (grains) of each of the studied materials.
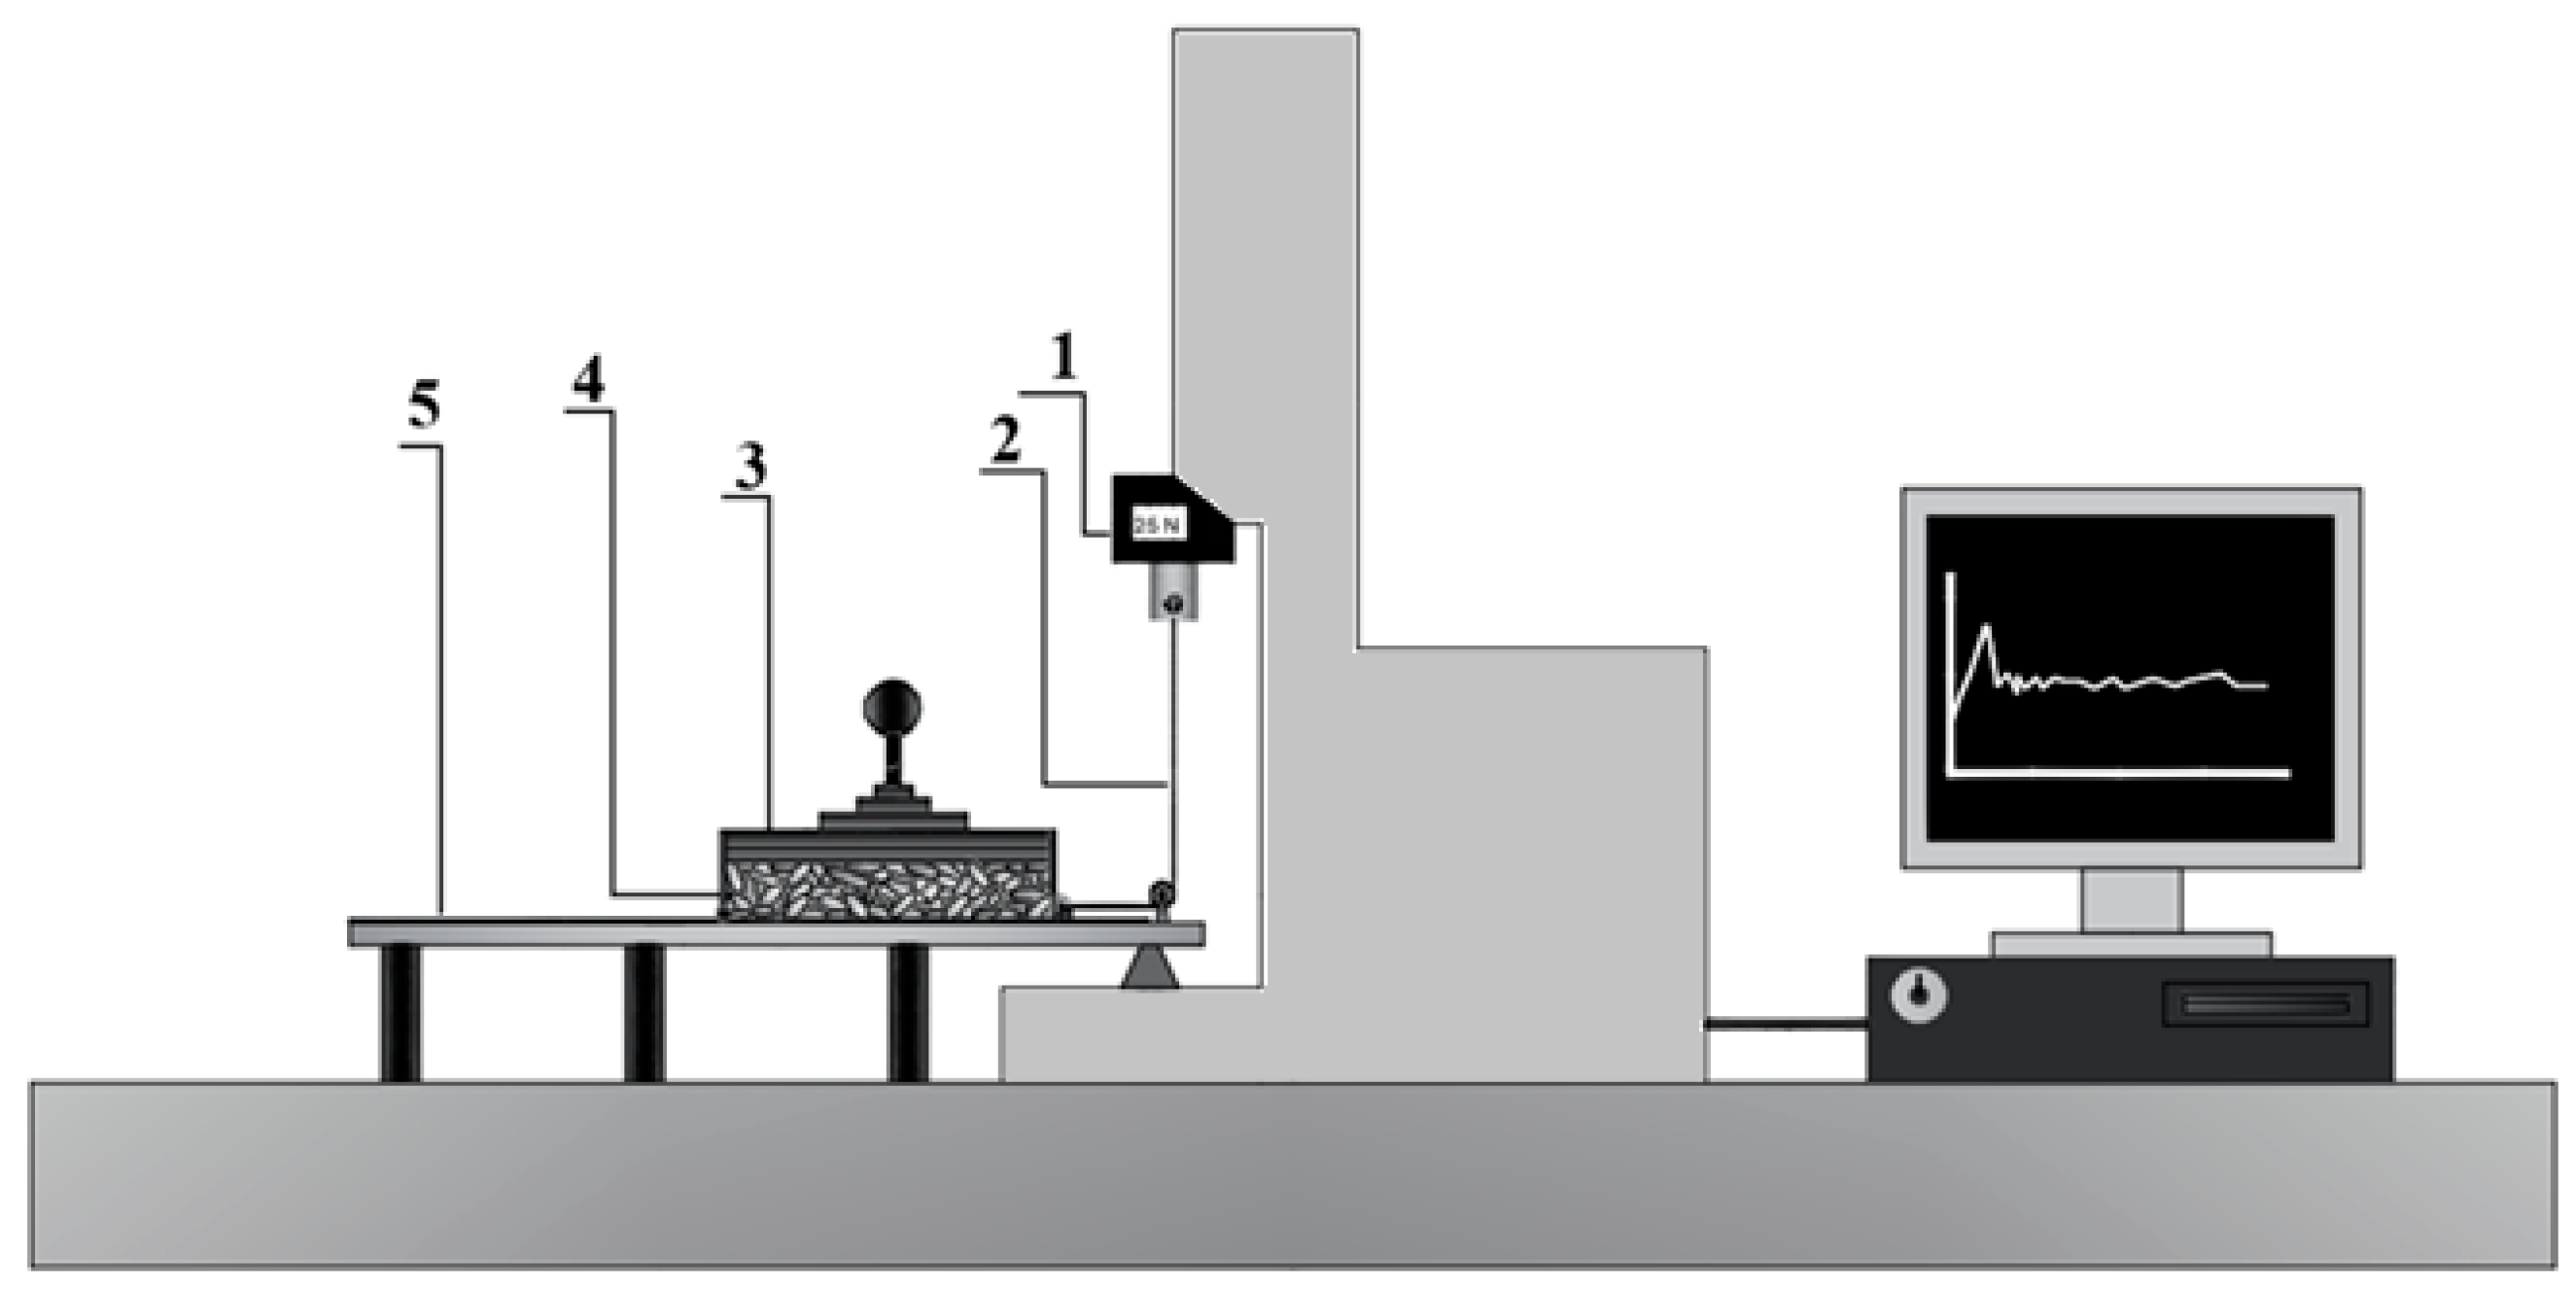
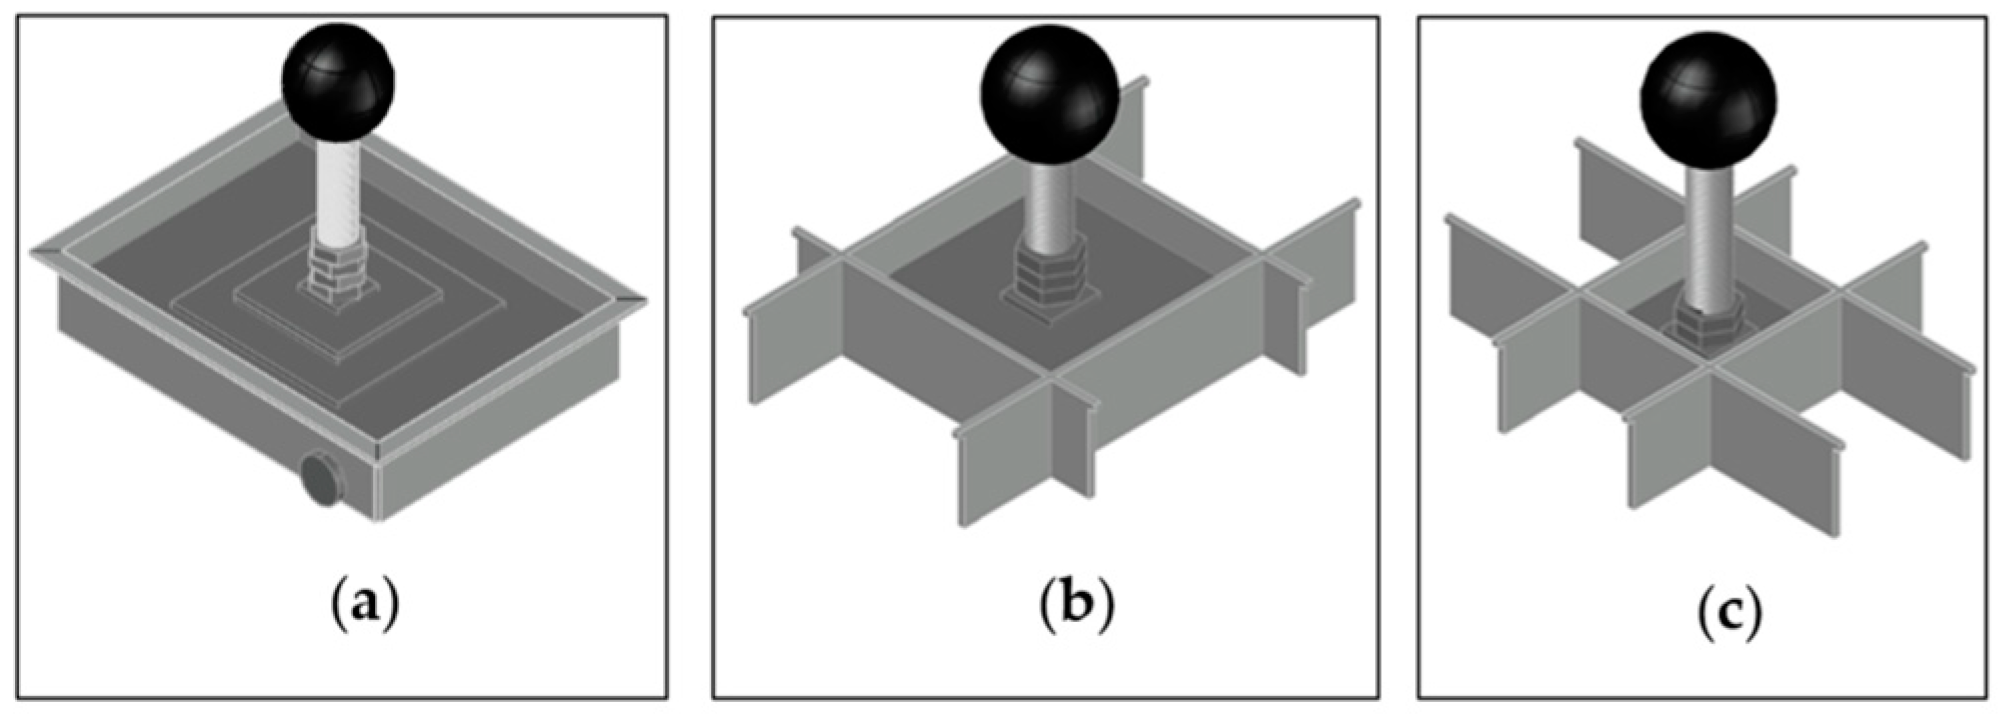
The force of static (Fsta) and kinetic (Fkin) friction was studied for four levels of moisture (Mc 9.5%, 13.5%, 17.5% and 21.5%). Obtaining the specified (assumed) moisture content was based on three steps: 1—determining the initial moisture content, using a laboratory dryer and a balance; 2—progressive wetting of the material with a specified (calculated) amount of water. The material in a hermetic container was constantly mixed and left to stabilize; 3—after this time (min 24 h) the sample of moistened material was weighed, then dried and weighed again. In this way, the actual moisture content of the material used in the tests was determined. To measure the force of friction, an universal testing machine was used (Figure 2). This machine was equipped with an attachment for measuring the friction of granular materials consisting of a table on which construction material (steel sheet) and a bottomless box with dimensions of 150 × 200 mm were placed. Additionally, the bottomless box was outfitted with two testing enclosures allowing for the measurement of force of friction on different surfaces with the dimensions of 105 × 105 mm and 65 × 65 mm (Figure 3). The bottomless box was attached to the head with a non-elastic cable.
The universal testing machine used provides stable measuring conditions. The sliding velocity of the sample for all tests was 60 [mm/min]. The accuracy of the sample movement velocity was ±0.03 mm/min. The measuring distance was 23 mm and the position accuracy was 0.01 mm. In measurements of friction force, a load cell was used with a measurement range up to 25 N. The friction force was recorded at a frequency of 500 Hz, in continuous mode for motion of the sample. For all surfaces the load was 36.6 N.
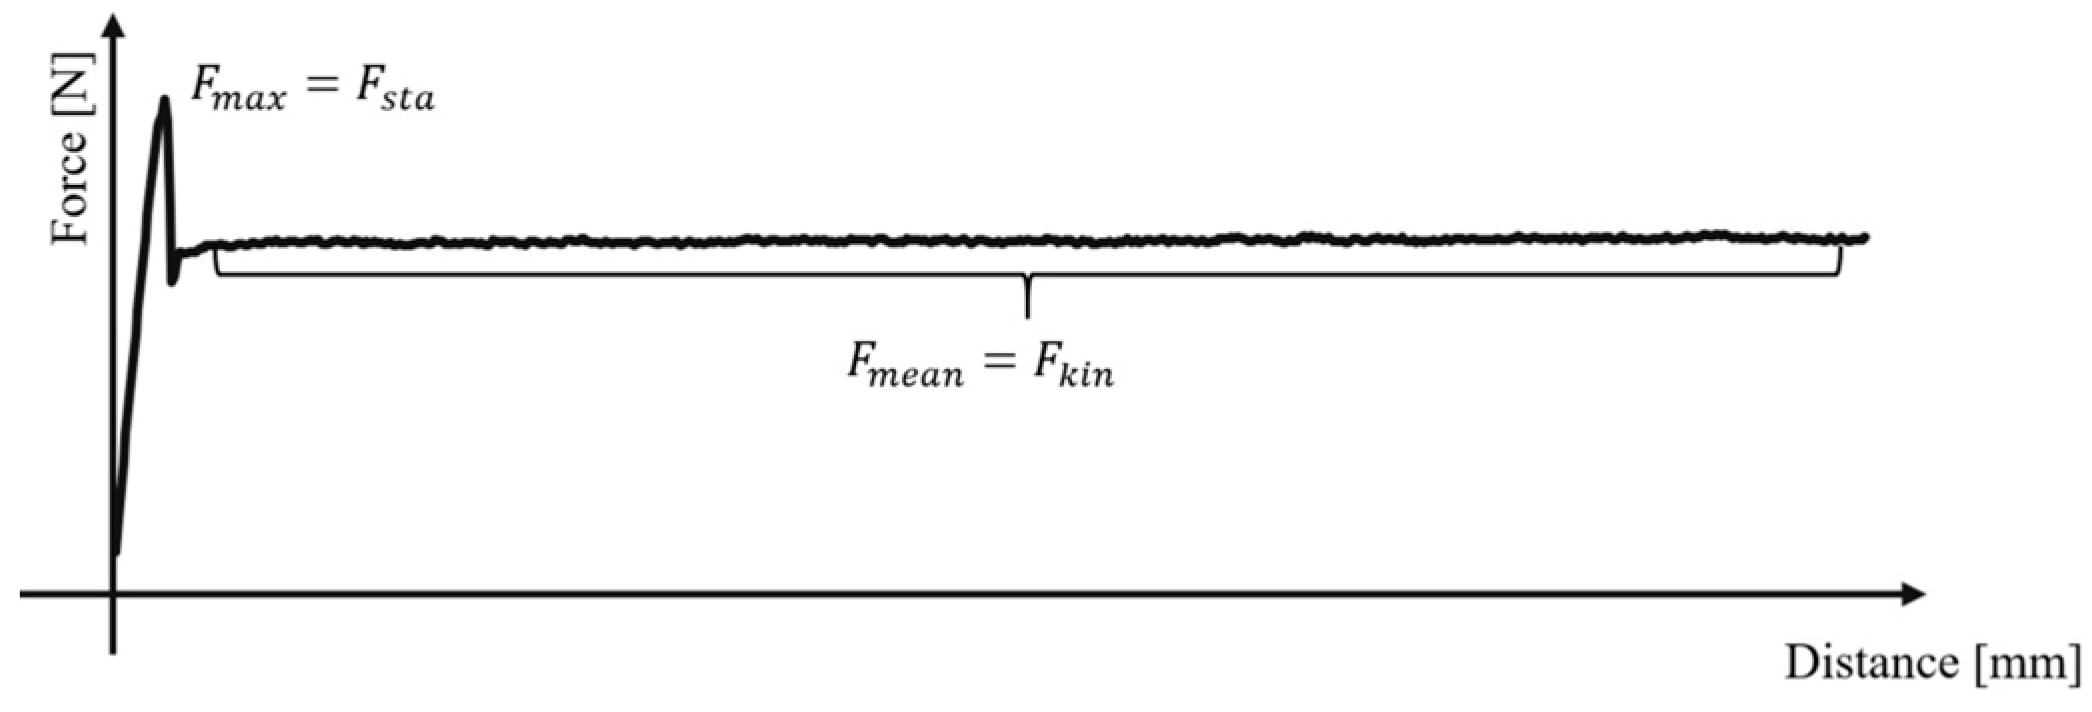
In all studied cases, the curve showing the force of friction was as in Figure 4, with a clearly visible maximum force (start of sample—force of static friction, Fsta) and a second phase in which the force of friction had a lower value (stabilizing—force of kinetic friction, Fkin).
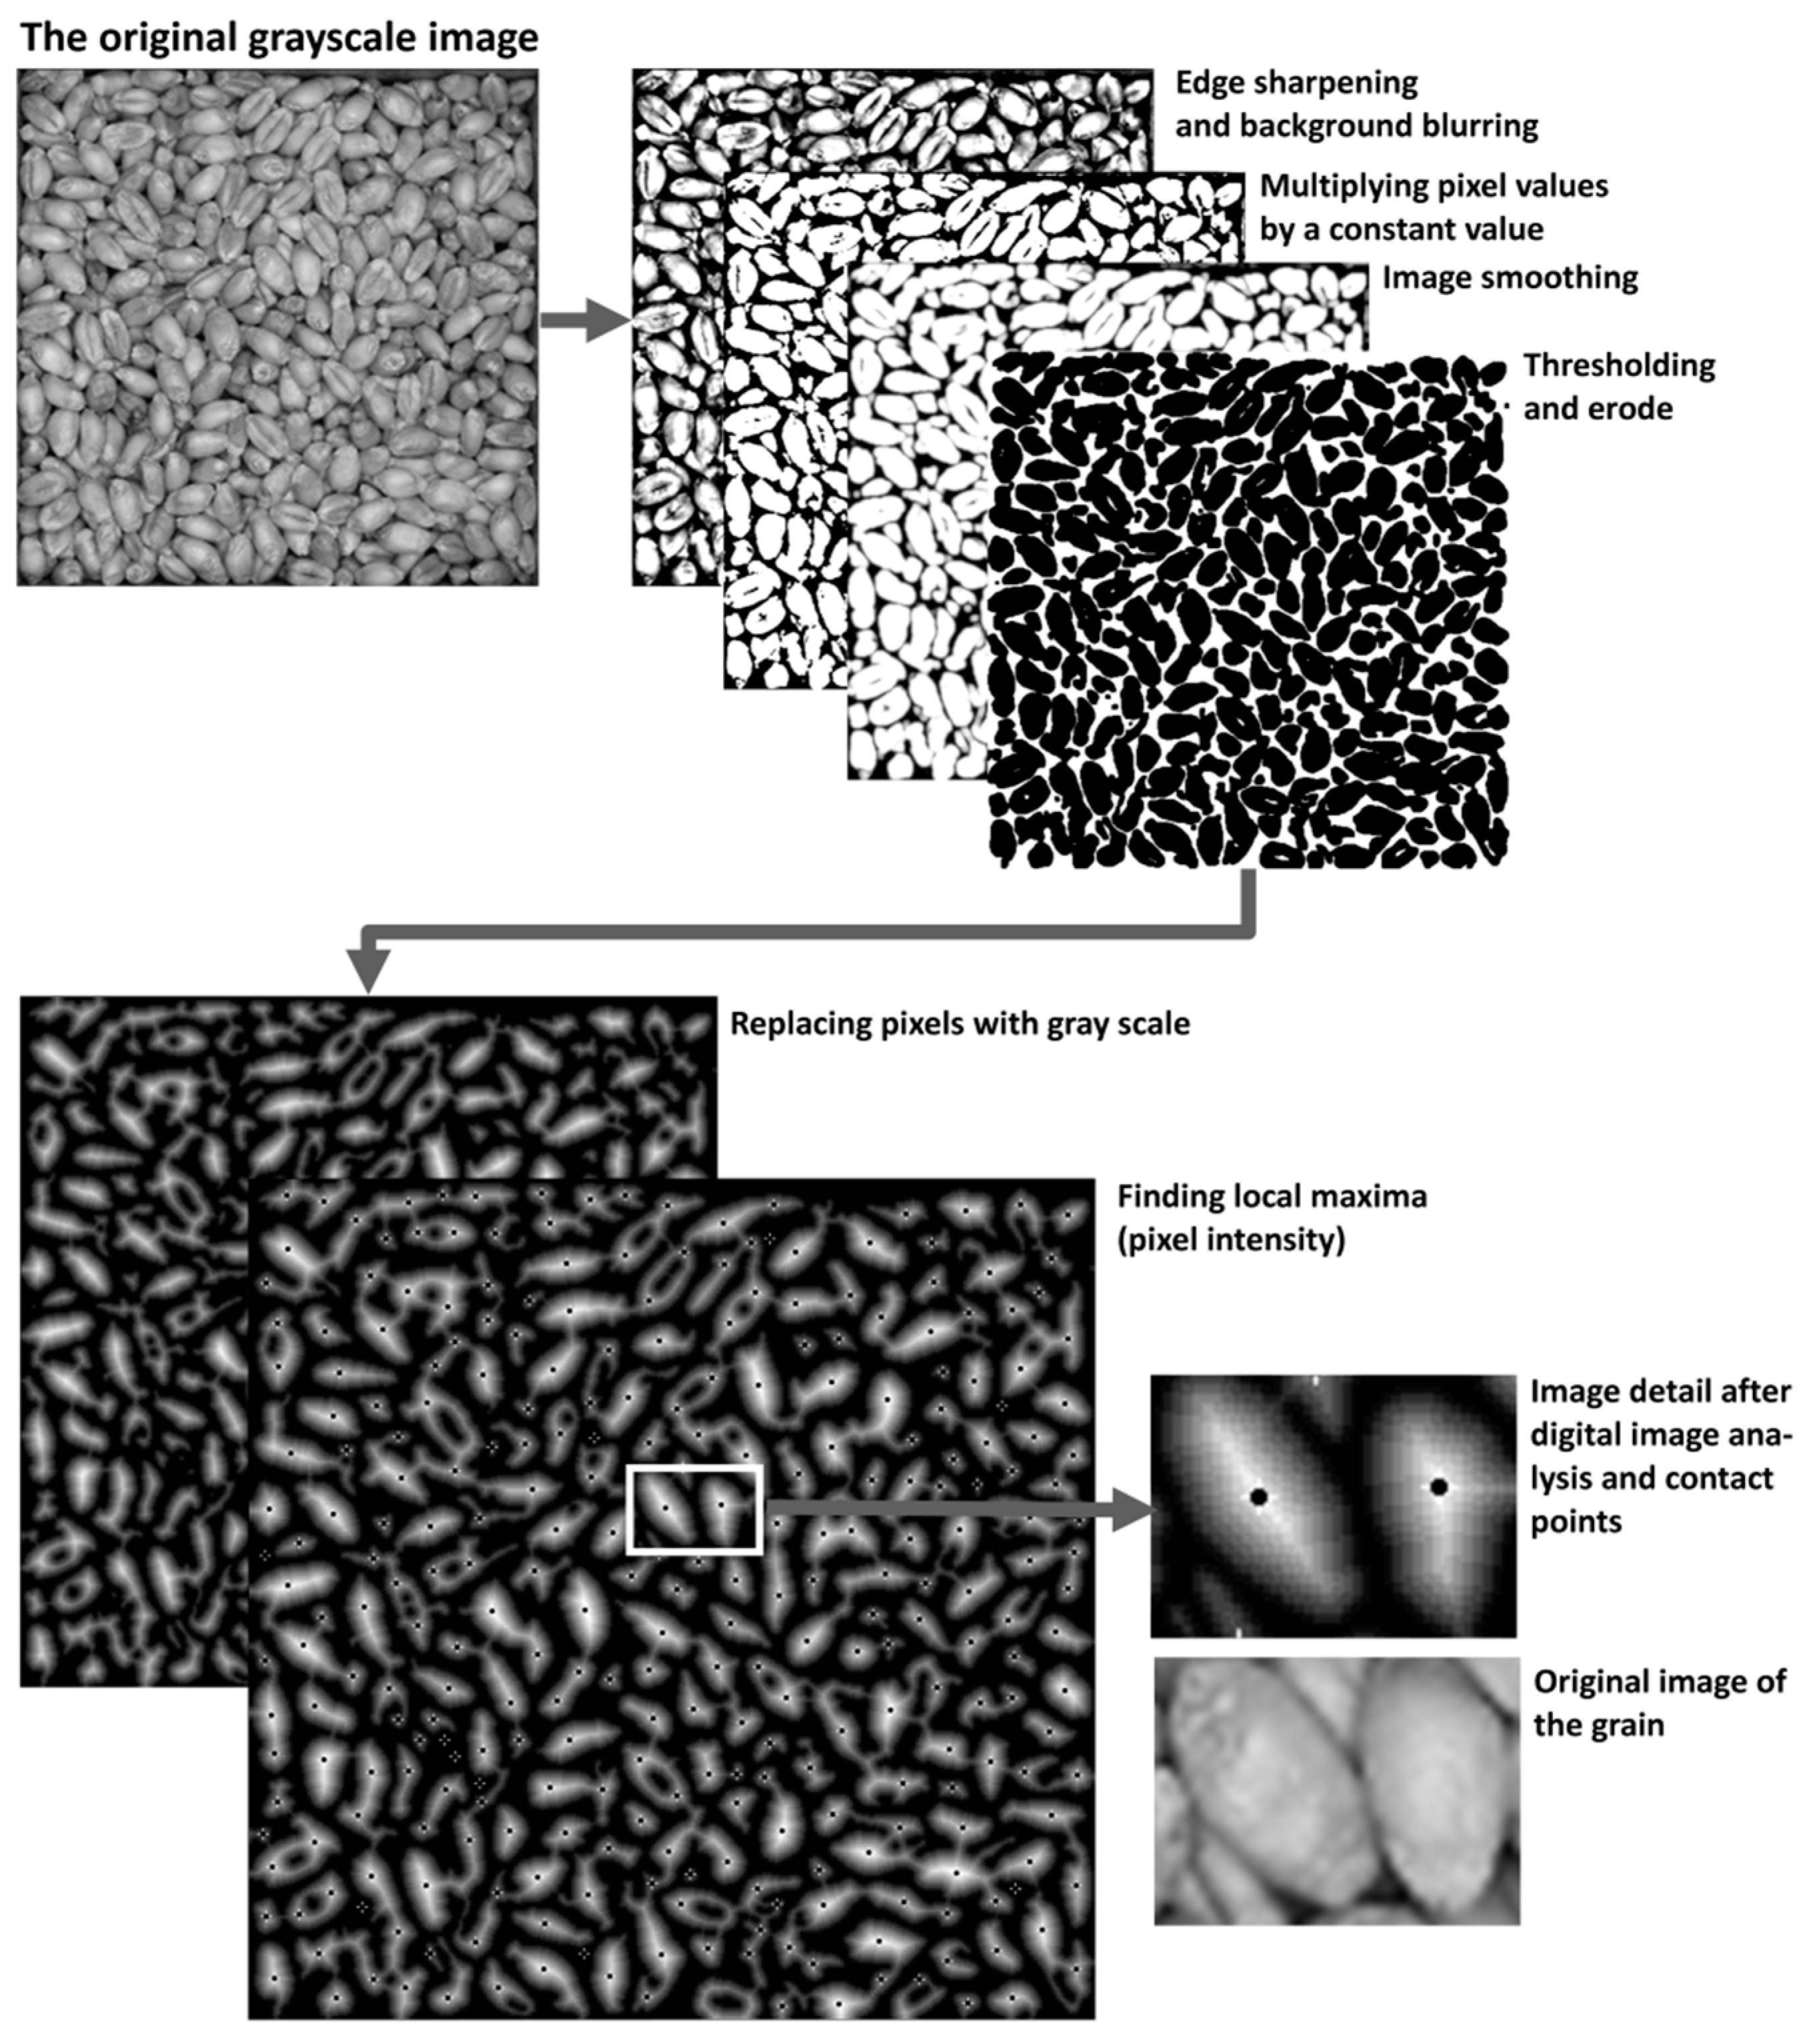
In order to determine of the number of contact points (Ncp) of the material with the smooth surface, a contact image of the material was made for each of the surfaces. After pouring the granular material into the bottomless box and loading it, a picture was taken. To determine the number of contact points, digital image analysis involving was performed. The algorithm of the performed analysis is presented in Figure 5.
In the first step of the analysis, edge sharpening and background blurring were performed. This allowed individual grains to be more visible against the black background. Because the grains are lighter than the background, the operation of multiplying the pixels by a certain constant value caused the grains to take on a white color. After smoothing the image (replacing each pixel by the mean value from neighboring pixels), thresholding, separating objects from the background, was performed. The black pixels of the objects (grains) were then converted to grayscale, such that its intensity depended on its distance to the nearest background pixel. This operation made it easy to find local maxima and contact points.

3. Results and Analysis

The following results were obtained in the studies conducted. Table 1 presents the number of contact points for wheat and buckwheat along with standard deviations for particular surfaces.
The results obtained, both for wheat and for buckwheat, demonstrate the impact of moisture level on the value of force of friction for all numbers of contact points studied.
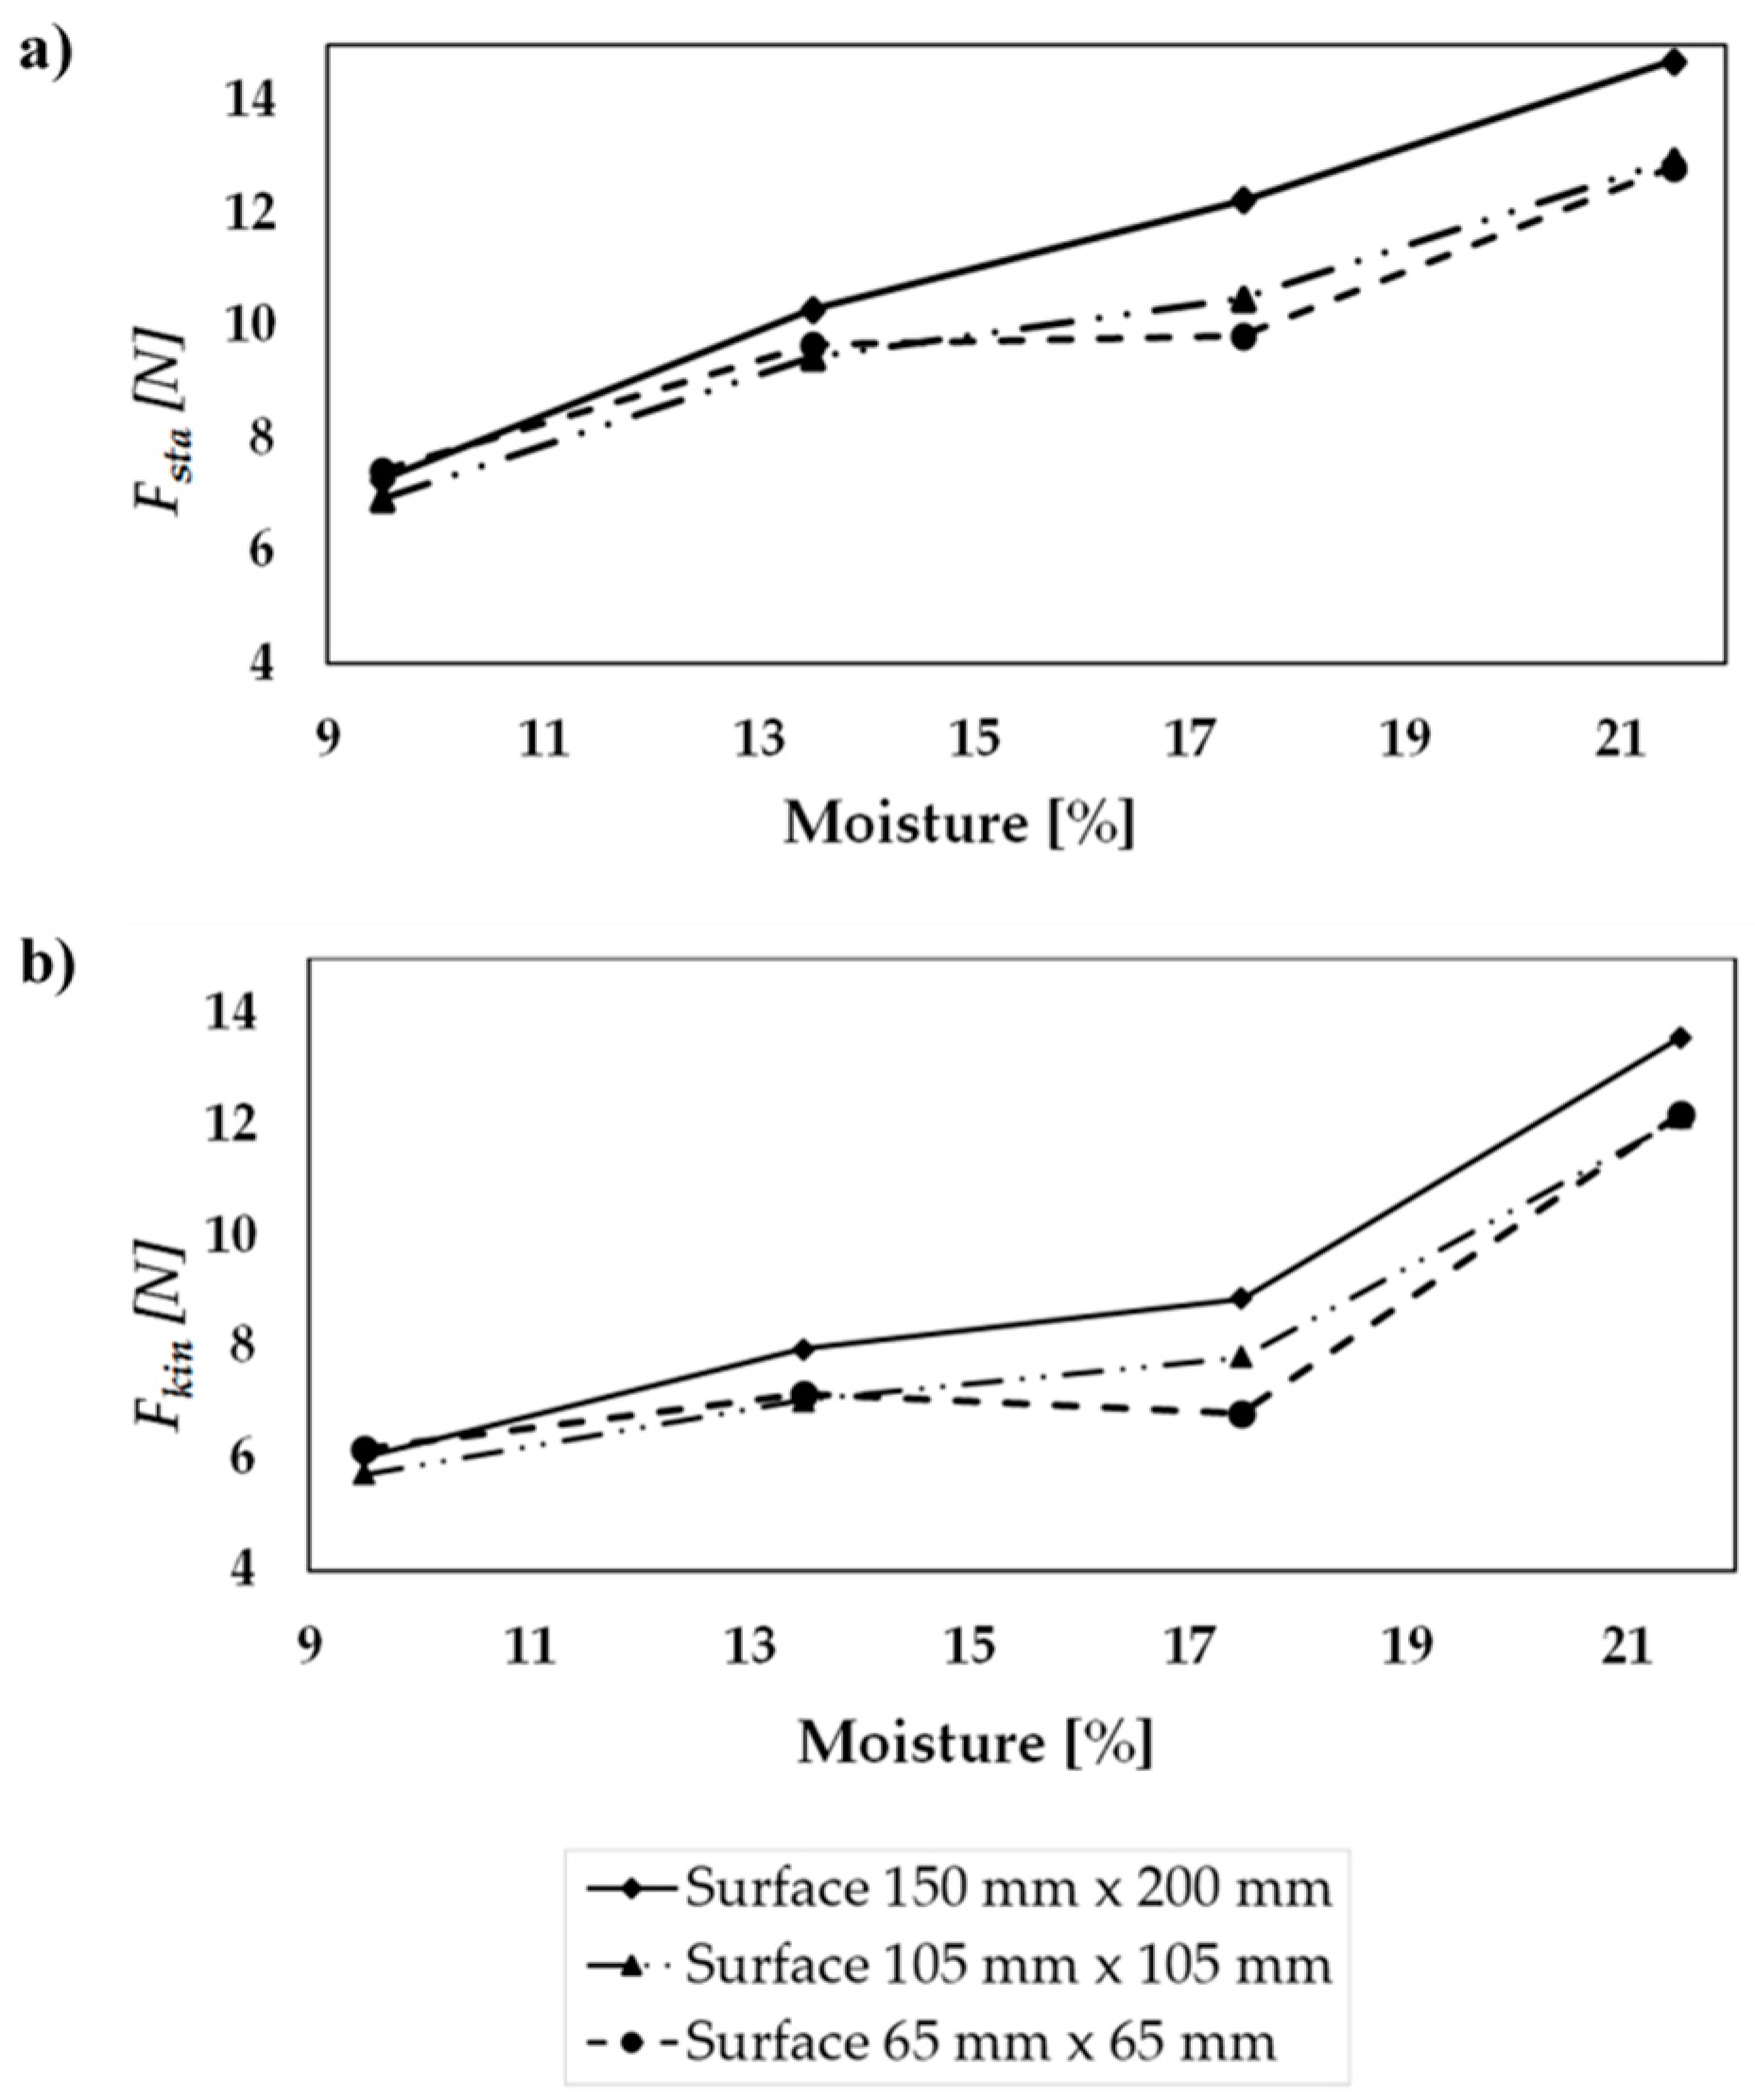
Figure 6 presents charts showing the relationship of force of static and kinetic friction to the moisture level of the material for wheat for particular surfaces.
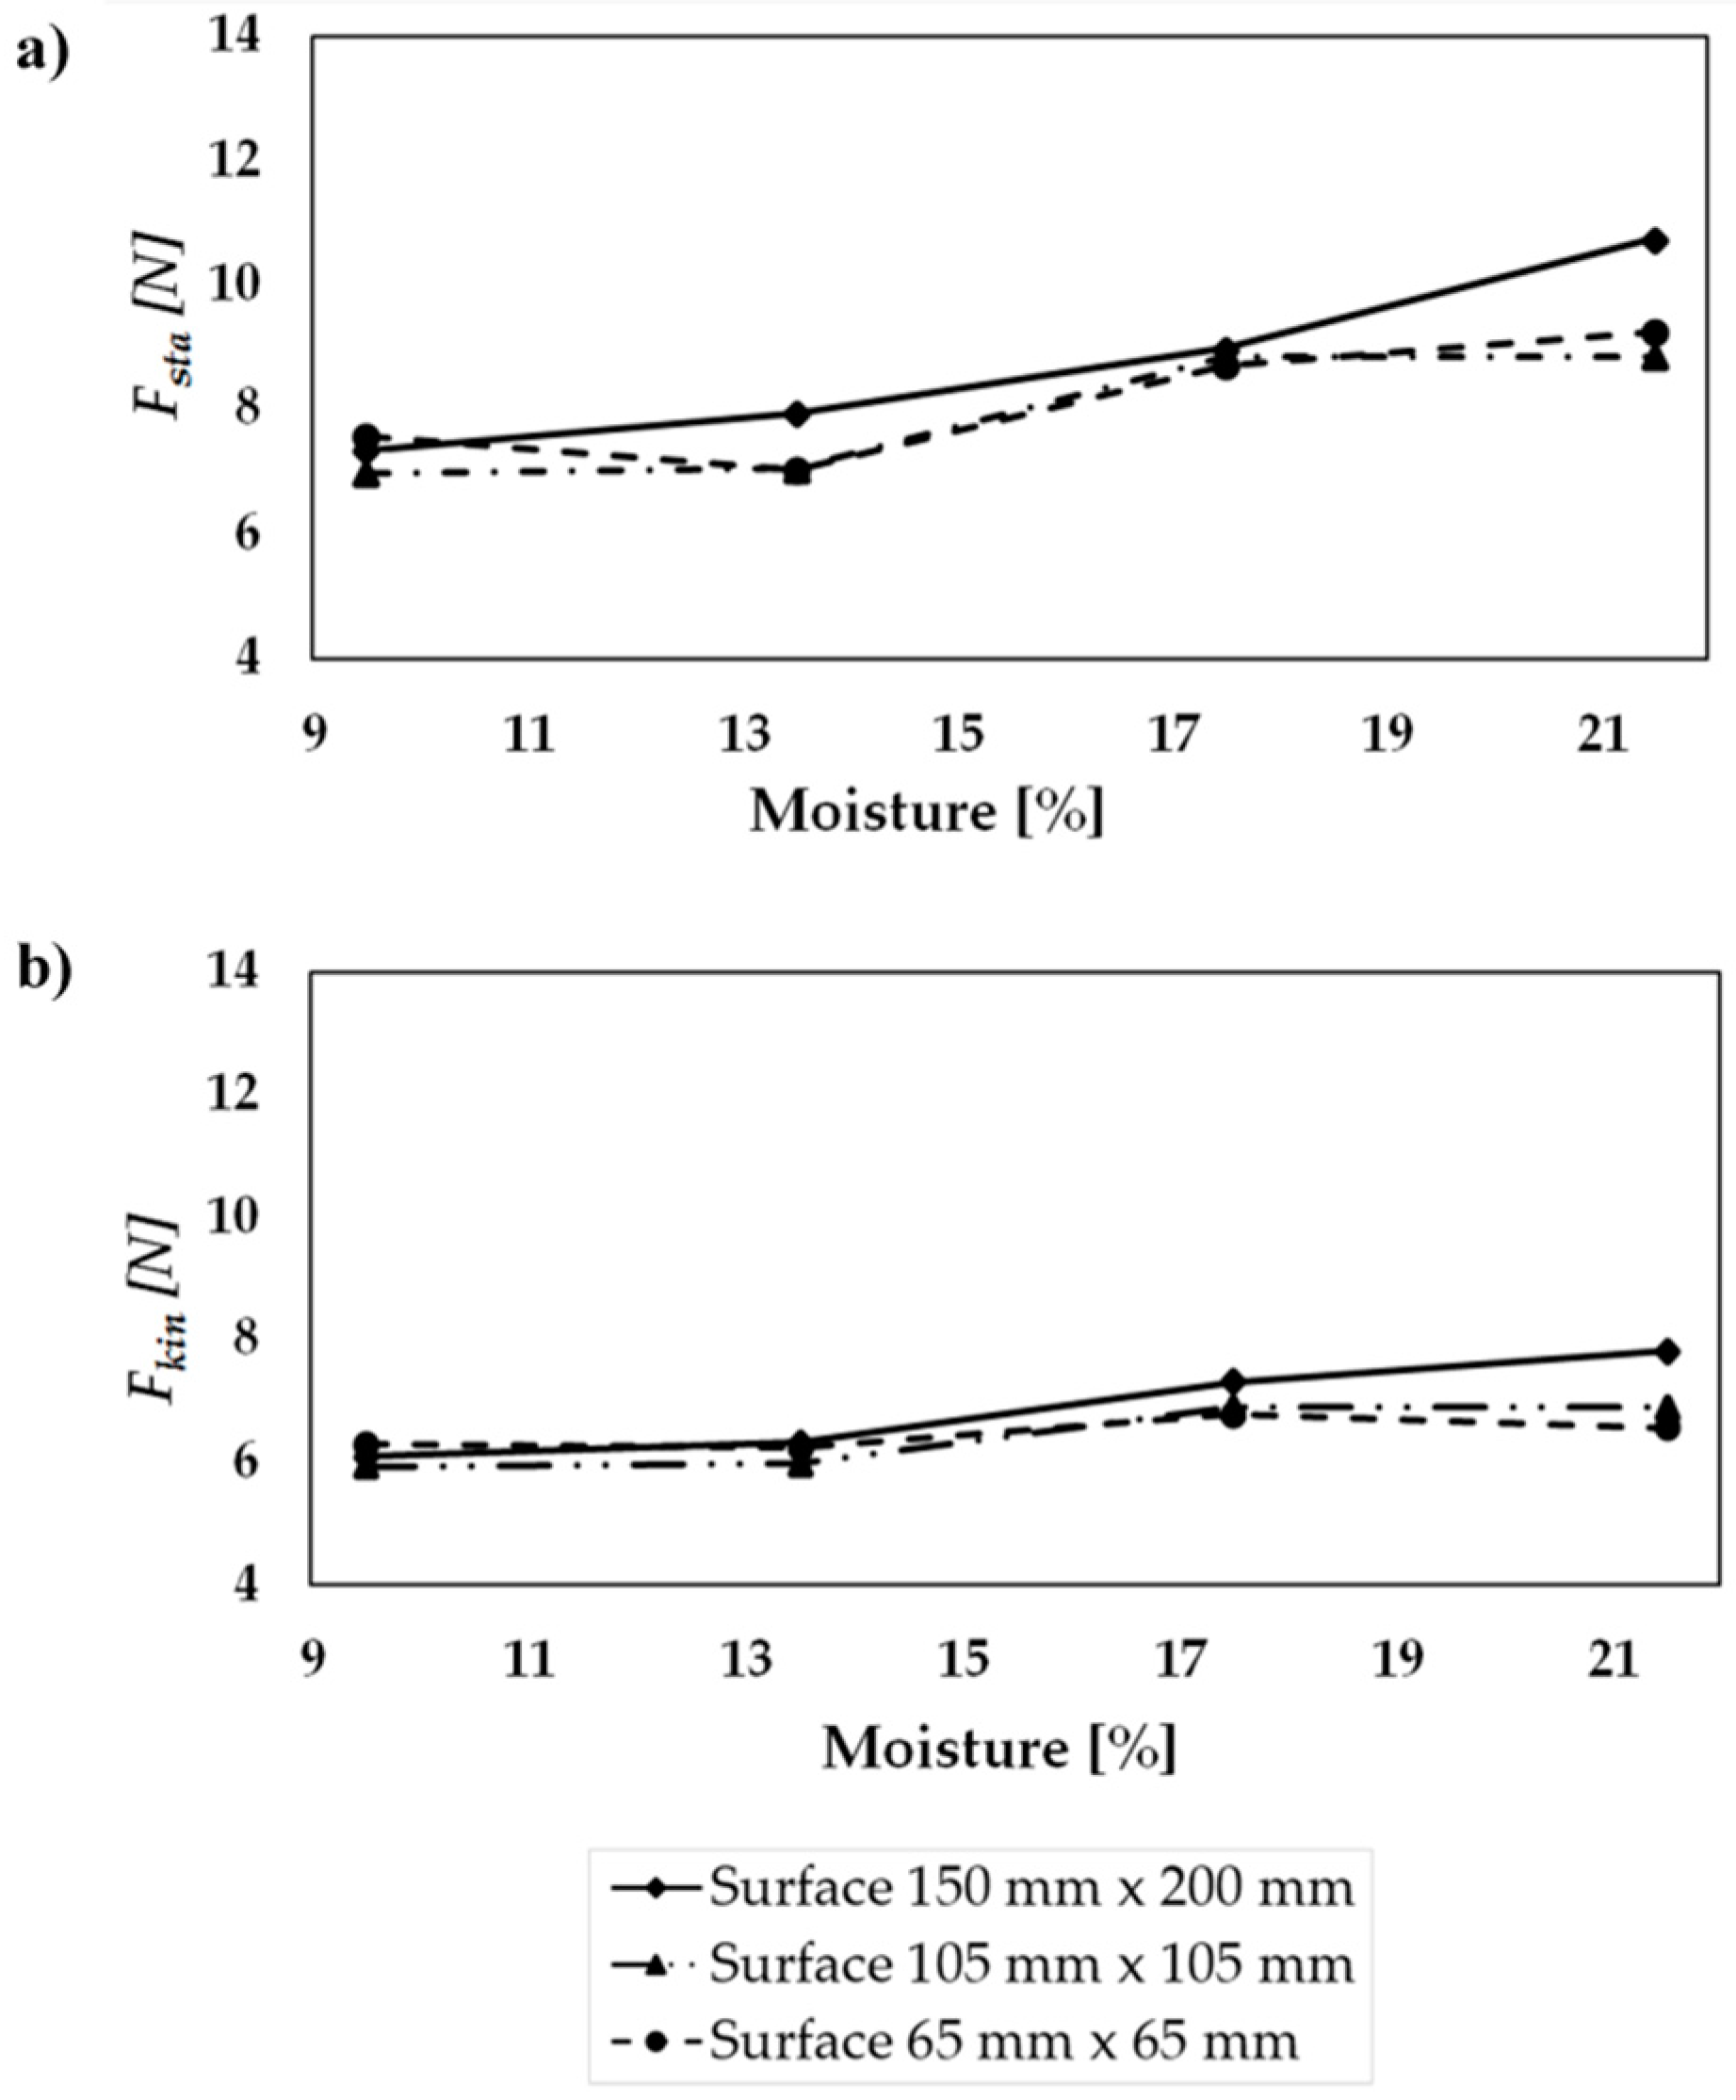
Figure 7 presents charts showing the relationship of force of static and kinetic friction to the moisture level of the material for buckwheat for particular surfaces.
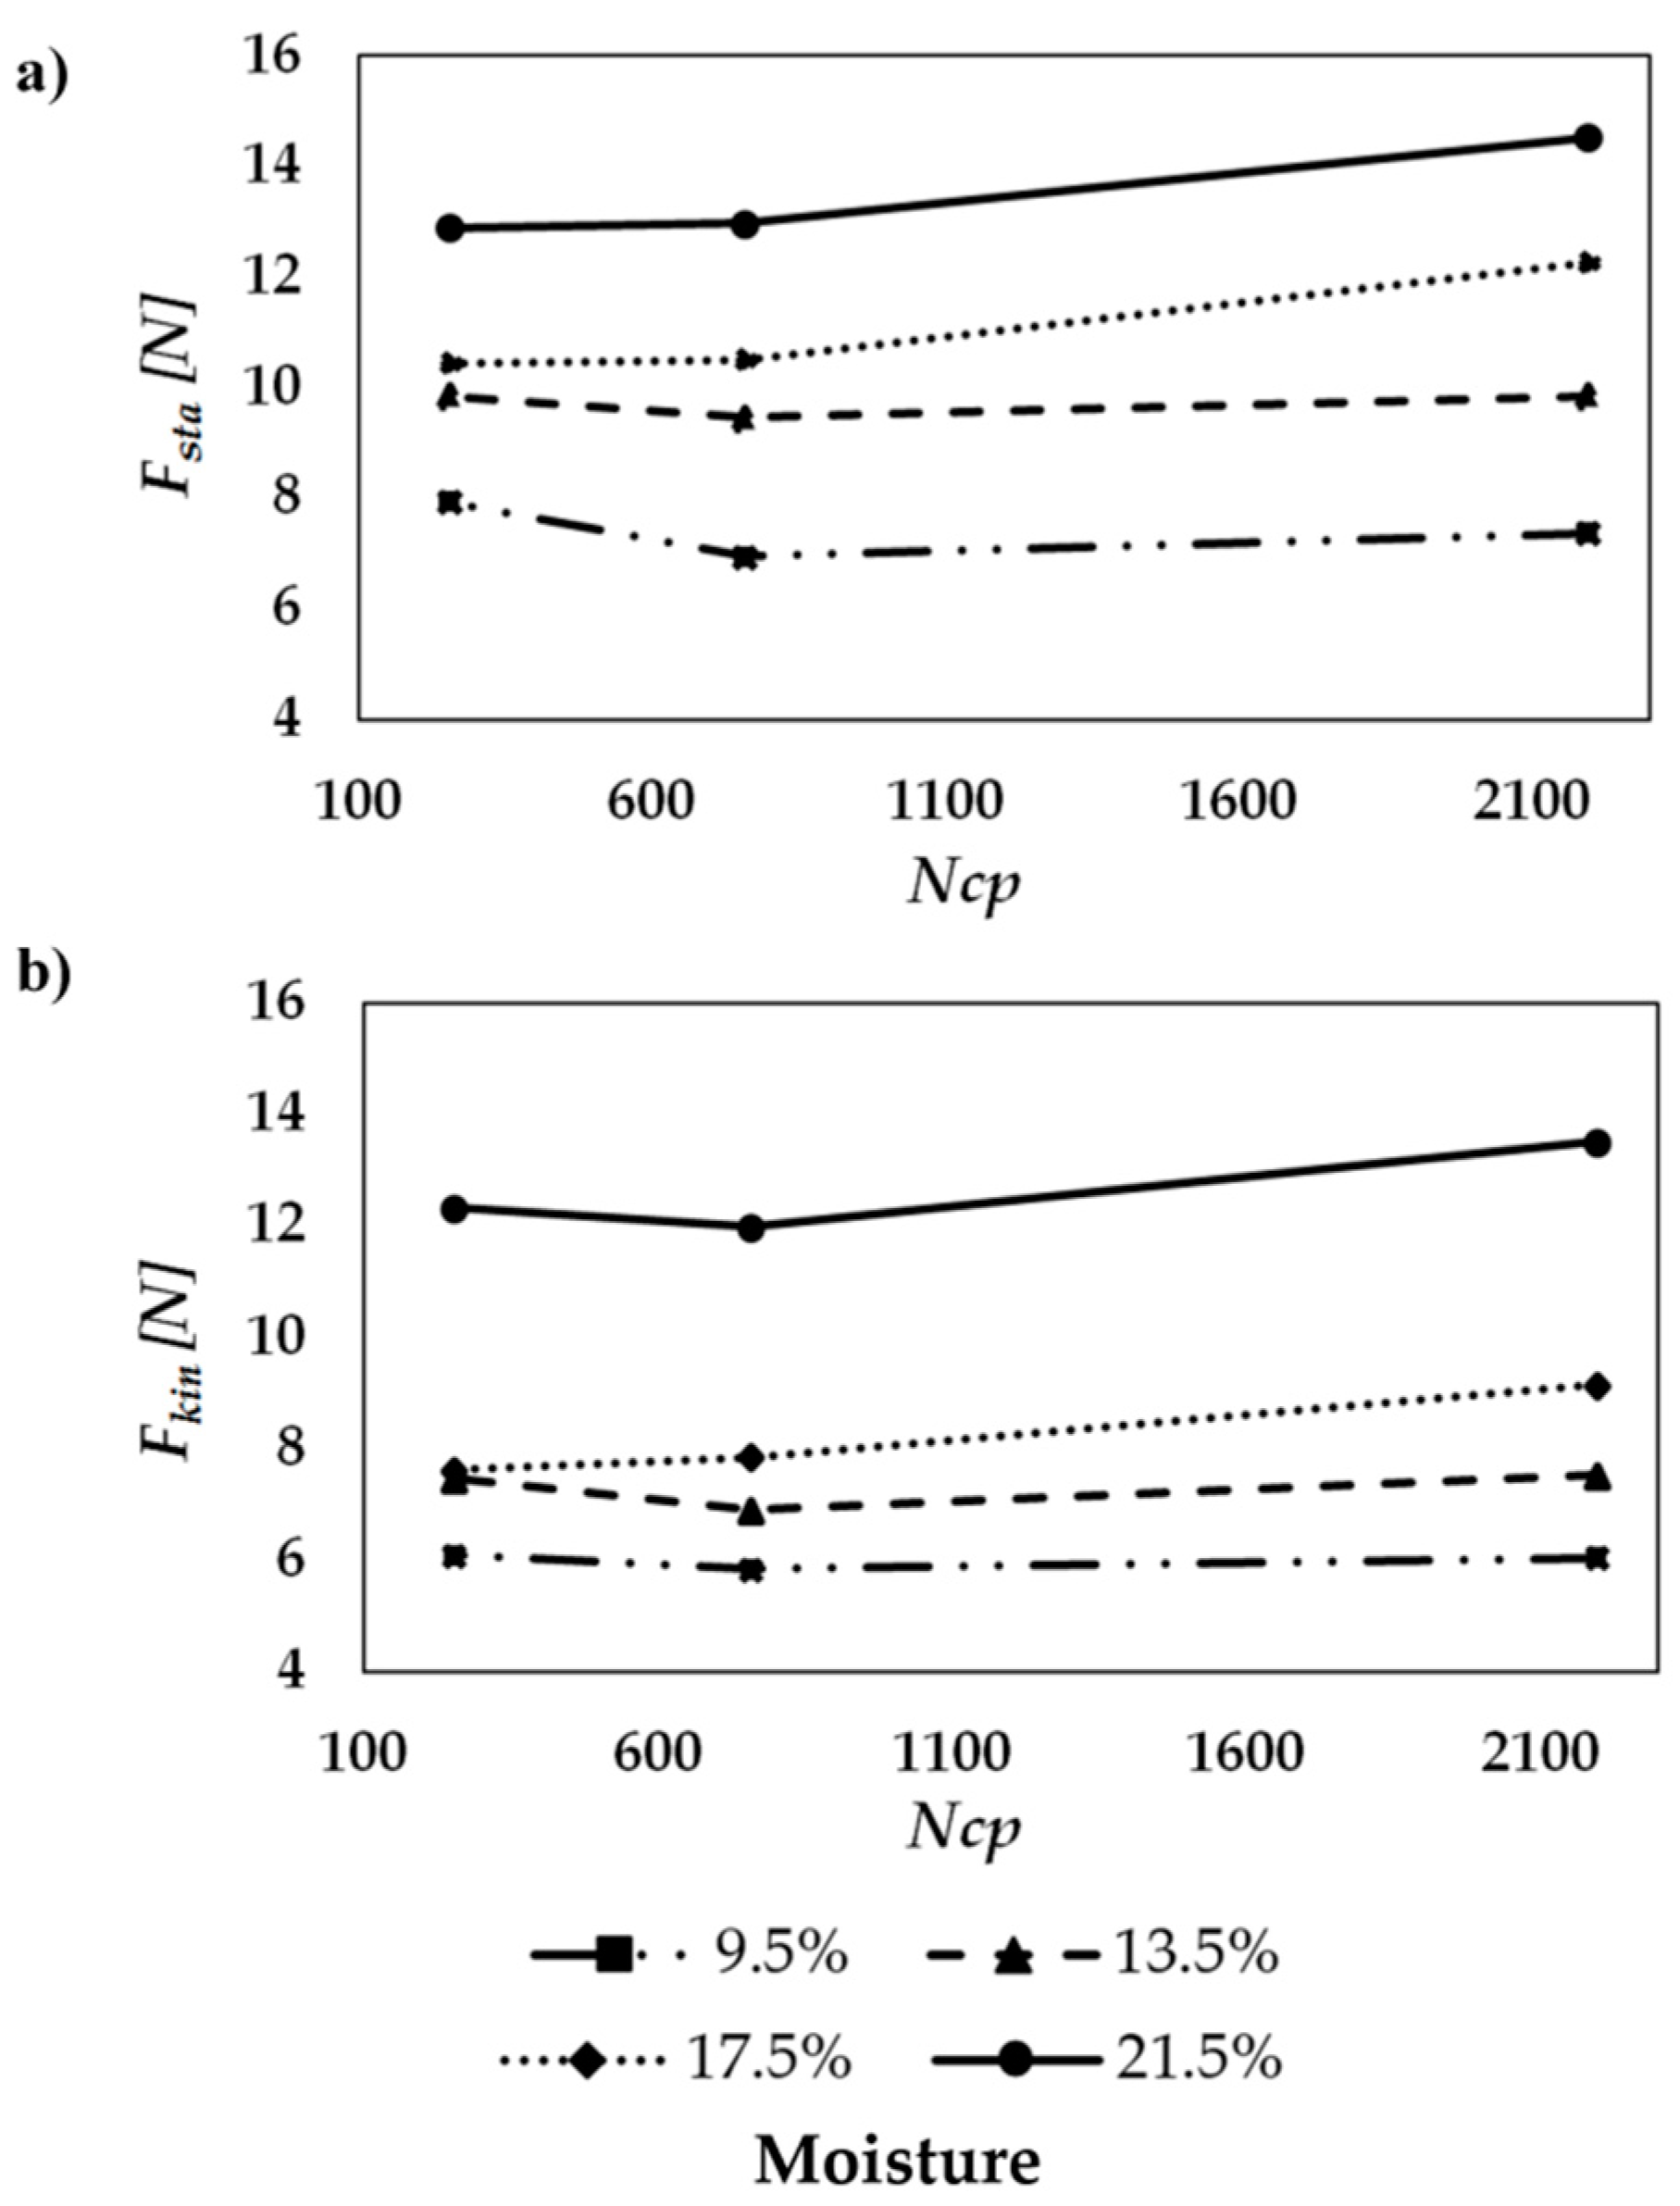
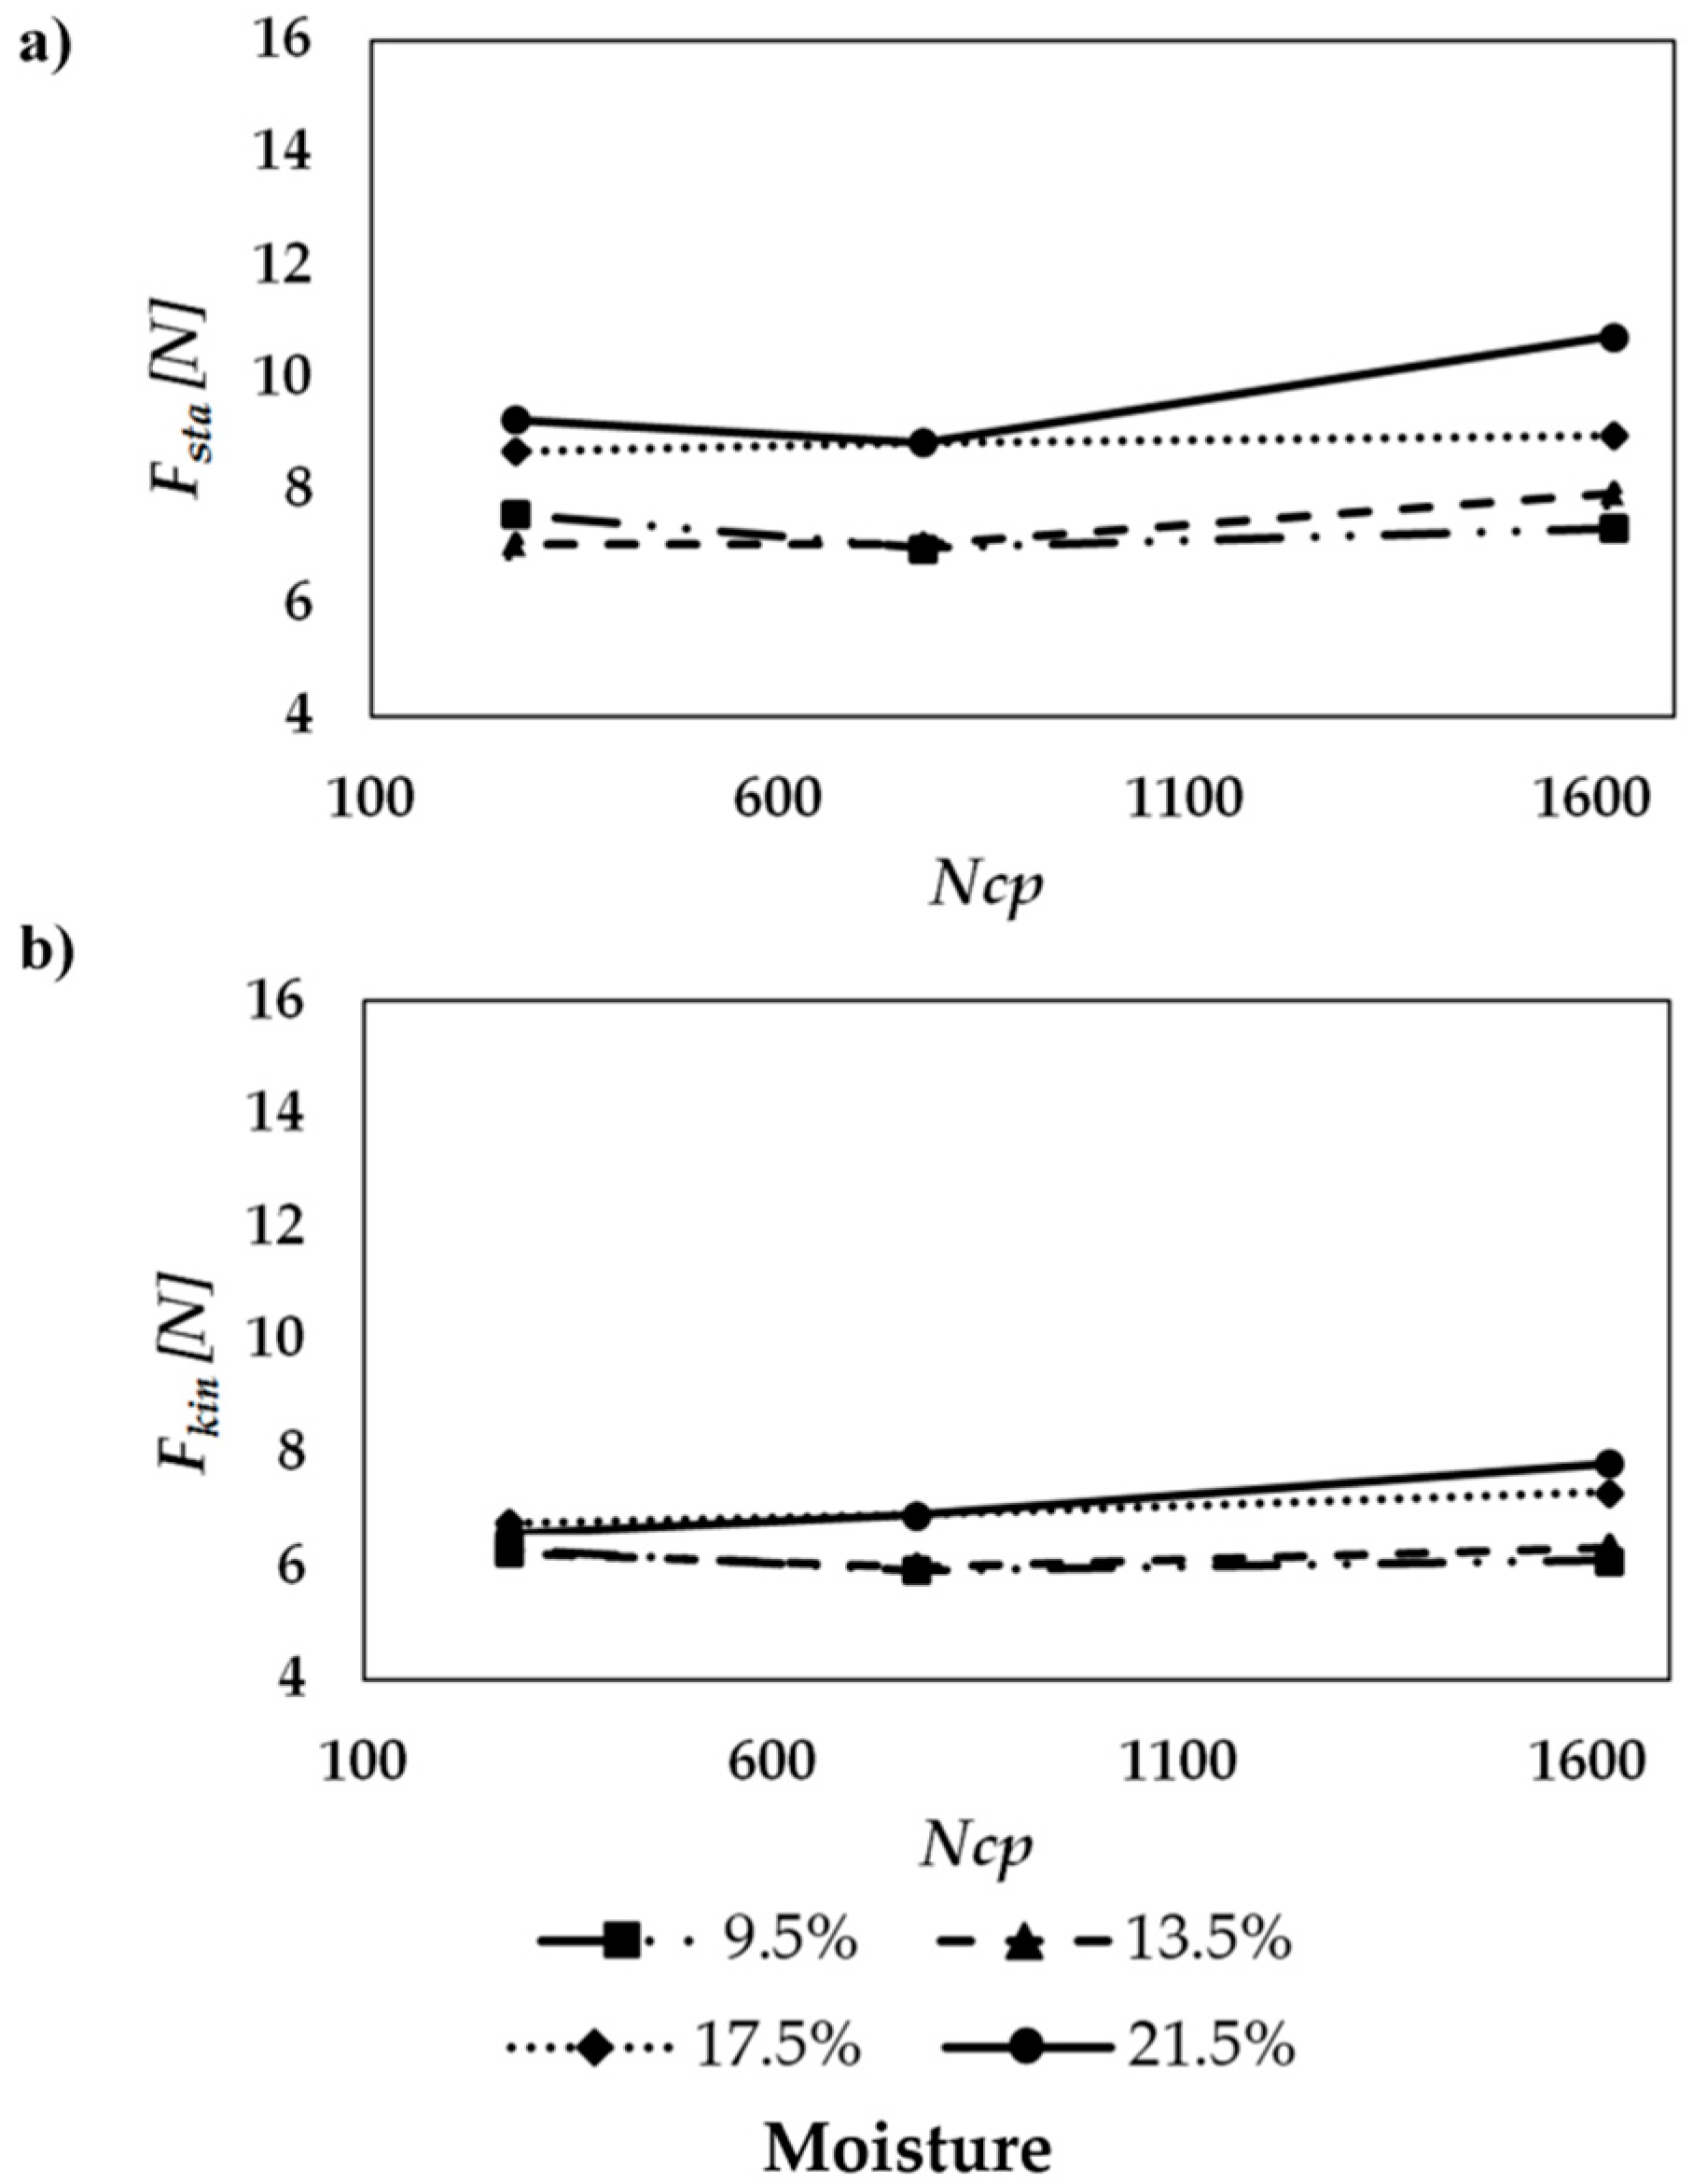
Figure 8 and Figure 9 present charts showing the relationship of force of static and kinetic friction for wheat and buckwheat respectively.
The first stage of analysis comprised an examination of the correlation between dependent variables (force of static and kinetic friction) and independent variables (moisture level and number of contact points). For determination of the correlation between data, the r-Pearson coefficient was applied. A matrix of correlation for the results obtained can be seen in Table 2.
In Table 2, a strong correlation can be seen between the forces of static and kinetic fiction and level of moisture, while the correlation between force of friction and the number of contact points is slight, which may lead to the conclusion that no such relationship exists. For this reason, a next step in analysis was undertaken, namely an analysis of the correlation between force of static and kinetic friction and the number of contact points for particular levels of moisture. The coefficients of correlation between static and kinetic friction and the number of contact points are presented in Table 3.
Based on Table 3, it can be seen that the correlation between the number of contact points and static and dynamic forces of friction rises along with an increase in moisture level. This is related to the increase in contact of the grains with the smooth surface [27] which occurs along with the increase in moisture level. It is probable that the role of adhesion phenomenon increases. The authors have not performed additional research on this phenomenon. However, this thesis, in regard to other authors’ studies on plant materials, seems very probable [18,28,29,30].
For this reason, an attempt was made to construct a model of multiple regression for force of static friction and for force of kinetic friction which would take into account the moisture level of the material and the number of contact points of the contact surface with each of the materials. For the analysis, Statistica (data analysis software system), version 12 was used. For both materials, the best fit was obtained for the model in the form of Equation (2). Table 4 presents the constant values of the model and an analysis of significance. In one case only was the constant c determined to be not significant.
F(sta/kin) = a·Mc + b·Ncp + c
A geometric interpretation of the obtained models (surfaces) is presented in Figure 10.

4. Summary and Conclusions

Two plant granular materials were studied (wheat, buckwheat) while in friction contact with a steel plate. Based on both statistical analysis and the surface analysis presented in Figure 10, it can be stated that the number of contact points has an impact on the observed force of friction. This is considerably more noticeable at higher levels of moisture (17.5, 21.5%) for the materials studied. The cause of this phenomenon may be related to the tendency towards greater adhesion of plant materials at higher levels of moisture.
The impact of the level of moisture on force of friction was also observed. This, however, is merely a confirmation of a fact which has been observed by many other researchers. The situation is similar with the high correlation between the forces of static and kinetic friction (Table 2). This issue is discussed in great depth in another article [7].
For both of the studied materials, the model which describes the relationship of the level of moisture of the number of contact points to the force of friction is the function F(sta/kin) = a·Mc + b·Ncp + c. It should also be mentioned that the R2 coefficients of determination are very high for a plant material, for which generally it is very difficult to achieve high repeatability of measurement results.

Author Contributions

Conceptualization, A.K.-J. and A.W.; methodology, A.K.-J.; validation, A.K.-J. and A.W.; formal analysis, A.K.-J. and A.W.; investigation, A.K.-J.; data curation, A.K.-J.; writing—original draft preparation, A.K.-J.; writing—review and editing, A.W.; visualization, A.K.-J.; supervision, A.W. All authors have read and agreed to the published version of the manuscript.

Funding

This research was financed by the Ministry of Science and Higher Education of the Republic of Poland.

Institutional Review Board Statement

Not applicable.

Informed Consent Statement

Not applicable.

Data Availability Statement

Data is contained within the article.

Conflicts of Interest

The authors declare no conflict of interest.

References

  1. Płaza, S.; Margielski, L.; Celichowski, G. Wstęp Do Tribologii i Trybochemia; Wydawnictwo uniwersytetu Łódzkiego: Łódź, Poland, 2015; pp. 5–13. [Google Scholar]
  2. Hebda, M.; Wachal, A. Trybologia; Wydawnictwo Naukowo-Techniczne: Warszawa, Polska, 1980; pp. 142–162. [Google Scholar]
  3. Maćkowiak, S. Własności Tribologiczne Układów Cząsteczek w Geometrii Szczeliny w Warunkach Kontrolowanego Ciśnienia Badane Metoda Dynamiki Molekularnej; Rozprawa Doktorska: Poznań, Polska, 2016. [Google Scholar]
  4. Slipek, Z.; Kaczorowski, J.; Fraczek, J. Theoretical and Experimental Analysis of Vegetable Materials Friction; PTIR: Krakow, Poland, 1999. (In Polish) [Google Scholar]
  5. Bek, M.; Gonzalez-Gutierrez, J.; Bregant, D.; Emri, I. Apparatus for measuring friction inside granular materials—Granular friction analyzer. Powder Technol. 2016, 288, 255–265. [Google Scholar] [CrossRef]
  6. Horabik, J.; Molenda, M. Właściwości fizyczne sypkich surowców spożywczych. Zarys Katalogu. Wydawnictwo Naukowe Instytutu Agrofizyki im. Bohdana Dobrzańskiego PAN w Lublinie. Acta Agroph. 2002, 74, 1–96. [Google Scholar]
  7. Wójcik, A.; Frączek, J.; Niemczewska-Wójcik, M. The relationship between static and kinetic friction for plant granular materials. Powder Technol. 2020, 361, 739–747. [Google Scholar] [CrossRef]
  8. Ajav, E.A.; Fakayode, O.A. Physical properties of moringa (Moringa oleifera) in relation to an oil expeller design. Agrosh. J. 2013, 13, 115–129. [Google Scholar] [CrossRef] [Green Version]
  9. Idowu, D.O.; Abegunrin, T.P.; Ola, F.A.; Adediran, A.A.; Olaniran, J.A. Measurement of some engineering properties of sandbox seeds (Huracrepitans). Agric. Biol. J. 2012, 2151–7525. [Google Scholar] [CrossRef]
  10. Işik, E. Moisture dependent physical and mechanical properties of organic beans (Phaseolus vulgaris L.). J. Food Agric. Environ. 2015, 11, 215–220. [Google Scholar]
  11. Izli, N. Effect of moisture on the physical properties of three varieties of kenaf seeds. J. Food Sci. Technol. 2015, 52, 3254–3263. [Google Scholar] [CrossRef] [Green Version]
  12. Markowska, A.; Warechowska, M.; Warechowski, J. Influence of moisture on external friction coefficient and basic physical properties of Astoria variety wheat grain. Tech. Sci. 2016, 19, 17–26. [Google Scholar]
  13. Mudryk, K.; Hutsol, T.; Wrobel, M.; Jewiarz, M.; Dziedzic, B. Determination of Friction Coefficients of Fast-Growing Tree Biomass. In Proceedings of the 18th International Scientific Conference Engineering for Rural Development, Jelgava, Latvia, 22–24 May 2019; pp. 1568–1573. [Google Scholar]
  14. Wrobel, M.; Fraczek, J.; Francik, S.; Ślipek, Z.; Mudryk, K. Modelling of unit contact surface of bean seeds using artificial neural networks. In Proceedings of the 12th International Scientific Conference Engineering for Rural Development, Jelgava, Latvia, 23–24 May 2013; pp. 287–291. [Google Scholar]
  15. Wójcik, A.; Frączek, J.; Wota, A.K. The methodical aspects of the friction modeling of plant granular materials. Powder Technol. 2019, 344, 504–513. [Google Scholar] [CrossRef]
  16. Aghkhani, M.; Miraei Ashtiani, S.; Baradaran Motie, J.; Abbaspour-Fard, M. Physical properties of Christmas Lima bean at different moisture content. Int. Agrophys. 2012, 26, 341–346. [Google Scholar] [CrossRef]
  17. Saracoglu, T.; Ozarslan, C. Moisture-dependent geometric, frictional, mechanical properties of cabbage (Brassica oleraceae L. var. vapitata) seeds. Philipp. Agric. Sci. 2012, 95, 53–63. [Google Scholar]
  18. Kara, M.; Bastaban, S.; Öztürk, I.; Kalkan, F.; Yildiz, C. Moisture-dependent frictional and aerodynamic properties of safflower seeds. Int. Agrophys. 2012, 26, 203–205. [Google Scholar] [CrossRef] [Green Version]
  19. Shafaei, S.M.; Kamgar, S. A comprehensive investigation on static and dynamic friction coefficients of wheat grain with the adoption of statistical analysis. J. Adv. Res. 2017, 8, 351–361. [Google Scholar] [CrossRef] [PubMed]
  20. Adebowale, A.A.; Fetuga, G.O.; Apata, C.B.; Sanni, L.O. Effect of Variety and Initial Moisture Content on Physical Properties of Improved Millet Grains. NIFOJ 2012, 30, 5–10. [Google Scholar] [CrossRef] [Green Version]
  21. Alibas, I.; Koksal, N. Determination of physical, mechanical, and structural seed properties of pepper cultivars. Int. Agrophys. 2015, 29, 107–113. [Google Scholar] [CrossRef] [Green Version]
  22. Lenart, A.; Pawlus, P.; Dzierwa, A.; Wos, S.; Reizer, R. The Effect of Surface Texture on Lubricated Fretting. Materials 2020, 13, 4886. [Google Scholar] [CrossRef]
  23. Sandeep, C.S.; Senetakis, K. Effect of Young’s Modulus and Surface Roughness on the Inter-Particle Friction of Granular Materials. Materials 2018, 11, 217. [Google Scholar] [CrossRef] [Green Version]
  24. Liang, G.; Schmauder, S.; Lyu, M.; Schneider, Y.; Zhang, C.; Han, Y. An Investigation of the Influence of Initial Roughness on the Friction and Wear Behavior of Ground Surfaces. Materials 2018, 11, 237. [Google Scholar] [CrossRef] [Green Version]
  25. Askari, E.; Abbaspour-Gilandeh, Y.; Shojaei, S. Determination of dynamic friction coefficient of paddy grains on different surfaces. Int. Agrophys. 2010, 24, 101–105. [Google Scholar]
  26. Kabas, O.; Ozmerzi, A. Relationship between the friction coefficient and velocity of two cactus pear (Opuntiaficusindia L.) cultivars on different surfaces. Int. J. Food Sci. Technol. 2009, 44, 100–105. [Google Scholar] [CrossRef]
  27. Mudryk, K.; Francik, S.; Frączek, J.; Slipek, Z.; Wrobel, M. Model of actual contact area of rye and wheat grains with flat surface. In Proceedings of the 12th International Scientific Conference Engineering for Rural Development, Jelgava, Latvia, 23–24 May 2013; pp. 292–296. [Google Scholar]
  28. Wiącek, J.; Molenda, M.; Horabik, J. Mechanical properties of granular agro-materials. Continuum and discrete approach. Wydawnictwo Naukowe Instytutu Agrofizyki im. Bohdana Dobrzańskiego PAN w Lublinie. Acta Agroph. 2011, 190, 152. [Google Scholar]
  29. Eissa, A.A. Physical and aerodynamic properties of flaxseeds for proper separation by using airstream. J. Food Process Eng. 2011, 34, 983–1012. [Google Scholar] [CrossRef]
  30. Cetin, M. Physical properties of barbunia bean (Phaseolus vulgaris L. cv. ‘Barbunia’) seed. J. Food Eng. 2007, 80, 353–358. [Google Scholar] [CrossRef]
Figure 1. Individual particles of material: (a) wheat, (b) buckwheat.
Processes 09 00215 g001
Figure 2. Diagram of the testing machine: 1. Load cell, 2. Cable, 3. Load, 4. Bottomless box, 5. Steel sheet.
Processes 09 00215 g002
Figure 3. Instrumentation for measurement of force of friction on various surfaces: (a) bottomless box, (b) enclosure with dimensions of 105 × 105 mm, (c) enclosure with dimensions of 65 × 65 mm.
Processes 09 00215 g003
Figure 4. A chart showing the relationship of force of friction to distance.
Processes 09 00215 g004
Figure 5. Algorithm of used digital image analysis for a sample image.
Processes 09 00215 g005
Figure 6. A chart showing the relationship of force of friction to the moisture level of wheat: (a) static friction, (b) kinetic friction.
Processes 09 00215 g006
Figure 7. A chart showing the relationship of force of friction to the moisture level of buckwheat: (a) static friction, (b) kinetic friction.
Processes 09 00215 g007
Figure 8. A chart showing the relationship of force of friction to the number of contact points for wheat: (a) static friction, (b) kinetic friction.
Processes 09 00215 g008
Figure 9. A chart showing the relationship of force of friction to the number of contact points for buckwheat, (a) static friction, (b) kinetic friction.
Processes 09 00215 g009
Figure 10. Graphic interpretation of the obtained models (a) force of static friction for wheat (b) force of kinetic friction for wheat (c) force of static friction for buckwheat (d) force of kinetic friction for buckwheat.
Processes 09 00215 g010
Table 1. Number of contact points (Ncp) for wheat and buckwheat on three surfaces.
Surfaces
[mm]
WheatBuckwheat
Mean NcpStandard DeviationMean NcpStandard Deviation
150 × 2002194184.203162446.476
105 × 10575753.03577758.731
65 × 6525322.29827623.373
Table 2. Correlation matrixes for both materials (R2).
WheatBuckwheat
McNcpFstaFkinMcNcpFstaFkin
Mc10.0000.9580.91510.0000.8540.768
Ncp0.00010.1630.1360.00010.2540.344
Fsta0.9580.16310.9460.8540.25410.924
Fkin0.9150.1360.94610.7680.3440.9241
Table 3. Correlation factors (R2) of the force of static and kinetic friction with the number of contact points for particular levels of moisture.
McWheatBuckwheat
FstaFkinFstaFkin
9.5%−0.2890.096−0.245−0.377
13.5%0.2930.3790.9270.325
17.5%0.9700.9910.7790.972
21.5%0.9800.8980.8220.991
Table 4. Values of regression parameters for particular model (2).
Parameters of the ModelValue of the Parameterp-ValueR2
Wheat
Fstaa48.73660.0000000.9723
b0.00040.000311
c2.38910.000000
Fkina51.79340.0000000.9255
b0.00040.045965
c0.06550.918859
Buckwheat
Fstaa21.11800.0000000.8915
b0.00050.002853
c4.56060.000000
Fkina9.46190.0000000.8420
b0.00030.000857
c4.83670.000000
Publisher’s Note: MDPI stays neutral with regard to jurisdictional claims in published maps and institutional affiliations.