1. Introduction
With distributed systems and the emergence of Field Area Networks (FANs), it has become possible to collect data from sensors distributed across geographically dispersed areas, while their processing was done centrally and at the edge in Programmable Logic Controllers (PLCs) [
1]. The data collected are as simple as an itemized list of assets’ serial numbers, purchase dates, prices, and costs published later in reports, or more sophisticated automated monitoring and system recordings from periodic checks and record changes on to be managed devices and equipment, providing the resulting data to accounting as well as to other control applications [
2].
Asset management is important for the constant evaluation of parameters in any organization, a contribution can be made to a high-availability solution also for small and medium-sized enterprises [
3]. It is important for an organization to achieve sustainable principles as they align the organizational activities with clearly defined goals and benchmarks [
4]. It refers to a methodical procedure of developing, operating, maintaining, upgrading, and disposing of assets in the most profitable manner including all costs, risks, and performance attributes.
These procedures use tools that collect the data needed for tracking, accounting, and managing hardware, software, and system resources. Complex production systems are generally vulnerable to disturbances that might lead to possible Overall Equipment Efficiency (OEE) degradation [
5]. There could be trade-offs between the performance indicators, which means that if one indicator’s value increases the other’s value decreases, i.e., the major trade-off could be between the quality, cost, time, delivery reliability, and flexibility [
6].
Automation Systems—must be modular, open, agile, and knowledge-based—to promptly “self-adapt” themselves to changing exogenous conditions, like consumers’ expectations, market dynamics, design innovation, new materials, and components integration. Software component development regarding user interface in visualization software follows goals, e.g., “easy to learn” or “easy to use”, however, such specification does not state much about user interface behavior. In usability engineering approaches recommended for the assessment of the user performance and user experience, as well as the analysis of the user interface impact on the system architecture, these goals are usually evaluated only at the later stages of the software system lifecycle. When initial designs do not match the expectations of the end-users and require an iteration and an enhancement, these iterations may slow down the progress of the overall development, and then the integration of the software components itself into the distributed system architectures, which contradicts time-critical agile processes [
7]. Automation Systems can assist end-users with the advanced image recognition of industrial objects by implementing automatic segmentation modules [
8].
The ability to learn is the fundamental mark of intelligence. Artificial Intelligence (AI) [
9,
10] strives to build intelligent entities as well as to understand them. With legacy systems in distributed environments, in the event of a failure of execution of an instruction or working component, such failure can put the entire operation at risk. The operator then must manually go through the list of events, check the reason for the failure, and evaluate the next step(s). Therefore, in distributed environments, AI opens an opportunity for the adoption of machine learning and lowers the barrier to entry for engineers using AI technology to solve problems or for companies to introduce new processes by adding intelligent components to existing engineering tools [
11]. AI applications can help to shorten the detection time of the fault improving the process running in no delayed time.
AI has been proven to improve the productivity and efficiency of industrial plants. Industries use predictive maintenance rather than preventive maintenance, and the results show about a 20% decrease in overall assets maintenance cost [
12]. AI techniques brought about a revolution in the way people handle data/information [
13]. New approaches to AI in the form of Business Intelligence (BI) solutions show a wide range of uses for the basic reporting of manufacturing data [
14].
This contribution presents an approach for the data collection based on features standardized in the industry and for data classification processed with an applied machine learning algorithm for distinguishing exceptions in a dataset. This contribution has more goals, but the main objective is to show the importance of a distributed control system implementation when replacing legacy control systems and the impact of AI and BI on industrial control processes. Another objective of this paper is to confirm the assumption that methods supporting clustering can be used in project engineering to distinguish the exceptions in data and correct them by applying prediction based standardized features. We also like to present an experiment, where classified data of such exceptions can also be used for building training sets used for prediction models. In this contribution, we also describe the results of this specific experiment with a neural network model trained for the classification of the real time distributed control system data, which can confirm or predict the correct data type of configured and monitored variables for a control system deployed in the Marine industry using a machine learning algorithm.
2. Challenges in Industrial Distributed Environments
Industries and production companies generate a large amount of data from business, production plants, and operation sites, see
Figure 1. It is understandable that we appreciate having more information based on real time data processed from production, it gives us a true picture of products on a market. The typical misunderstanding and communication barrier can be challenging during the conversion of the raw data from production into information useful for the end-users. Production is based on standardized naming conventions and built-in control systems, but these are not always being understood by end-users.
According to our experience with engineering projects, the analysis and sorting of data before the work on a project can start takes, on average, one week of the working load of a senior engineer. With an increasing amount of data, the challenge for efficiency of project engineering also increases, resulting in more hours required and the stress caused by time. This results in man-made mistakes, also classified as human errors. Our objective in this paper is to confirm the assumption that methods supporting clustering can be used in project engineering to distinguish the exceptions in data and correct them by applying predictions based on standardized features. We would also like to present an experiment, where classified data of such exceptions can also be used for building training sets used for prediction models.
Project engineering, among other design problems, deals with the replacements of previously used (legacy) systems, and project managers can confirm that the cost of such projects is one of the most important decision-making criteria of company management. The concern of project engineering is to know how to bridge the gap between the “legacy systems” and the “latest technological systems” while building a “distributed environment”. A solution to this problem has been supported by Object-Oriented Programming (OOP) concepts and object technology. A description of such solution implementation can be found in [
2], where three possible ways are described as (i) Replace, (ii) Revamp, or (iii) Wrap. The authors summarize that from the engineering point of view, “Replace” is the best way if the budget and time prevail. From the end-user point of view, “Revamp” or “Wrap” options are preferred. The “Revamp” option means modifying the existing application by adding Graphical User Interfaces (GUIs) and rewriting the current user interface that is allowing the data conversion for communication in and out of the databases. On the other hand, the “Wrap” option supports the existence of a legacy system with new innovative ideas. It turns legacy systems into service objects and builds data and control system interfaces.
Marshaling the data to be rightly understood is one of the challenges in automated systems. When data are sent or received between system components, it is recommended to use standardized protocol configurations rather than individually developed system solutions. It is best practice to avoid errors in classifications of data types, data units, etc. Applications run across a network, which also requires different methods for alarm management and error handling in case they occur. Modern control systems are quite demanding on the market, and the goal of any software is to increase efficiency and productivity. During an application failure, the Operating System (OS) generally reacts in three ways: (i) the entire system crashes, (ii) the system restarts, or (iii) it handles the exception and fixes the problem. The OS is called “efficient” if it is quick to use fault-resolution and instant fixes.
An important part of the OS is the storage of the data. The programs are vehicles for entering and retrieving data for most parts of the application. Today with continuously evolving systems, and increased competition, the requirements for the legacy systems replacement or modification increase. And the change of the business goals in a competing environment requires the change of production processes.
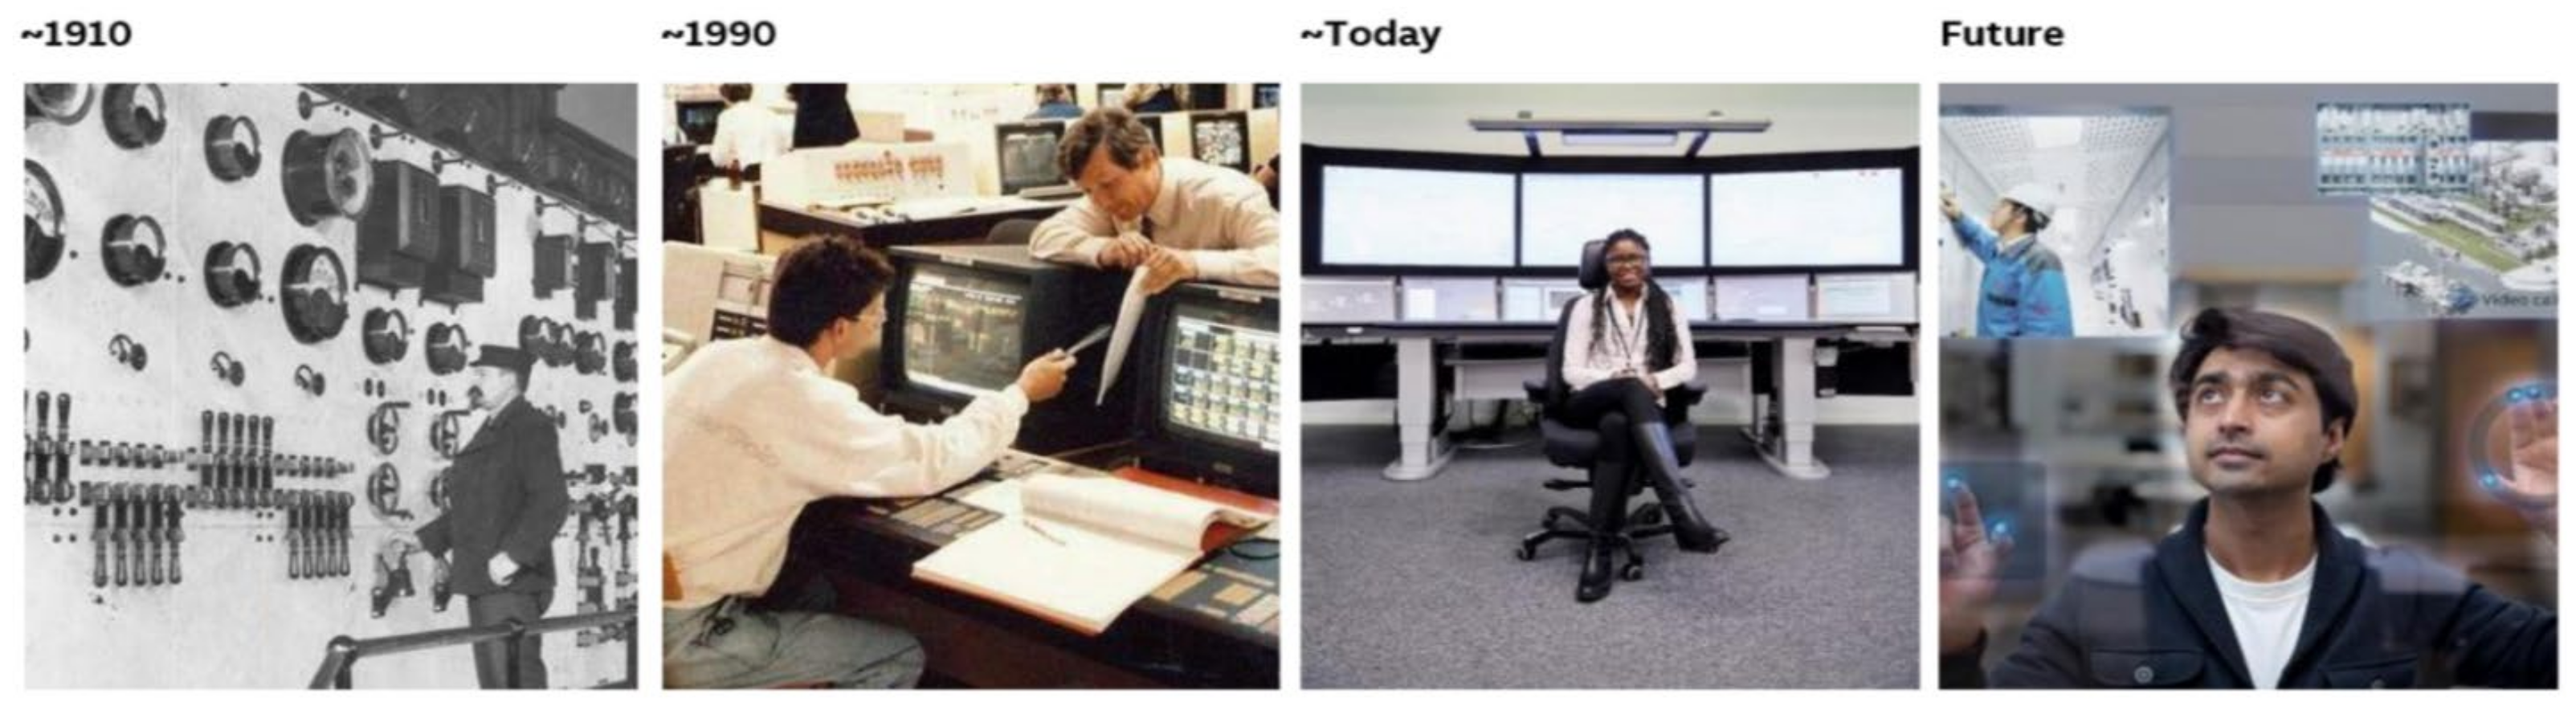
Digital technologies are reviving AI advances, see
Figure 2. Algorithms are being developed further, although they originated in the 1980s. The processing power of computers raises big data to a level that allows us to solve much more complex problems and that results in this current trend of AI.
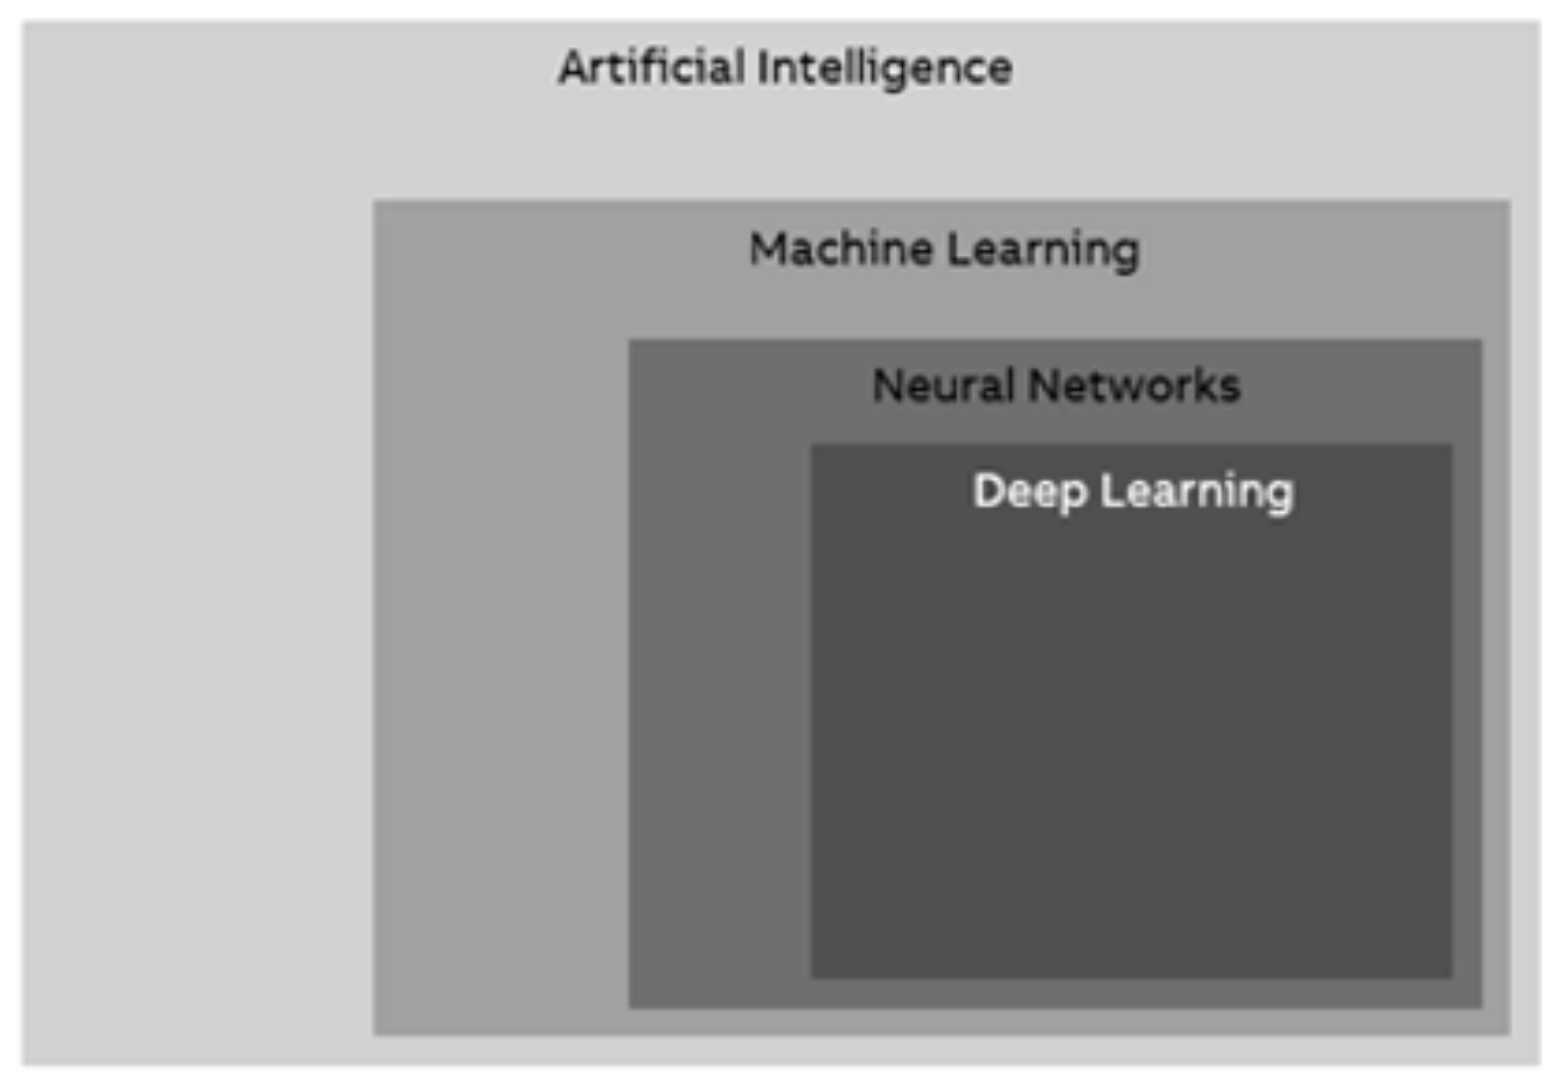
AI is a very broad term and with many themes, see
Figure 3, which shows the ability to perceive or infer information, and to retain it as knowledge to be applied towards adaptive behaviors within an environment or context demonstrated by machines. Machine learning, neural networks, or deep learning [
15,
16] are only the subsets of AI. Machine Learning (ML) involves changes to the content and organization of a system knowledge enabling it to improve its performance on a task or set of tasks [
17]. ML occurs when the system acquires new knowledge from its environment and organizes its current knowledge to make better use of it. Neural networks are only a subset of ML, which otherwise include many more sophisticated methods. Deep Learning (DL) is just a very large neural network. Most of the approaches we are seeing in industrial practice today are “neural networks”.
Unlike other methods where we have engineering knowledge and decision-making systems with human experts, AI defines its models and solutions based on the data it observes. It takes in data that are collected as measurement. Then it proceeds with two main steps. First, it needs to teach the system and generate knowledge; this is done by adjusting connections, and then it uses the information to solve the problem. A learning method called Explanation-based Generalization uses deductive inference to improve the performance of an automated reasoning system. In deductive inference, conclusions follow ‘axioms’ according to specified rules of inference. In inductive inference, we arrive at general conclusions based on examining examples. Some of the inductive learning methods make use of techniques in statistical decision-making, others are inspired by biological systems to perform inductive inferences. Learning and problem solving are part of a very complex system, or a process optimization, which in the end we need to apply to the industry, see
Figure 4.
3. Literature Overview
Krose & Smagt, in their introduction to the theory of Artificial Neural Networks (ANNs), include topics such as error propagation, recurrent networks [
18], self-organizing maps, Hebbian learning, adaptive resonance theory networks, and other areas [
19]. It also contains a chapter on learning with a reward based on neural networks and includes multiple application chapters in robot control, image processing as well as a section on hardware implementations. Rojas describes the problem of ANNs and includes topics such as error propagation, momentum, weight initialization, and advanced learning methods (e.g., Rprop, Quickprop, QRprop, concatenated gradient, and higher-order optimization), and chapters on associative networks, Hopfield networks [
20], Boltzmann machine [
21], self-organizing maps, ART networks, and hardware implementation of ANNs [
22]. An article describing a number of practical tips and tricks to make learning more effective through the redistribution of error has been published by LeCun et al. [
23].
Let us look at the neural network as a network with several variables at the input layer nodes, the nodes in the hidden layers, providing all connections are carrying weights so that the input number is multiplied by its weight, and when all variables at the input are processed, the highest value at the output will be the result, which supports the decision [
24].
The basic building element mentioned in the concepts of models of ANNs is the so-called “perceptron”, the schematic diagram shown in
Figure 5.
Perceptron was created in 1958 when Frank Rosenblatt showed that the McCulloch-Pitts network of so-called “formal neurons” have a symbolic logic to statements composed of elementary logic operations (x AND y, x OR y, NOT x), see
Figure 6, and is able to be trained to recognize and classify objects [
25]. The main idea of this training procedure is to notice the response of each formal neuron to a given stimulus at the beginning. If the answer is “correct”, the weights will not be modified. If the response of a given neuron is “incorrect”, then the weights of all activated inputs will be modified in the following way: IF the neuron is to be active and it is not, the weight is increased, and vice-versa, IF a neuron is to be inhibited and is not, the weight is reduced.
The Rosenblatt training procedure is based on knowledge from which it is possible to determine which patterns belong to which class. Its error correction link weight modifications form the basis of many of the algorithms used today [
26].
Widrow & Hoff used a similar algorithm for training a model for neural classification: ADAptive LInear Neuron (ADALINE) [
27]. For the first time, they showed that during the learning process, the sums of squares of errors are minimized and this implies that some global system function is minimized.
In their book, Minsky & Papert pointed out the limitations of a perceptron [
28]. They described that it is not possible to reach a universal computation and to solve all classes of problems. The main problem was that the perceptron cannot solve so-called “linear non-separable problems”. A classic example of failure is the logical XOR function (excluding or). There was no other learning method known at that time than modifications of synaptic weights in ANNs. This problem was solved in 1986 by Rumelhart et al. by introducing a learning method using error-propagation for multilayer perceptron networks [
29].
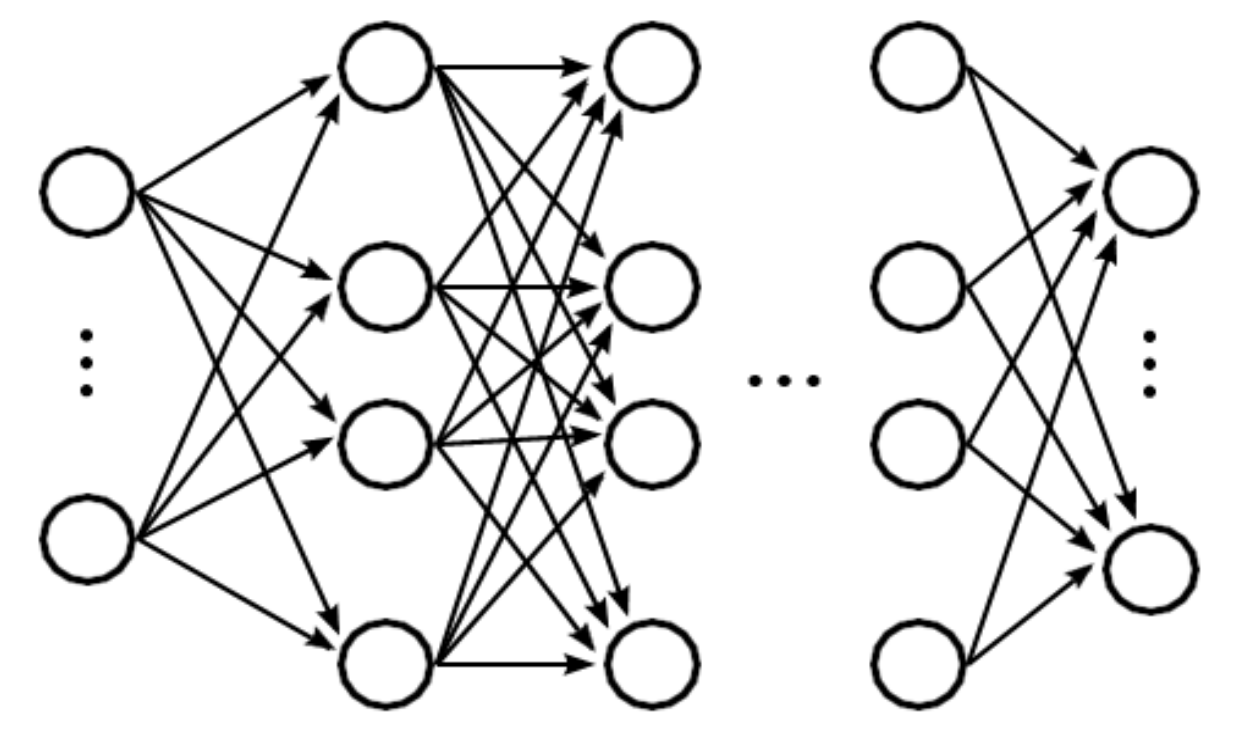
Neural networks have evolved over the years since their introduction with “forward multilayer networks” mainly due to their diverse structure and wide range of uses [
30]. A multilayer neural network, see
Figure 7, is mostly defined by three basic layer types:
Input layer—samples from the learning and test set.
Hidden layer(s)—providing the functionality defined by the application itself.
Output layer—presenting the neural network response to the input.
This structure is the most advantageous because of a highly efficient output mapping. During the ANN learning process, it can learn the hidden properties of a time series based on the analyzed data and further generalize the results of the future forecast.
Based on the Stone-Weierstrass theorem, any function can be approximated with a suitably selected higher-order polynomial. In this regard, “forward neural networks” can be considered a neural network universal approximator. Forward neural networks can approximate any function at a selected accuracy and correct network settings [
31].
A backpropagation algorithm is recommended for forward network training. Experiments have shown various accelerations of this algorithm, which yield the same learning outcomes. The essence of such networks learning is to store mapped, characteristic features of a modeled phenomenon in a hidden layer.
4. AI in the Context of Industry
Learning based on inductive inference can be divided into (i) supervised, and (ii) unsupervised learning. The supervision in “supervised learning” happens when the learning program is given both the inputs and outputs corresponding to correct results. In other cases, when there is “no supervisor” to provide the program with correct outputs, the learning program must rely on other sources of feedback to determine whether or not it is learning correctly.
Classification problems are well suited for image [
32], voice [
33], language [
34], and video recognition [
35]. A set of input variables, for example, the pixels of a picture, a sample of a sound, are matched to a finite set of output variables, for example, recognized objects in a picture or a spoken word. Learning involves mapping a known output to the corresponding input by adjusting the network variables but requires high effort optimization. Inference starts with an unknown input set (e.g., an image), then triggers the most likely output variable, which is significantly less effort than learning.
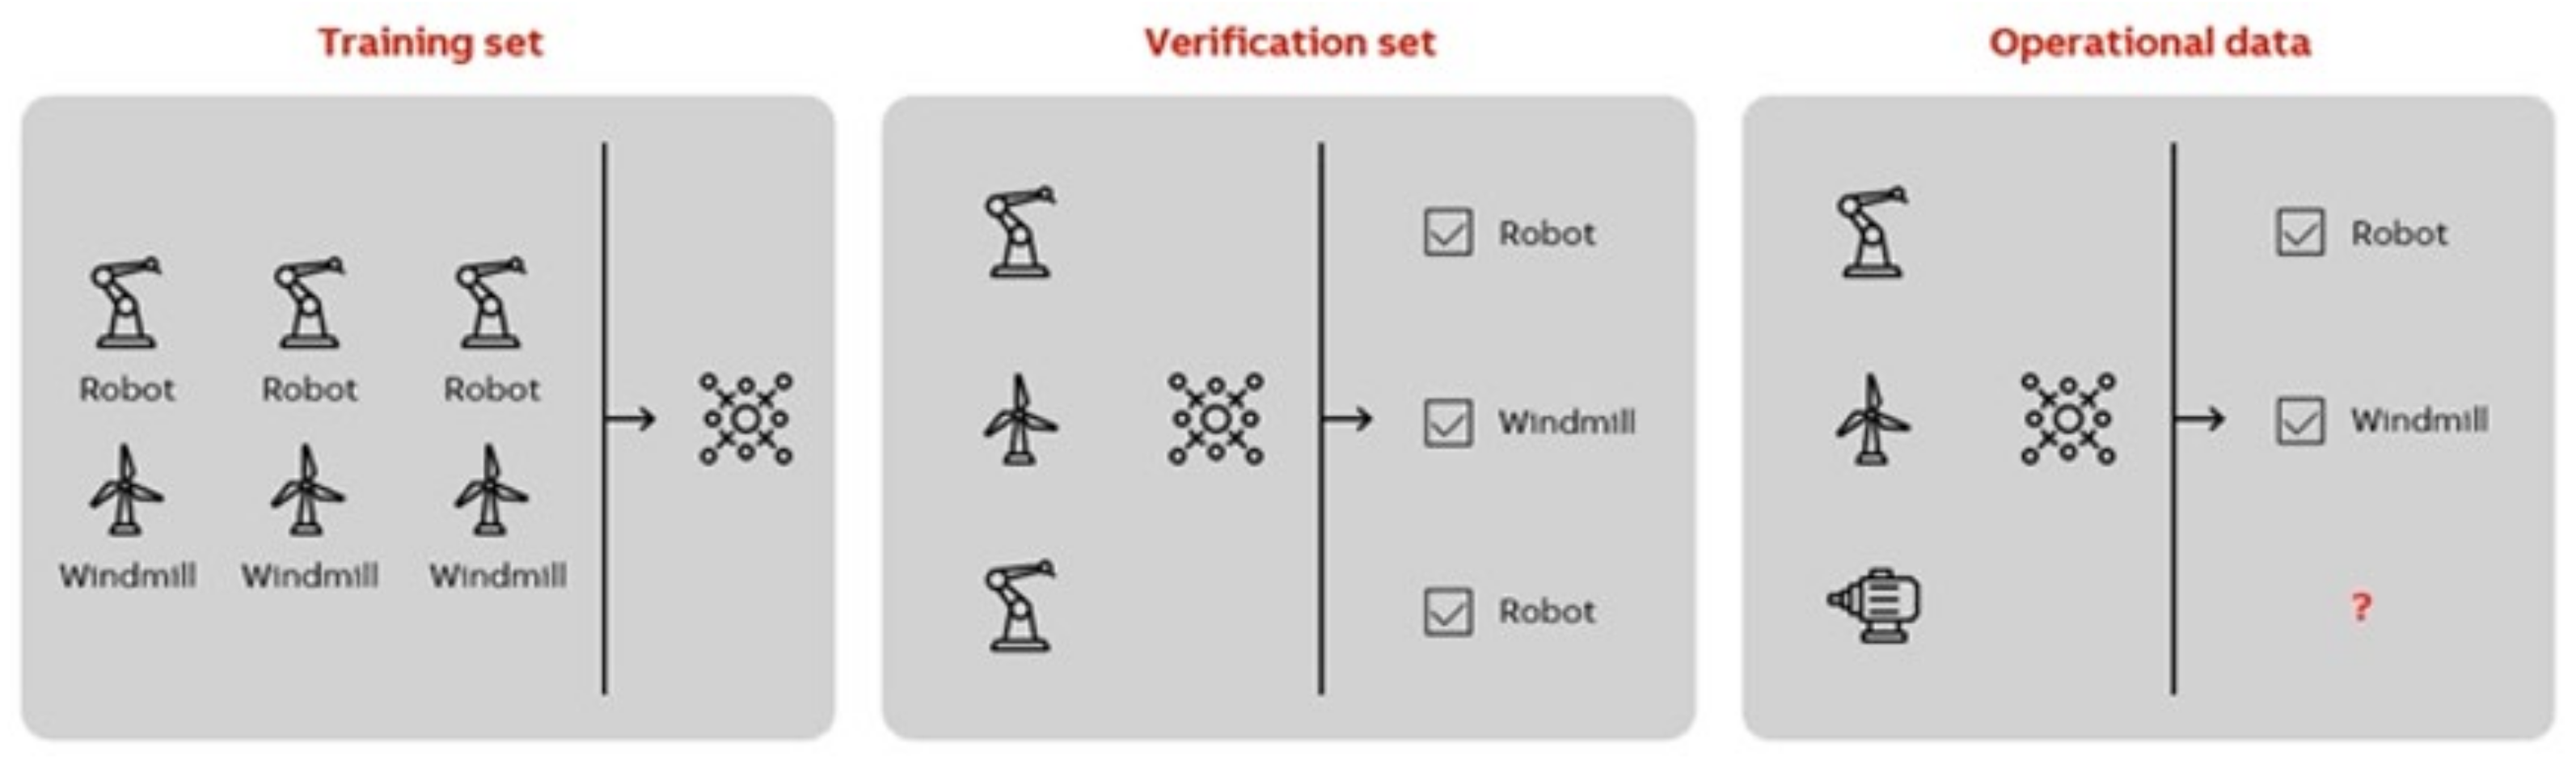
Complex control systems have hundreds of thousands of input and output signals, which can rarely be provided by sufficient visualization of variables carrying all communication and control data. This huge load of data can be analyzed by an engineer only if appropriately visualized in engineering interface and configuration tools [
36]. To build a neural network tool, we need to train an AI system with rich data, see
Figure 8. We show the network data where we want to see the solution. The network learns with neuron threshold weights from the prepared datasets used for this training. The iterations of learning with updating the weights in the network connections improve its performance over time. Optimization algorithms are complex and require big data and large sets of inputs and outputs. Incomplete data will lead to incomplete solutions, therefore, the data used for training are important.
This section shows how machine learning can be implemented together with interactive data visualization for process control. The machine learning algorithm worked on examples simulated with the help of scripting it in the Orange software, a Python 3 data mining library. Orange software was developed by the Bioinformatics Lab of the University of Ljubljana, Slovenia in collaboration with the open-source community. “Orange” is an open-source project focused on data visualization, machine learning, and data mining [
37]. It supports a visual programming interface for searching data, analyzing them, and visualizing them in an interactive way.
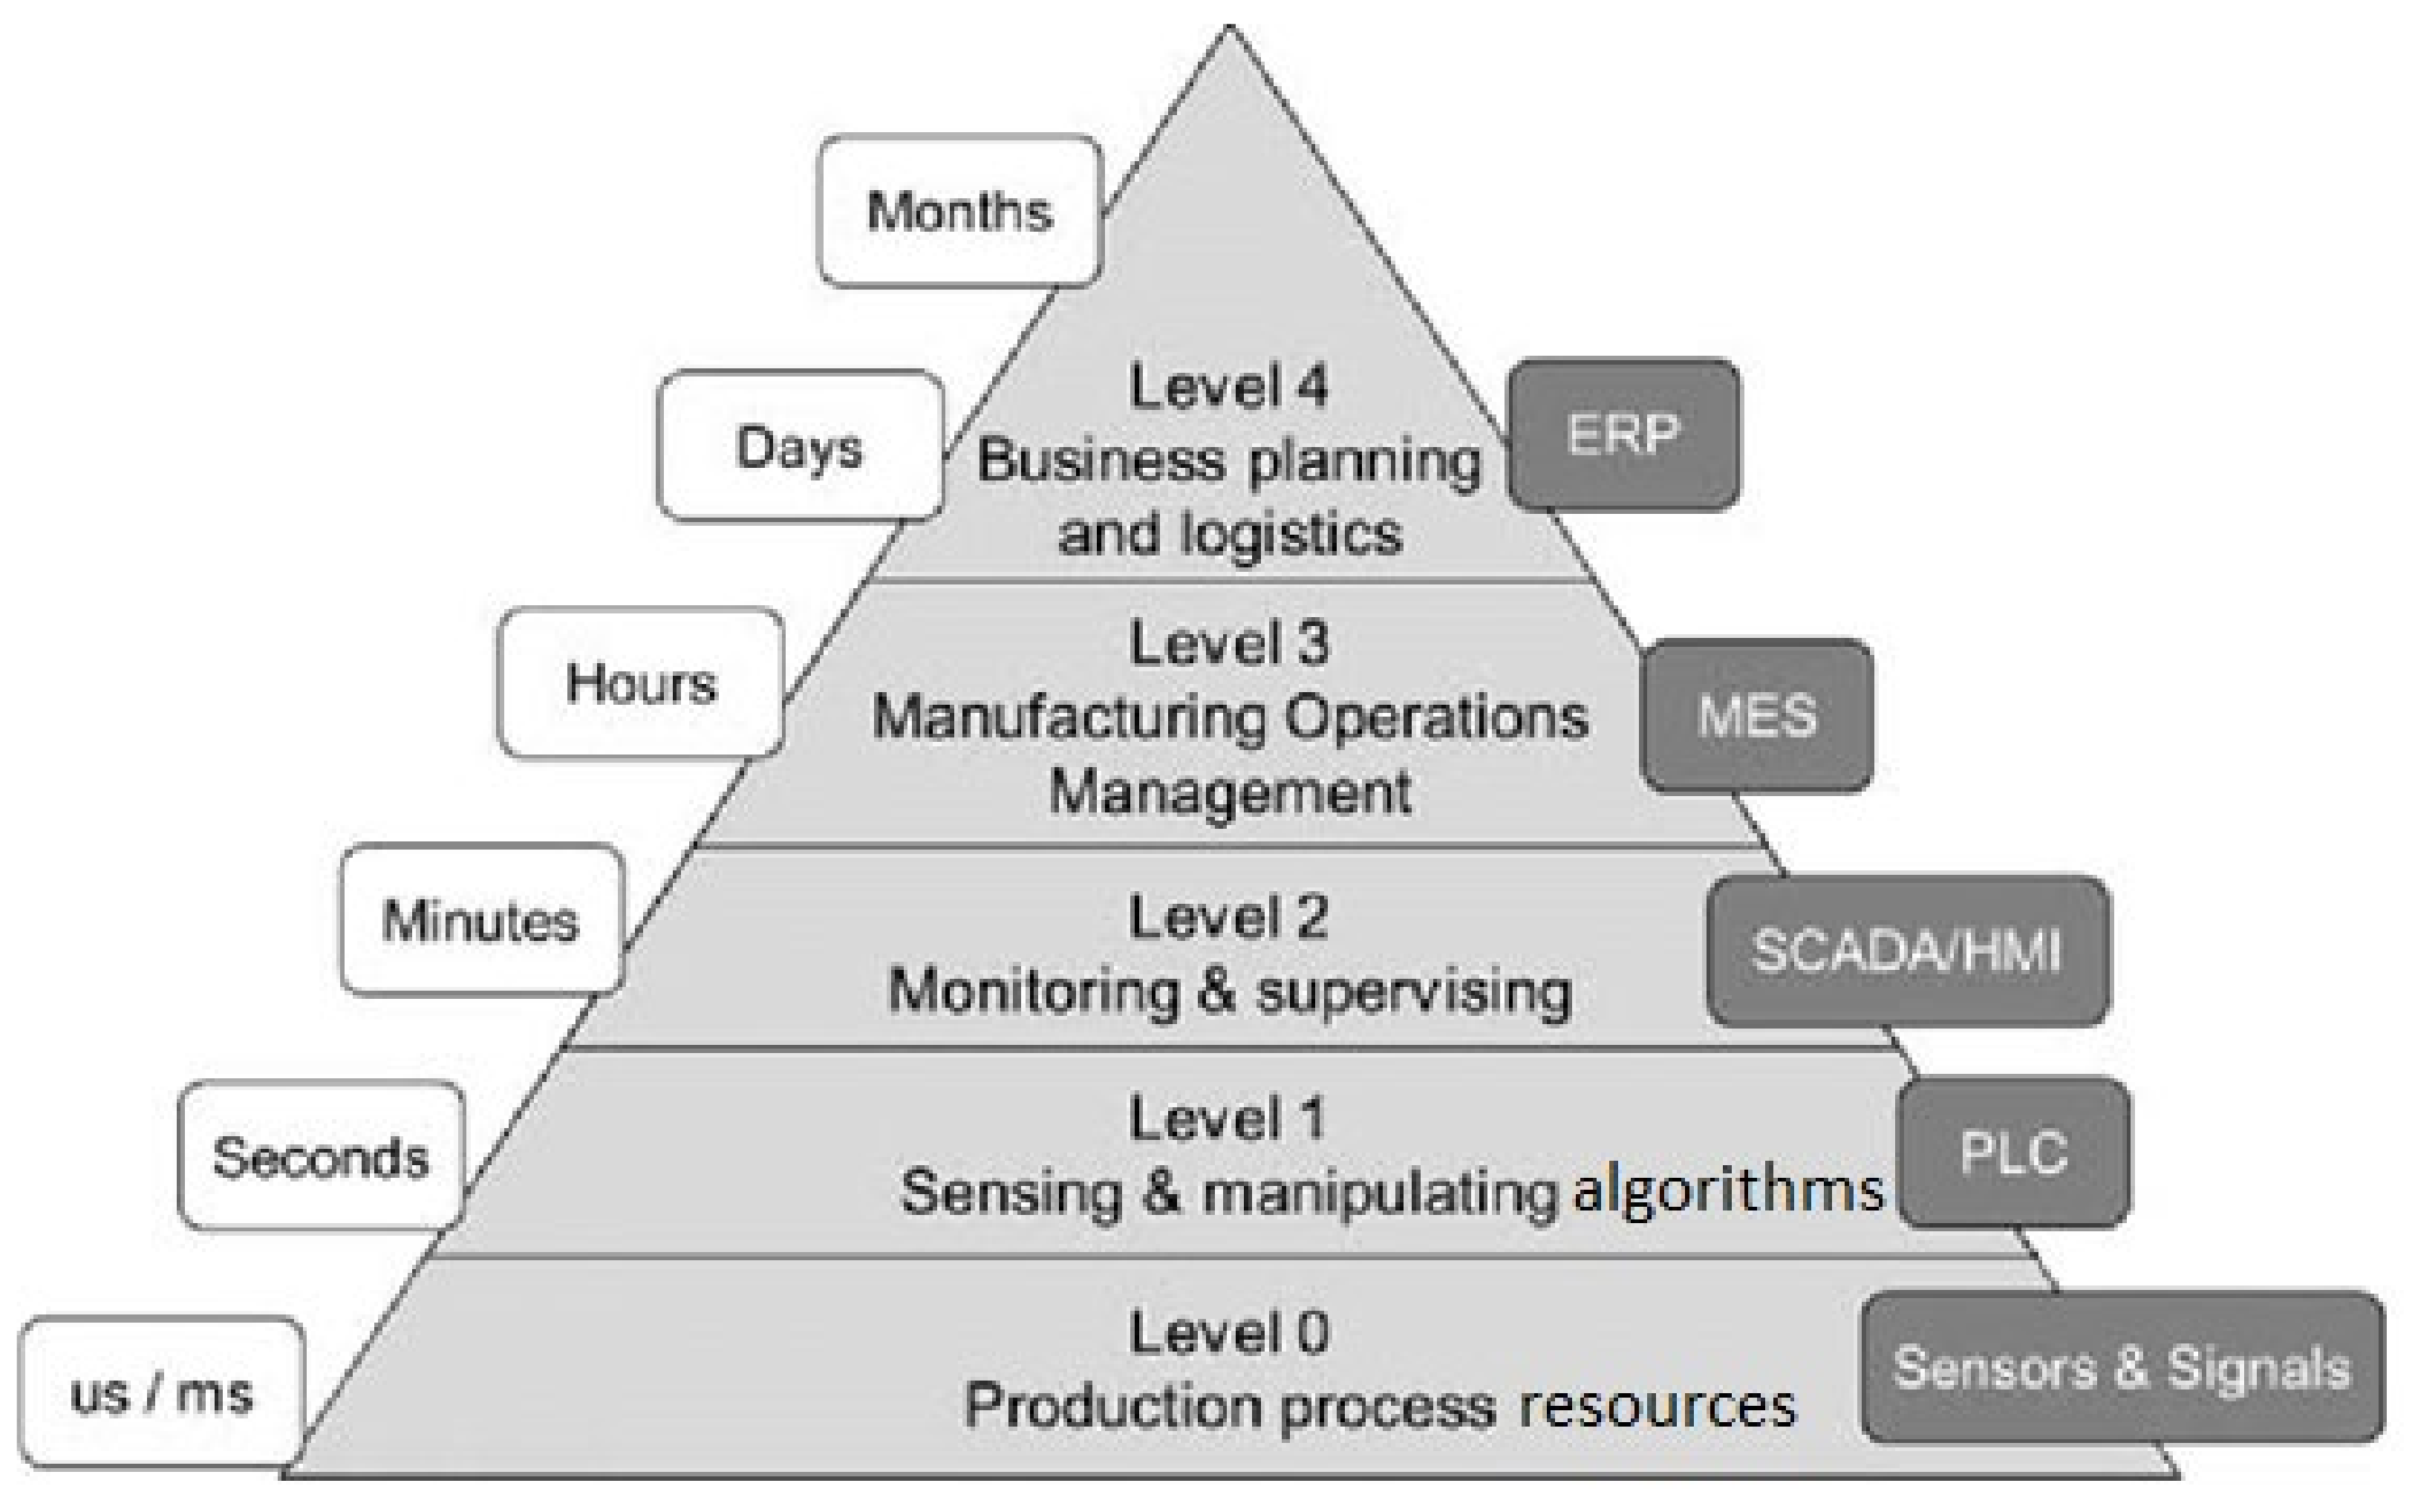
The standardized ISA-95 model reflects the degrees of intelligence to achieve the full automation and digitalization of all the levels connected to Business Intelligence (BI), which works with big data. All levels of intelligence presented in
Figure 9 in the ISA-95 model are supported by automation. Signals are collected from intelligent electronic devices and sensors (Level 0), then processed in programable logic controllers (PLCs in Level 1), monitored in Supervisory Control and Data Acquisition system with the Human Machine Interface (HMI in Level 3).
Our team worked with current system data exported from a distributed control system to a spreadsheet, so we presented a selected set of raw data about the process start, stop, and alarm limits on monitored variables and downtime. This information is available to an operator authorized for working on a workstation. The reports for the updated status of control systems are prepared for the operator workstation displays by software teams. For other users who need to work with raw data, the export by project engineering is done. We set the experiment with datasets obtained from the Marine industry, originated at operator workstation during a project dealing with a vessel control system update. The operator workstation screenshot in
Figure 10 shows that the alarm data are designed into the alarm list. Priorities and importance of the data are marked with colors, without these the data is practically unreadable on a smaller screen. The operator acknowledges all visualized alarms, then decides about further steps, and logs the action into the
Event list as required.
5. Findings and Implications
The same data exported from a distributed control system later were imported into a spreadsheet for our team for further research.
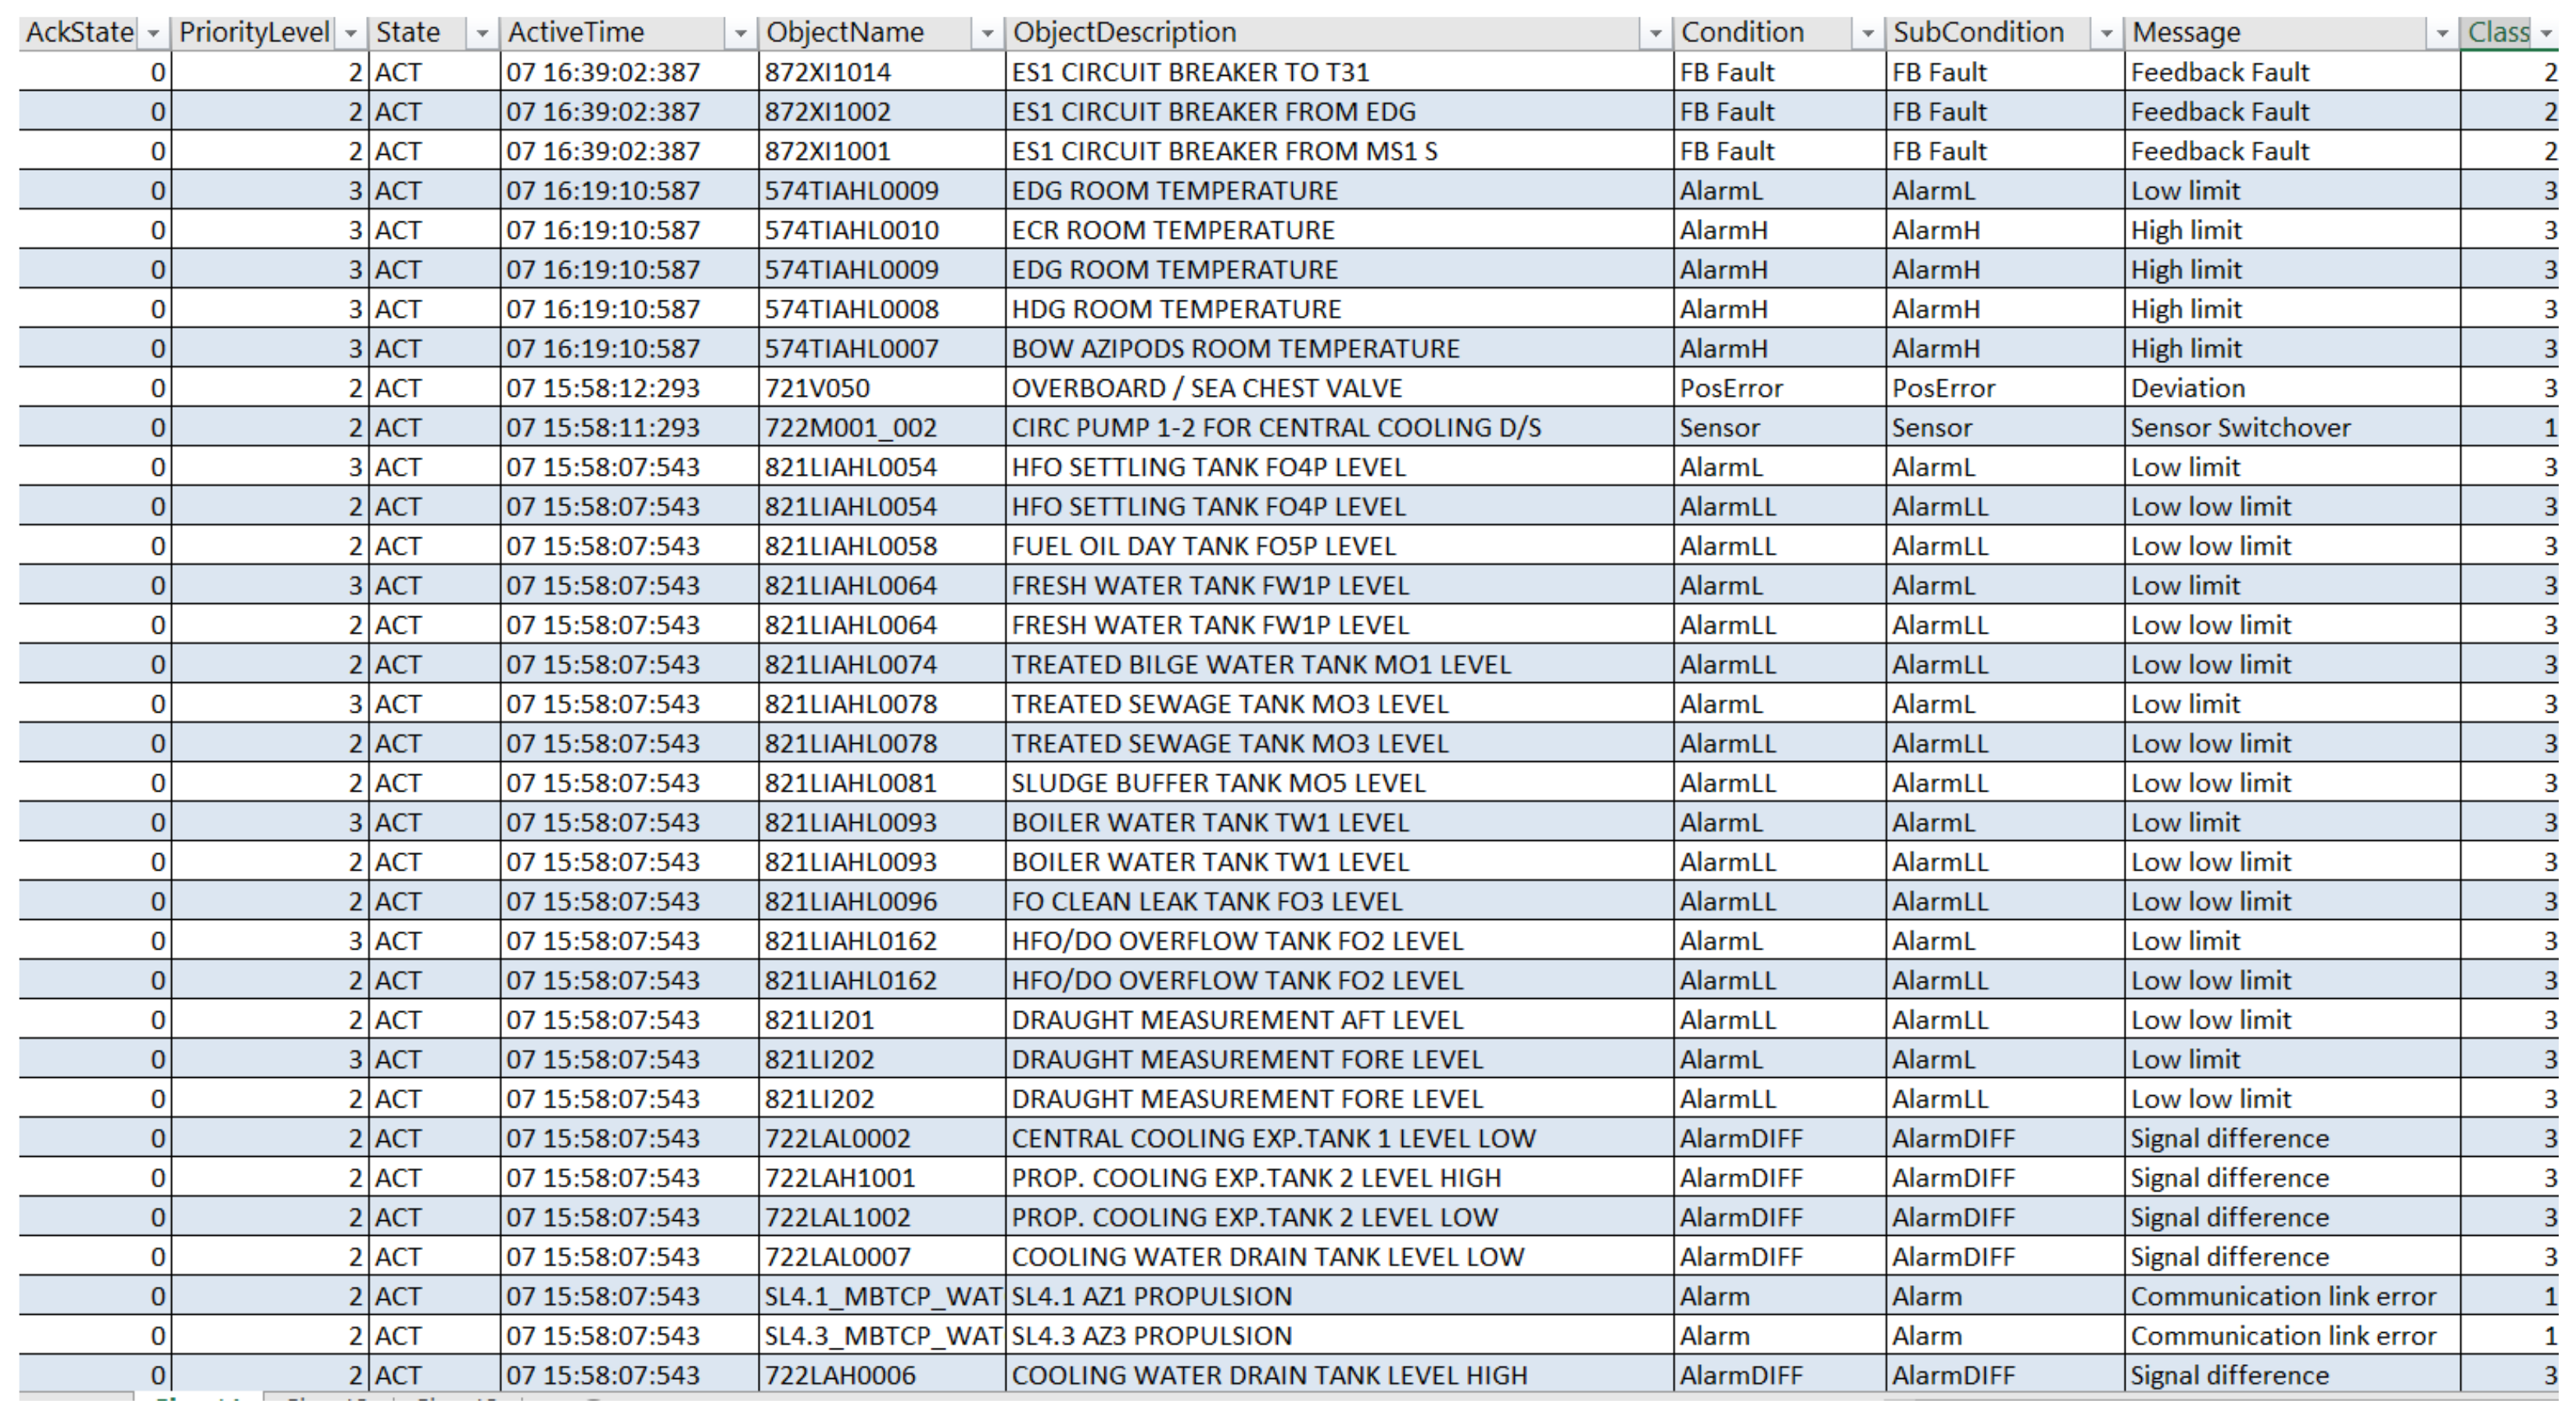
Figure 11 shows the control system raw exported data in a spreadsheet format. The screenshot shows a fragment of data, different alarms originating in the monitored system, and caused by various reasons identified with low-limit and high-limit values, signal differences, communication link errors, deviations, feedback faults on equipment and/or the sensors, on which we focused.
Work with raw data using tools for data visualization and reporting, such as Power BI, helps us interactively search for different ISA-95 level data and to understand the interpretation of the reported data from the production level. Misinterpretation causes errors, these failures in operation can be classified as human factor errors. The long-term analysis of the history plant data gives significant ideas on how to modify the properties for the observed equipment and instrumentation which is important to focus on and what to improve to avoid future failures.
We classified alarm data into groups based on the type of alarm using a binary dataset for our case study with respect to the definitions given from the system configuration—communication link errors, signal differences, high-limits and low-limits, feedback alarms, signal errors, very high- and very low-limits, deviations, sensor switch overs, feedback faults, process controller control. Based on these alarm type features we grouped data into these 11 classes namely:
Alarm
AlarmDIFF
AlarmH
AlarmL
FBAlarm
AlarmERR
AlarmLL
Sensor
PosError
FBFault
PCC
By setting these classes we obtained a table.
Figure 12 shows a screenshot of only a part of this table with variable labels and visualized numeric values colored by instance classes. The dataset with binary values consists, in this case, of 82 instances. The classification task works with 11 features, which need to be classified into 11 different classes. Each instance has only two possible unit states, either 1, indicating that it is true for mapping the feature to its respective class, or 0 indicating a false state.
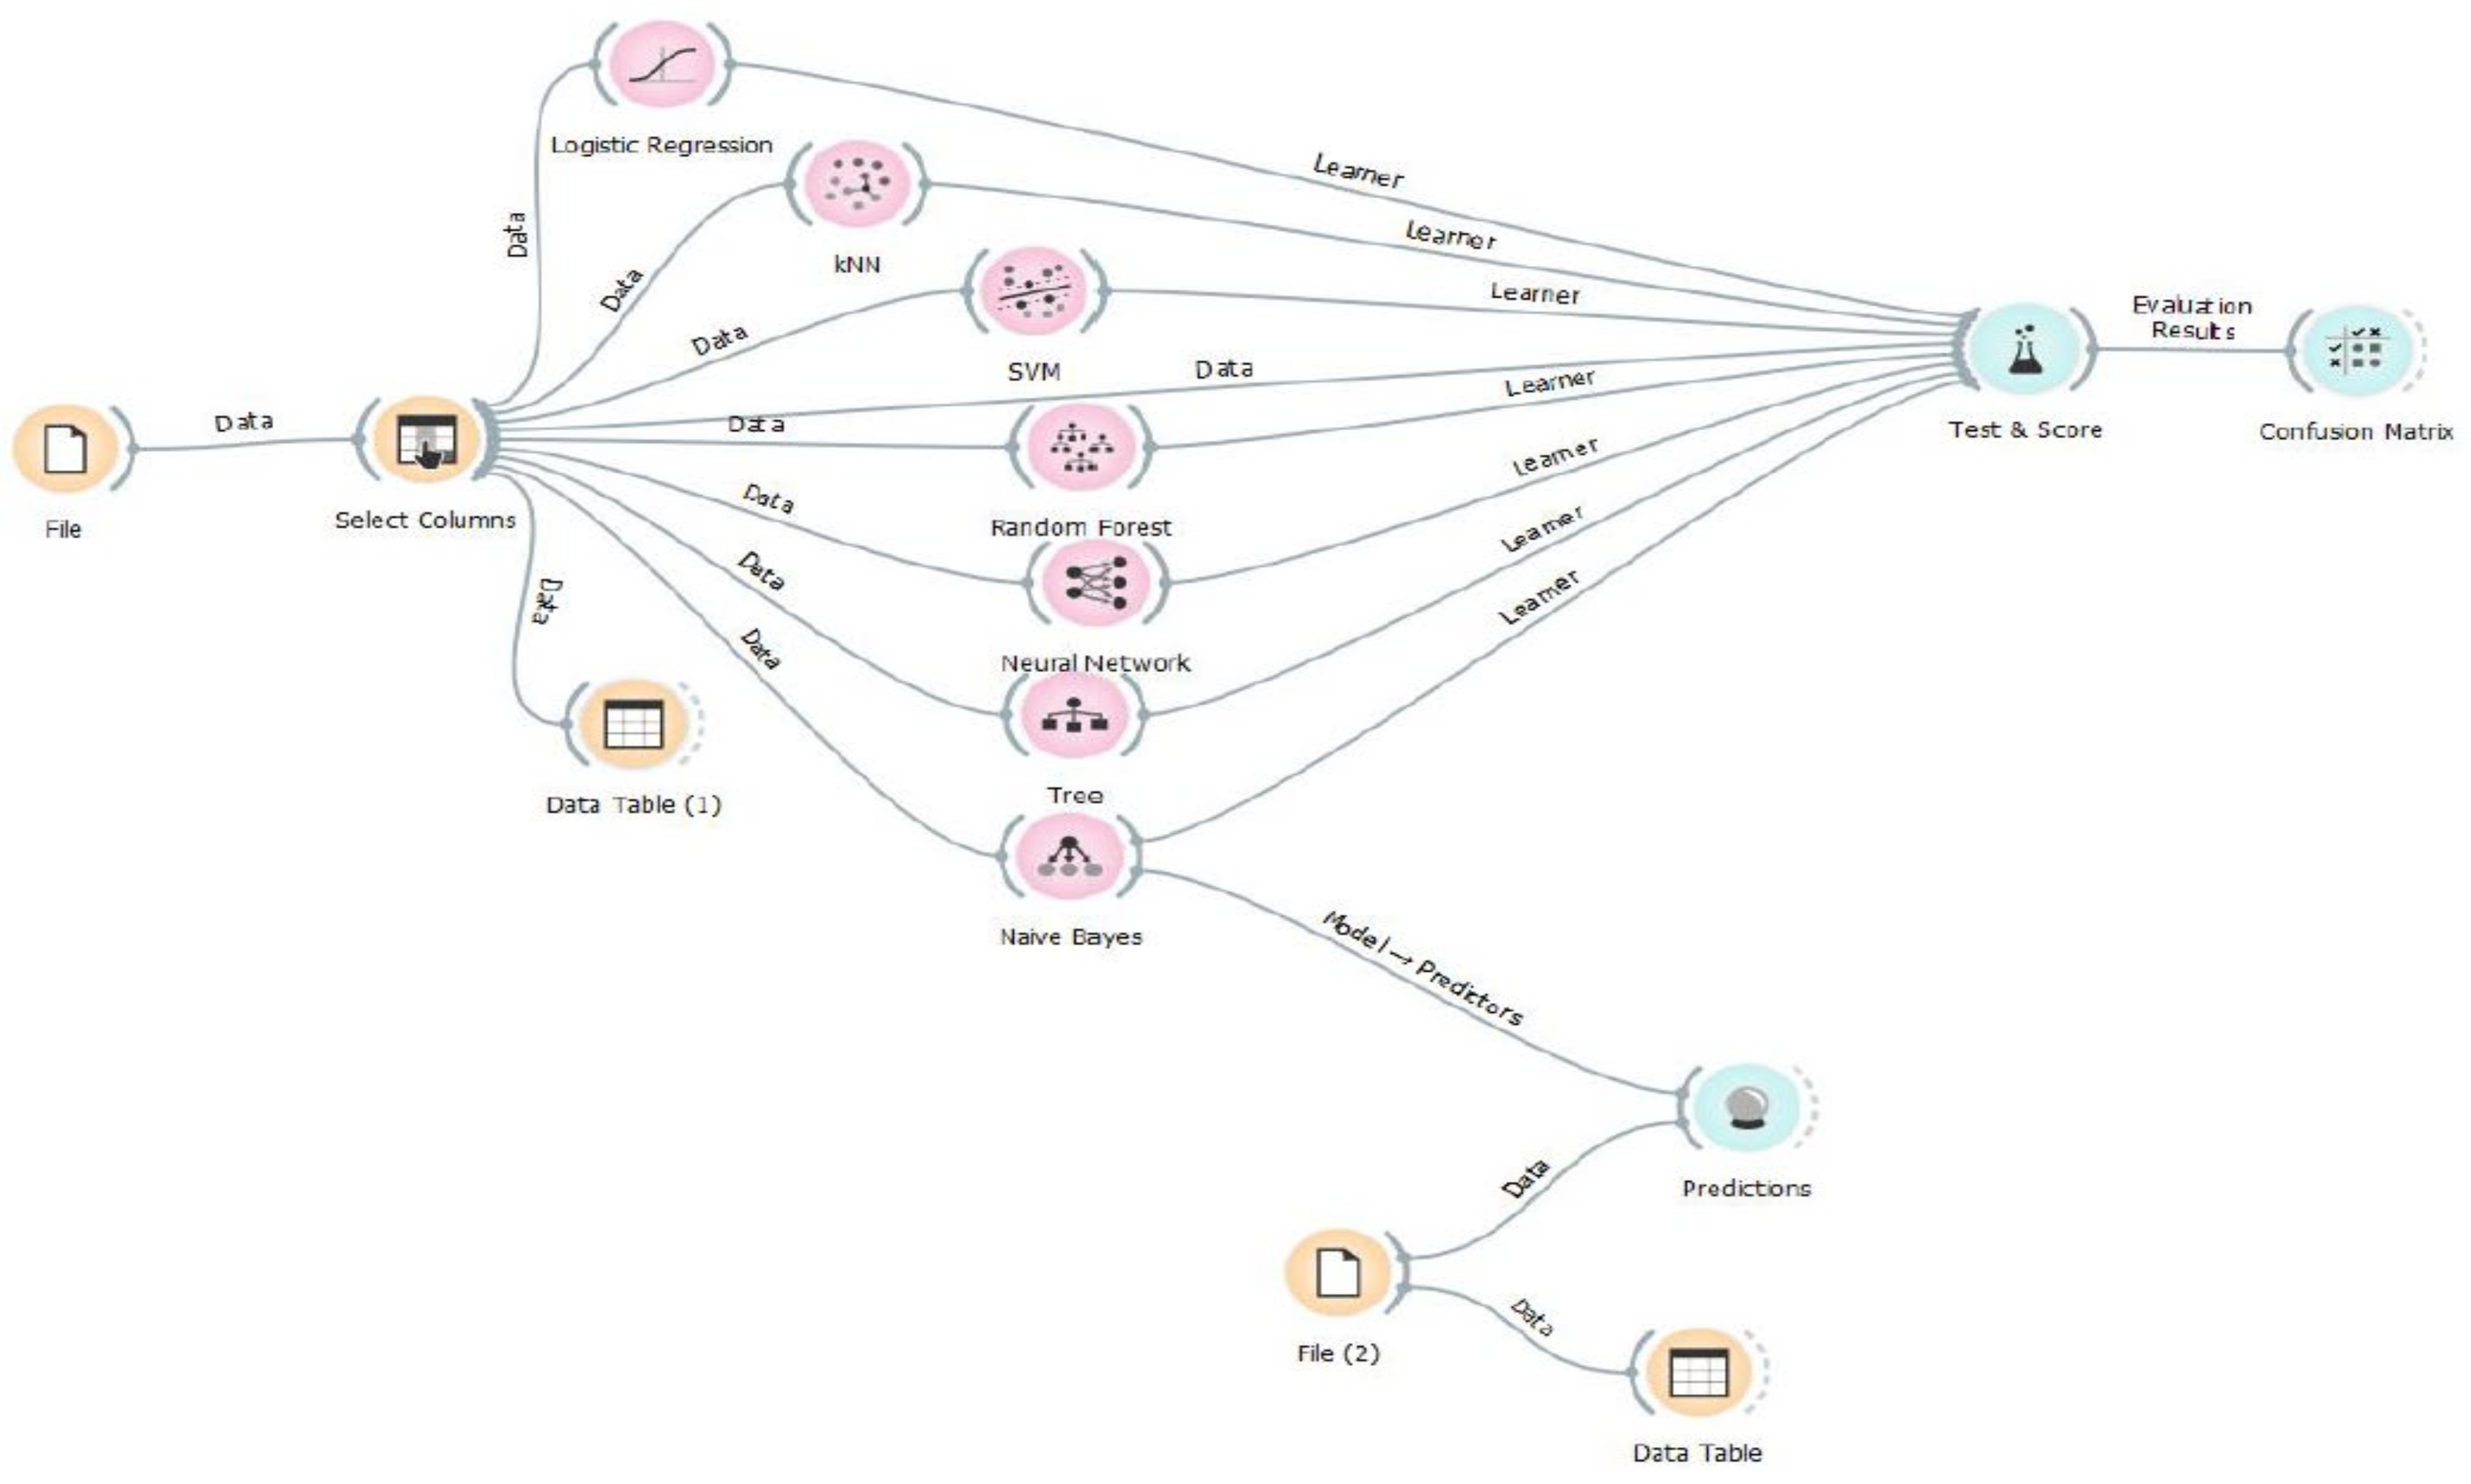
Figure 13 illustrates the next steps with data processing in a selected neural network software environment tool for the experiment setting. These steps are:
The training set is set by selecting columns from the table provided for the training. The input data from the file provided for our experiment are the data from which the neural network will learn. The option Select Columns in the software helps us to select the respective features and target output. The data from the selected columns are then put into seven different machine learning methods available in the Orange software environment [
37].
The operational dataset is set with the Predictions widget. We can make a prediction of the alarm target type for data, which were misclassified by human operators. We use the File (2) widget to upload the data, where human error caused unclassified exceptions. The trained neural network now can predict missing data and include them in the Target Type column of the data table. During the experiment verification, we uploaded the dataset with 43 instances for training into the File widget.
Then, we perceptively fed the dataset with two incorrect features to create exceptions in the output of the clustering, as we present in
Figure 14.
The incorrectly entered data in the Data Table are on the 41st and 42nd row, where the low-low-limit is classified as a feedback fault domain and a high-limit as PCC children object alarm. This way we aimed to present the error entered by a human operator that can happen while managing an operation with many input and output data at the operator workstation.
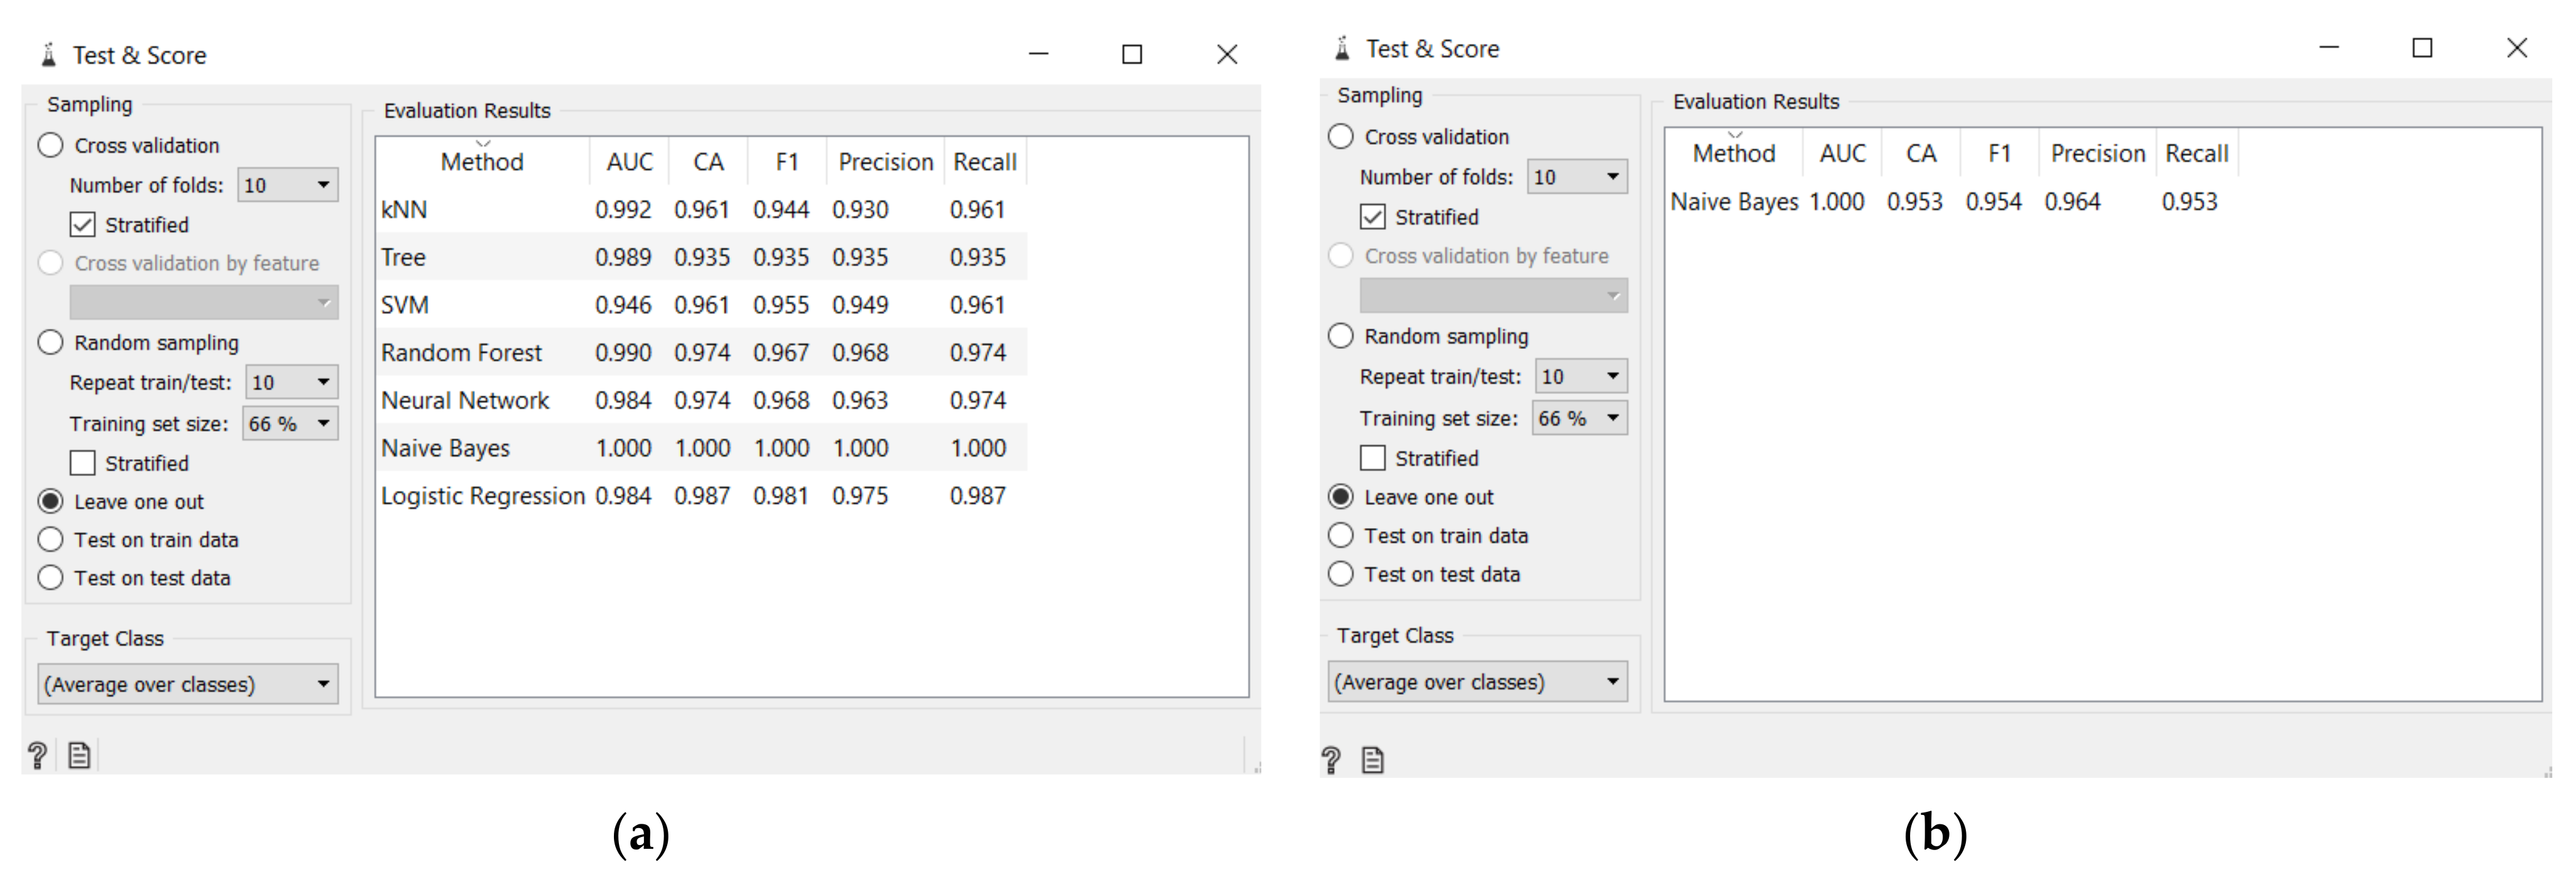
We can distinguish the exceptions using
clustering during analysis and focus on further processing, see
Figure 15. In our presented experiment, we can see that our
Confusion Matrix widget, in
Figure 16, clearly shows a low-low- limit classified as feedback fault and high-limit as PCC children object alarm, confirming the same two incorrect data entered in the dataset.
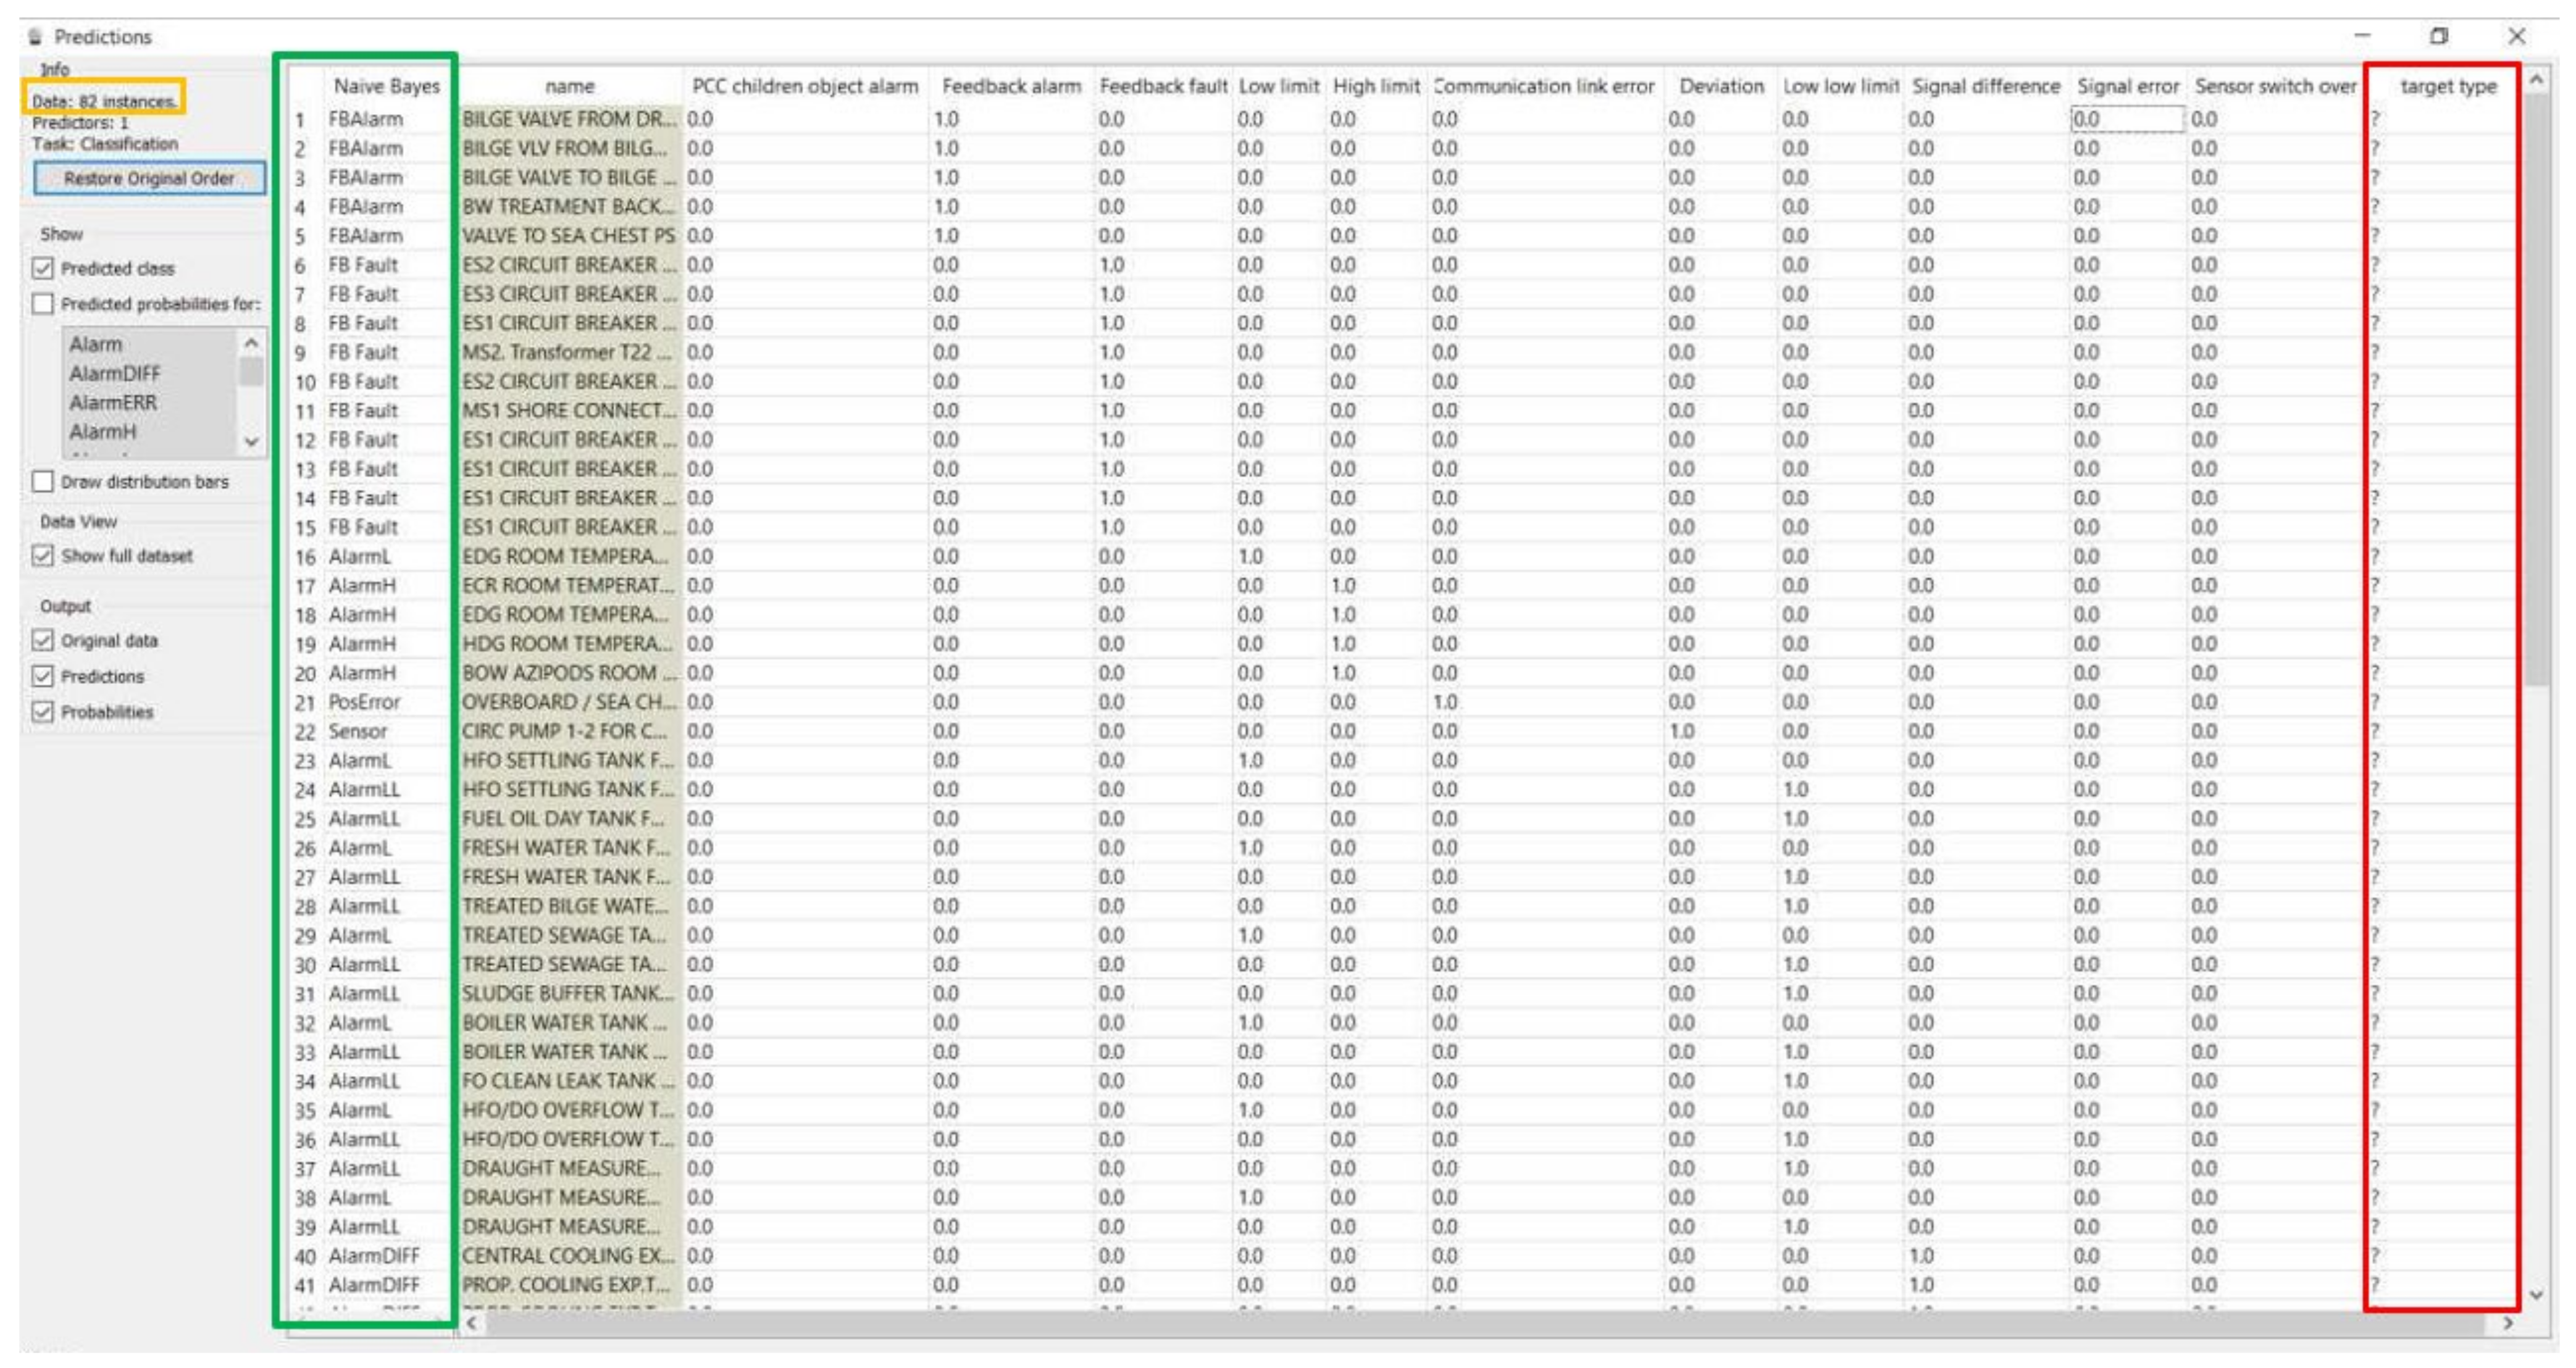
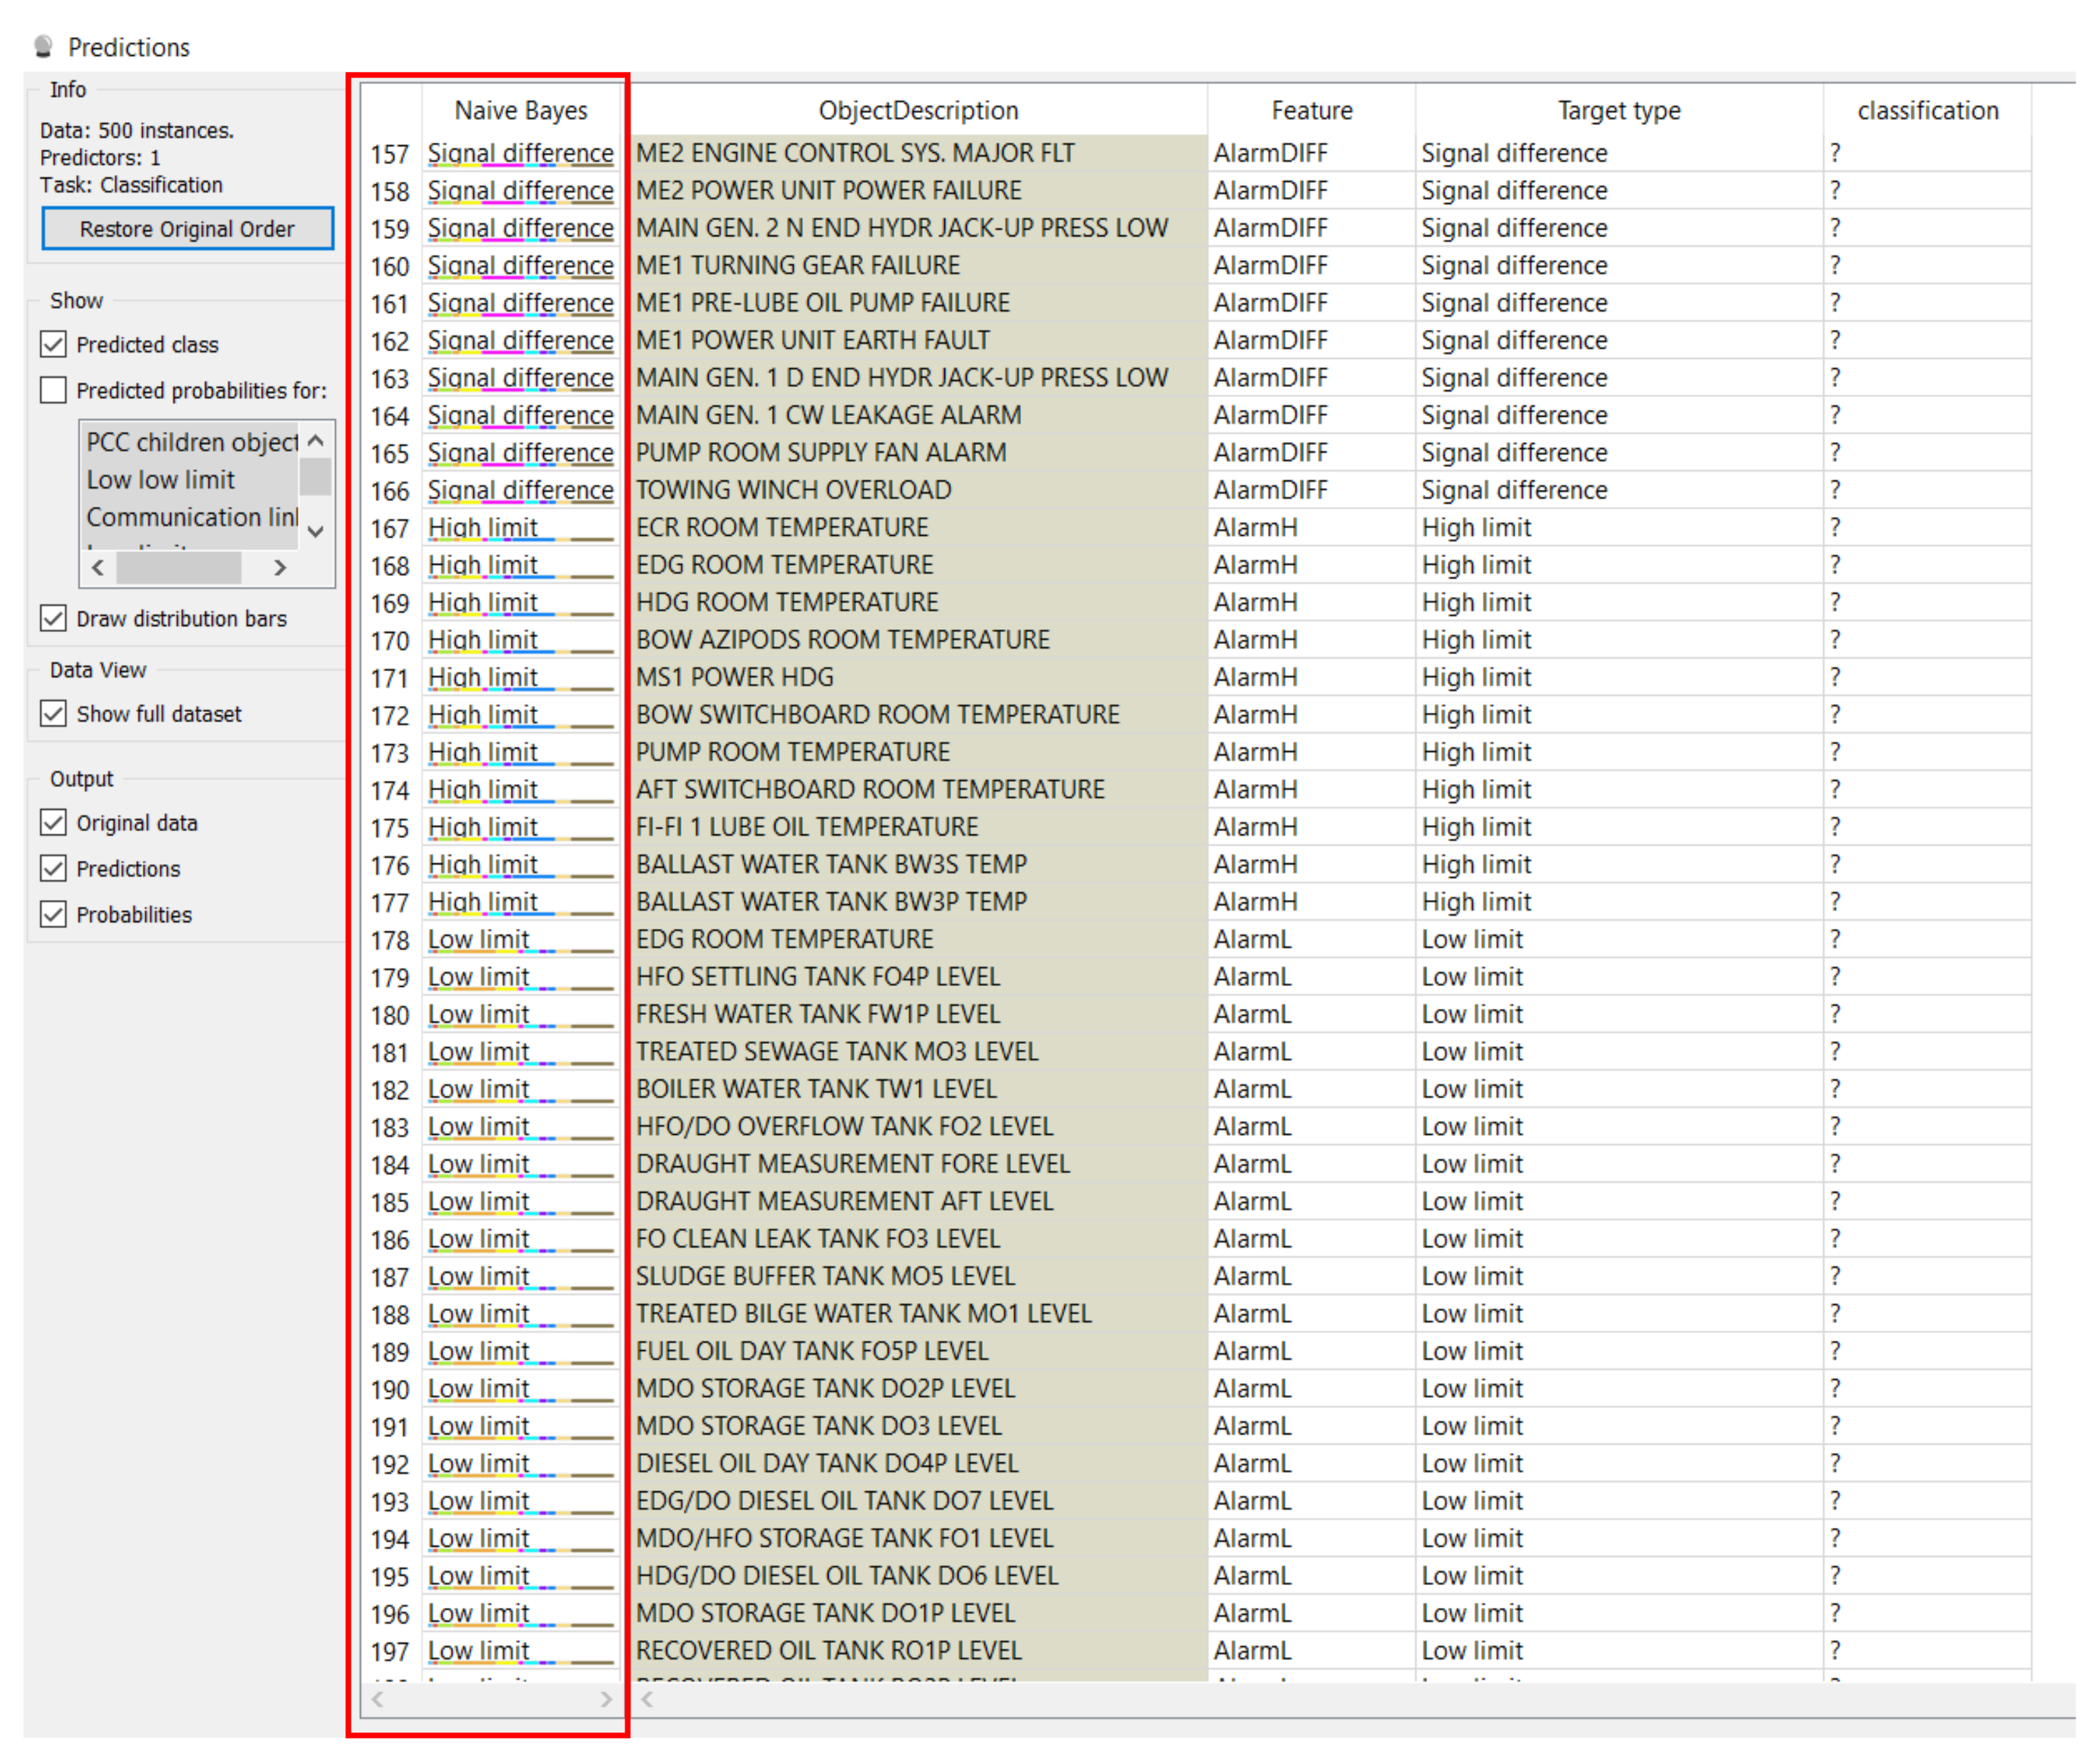
Then we uploaded the operation data, which corresponded to the data of I/O (input and output) variables of distributed control system parameters, into the file prepared for the Prediction widget of our selected software tool. The Naive Bayes model previously trained on the training dataset with already known I/0 values, and verified with classification accuracy equal to 1, was now connected and ready to process a data file with known input features and unknown target type output values. The prediction model for target types of operation data is in
Figure 17.
The Target Type column of the data table with the “?” mark indicated earlier the data to be predicted, those to be looked for. For these rows, the comparison of both Naive Bayes and Target Type columns confirms that we received correctly predicted outputs. The result now also demonstrated in
Figure 18 shows that with this model we can predict the output domain for 500 instances and have them all correctly classified.
The experimental results in
Table 1 show the calculation models of the selected Data Mining Toolbox [
37] tool applied on the dataset of the 82 instances previously. The classification done by Naive Bayes for the fed data shows no errors. In 82 instances, all 82 were correct, and the classification accuracy is calculated to be 1, as it has been previously shown in the test and score tool. Naive Bayes had 100% accuracy for this data, and the corresponding accuracy of other tested models reached over 90%.
6. Conclusions
In this contribution, we described the experiment with a neural network model trained for the classification of the real time distributed control system data, which can either confirm or predict correct data type for a control system deployed in the Marine industry using a machine learning algorithm. The data were obtained from the alarm management module of a control system as a file exported into an Excel sheet and used as “offline” data for demonstrating the data classification requirements to distinguish human errors previously introduced by a mistake of a human operator into the control system during I/O variables configuration. The data classification using machine learning may help, when a new or upgraded control system of thousands of input and output variables is deployed. Clustering of the data shows the exceptions from the standardized configurations. Distinguishing those exceptions in a dataset of many entries manually is a very boring and time demanding work for an engineer, but very necessary for control system deployment. This need motivated us to experiment with a machine learning algorithm. Clustering, which sort exceptions distinguished in a large amount of data, and prediction, which can replace the wrong or missing data may be very useful for process control deployment. The quality of the proposed approach will be measured by the standard quality methods. For example, Failure Mode and Effect Analysis examines all potential manufacturing and assembly process failures and their causes and identifies the necessary corrective actions. The working group is led by an employee of the relevant department of production, technical preparation of production, quality assurance, or industrial engineering, and the aim is to prepare a detailed analysis of the entire engineering process in terms of its failure rate, mistakes, and possible corrective measures proposed in the pre-production stages.
Author Contributions
Conceptualization, L.L.; methodology, L.L. and J.S.; software, L.L. and R.W.; validation, L.L., J.S. and R.W.; formal analysis, J.S., R.W. and L.L.; investigation, J.S., L.L.; resources, J.S. and R.W.; data curation, L.L.; writing—original draft preparation, L.L., J.S. and R.W.; writing—review and editing, L.L., R.W. and J.S.; visualization, L.L.; supervision, L.L., R.W. and J.S.; project administration, R.W., L.L.; funding acquisition, R.W. All authors have read and agreed to the published version of the manuscript.
Funding
This work was supported by the European Regional Development Fund in the Research Centre of Advanced Mechatronic Systems project, CZ.02.1.01/0.0/0.0/16_019/0000867 within the Operational Programme Research, Development and Education and the project SP2021/27 Advanced methods and technologies in the field of machine and process control supported by the Ministry of Education, Youth and Sports, Czech Republic.
Institutional Review Board Statement
Not applicable.
Informed Consent Statement
Not applicable.
Data Availability Statement
Contact correspondence author.
Conflicts of Interest
The authors declare no conflict of interest.
References
- Vyatkin, V. IEC 61499 as Enabler of Distributed and Intelligent Automation: State-of-the-Art Review. IEEE Trans. Ind. Inform. 2011, 7, 768–781. [Google Scholar] [CrossRef]
- Ptak, R.; Morgenthal, J.; Forge, S. Manager’s Guide to Distributed Environments: From Legacy to Living Systems; John Wiley: Hoboken, NJ, USA, 1999. [Google Scholar]
- Lojka, T.; Zolotová, I. Improvement of Human-Plant Interactivity via Industrial Cloud-based Supervisory Control and Data Acquisition System. In Advances in Production Management Systems (APMS). Innovative and Knowledge-Based Production Management in a Global-Local World. IFIP Advances in Information and Communication Technology; Grabot, B., Vallespir, B., Gomes, S., Bouras, A., Kiritsis, D., Eds.; Springer: Berlin/Heidelberg, Germany, 2014; Volume 440. [Google Scholar]
- Parreira, J.; Mullard, Z.; Meech, J. How Automation and Key Performance Indicators Contribute to Sustainable Development in the Mining Industry. In Proceedings of the Conference on Multinational Enterprises and Sustainable Development, Stockholm, Sweden, 22–24 October 2009. [Google Scholar]
- Frohm, J. Levels of Automation in Production Systems. Ph.D. Thesis, Chalmers University of Technology, Göteborg, Sweden, 2008. [Google Scholar]
- Mapes, J.; New, C.; Szwejczewski, M. Performance trade-offs in manufacturing plants. Int. J. Oper. Prod. Manag. 1997, 17, 1020–1033. [Google Scholar] [CrossRef]
- Memmel, T.; Reiterer, H.; Holzinger, A. Agile Methods and Visual Specification in Software Development: A Chance to Ensure Universal Access. In Artificial General Intelligence; Springer Science and Business Media LLC: Berlin/Heidelberg, Germany, 2007; Volume 4554, pp. 453–462. [Google Scholar]
- Licev, L.; Tomecek, J.; Babiuch, M. Object recognition for industrial image. In Proceedings of the 2014 15th International Carpathian Control Conference (ICCC), Velke Karlovice, Czech Republic, 28–30 May 2014; pp. 320–325. [Google Scholar]
- Ma, Y.; Wang, Z.; Yang, H.; Yang, L. Artificial intelligence applications in the development of autonomous vehicles: A survey. IEEE/CAA J. Autom. Sin. 2020, 7, 315–329. [Google Scholar] [CrossRef]
- Ghahramani, M.; Qiao, Y.; Zhou, M.; Hagan, A.O.; Sweeney, J. AI-based modeling and data-driven evaluation for smart manufacturing processes. IEEE/CAA J. Autom. Sin. 2020, 7, 1026–1037. [Google Scholar] [CrossRef]
- Holzinger, A.; Weippl, E.; Tjoa, A.M.; Kieseberg, P. Digital Transformation for Sustainable Development Goals (SDGs)—A Security, Safety and Privacy Perspective on AI. In Web-Age Information Management; Springer: Singapore, 2021; Volume 12844, pp. 1–20. [Google Scholar]
- The ABB Group—Automation and Power Technologies. Available online: http://www.abb.com/ (accessed on 14 December 2011).
- Taylor, W.A. What Every Engineer Should Know About Artificial Intelligence; MIT Press: Cambridge, MA, USA, 1988. [Google Scholar]
- Miskuf, M.; Zolotova, I. Application of business intelligence solutions on manufacturing data. In Proceedings of the 2015 IEEE 13th International Symposium on Applied Machine Intelligence and Informatics (SAMI), Herlany, Slovakia, 22–24 January 2015; pp. 193–197. [Google Scholar]
- Kebria, P.M.; Khosravi, A.; Salaken, S.M.; Nahavandi, S. Deep imitation learning for autonomous vehicles based on convolutional neural networks. IEEE/CAA J. Autom. Sin. 2020, 7, 82–95. [Google Scholar] [CrossRef]
- Wang, G.; Qiao, J.; Bi, J.; Li, W.; Zhou, M. TL-GDBN: Growing Deep Belief Network With Transfer Learning. IEEE Trans. Autom. Sci. Eng. 2019, 16, 874–885. [Google Scholar] [CrossRef]
- Weber, P.; Simon, C. Beneflts of Bayesian Network Models; ISTE Ltd; John Wiley & Sons, Inc.: London, UK, 2016. [Google Scholar]
- Schmidt, R.M. “Recurrent Neural Networks (RNNs): A Gentle Introduction and Overview,” arXiv191205911 Cs Stat, November 2019. Available online: http://arxiv.org/abs/1912.05911 (accessed on 7 October 2020).
- Krose, B.; van der Smagt, P. An Introduction to Neural Networks; University of Amsterdam: Amsterdam, The Netherlands, 1996. [Google Scholar]
- Hopfield, J.J. Neural networks and physical systems with emergent collective computational abilities. Proc. Natl. Acad. Sci. USA 1982, 79, 2554–2558. [Google Scholar] [CrossRef] [PubMed] [Green Version]
- Ackley, D.H.; Hinton, G.E.; Sejnowski, T.J. A learning algorithm for boltzmann machines. Cogn. Sci. 1985, 9, 147–169. [Google Scholar] [CrossRef]
- Buchanan, B. A (Very) Brief History of Artificial Intelligence. AI Mag. 2005, 26, 53–60. [Google Scholar]
- LeCun, Y.; Bottou, L.; Orr, G.B.; Müller, K.-R. Efficient BackProp. In Neural Networks: Tricks of the Trade; Springer: Berlin/Heidelberg, Germany, 1998; pp. 9–48. [Google Scholar]
- Rojas, R. Neural Networks: A Systematic Introduction; Springer: Berlin/Heidelberg, Germany, 1996. [Google Scholar]
- Van Der Malsburg, C. Frank Rosenblatt: Principles of Neurodynamics: Perceptrons and the Theory of Brain Mechanisms. In Brain Theory; Springer: Berlin/Heidelberg, Germany, 1986; pp. 245–248. [Google Scholar] [CrossRef]
- Kvasnička, V. Application of Adaptive Mixture of Local Neural Networks in Chemistry. Mol. Similarity React. 1995, 3, 163–174. [Google Scholar] [CrossRef]
- Widrow, H. ADALINE (ADAptive LInear NEuron). 1960. Available online: https://www-isl.stanford.edu/~widrow/papers/t1960anadaptive.pdf (accessed on 12 July 2019).
- Ramchoun, H.; Idrissi, M.A.J.; Ghanou, Y.; Ettaouil, M. Multilayer Perceptron: Architecture Optimization and Training. Int. J. Interact. Multimed. Artif. Intell. 2016, 4, 26. [Google Scholar] [CrossRef]
- Svozil, D.; Kvasnicka, V.; Pospichal, J. Introduction to multi-layer feed-forward neural networks. Chemom. Intell. Lab. Syst. 1997, 39, 43–62. [Google Scholar] [CrossRef]
- Li, Q.; Cai, W.; Wang, X.; Zhou, Y.; Feng, D.D.; Chen, M. Medical image classification with convolutional neural network. In Proceedings of the 2014 13th International Conference on Control Automation Robotics & Vision (ICARCV), Singapore, 10–12 December 2014; pp. 844–848. [Google Scholar]
- Zhang, J.-X.; Ling, Z.-H.; Liu, L.-J.; Jiang, Y.; Dai, L.-R. Sequence-to-Sequence Acoustic Modeling for Voice Conversion. IEEE/ACM Trans. Audio Speech Lang. Process. 2019, 27, 631–644. [Google Scholar] [CrossRef] [Green Version]
- Young, T.; Hazarika, D.; Poria, S.; Cambria, E. Recent Trends in Deep Learning Based Natural Language Processing. IEEE Comput. Intell. Mag. 2018, 13, 55–75. [Google Scholar] [CrossRef]
- Jiang, Y.-G.; Wu, Z.; Tang, J.; Li, Z.; Xue, X.; Chang, S.-F. Modeling Multimodal Clues in a Hybrid Deep Learning Framework for Video Classification. IEEE Trans. Multimed. 2018, 20, 3137–3147. [Google Scholar] [CrossRef] [Green Version]
- Minsky, M.; Papert, S. Perceptrons: An Introduction to Computational Geometry; MIT Press: Cambridge, MA, USA, 1969. [Google Scholar]
- Rumelhart, D.E.; Hinton, G.E.; Williams, R.J. Parallel Distributed Processing: Explorations in the Microstructure of Cognition; MIT Press: Cambridge, MA, USA, 1986; Volume 1, pp. 318–362. [Google Scholar]
- Holzinger, A.; Popova, E.; Peischl, B.; Ziefle, M. On Complexity Reduction of User Interfaces for Safety-Critical Systems. In Lecture Notes in Computer Science; Springer: Singapore, 2012; Volume 7465, pp. 108–122. [Google Scholar]
- Demšar, J.; Curk, T.; Erjavec, A.; Gorup, Č.; Hočevar, T.; Milutinovič, M.; Možina, M.; Polajnar, M.; Toplak, M.; Starič, A.; et al. Orange: Data Mining Toolbox in Python. J. Mach. Learn. Res. 2013, 14, 2349–2353. [Google Scholar]
- George, G.A.; Landryova, L. Interaction between human and AI systems—When automated systems move towards autonomous. In Proceedings of the 2019 20th International Carpathian Control Conference, ICCC 2019, Wieliczka, Poland, 26–29 May 2019. [Google Scholar]
Figure 1.
Operator Environments—An increasing amount of presented data have reached complexity beyond human comprehension.
Figure 1.
Operator Environments—An increasing amount of presented data have reached complexity beyond human comprehension.
Figure 2.
Digital technologies are reviving AI advances—Processing power lifts big data and algorithms to the next level of Artificial Intelligence.
Figure 2.
Digital technologies are reviving AI advances—Processing power lifts big data and algorithms to the next level of Artificial Intelligence.
Figure 3.
AI terms commonly interchanged in industrial practice.
Figure 3.
AI terms commonly interchanged in industrial practice.
Figure 4.
AI key components illustrated in the form of the closed loop control system scheme.
Figure 4.
AI key components illustrated in the form of the closed loop control system scheme.
Figure 6.
McCulloch-Pitts formal neurons.
Figure 6.
McCulloch-Pitts formal neurons.
Figure 7.
Example of forward neural network.
Figure 7.
Example of forward neural network.
Figure 8.
Concept of AI training from rich data.
Figure 8.
Concept of AI training from rich data.
Figure 9.
Automation hierarchy according to the ISA-95 model [
38].
Figure 9.
Automation hierarchy according to the ISA-95 model [
38].
Figure 10.
DCS alarm features for alarm display and event log.
Figure 10.
DCS alarm features for alarm display and event log.
Figure 11.
Screenshot of the exported data table.
Figure 11.
Screenshot of the exported data table.
Figure 12.
Screenshot of alarm data classification table using binary value instances.
Figure 12.
Screenshot of alarm data classification table using binary value instances.
Figure 13.
Simulation model in Orange software environment showing seven different machine learning methods of data processing from the input File with the data from which the neural network will learn from. File (2) goes to the widget and uploads the data, where human error caused unclassified exceptions.
Figure 14.
Misclassified data: at line 41 and 42 target types do not correspond to features.
Figure 14.
Misclassified data: at line 41 and 42 target types do not correspond to features.
Figure 15.
Test and score results: (a) Test and score results for each method, Naïve Bayes shows 1; (b) Misclassified data caused that the CA of the Naïve Bayes model is now not 1.
Figure 15.
Test and score results: (a) Test and score results for each method, Naïve Bayes shows 1; (b) Misclassified data caused that the CA of the Naïve Bayes model is now not 1.
Figure 16.
Confusion matrix shows and confirms 2 cases of incorrectly classified data.
Figure 16.
Confusion matrix shows and confirms 2 cases of incorrectly classified data.
Figure 17.
Prediction model for target types of operation data.
Figure 17.
Prediction model for target types of operation data.
Figure 18.
Result of target types for operation data.
Figure 18.
Result of target types for operation data.
Table 1.
Methods comparison with their classification accuracy.
Table 1.
Methods comparison with their classification accuracy.
| Method | Total Number of Input Samples | Correct Classifications | Classification Accuracy |
|---|
| Logistic regression | 82 | 81 | 0.987 |
| kNN | 82 | 79 | 0.961 |
| SVM | 82 | 79 | 0.961 |
| Naive Bayes | 82 | 82 | 1.000 |
| Random Forest | 82 | 80 | 0.974 |
| Tree | 82 | 77 | 0.935 |
| Neural Network | 82 | 80 | 0.974 |
| Publisher’s Note: MDPI stays neutral with regard to jurisdictional claims in published maps and institutional affiliations. |
© 2021 by the authors. Licensee MDPI, Basel, Switzerland. This article is an open access article distributed under the terms and conditions of the Creative Commons Attribution (CC BY) license (https://creativecommons.org/licenses/by/4.0/).


