
Microwave Dielectric Properties of β-CaSiO3 Glass–Ceramics Prepared Using Two-Step Heat Treatment


Abstract
1. Introduction
2. Materials and Methods
3. Results and Discussion
3.1. Phase Identification and Microwave Dielectric Properties of CaSiO3 Ceramics
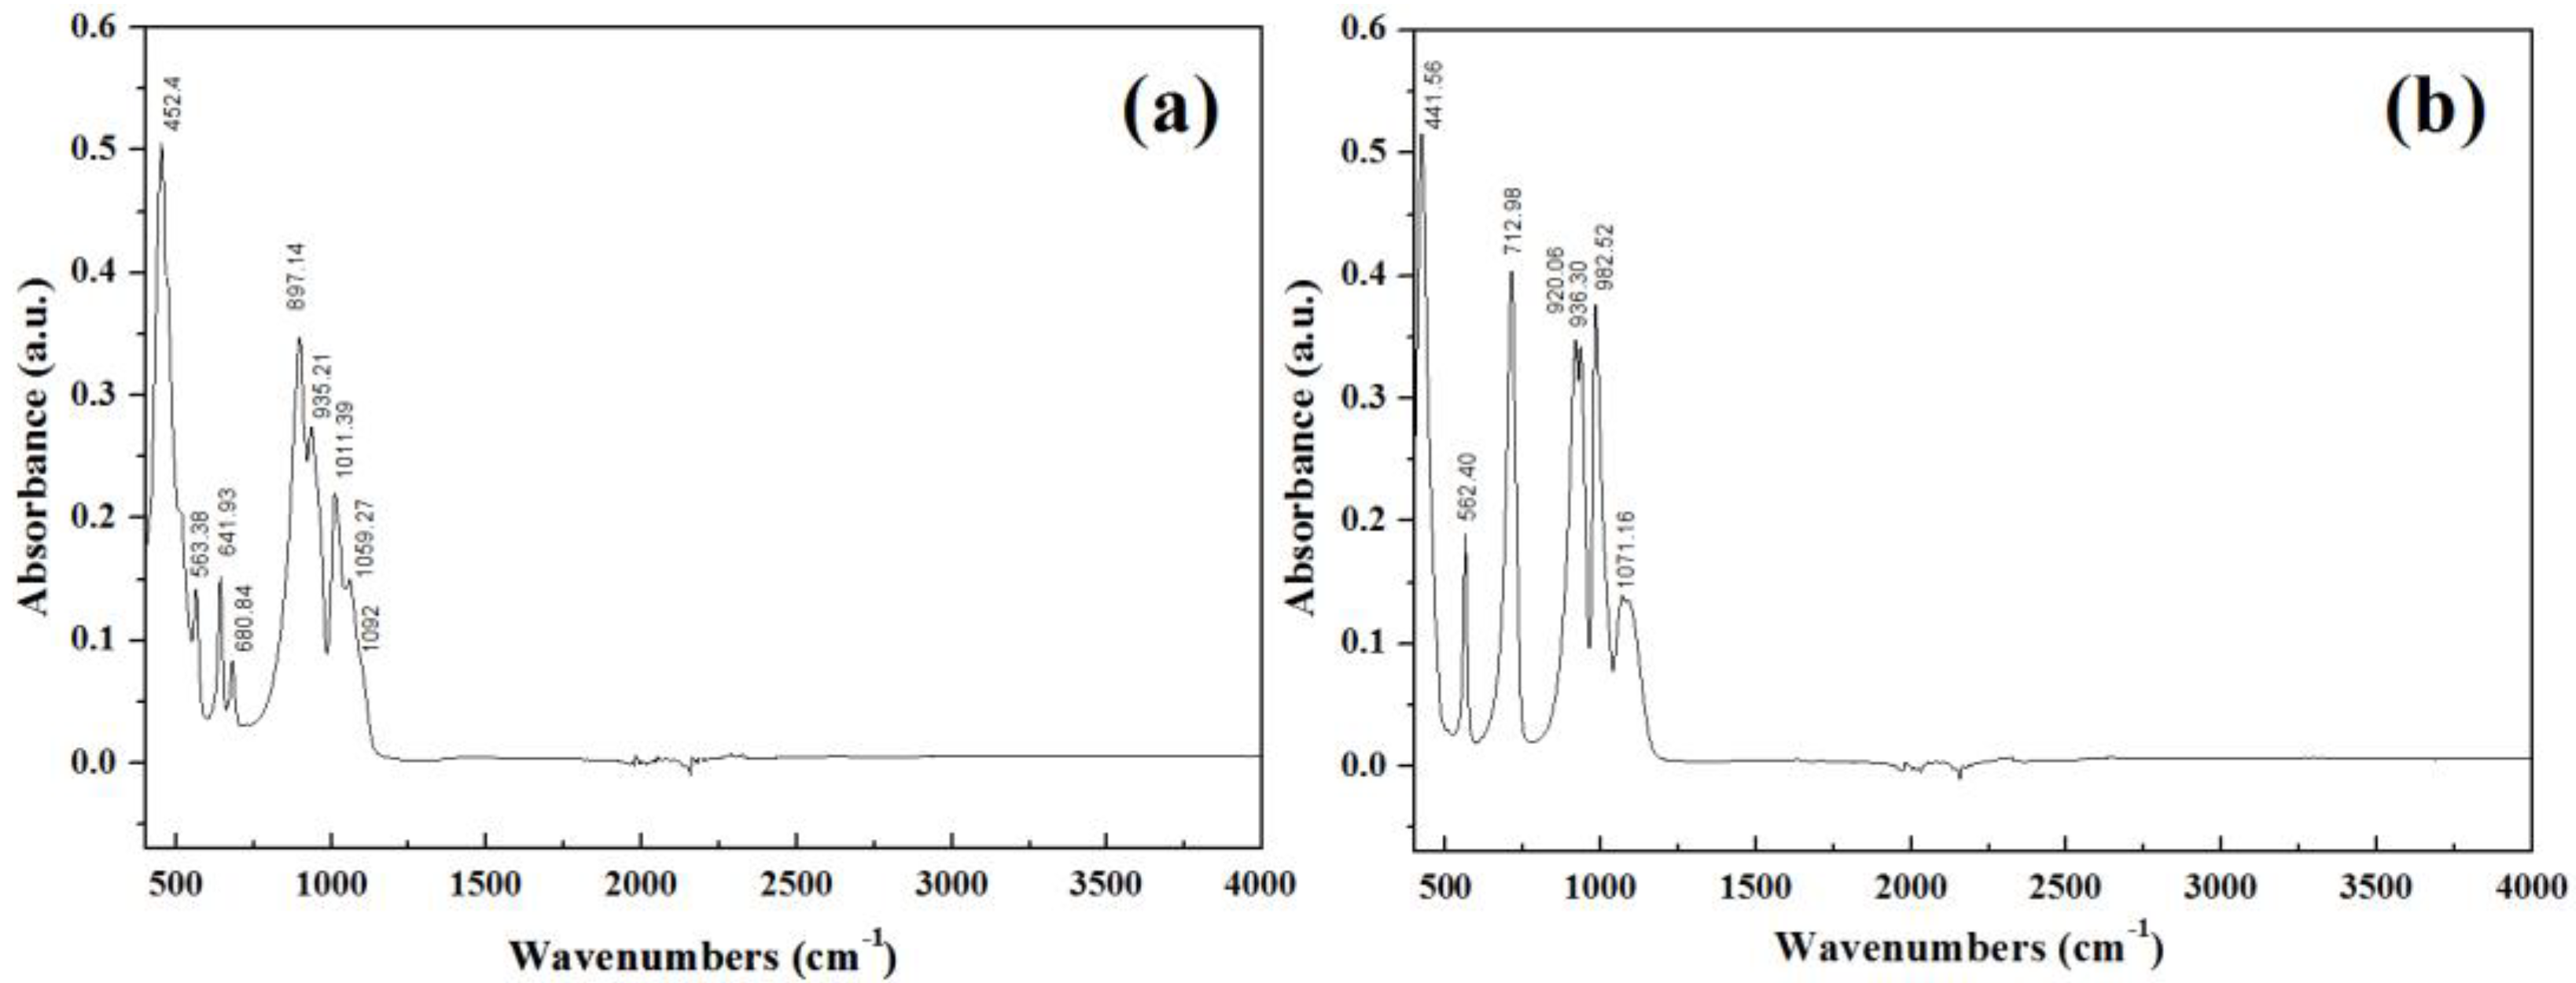
3.2. Degree of Crystallisation and Structural Analysis of β-CaSiO3 and α-CaSiO3
4. Conclusions
Author Contributions
Funding
Institutional Review Board Statement
Informed Consent Statement
Data Availability Statement
Acknowledgments
Conflicts of Interest
References
- Sebastian, M.T.; Jantunen, H. High Temperature Cofired Ceramic (HTCC), Low Temperature Cofired Ceramic (LTCC), and Ultralow Temperature Cofired Ceramic (ULTCC) Materials. Microw. Mater. Appl. 2017, 2, 355–425. [Google Scholar]
- Uchikoba, F.; Nakajima, S.; ITO, T. Fabrication of Multilayer Capacitors with Silver Internal Electrodes and Alumina-Glass Composite Materials. J. Ceram. Soc. Jpn. 1995, 103, 969–973. [Google Scholar] [CrossRef][Green Version]
- Chen, G.; Liu, X. Fabrication, Characterization and Sintering of Glass-Ceramics for low-Temperature Co-Fired Ceramic SUBSTRATES. J. Mater. Sci. Mater. Electron. 2004, 15, 595–600. [Google Scholar] [CrossRef]
- Sebastian, M.T.; Jantunen, H. Low Loss Dielectric Materials for LTCC Applications: A Review. Int. Mater. Rev. 2008, 53, 57–90. [Google Scholar] [CrossRef]
- Oxtoby, D.W. Homogeneous Nucleation: Theory and Experiment. J. Phys. Condens. Matter 1992, 4, 7627–7650. [Google Scholar] [CrossRef]
- Ramesh, R.; Nestor, E.; Pomeroy, M.J.; Hampshire, S. Classical and Differential Thermal Analysis Studies of the Glass-Ceramic Transformation in a YSiAlON Glass. J. Am. Ceram. Soc. 2005, 81, 1285–1297. [Google Scholar] [CrossRef]
- Lin, K.; Chang, J.; Zeng, Y.; Qian, W. Preparation of Macroporous Calcium Silicate Ceramics. Mater. Lett. 2004, 58, 2109–2113. [Google Scholar] [CrossRef]
- Deer, W.A.; Howie, R.A.; Zussman, J. Single-Chain Silicates. Rock-Forming Minerals, 2nd ed.; Geological Society: London, UK, 1997; Volume 2A, p. 547. [Google Scholar]
- Yang, H.; Prewitt, C.T. On the Crystal Structure of Pseudowollastonite(CaSiO3). Am. Mineral. 1999, 84, 929–932. [Google Scholar] [CrossRef]
- Li, D.; Wang, H.; He, Z.; Xiao, Z.; Lei, R.; Xu, S. Effect of CuO Addition on the Sintering Temperature and Microwave Dielectric Properties of CaSiO3–Al2O3 Ceramics. Prog. Nat. Sci. 2014, 24, 274–279. [Google Scholar] [CrossRef]
- Isao, K.; Itaru, S.; Hitoshi, O. Microwave Dielectric Properties of (Ca1-xSrx)SiO3 Ring Silicate Solid Solutions. Jpn. J. Appl. Phys. 2009, 48, 09KE02. [Google Scholar]
- Mohammadi, M.; Alizadeh, P.; Atlasbaf, Z. Effect of Frit Size on Sintering, Crystallization and Electrical Properties of Wollastonite Glass-Ceramics. J. Non-Cryst. Solids 2011, 357, 150–156. [Google Scholar] [CrossRef]
- Voron’ko, Y.K.; Sobol’, A.A.; Ushakov, S.N.; Jiang, G.; You, J. Phase Transformations and Melt Structure of Calcium Metasilicate. Inorg. Mater. 2002, 38, 825–830. [Google Scholar] [CrossRef]
- Barbieri, L.; Bondioli, F.; Lancellotti, I.; Leonelli, C.; Montorsi, M.; Ferrari, A.M.; Miselli, P. The Anorthite-Diopside System: Structural and Devitrification Study. Part II: Crystallinity Analysis by the Rietveld-RIR Method. J. Am. Ceram. Soc. 2005, 88, 3131–3136. [Google Scholar] [CrossRef]
- Yasukawa, K.; Terashi, Y.; Nakayama, A. Crystallinity Analysis of Glass-Ceramics by the Rietveld Method. J. Am. Ceram. Soc. 2005, 81, 2978–2982. [Google Scholar] [CrossRef]
- Roisnel, T.; Rodríguez-carvajal, J. WinPLOTR: A Windows Tool for Powder Diffraction Pattern Analysis. Mater. Sci. Forum 2001, 378–381, 118–123. [Google Scholar] [CrossRef]
- Hakki, B.W.; Coleman, P.D. A Dielectric Resonator Method of Measuring inductive Capacities in the Millimeter Range. IRE Trans. Microw. Theory Technol. 1960, 8, 402–410. [Google Scholar] [CrossRef]
- Nishikawa, T.; Wakino, K.; Tamura, H.; Tanaka, H.; Ishikawa, Y. Precise Measurement Method for Temperature Coefficient of Microwave Dielectric Resonator Material. IEEE MTT-S Int. Microw. Symp. Dig. 1987, 1, 277–280. [Google Scholar]
- Sreekanth, C.R.P.; Nagabhushana, B.M.; Chandrappa, G.T.; Ramesh, K.P.; Rao, J.L. Solution Combustion Derived NANOCRYSTALLINE Macroporous Wollastonite Ceramics. Mater. Chem. Phys. 2006, 95, 169–175. [Google Scholar] [CrossRef]
- Taniguchi, T.; Okuno, M.; Matsumoto, T. X-ray Diffraction and EXAFS Studies of Silicate Glasses Containing Mg, Ca and Ba Atoms. J. Non-Cryst. Solids 1997, 211, 56–63. [Google Scholar] [CrossRef]
- Hesse, K.-F. Refinement of the Crystal Structure of Wollastonite-2M (Parawollastonite). Z. Kristallogr. Cryst. Mater. 1984, 168, 93–98. [Google Scholar] [CrossRef]
- Iddles, D.M.; Bell, A.J.; Moulson, A.J. Relationships between Dopants, Microstructure and the Microwave Dielectric Properties of ZrO2-TiO2-SnO2 Ceramics. J. Mater. Sci. 1992, 27, 6303–6310. [Google Scholar] [CrossRef]
- Penn, S.J.; Alford, N.M.; Templeton, A.; Wang, X.; Xu, M.; Reece, M.; Schrapel, K. Effect of Porosity and Grain Size on the Microwave Dielectric Properties of Sintered Alumina. J. Am. Ceram. Soc. 2005, 80, 1885–1888. [Google Scholar] [CrossRef]
- Hewlett, P.; Liska, M. Lea’s Chemistry of Cement and Concrete; Butterworth-Heinemann: Oxford, UK, 2019. [Google Scholar]
- Toby, B.H. R Factors in Rietveld Analysis: How Good Is Good Enough? Powder Diffr. 2006, 21, 67–70. [Google Scholar] [CrossRef]
- Singh, S.K.; Murthy, V.R.K. Crystal Structure, Raman Spectroscopy and Microwave Dielectric Properties of Layered-Perovskite BaA2Ti3O10 (A = La, Nd and Sm) Compounds. Mater. Chem. Phys. 2015, 160, 187–193. [Google Scholar] [CrossRef]
- Brown, I.D.; Shannon, R.D. Empirical Bond-Strength–Bond-Length Curves for Oxides. Acta Cryst. A 1973, 29, 266–282. [Google Scholar] [CrossRef]
- Zulumyan, N.; Mirgorodski, A.; Isahakyan, A.; Beglaryan, H.; Gabrielyan, A.; Terzyan, A. A Low-Temperature Method of the β—Wollastonite Synthesis. J. Therm. Anal. Calorim. 2015, 122, 97–104. [Google Scholar] [CrossRef]
- Zhao, C.; Wang, G.; Li, S.; Ai, X.; Wang, Z.; Zhai, Y. Reaction Pathway Led by Silicate Structure Transformation on Decomposition of CaSiO3 in Alkali Fusion Process Using NaOH. Trans. Nonferrous Met. Soc. China 2015, 25, 3827–3833. [Google Scholar] [CrossRef]
- Bobkova, N.M.; Tizhovka, Z.S.; Tizhovka, V.V. A Spectroscopic Study of the Structure of Glasses in the CaO-SiO2 System. J. Appl. Spectrosc. 1979, 30, 99–102. [Google Scholar] [CrossRef]
- Paluszkiewicz, C.; Blazewicz, M.; Podporska, J.; Gumula, T. Nucleation of Hydroxyapatite Layer on Wollastonite Material Surface: FTIR Studies. Vib. Spectrosc. 2008, 48, 263–268. [Google Scholar] [CrossRef]
- Bian, J.; Kim, D.-W.; Hong, K.S. Microwave Dielectric Properties of Ca2P2O7. J. Eur. Ceram. Soc. 2003, 23, 2589–2592. [Google Scholar] [CrossRef]


| β-CaSiO3 | Relative Density [%] | K | Qf [GHz] |
|---|---|---|---|
| (a) | 97.44 | 6.66 | 52640 |
| (b) | 58.07 | 4.45 | 2120 |
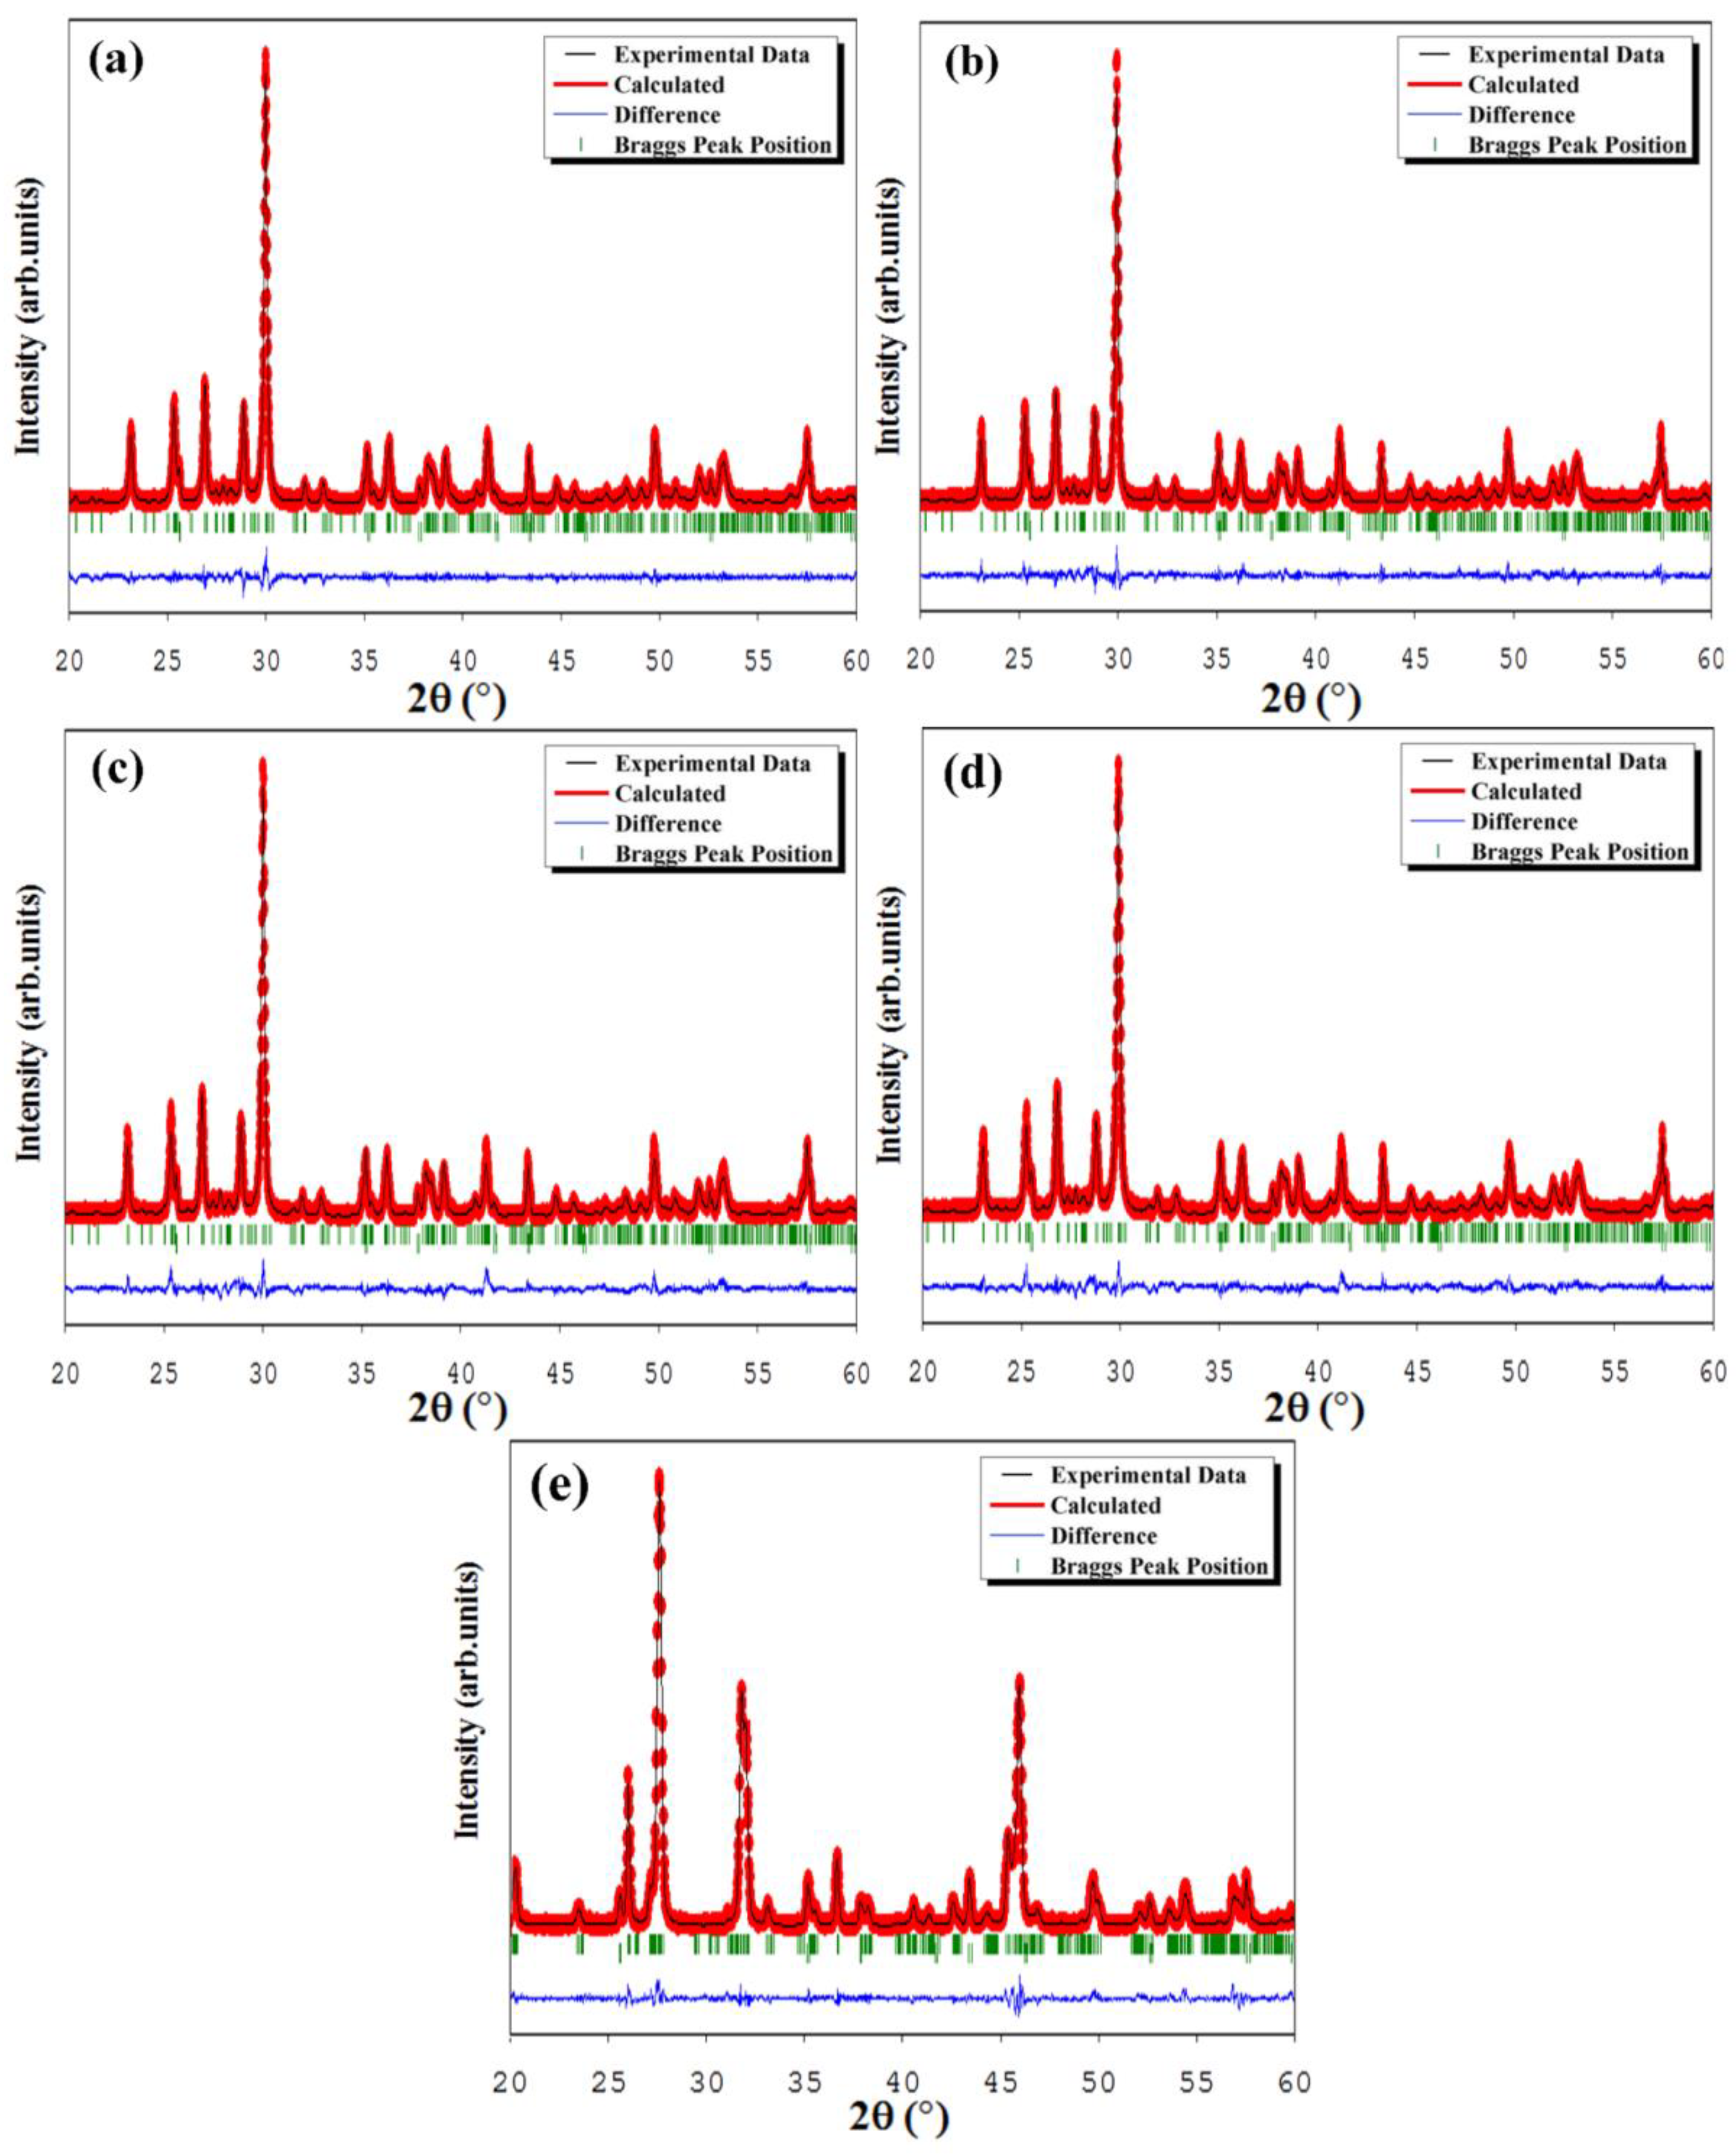
| Phase | β | α | |||
|---|---|---|---|---|---|
| Process | Glass-Ceramics | Solid State Reaction | |||
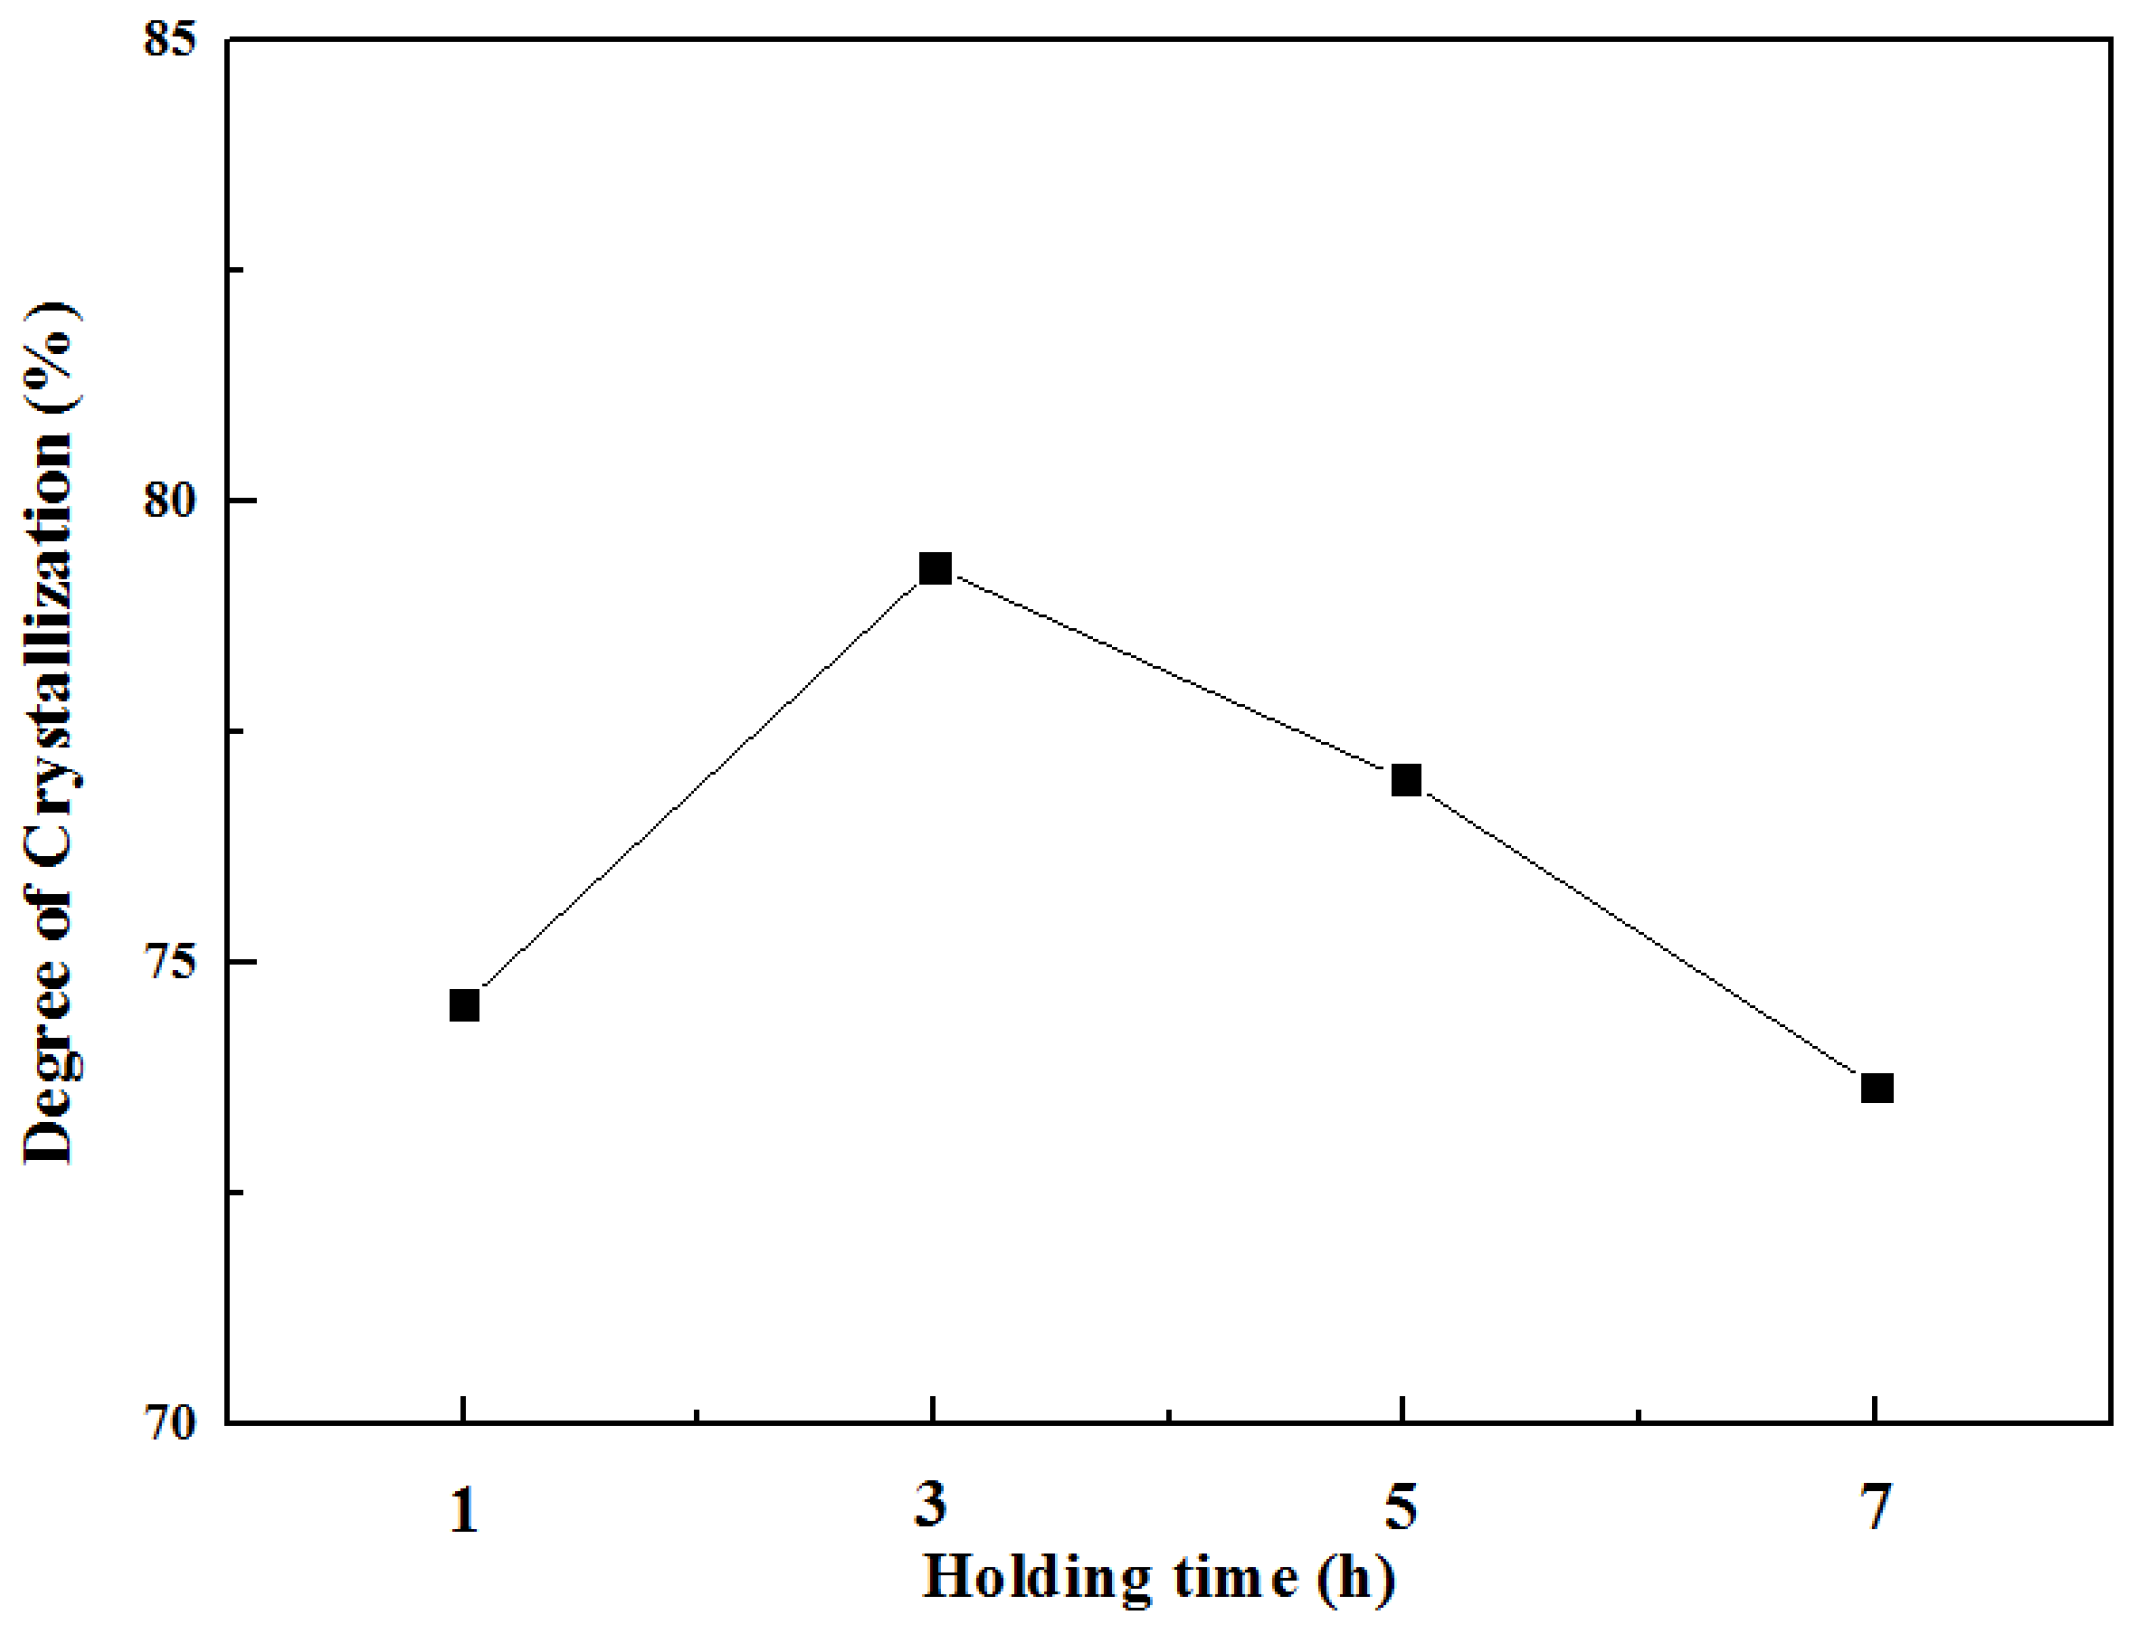
| Heat-treatment conditions | 730 °C/1 h And 900 °C/3 h | 730 °C/3 h And 900 °C/3 h | 730 °C/5 h And 900 °C/3 h | 730 °C/7 h And 900 °C/3 h | 1480 °C/3 h |
| CaSiO3 (wt.%) | 87.03 | 87.71 | 87.39 | 86.94 | 88.56 |
| Al2O3 (wt.%) | 12.97 | 12.29 | 12.61 | 13.06 | 11.44 |
| Degree of crystallisation (%) | 74.56 | 79.30 | 77.00 | 73.67 | 86.01 |
| GoF | 2.6 | 2.5 | 3.1 | 2.9 | 3.1 |
| Rwp | 10.9 | 10.5 | 11.4 | 11.5 | 10.8 |
| RF factor (CaSiO3) | 4.31 | 3.98 | 3.87 | 4.22 | 3.72 |
| RF factor (Al2O3) | 2.06 | 1.99 | 2.60 | 2.21 | 2.37 |
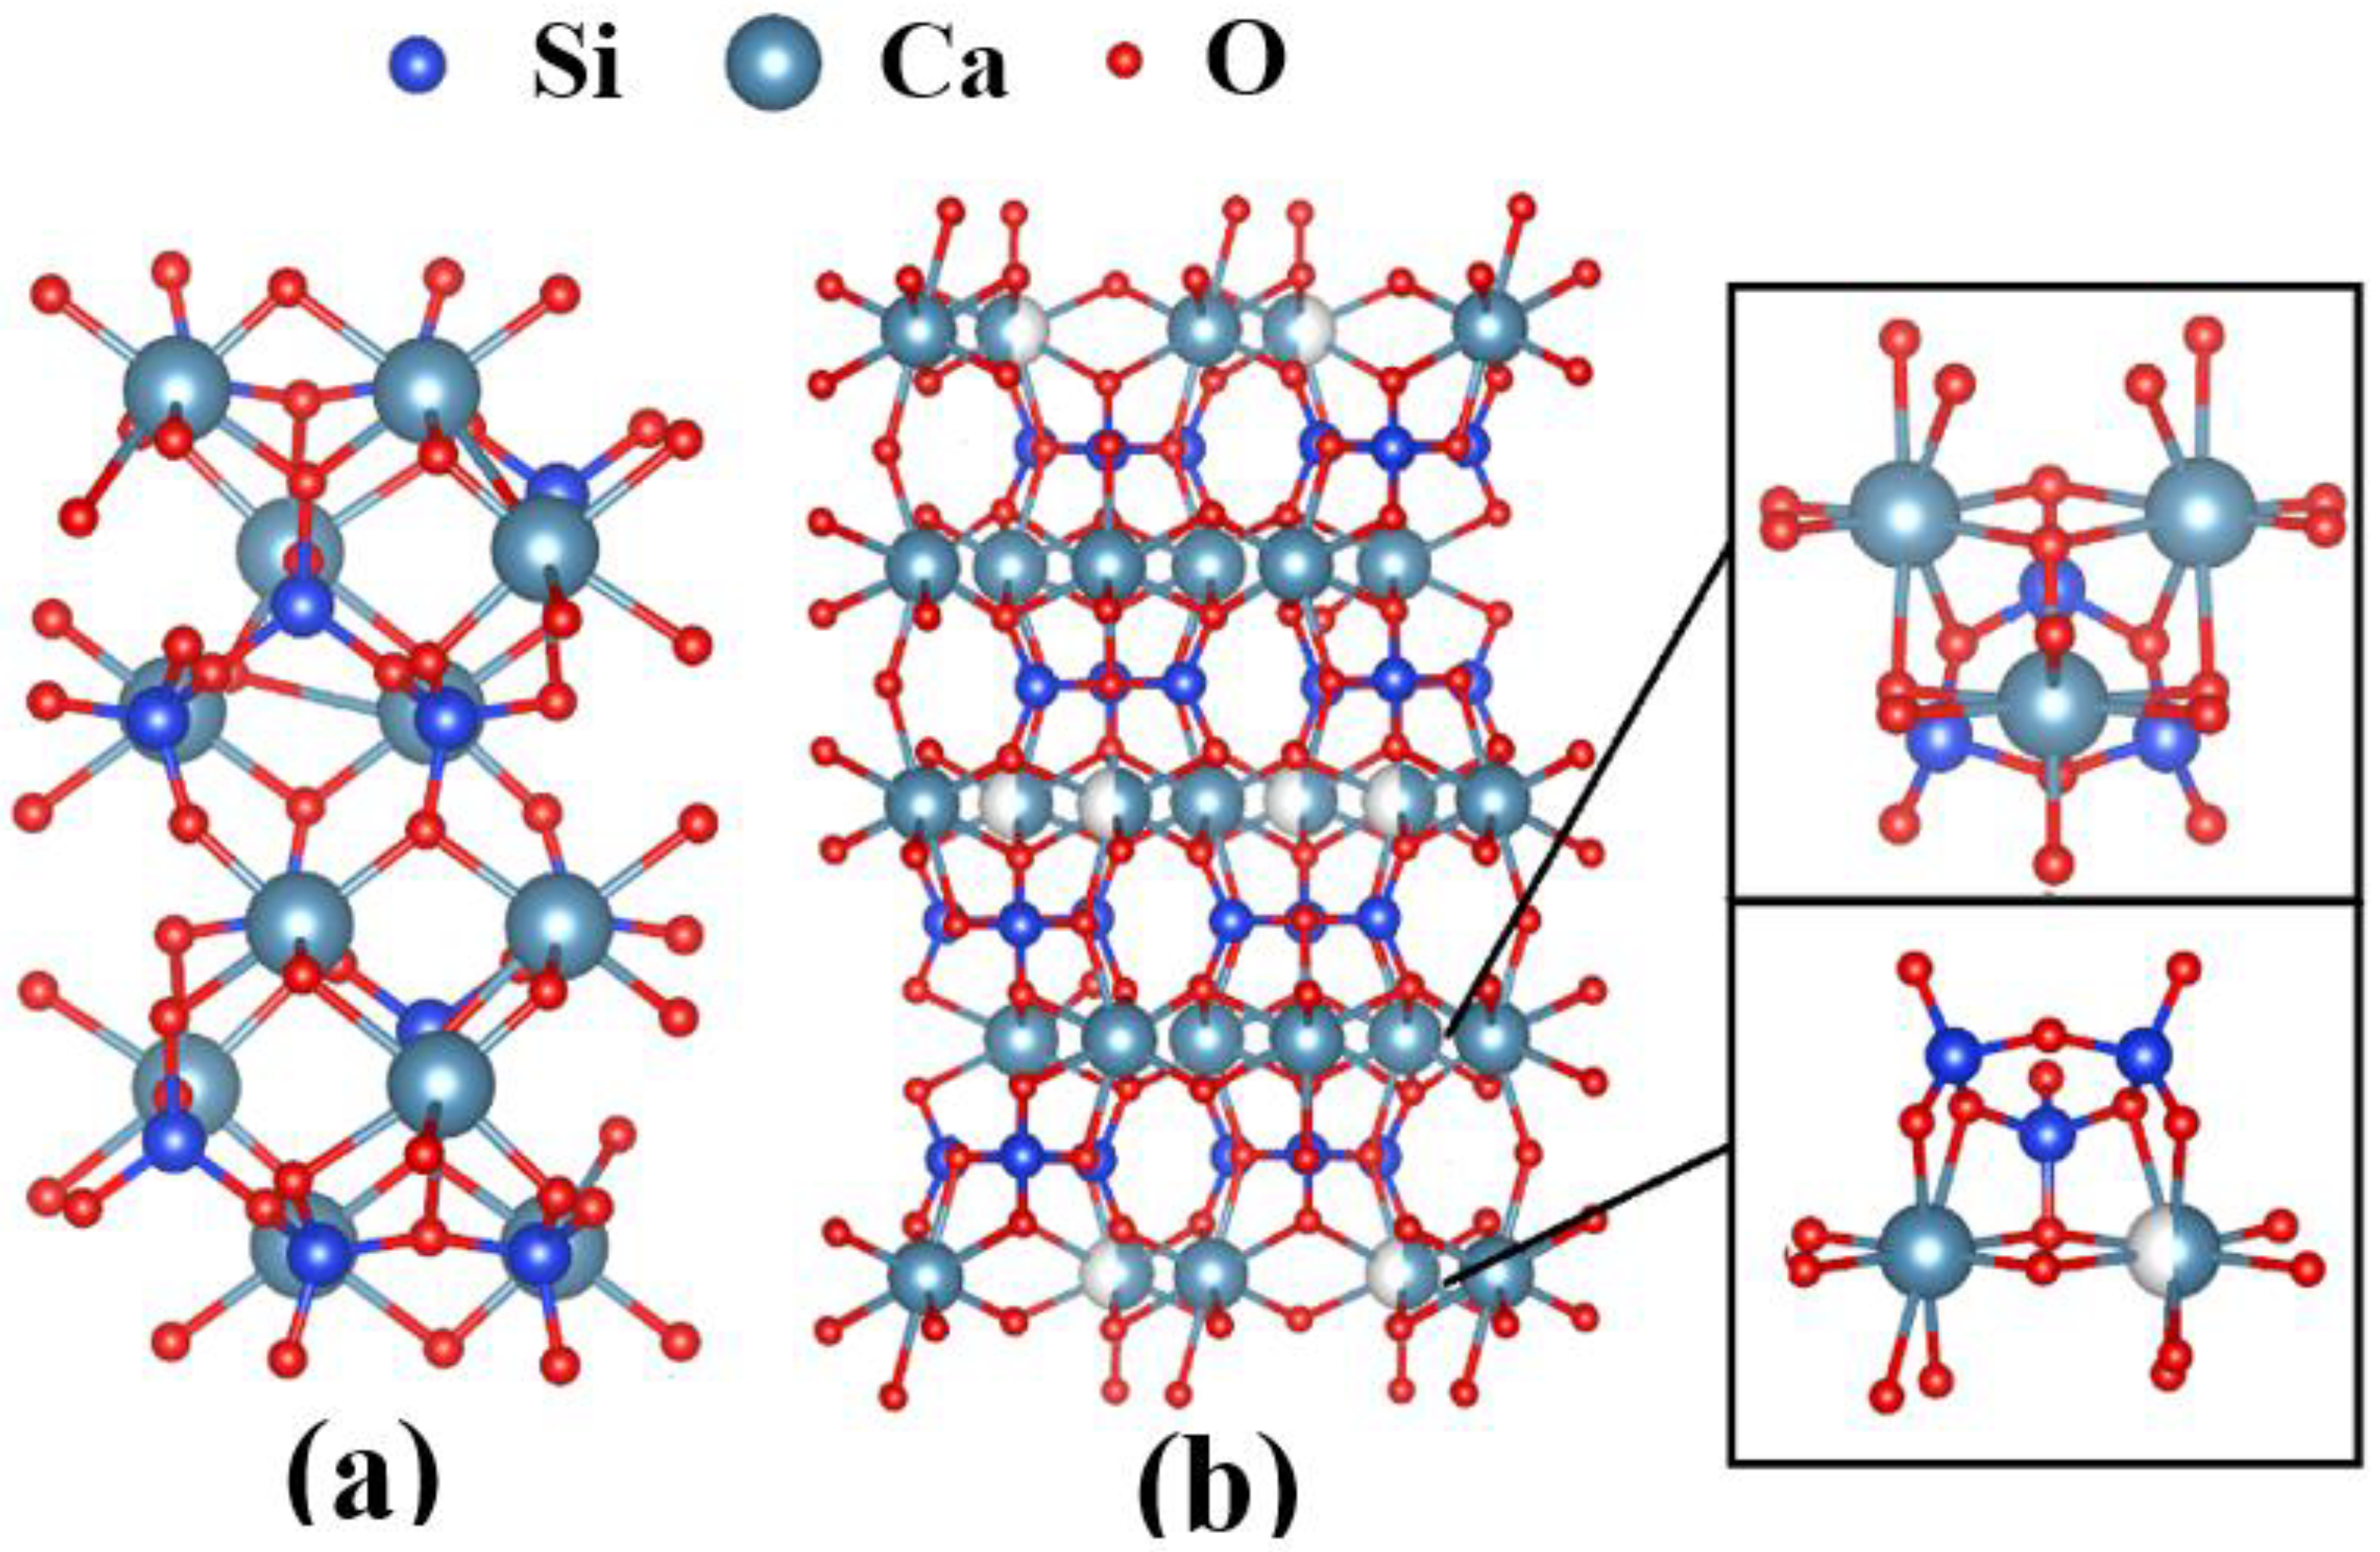
| CaSiO3 | Ca–O Bond | Si–O Bond | ||||||||
|---|---|---|---|---|---|---|---|---|---|---|
| Ravg | R0 | s0 | N | <SCa-O> | Ravg | R0 | s0 | N | <SSi-O> | |
| β | 2.405 | 2.437 | 0.25 | 5.5 | 0.270 | 1.654 | 1.605 | 1.0 | 4.0 | 0.893 |
| α | 2.565 | 2.437 | 0.25 | 5.5 | 0.193 | 1.629 | 1.605 | 1.0 | 4.0 | 0.942 |
| CaSiO3 | <Ca–O>1 | <Ca–O>2 | <Ca–O>3 | <Ca–O>4 | <Ca–O>5 | <Si–O>1 | <Si–O>2 | <Si–O>3 |
|---|---|---|---|---|---|---|---|---|
| β | 2.323 | 2.31 | 2.37 | 1.64248 | 1.62 | 1.734 | ||
| 2.05 | 2.38 | 2.27 | 1.57 | 1.65065 | 1.66443 | |||
| 2.32 | 2.368 | 2.472 | 1.6475 | 1.52 | 1.66245 | |||
| 2.755 | 2.27 | 2.2 | 1.75 | 1.6014 | 1.79 | |||
| 2.7 | 2.16 | 2.49 | ||||||
| 2.54 | 2.46 | 2.51 | ||||||
| 2.55 | 2.59 | 2.42 | ||||||
| α | 2.3106 | 2.6854 | 2.6367 | 2.3422 | 2.3351 | 1.66384 | 1.6619 | 1.5929 |
| 2.5742 | 2.5685 | 2.6326 | 2.5811 | 2.5992 | 1.66256 | 1.5844 | 1.6627 | |
| 2.5984 | 2.5609 | 2.5779 | 2.5885 | 2.5882 | 1.5939 | 1.5839 | 1.6621 | |
| 2.6796 | 2.6489 | 2.2821 | 2.6682 | 2.6626 | 1.5835 | 1.6611 | 1.6389 | |
| 2.3106 | 2.5609 | 2.5951 | 2.5811 | 2.6626 | ||||
| 2.5742 | 2.6854 | 2.2811 | 2.3422 | 2.5882 | ||||
| 2.6796 | 2.5685 | 2.5971 | 2.6682 | 2.3351 | ||||
| 2.5984 | 2.6489 | 2.5666 | 2.5885 | 2.5992 |
Publisher’s Note: MDPI stays neutral with regard to jurisdictional claims in published maps and institutional affiliations. |
© 2021 by the authors. Licensee MDPI, Basel, Switzerland. This article is an open access article distributed under the terms and conditions of the Creative Commons Attribution (CC BY) license (https://creativecommons.org/licenses/by/4.0/).
Share and Cite
Baek, J.-S.; Jo, N.-B.; Kim, E.-S. Microwave Dielectric Properties of β-CaSiO3 Glass–Ceramics Prepared Using Two-Step Heat Treatment. Processes 2021, 9, 2180. https://doi.org/10.3390/pr9122180
Baek J-S, Jo N-B, Kim E-S. Microwave Dielectric Properties of β-CaSiO3 Glass–Ceramics Prepared Using Two-Step Heat Treatment. Processes. 2021; 9(12):2180. https://doi.org/10.3390/pr9122180
Chicago/Turabian StyleBaek, Jin-Seok, Nak-Beom Jo, and Eung-Soo Kim. 2021. "Microwave Dielectric Properties of β-CaSiO3 Glass–Ceramics Prepared Using Two-Step Heat Treatment" Processes 9, no. 12: 2180. https://doi.org/10.3390/pr9122180
APA StyleBaek, J.-S., Jo, N.-B., & Kim, E.-S. (2021). Microwave Dielectric Properties of β-CaSiO3 Glass–Ceramics Prepared Using Two-Step Heat Treatment. Processes, 9(12), 2180. https://doi.org/10.3390/pr9122180