Review

Biological Indicators for Fecal Pollution Detection and Source Tracking: A Review

Department of Biology, McMaster University, Hamilton, ON L8S 4L8, Canada
*
Author to whom correspondence should be addressed.
Processes 2021, 9(11), 2058; https://doi.org/10.3390/pr9112058
Submission received: 24 October 2021 / Revised: 12 November 2021 / Accepted: 15 November 2021 / Published: 17 November 2021

Abstract

:
Fecal pollution, commonly detected in untreated or less treated sewage, is associated with health risks (e.g., waterborne diseases and antibiotic resistance dissemination), ecological issues (e.g., release of harmful gases in fecal sludge composting, proliferative bacterial/algal growth due to high nutrient loads) and economy losses (e.g., reduced aqua farm harvesting). Therefore, the discharge of untreated domestic sewage to the environment and its agricultural reuse are growing concerns. The goals of fecal pollution detection include fecal waste source tracking and identifying the presence of pathogens, therefore assessing potential health risks. This review summarizes available biological fecal indicators focusing on host specificity, degree of association with fecal pollution, environmental persistence, and quantification methods in fecal pollution assessment. The development of practical tools is a crucial requirement for the implementation of mitigation strategies that may help confine the types of host-specific pathogens and determine the source control point, such as sourcing fecal wastes from point sources and nonpoint sources. Emerging multidisciplinary bacterial enumeration platforms are also discussed, including individual working mechanisms, applications, advantages, and limitations.

1. Introduction

Fecal pollution may cause public health and ecological issues, as it may be associated with the release of pathogens, antibiotic-resistant organisms, high nutrient loads, and the emission of harmful gases [1,2,3,4]. Commonly affected areas include soil, sediment, farmland, wastewater treatment plants (WWTPs), and many water bodies such as drinking water sources, recreational water, and groundwater [2,4,5,6,7]. Fecal pollution can occur from untreated sewage. In developing and undeveloped countries, untreated sewage is sometimes discharged directly into surface water bodies [8,9]. Polluted water may infiltrate into the ground, rendering groundwater no longer safe for drinking and agricultural purposes [8,9,10]. According to the WHO, at least 2 billion people worldwide used an unsecured drinking water source polluted with feces in 2017 [11], causing diseases like diarrhea, typhoid, cholera, and dysentery. In 2016, diarrheal diseases ranked as the 8th leading cause of mortality among all ages (more than 1.6 million deaths) and the 5th leading cause of death among children under 5 years old (around 0.45 million deaths, mainly in South Asia and Africa) across 195 countries [12].
Pathogens of different types and infectious doses may differ based on their existing environments, exposure conditions, host susceptibility, and seasonality [13,14,15]. For example, swimmers exposed to fecal-polluted recreational waters usually develop mild to no symptoms. In contrast, people who cook with fecal-polluted drinking water tend to have acute and severe symptoms. Children under 5 years old and seniors over 70 years old are statistically more vulnerable to waterborne diseases due to reduced immunity [11,16]. Viral pathogens and protozoan parasites may have relatively lower infectious doses than bacterial pathogens, making them a more serious threat [17]. After seasonal rainfalls, short periods of elevated fecal pollution are frequently reported, suggesting a seasonality of waterborne disease outbreaks [14,15]. Table 1 summarizes recent epidemics of waterborne and foodborne diseases that occurred within the last decade. These diseases, however, often have mild or even no early symptoms. Even when symptoms are severe, it remains challenging to attribute diseases to specific fecal pollution exposure [3]. These frequently reported outbreaks signify the importance of the need for fecal pollution monitoring.
Another health concern is the undesired dissemination of antibiotic-resistant bacteria (ARB) and antibiotic resistance genes (ARGs) to the environment. Antibiotic residues reach the sewage systems via feces, urine, and body remains [36], which explains why WWTPs are often a hotspot for mixing antibiotics, ARB and ARGs and for their spread into the receiving environment [36]. Elevated ARB and ARGs are frequently measured in areas with increased exposure to municipal wastewater [2,37,38,39], resulting in a correlation between fecal pollution and antibiotic resistance dissemination. Although antibiotic concentrations in sewage are much lower than their therapeutic dosage in humans or animals, they may still be high enough to affect susceptible environmental bacteria and pose a selective pressure for the evolution of resistant bacteria [2,40]. Multidrug-resistant bacterial pathogens may cause difficult-to-treat or even untreatable infections because conventional antibiotics may not be effective. Moreover, ARGs can spread among non-resistant bacteria by horizontal gene transfer.
Ecological issues associated with fecal pollution are noticeable as well. Fecal wastes are rich in organic matters and nutrients such as ammonium, sulfate, phosphate and potassium [41]. Therefore, their discharge into the environment can be seen as nutrient loads, which can alleviate nutrient limitation and stimulate nutrient recycling, but sometimes causes eutrophication and the emission of harmful gases such as NH3, H2S, N2O and CH4 [42,43]. Birds can also heavily impact water systems. For example, cormorant defecation in shallow-water ecosystems can lead to algal bloom formation [44]. Defecation by a small cormorant population may not have a significant impact, but a group living in large colonies makes their feces quantitatively relevant as a nutrient input. Similarly, fish can also contribute to the hyper-bloom of cyanobacteria through intensive consumption of herbivorous zooplankton, although some fish such as tilapia can digest cyanobacteria completely [45].
Fecal sludge is widely used as a fertilizer with or without treatment in agriculture due to its high nutrient loads. Fecal sludge application may increase soil fertility, especially regarding carbon retention, but retention of bioavailable phosphorus and nitrogen can be low [46]. Furthermore, untreated fecal sludge poses risks to the crops because of pathogens, heavy metals, and toxic levels of ammonia and nitrite; additionally, the intensive fermentation activities within untreated fecal sludge can result in hypoxia in the rhizosphere [47,48]. To avoid these risks, treatment of fecal sludge or wastewater is required before its agricultural reuse. Composting, the aerobic and thermophilic mineralization of organic matters, is a standard fecal sludge treatment [49]. It effectively eliminates enteric pathogens and parasite eggs due to increased internal temperatures within the fecal sludge. Moreover, mineralized nutrients have improved plant uptake. However, the emission of biogas contaminants produced during composting, including sulfide, ammonia and greenhouse gases (e.g., methane, carbon dioxide and nitrous oxides), is inevitable [41,43,50]. Meanwhile, manure compost can potentially disseminate AGRs and ARB from livestock to soil/crops and finally to humans [51].
This review summarizes five fecal indicator bacteria and four fecal indicator viruses, focusing on their host specificity, degree of association with fecal pollution, environmental persistence, and quantification methods in fecal pollution assessment, together with individual enumeration methods (Figure 1), aiming to serve as a resource for researchers and engineers to evaluate indicators and methodologies for a specific application.

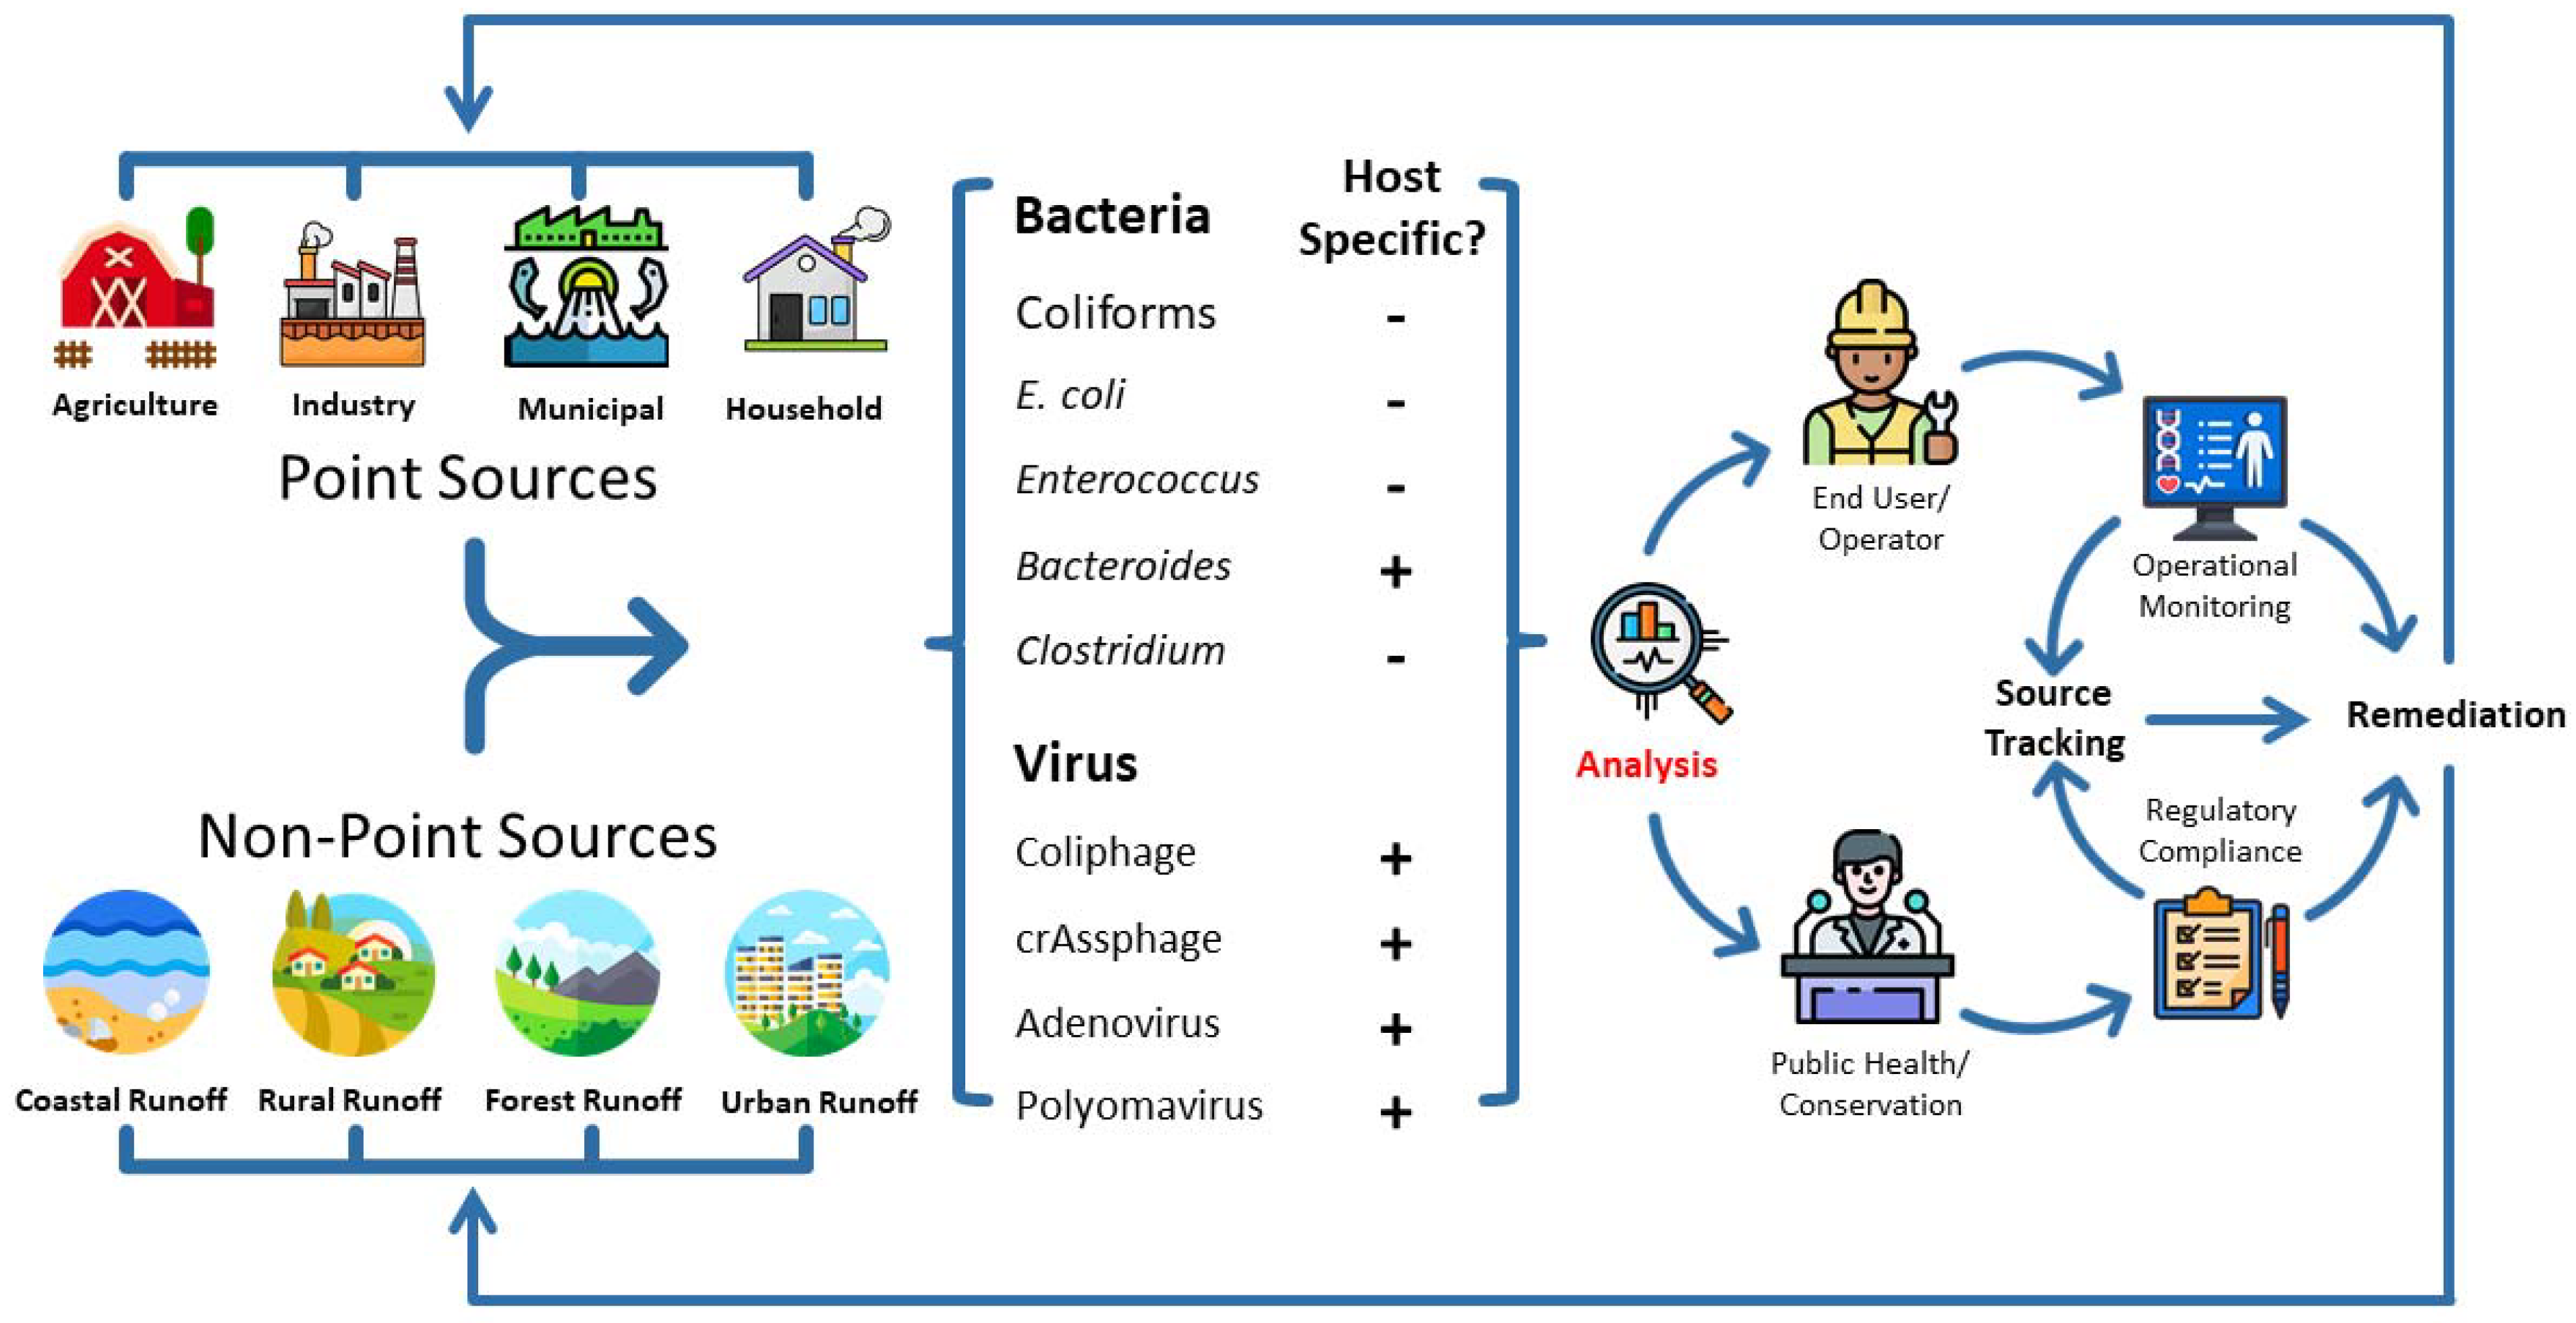
2. Fecal Pollution Detection Using Biological Markers

Fecal pollutants causing water quality problems may come from point sources and/or nonpoint sources. Point source pollution is fecal pollution events resulting from a single identifiable source, such as discharge from a WWTP or a leak from a septic tank. In contrast, nonpoint source pollution results from diffuse sources, such as runoff from residential areas and farmlands. Fecal waste from diffuse sources can be a persistent and cryptic input to the environment that may be present at low concentrations and difficult to trace compared to fecal wastes from point sources because diffuse sources can be a mixture of fresh and aged fecal wastes, and therefore require more complicated methods for source tracking [52]. According to the United States Environmental Protection Agency (U.S. EPA), fecal wastes from diffuse sources have become the leading cause of water quality problems in the U.S. [53]. Accurate identification of the source not only helps confine the types of host-specific pathogens but also determines the source control point and remediation strategies. There are several available indicators for fecal pollution detection or fecal source tracking purposes. Here we provide updates on five bacterial and four viral indicators recommended by the WHO, U.S. EPA and other studies.

2.1. Bacterial Markers

One major purpose of fecal pollution detection is to identify the presence of pathogens to identify the fecal waste source and potential health risks. With the realization that waterborne transmission of bacterial diseases was a public health concern in the 18th century, governments established sanitary systems to monitor drinking water safety and build water treatment facilities [54]. A question arises—should one monitor waterborne pathogens directly or employ proxy indicators? There are many bacterial, protozoan, and viral enteric pathogens that can cause diseases. Their methods of detection are often laborious, time-consuming, and require specialized expertise and biosafe laboratory settings. Pathogens in environmental water are sporadic and sparse, making it difficult or costly to measure these pathogens [3]. In addition, waterborne pathogens in the environment are less dangerous at low concentrations compared to those in GI tracts, but their laboratory enumeration often involves concentration from large volumes of water samples; therefore, these concentrated pathogens may cause severe human diseases during their measurement [1,13]. Another reason we should monitor fecal indicators is that there may be unknown waterborne pathogens that will be overlooked if we only monitor known pathogens. Therefore, detection of fecal pollution-associated pathogens is a multifaceted challenge.
Water quality monitoring to detect fecal pollution can employ biological fecal indicators to proxy many potential pathogens. A typical fecal indicator should fulfill the following criteria [1,3,55]:
(1)
It should be detected only in feces-polluted environments and should not be detected in non-fecal-polluted environments; i.e., it should have a high association with fecal pollution with little or no background noise;
(2)
It should be detectable in the same host as the pathogens, and its abundance should reflect pathogen abundance both inside and outside the host; i.e., it should have tight correlations with pathogens/diseases;
(3)
It should be detectable in the host intestine, feces, and also fecal-polluted environmental waters so that it can be assessed using inexpensive and simple methods; i.e., it should have good detection sensitivity;
(4)
It should not multiply outside the host intestine but should be viable or in a detectable form for some time comparable to fecal pathogens;
(5)
It should be safe to measure for field and lab workers, not causing severe human diseases.
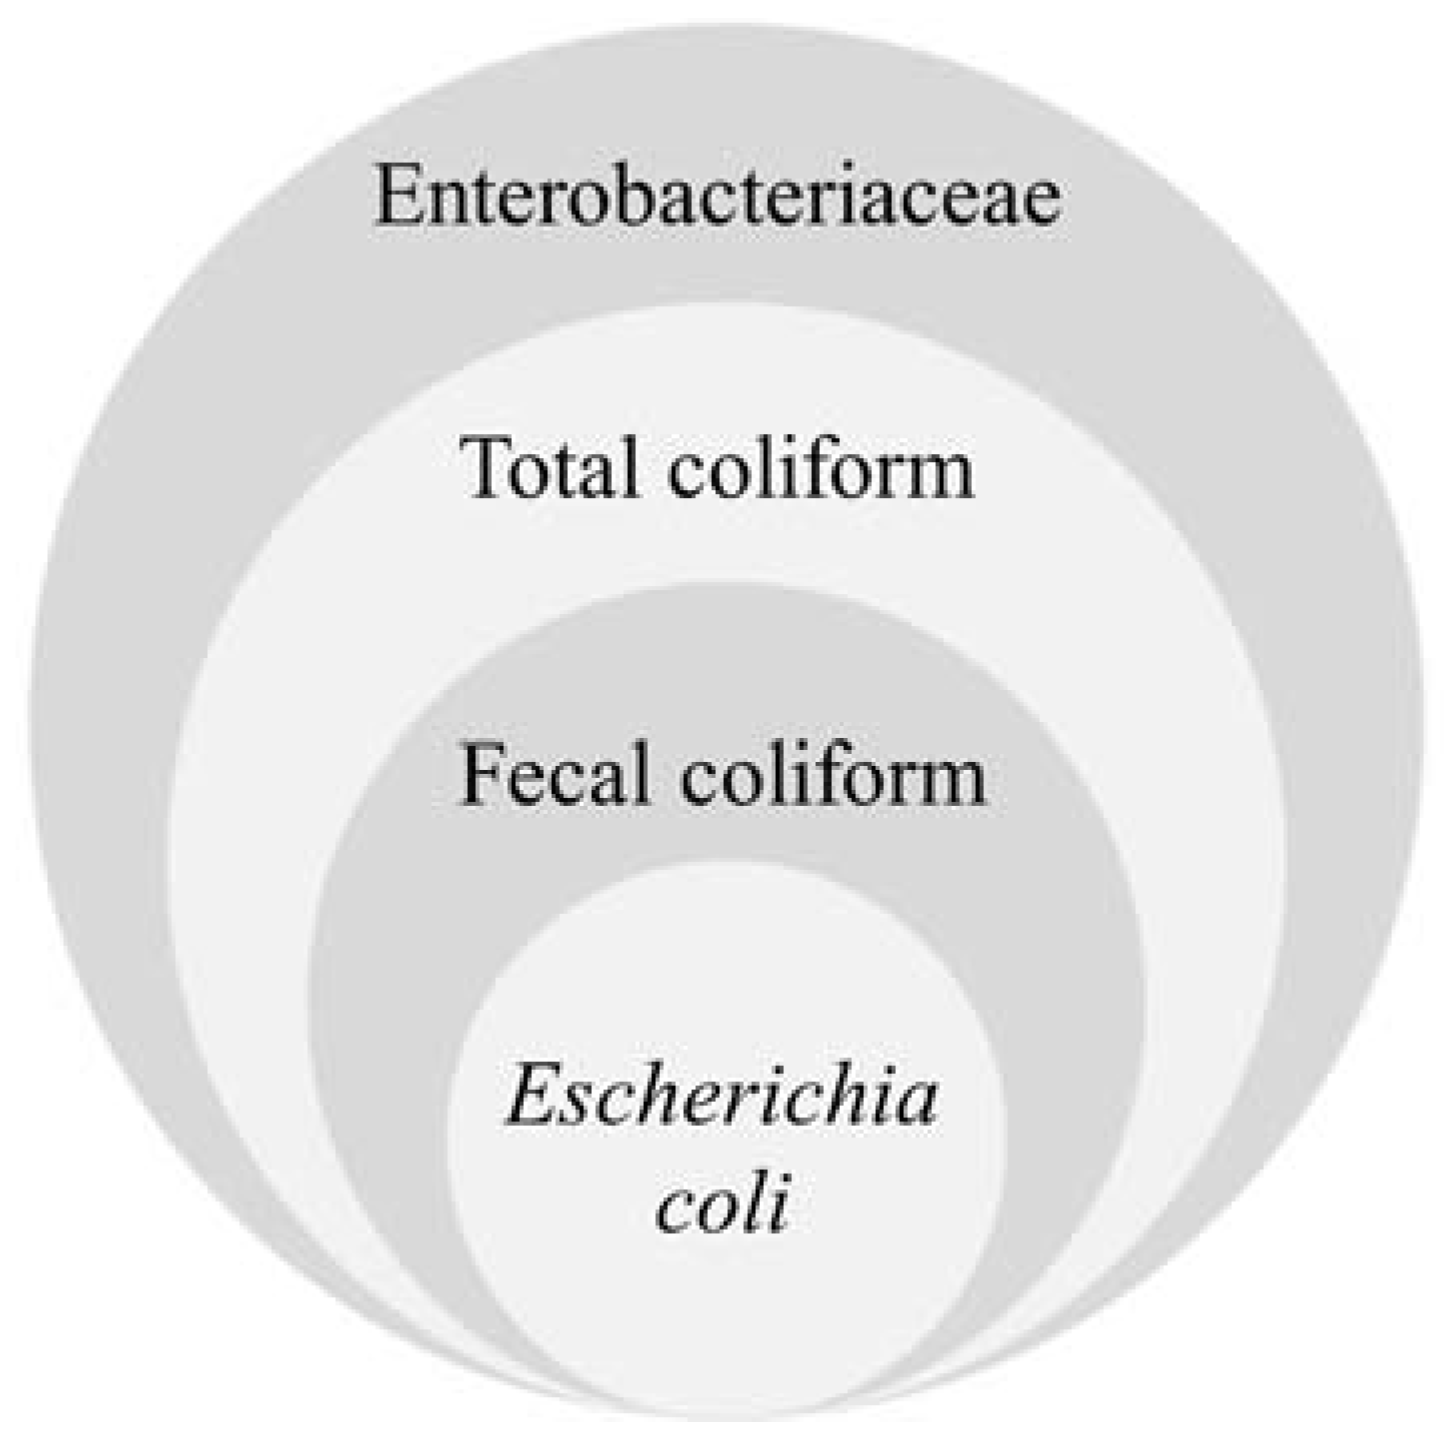
The value of common fecal indicator bacteria (FIB) is that they occur widely in the feces of birds, mammals, and humans, posing a robust way to detect fecal pollution. However, lack of host specificity is also a problem when determining the specific source of fecal pollution, i.e., fecal pollution source tracking. Advances in the field of microbial source tracking have now provided new fecal indicators that can be used to identify specific fecal pollution sources (e.g., human sewage). If a proxy is used to detect human fecal pollution, ideally it should be exclusively of human sources and not be found in animals. Here we introduce well-validated bacterial, viral and molecular indicators, emphasizing their association with pathogens, their presence in fecal wastes, their host specificity, their persistence in the environment, and their pathogenicity.
Host specificity is one of the most critical criteria for any fecal indicator because it determines whether a given fecal indicator can be used to identify the specific sources of fecal pollution, i.e., fecal source tracking [56]. Accurate source tracking helps water quality regulators to locate pollution sources, such as fecal pollution from a nearby WWTP or an animal farm. Host specificity can be readily assessed by the proportion of the false-positive results detected in nontarget fecal pollution sources [57]. Fecal indicators with absolute human specificity must be detected only in humans and must not be detectable in any animals, whereas those of poor human specificity may also be detected in animals, plants, or environments without association with fecal pollution. Livestock in a farm/slaughterhouse [58,59] and wild animals in forests/natural reserves [60] can also be sources of fecal pollution and pathogens. Thus, fecal indicators specific to one animal host are worth noticing because they help identify the species of animal hosts and the possible source locations.
Sensitivity is another critical criterion which is evaluated by the positive proportions in target fecal pollution sources. Fecal indicators of perfect sensitivity should be detectable in all target fecal pollution sources, whereas those of poor sensitivity may be detectable in a minor proportion of target fecal pollution sources in situations where pollution is high. Sensitivity measurement is, of course, affected by fecal indicator concentrations. Even fecal indicators of high sensitivity may be undetectable in target samples if they are diluted or have undergone significant losses through sample processing steps, causing false negatives.

2.1.1. Coliforms

Coliform bacteria, or total coliforms or simply coliforms, are a group of Gram-negative, facultatively anaerobic, non-spore-forming and rod-shaped bacteria that can ferment lactose to acid and gas at ~37 °C within 48 h, constituting ~10% of gut microorganisms [61]. Traditionally, total coliforms included four closely related genera within the family Enterobacteriaceae: Escherichia, Enterobacter, Klebsiella and Citrobacter [62]. But today, some species of over 19 bacterial genera (e.g., Hafnia, Serratia and Raoultella) can be classified as coliforms based on the phenotypic characteristics above [63]. Total coliforms are used to evaluate water treatment efficacy in fecal wastes removal and assess the integrity of water distribution systems [64] because they mainly originate from the GI tracts of humans and warm-blooded animals (i.e., mammals and birds), and thus, their presence in water can indicate possible fecal pollution. In 1975, the U.S. EPA issued the National Primary Drinking Water Regulations, which allowed a maximum of 5% drinking water samples positive for total coliforms tested in a month [65]. Then, in 1989, the U.S. EPA published the first Total Coliform Rule, which supplemented a Maximum Contaminant Level Goal of zero total coliforms in nationwide drinking waters [66]. To date, total coliforms are still routinely monitored in drinking water.
The recognition of free-living coliforms in non-enteric environments, such as freshwater, soil and vegetation, that do not have a history associated with fecal pollution [67,68] has cast doubt on the exclusive association between total coliforms and fecal pollution. For example, Klebsiella variicola is a member of total coliforms but is typically a plant endosymbiont [68]. Thus, not all members of total coliforms are suitable indicators of fecal pollution, and presence of total coliforms in drinking water does not necessarily indicate fecal pollution [64]. To overcome this issue, fecal coliforms, which are defined as coliforms originating from the intestines of warm-blooded animals capable of fermenting lactose at 44.5–45.5 °C, are proposed as a monitoring target [69]. As a subgroup of total coliforms, fecal coliforms have better associations with fecal pollution because the non-fecal-origin part is excluded [70]. Fecal coliforms detected in aquafarm harvesting areas such as an oyster bed are indicative of fecal pollution, causing ecological issues and economic losses [71]. Note that neither total coliform nor fecal coliform is a natural taxon but a method-based bacteria category for convenience. We now understand that even within the category of fecal coliforms, some are not exclusively of fecal origin, hence the transition to Escherichia coli as a better fecal indicator. Among fecal coliforms, E. coli is the dominant species isolated from water (>95%) and is the most frequently used indicator [72]. Figure 2 describes the relationships among total coliforms, fecal coliforms and E. coli.
Since coliforms can be cultured with ease, there are culture-based and culture-independent methods to detect and enumerate coliforms in water. Frequently used culture-based enumeration methods include the (i) classical plate count on violet-red-bile-lactose agar medium [73] or chromogenic media based on the activities of β-D-galactosidase (of coliforms) and β-glucuronidase (of E. coli) [74], (ii) most probable number procedure in lauryl tryptose broth [75] and IDEXX systems, (iii) membrane filtration in selective M-Endo medium [76] and (iv) lateral-flow immune-chromatographic assay using antibodies recognizing coliform genera [77]. Culture-independent methods include (i) real-time PCR targeting the lacZ gene of coliforms [78,79], (ii) fluorescence-based DNA microarray probing E. coli [80], (iii) flow cytometry [81] and (iv) next-generation sequencing or metagenomics that profile all microorganisms, including total/fecal coliforms [82].
Except for a few strains such as E. coli O157:H7, fecal coliforms are generally not considered to be pathogenic. However, drinking water free of coliforms or not exceeding coliform regulatory thresholds is not necessarily safe to drink. Seven waterborne disease outbreaks, affecting more than 3000 people across 5 American states between 1991 and 1992, occurred in drinking water not exceeding the 1989 Maximum Contaminant Levels [83]. Protozoal parasites Giardia and Cryptosporidium were identified as the etiological agents. Therefore, coliforms should not be the sole indicator for successful drinking water quality assessment.

2.1.2. Escherichia coli

Escherichia coli is used as a fecal indicator as part of drinking water regulations [54]. The U.S. EPA added E. coli to the water monitoring and assessment list in 1985 [84]. According to an early investigation by the U.S. EPA, E. coli has the highest correlation to swimming-associated diseases at freshwater beaches on the east coast of the U.S. [85]. First, it shows a strong association with fecal pollution, as it is found in all feces of warm-blooded animals and a few reptiles at high concentrations [54,86], and remains at detectable levels in waters subject to animal fecal pollution, such as sewage, rivers, lakes, groundwater and coastal areas [87,88]. In addition, E. coli is a facultative anaerobe and is easy to culture, so it can be readily measured using both culture-based and culture-independent methods. Second, E. coli is highly associated with a fecal origin and is less likely to be present in natural environments free of animal feces. It was believed to be of exclusively fecal origin when selected as a fecal indicator, which, however, is no longer accurate with the recognition of “naturalized” E. coli, which persists and may replicate in non-enteric/non-fecal environments such as soil, sediment, beaches and aquatic plants [89,90]. “Naturalized” E. coli may not come from a recent fecal input, though it is still believed to have diverged from E. coli of fecal origins.
It is important to distinguish between fecal pollution caused by human wastes and that caused by animals, because human fecal pollution is generally associated with high health risks from human-specific pathogens and high loads of antibiotics and ARBs. One major limitation of E. coli as a fecal indicator lies in its poor specificity to human feces. Despite the substantial genetic diversity of E. coli fecal isolates, epidemiological studies have identified weak associations between a particular E. coli clone and a given host [91,92]. For example, a B1 subgroup clone that exhibits the hly virulence gene is unique to animals [91], and a B2 subgroup VIII, O81 serotype clone is specific to humans [93]. E. coli strains showing stringent host specificity may be specialized candidates for fecal source tracking indicators. Still, most E. coli strains discovered in human fecal samples are not specific to humans, causing difficulties in fecal pollution source tracking.
E. coli was initially believed to have poor survival and to be unlikely to multiply after being released into the environment through deposition of fecal wastes because of the environment being so different from animal gastrointestinal tracts and because of environmental stresses such as insufficient organic matter [94], sunlight inactivation and high salinity [95]. However, prolonged E. coli survival can be found at low temperatures [96], and enhanced E. coli replication is seen at higher temperatures, where relatively sufficient nutrients are likely to support its regrowth [97]. Lake sediments rich in organic contents also favor the survival of E. coli at lower temperatures [98]. When grown as biofilms, E. coli has a significantly higher tolerance against chlorine than planktonic E. coli [99]. In conclusion, the persistence of E. coli is greatly affected by environmental conditions.
Changes in climate, such as an increase in temperature and rainfall, may cause fluctuations of E. coli counts in waters [100,101,102]. A rainfall event can result in up to a three-fold increase of E. coli counts in recreational waters compared to before rainfall, and this increase can persist for up to 12 h [102,103]. After a rainfall event, increases in E. coli counts may occur due to the “first flush” from stormwater drainage or agricultural waste runoff coming along with the flow [103,104]. Furthermore, bacteria including E. coli tend to form flocs, adhere to rocks and other particles, then settle down to the sediment of freshwater ecosystems. A heavy rain or storm event may resuspend these bacterial cells from sediments, leading to a 30–37 times higher bacterial load in water [105,106]. Thus, climate and meteorological parameters should be monitored before and during water sample collection for E. coli testing to help interpret data.
Most strains of E. coli are commensal or symbiotic to their animal hosts in the gastrointestinal tracks [107]. For example, indigenous gut E. coli strains can be highly competitive for proline, and their depletion of proline helps inhibit the colonization of pathogenic E. coli strain O157:H7 [108]. These non-pathogenic strains are considered safe fecal indicators (categorized as biosafety Level I organisms in the U.S.) and can be enumerated by similar methods, as described for coliforms in environmental waters. In addition, there are specialized methods that only detect certain E. coli strains, such as ATCC 47,076, in drinking water [109]. Pathogenic E. coli strains, including the aforementioned O157, a Shiga toxin-producing E. coli (STEC) serotype categorized as a biosafety Level II organism, caused 5441 infections across the United States in 1996 [110]. Our previous study [111] identified a nine base-pair conserved DNA sequence insertion located in the ybiX gene that is unique to O157 strains and can be used for O157 quantification by qPCR. Pathogenic E. coli strains may have better correlations with diseases, and therefore, their enumeration can be a means to assess potential health risks to the public.

2.1.3. Enterococcus

Enterococci share traits with E. coli that are useful for environmental monitoring. First, they both are facultative anaerobic bacteria detected abundantly in the GI tracts of humans and many animals and are shed in feces at high concentrations. Furthermore, both are easy to culture, both have generally low pathogenicity (at Biosafety Level 1, except for a few species), both have abundances highly associated with GI diseases, and both are subsequently common indicators for water quality monitoring, fecal pollution detection and health risk assessment by culture-based and culture-independent methods [54]. Apart from in humans, enterococci have been detected in insects (e.g., drosophila), domestic animals (e.g., cattle and cats), plants (e.g., forage crops) [112,113,114], as well as non-enteric environments (e.g., soil and beach sand) [54]. These discoveries indicated a limited host specificity of enterococci and possible origins other than feces.
Both E. coli and enterococci have long been used as FIB because of their association with waterborne diseases [115]. Two epidemiological studies recognized enterococci as good indicators of GI diseases among swimmers at both freshwater and marine beaches [116,117]. Enterococci have been the sole recommended FIB by U.S. EPA for marine waters since 1986 [118] because they have higher survival in salt water than coliforms (including E. coli) and are thought to be more tightly associated with human pathogens [119,120]. However, using enterococci as fecal indicators has been criticized as well because enterococci are not exclusively of fecal origin and have limited host specificity, as aforementioned. These characteristics may hinder accurate fecal pollution source tracking because non-fecal-origin enterococci may not be associated with health risks, and animal-specific enterococci-associated pathogens may have variable survival strategies in the environment and health risks from human-specific pathogens [121].
The persistence of enterococci in the non-enteric environment is robust, as enterococci can survive across a wide range of temperatures (from 10 to 45 °C) [54], are intrinsically resistant to multiple antibiotics (e.g., ampicillin, cephalosporin and kanamycin) [122], and can survive high salinity (6.5% w/w NaCl) and alkaline (up to pH 10) [123]. Enterococcus faecium and Enterococcus faecalis are generally the two most abundant species of Enterococcus found in human fecal microbiota [124]. They generally have a longer persistence in marine water than E. coli [125,126]. They tend to adhere to biotic or abiotic surfaces to form biofilms, protecting them from environmental stresses such as temperature fluctuations, UV radiation, predation, and wave action [127]. Heavy rain or a storm can disrupt these biofilms and release the enterococci into the water column [128]. In environmental waters, adverse conditions, such as solar radiation, starvation, and low temperatures, may decrease enterococci culturability and induce them to enter the VBNC state [129,130]. VBNC cells are unlikely to be detected via culture-based methods.
Epidemiological studies support an association between enterococci from human fecal sources (e.g., urban sewage) and waterborne diseases in recreational waters [116,131,132]. Higher enterococci densities are associated with an increasing occurrence of GI illnesses among beachgoers at beaches impacted by treated sewage effluent [116]. In addition, human pathogens such as Giardia and Salmonella are found in higher densities and positively correlated with enterococci concentrations in recreational waters impacted by sewage effluent [131,132]. Along with human fecal pollution, exposure to animal feces poses health threats. Globally, one-third of childrens’ deaths due to GI illnesses in 2015 were caused by pathogens that are found in animal feces [133]. It is predicted that enterococci densities as low as 35 CFUs/100 mL from cattle manure pose health risks [121]. Thus, enterococci levels are indicative of general health risks from both human and animal fecal pollution. However, without associated source tracking information, it is difficult to unambiguously identify the fecal hosts/sources of enterococci.

2.1.4. Clostridium perfringens

Clostridium perfringens is a Gram-positive, spore-forming, biofilm-forming, anaerobic and pathogenic species (at biosafety Level II) associated with feces [134]. It is among the first fecal indicators in aquatic environments [135]. C. perfringens can be found in the gut of fish and warm-blooded animals, such as pigs and ducks [136,137,138], as well as in some non-enteric environments, such as soil, streams and marine sediments [139,140]. Despite having limited host specificity, C. perfringens can be present in higher abundances in human feces than animal feces. As a pathogenic species, its presence itself indicates possible health risks to humans and animals.
Species of the genus Clostridium are obligate anaerobes and cannot multiply in environmental waters. Spores of C. perfringens are coated by a thick peptidoglycan cortex structure that provides resistance against environmental stresses such as chlorination, heat and UV radiation and resistance against toxins in industrial wastes [141]; thus, C. perfringens spores can survive longer in polluted waters than other FIB, especially in freshwaters [141,142]. The inability to multiply in non-enteric environments and the prolonged environmental viability of its spores make C. perfringens a better indicator of long-term or accumulative fecal pollution. Criticisms against the usage of C. perfringens also focus on its prolonged viability and wide distribution in aquatic environments. Its spores can be detected in places far from the pollution input site, indicative of either remote or old fecal pollution [143]. Besides, its abundance does not always correlate with abundances of other FIB [139]. Hence, combined usage of C. perfringens and other FIB may better predict pathogens.
Detection and quantification of C. perfringens can be conducted by culture-based and culture-independent methods. It can be isolated from water samples by the membrane filtration and Rapid Fung double tube methods [144], then cultivated in anaerobic chambers at 44–46 °C [145]. Available media include mCP medium, tryptose-sulfite-cycloserine agar, and tryptone-sulfite-neomycin agar [146,147]. Rapid and culture-independent enumeration methods include qPCR targeting the cpn60 gene [148], DNA sequencing targeting 16S rDNA genes or the whole genome, and the newly developed Saltatory Rolling Circle Amplification targeting the cpa gene, which is conducted at a constant temperature and does not require a thermocycler or gel electrophoresis [149].

2.1.5. Bacteroides

Species of genus Bacteroides are frequently used fecal indicators for source tracking purposes. They are low-pathogenic indicators (biosafety Level I) with promising host specificity compared to facultative anaerobic FIB [150]. Bacteroides are obligate anaerobes of gut origins, unlikely to multiply in a non-enteric environment, and are present at significantly higher densities in the GI tracts and feces of humans than coliforms or enterococci [57]. Bacteroides can be found in warm-blooded animal hosts such as humans, dogs, pigs, and also fish, which are cold-blooded [151,152,153]. Unlike coliforms or enterococci, Bacteroides spp. isolated from humans and some animal hosts are unique to one or a group of hosts [154]. Table 2 shows examples of host-specific 16S rDNA sequences of these Bacteroides spp. that can be promising molecular markers to identify fecal pollution from humans and animal hosts [155,156] by culture-independent methods, such as qPCR.
Unlike facultative anaerobic FIB, the isolation and cultivation of Bacteroides cells require anoxic chambers, which is costly, time-consuming and labor-intensive [162]. Bacteroides can grow at 37 °C in many selective media, such as Brain Heart Infusion medium, Bacteroides Bile Esculin agar, and Blood Hemin Vitamin K medium containing antibiotics [162,163,164]. In most applications, Bacteroides grows into visible colonies on plates within 24 h, and colonies will be large enough to enumerate in 36 and 48 h. Some Bacteroides species can be identified to the species level within four hours by a few biochemical tests, such as the API ZYM system that detects activities of Bacteroides-specific enzymes [165].
The use of biological molecular markers bypasses the difficulties of anaerobic cultivation and enables the routine detection of Bacteroides spp. The aforementioned host-specific 16S rDNA markers can be used to detect and quantify Bacteroides in environmental samples and thus enable source tracking of the fecal pollution. Among human-specific Bacteroides 16S rDNA sequences, the region to be amplified by the primer set HF183F (Human Fecal 183 forward primer) and Bac708R (reverse primer) ranks among the most recognized markers to assess human fecal pollution and to discriminate it from animal fecal pollution because of its high sensitivity and specificity to humans [166]. Although HF183 fluorescent probe-based assays may sometimes cross-react with animal feces, its concentration in human feces can be 1000-fold more, or higher, than in animal feces [167]. In 2012, the U.S. EPA recommended an illness-based recreational water quality threshold of 32 illnesses per 1000 primary contact recreators using enterococci or E. coli [118]. In 2020, as Bacteroides HF183 becomes widely used, a threshold of 525 HF183 copies/100 mL recreational water was proposed by Boehm and Soller [168]. Apart from 16S rDNA sequences, there are other Bacteroides human molecular markers, such as genes encoding a hypothetical protein of Bacteroidales-like cell surfaces [169], which showed a >97% human specificity.
Obligate anaerobes such as Bacteroides cannot grow or multiply in environmental waters and have shorter survival periods than aerobes, facultative anaerobes, or viruses [57]. This property can provide a time progression of fecal pollution in environmental waters after Bacteroides spp. are released [170]. Molecular markers of both viable and non-viable cells can be detected using qPCR and DNA sequencing, so that they are less affected by cell states [171]. For example, the portion of culturable enterococci and E. coli in unfiltered freshwater can be reduced by 90% within 1.2 h and 1.4 h in sunlight, whereas it takes more than 6 h for the same reduction for HF183 and human polyomavirus [167].

2.2. Viral Markers

Fecal pollution detection using conventional FIB has several limitations. For general FIB of poor host specificity (e.g., E. coli and enterococci), they do not discriminate between human and animal fecal sources and therefore are inappropriate for source tracking [172]. Human-specific fecal indicators, mainly genetic markers of Bacteroides spp., are capable of fecal pollution source tracking from both point and non-point sources [150] but are not always representative of enteric viral pathogens or protozoa. This is because viruses and parasite protozoa react to environmental stresses and wastewater treatments differently from bacteria [173]. There are outbreaks caused by waterborne viral pathogens or protozoa when FIB are not present or are below the regulated levels in water samples, as aforementioned [83]. One reason could be that FIB quantification, especially by culture-based methods, can provide false negative results if cells are in the VBNC state [174]. Therefore, it is important to employ fecal indicator viruses in water quality assessment for their higher correlation with enteric viral pathogens. These viral indicators can be either of fecal origin, such as coliphage and crAssphage, whose hosts are gut bacteria, or highly associated with human activities, such as pepper mild mottle virus, a plant virus which is commonly found in dietary pepper products [175].

2.2.1. Coliphage

In human guts, the viral community (termed human gut virome) is dominated by bacteriophages [176]. Coliphages are bacteriophages that specifically infect coliforms and are not pathogenic to humans. They are generally found in the gut and share similar morphologies, sizes, structures and resistance against disinfection methods with enteric viruses [177,178]. For example, coliphages can be resistant to environmental stresses, such as hydrostatic pressure (less than 1−log10 reduction at 600 MPa for 1 h), thermal inactivation (4−log10 reduction at 72 °C for 20 min) and high or low pHs (no significant log10 reductions between pH 4 to 11 for 3 h) [179,180]. Therefore, coliphages can act as indicators for enteric viruses and human fecal pollution in rivers, drinking water and underground water [181]. Based on the infection site, coliphages are classified as somatic coliphages, which are DNA phages that infect coliform cells through their attachment to the outer cell wall, and male-specific (or F+) coliphages, which can be DNA or RNA phages that infect male (F+) host cells through the fertility (F) pili [61]. Apart from E. coli, somatic coliphages can infect other pathogenic gut bacteria, such as Shigella spp. and the multi-drug resistant Klebsiella pneumoniae [182].
Two culture-based methods recommended by the U.S. EPA for enumerating somatic coliphages in freshwater and groundwater are the spot-test assay for their presence/absence and the single-agar-layer plate assay to quantify the plaque-forming units (PFU) [183,184]. The former requires 24 h, including 18 h for incubation and 6 h for the spot test, whereas the latter requires 16 h from sample processing to plaque enumeration. Hence, both assays do not allow for rapid detection. Another Bluephage method relies on the potential of E. coli strains overexpressing β-glucuronidase when facing coliphage-mediated bacterial lysis. The substrate resulting from the overexpressed β-glucuronidase is chromogenic and produces a blue color that indicates coliphage density [185]. This method features an excellent sensitivity (as low as 1 PFU/100 mL), an excellent specificity ensured by the coliphage, and a rapid procedure within 6.5 h (2.5 h for pre-growing host E. coli strains, 4 h for the assay) [186]. Thus, the Bluephage method can provide a rapid and sensitive estimation of fecal pollution in water samples.
F+ RNA coliphages are divided into four genogroups (I–IV) based on genomic organization and serological cross-reactivity. Higher abundances of genogroups II and III are detected in rivers, streams and groundwater affected by municipal sewage [187], whereas higher abundances of genogroups I and IV are detected in waters contaminated by animal farms or bovine wastewaters [188]. Therefore, genogroups II and III are identified as specific to human fecal pollution, whereas I and V are identified as specific to animal fecal pollution. F+ RNA coliphages can be enumerated by a modified Bluephage method, which selects F+ (male) E. coli (e.g., strains CB14 and CB16) as the host [189]. Furthermore, E. coli strain CB-390 allows for simultaneous detection of somatic and F+ RNA coliphages [190]. Since somatic and F+ coliphages have varying environmental persistence, the simultaneous detection of both can result in a more accurate estimation of total fecal pollution. For source tracking purposes, however, separate enumeration of somatic and F+ coliphages is more suitable, because somatic coliphages may be 4−log10 more abundant than F+ coliphages due to enhanced environmental persistence, which can mask the population of F+ coliphages [191].

2.2.2. CrAssphage

CrAssphage is a double-stranded DNA bacteriophage that infects Bacteroides intestinalis. Unlike most bacteriophages, the discovery of crAssphage was not based on biological experiments but was based on bioinformatics. In 2014, its genome was assembled for the first time by the de novo cross-assembly method from 12 previously published human fecal viromes [176]. It is named after the software crAss. This name is unconventional because it does not indicate any phylogeny, taxonomy or host information. So far, crAssphage shows no homology to any known virus. In 2018, crAssphage was isolated from human feces for the first time, and its host, Bacteroides intestinalis, a human gut symbiont, was identified [192].
The presence of crAssphage is common among human fecal viromes and fecal metagenomes, as it is present in 342 out of 466 datasets surveyed (73%) [176]. In addition, it is highly abundant in the human gut, accounting for 90% of human fecal viromes and 1.68% of total human fecal metagenomes, making it the most abundant phage in the human gut. crAssphage was thought to be of exclusively human fecal origin, but recently it has been found in cats [56] and monkeys [193]. The crAssphage relatives detected in monkeys are distantly related to the published human crAssphage genome, suggesting a long evolutionarily divergent history in humans and primates. Nevertheless, crAssphage is highly specific to humans, showing a specificity up to 98% [56].
A known host is required for any virus to be cultured. When the crAssphage genome was first identified, its host was predicted by in silico approaches, including OFR homology searches (blastn), CRISPR spacer identification, and co-occurrence profiling of the crAssphage genome and 151 fecal bacterial metagenomes [176]. Among the predicted hosts, Bacteroides was believed to be the most likely host. In 2018, a phage that dominated 96% of total viral reads of the Bacteroides intestinalis strain APC919/174 plate was isolated and found to be related to a known but previously uncultured crAssphage genome. That was the first successful isolation of crAssphage.
Quantification of crAssphage in environmental waters is mainly by culture-independent methods, such as metagenomics and qPCR. Primers in PCR/qPCR targeting predicted coding regions of the crAssphage genome have been designed and validated [172]. The two most frequently used primer sets CPQ_056 and CPQ_064 (Table 3) exhibit the highest sensitivity and specificity, meaning that PCR assays using these primer sets can obtain (1) PCR products of correct sizes among human feces/sewage samples; (2) no PCR product among animal fecal samples; (3) PCR products of correct sizes among diluted human feces/sewage samples; or (4) no spurious PCR products, such as primer-primer dimers. A number of subsequent studies have validated the amplification capability of the two primer sets [194,195,196,197,198].
So far, the following features make crAssphage a fecal indicator virus suitable for human fecal pollution detection and source tracking. First, it is ubiquitous and abundant in human feces and sewage (5.28–7.28 log10 copies/100 mL) [194]; it is rarely detected in environments free of human fecal pollution [56]; and it has concentrations strongly correlated with sewage ARGs [2], pathogenic viruses [198,202] and conventional FIB [197]. In addition, it is not pathogenic to humans [193] and has molecular markers that can be detected by rapid, culture-independent and cost-effective methods [172], although it is unclear whether crAssphage can replicate itself outside human intestines but within Bacteroides cells.

2.2.3. Human Adenovirus (HAdV)

Adenovirus was first isolated in 1953 from human adenoids, hence the name [203]. Adenovirus is not a taxonomic unit and represents a group of viruses from six genera of the family Adenoviridae: Atadenovirus, Aviadenovirus, Ichtadenovirus, Mastadenovirus, Siadenovirus and Testadenovirus [60]. Although adenoviruses share a similar morphology, their hosts and genomic organizations differ from genus to genus. For example, hosts of mastadenoviruses are exclusively mammals, whereas hosts of aviadenoviruses are exclusively birds. In addition, mastadenoviruses can synthesize unique proteins V and IX; the former is responsible for redistributing viral components into or out of the host cell nucleus, while the latter is a transcriptional activator [204,205]. So far, adenovirus has been detected in species of almost every vertebrate class, such as birds, mammals, reptiles, amphibians and fish, but has not been detected in invertebrates [60]. All human-specific adenoviruses (HAdV) belong to the genus Mastadenovirus.
HAdV is highly specific to humans. As it targets a conserved region of the hexon gene, HAdV is not detected by qPCR in samples that do not contain human feces, meaning there are no false-positive cases, whereas somatic coliphages, Bacteroides HF183 and crAssphage CPQ_056 are detected in the feces of cows, chickens and cats [56,206]. Except for HAdV, animal-specific adenoviruses can be used to identify animal fecal pollutions as well. Bovine adenovirus is found to be specific to cows [58], and porcine adenovirus is found to be specific to pigs [207]. Hence, despite the broad host spectrum of the adenovirus group, specific adenoviruses have excellent host specificity, enabling source tracking of human and animal feces.
HAdV in groundwater has a stable persistence and may survive for long periods. For example, the low decay rates in groundwater (0.0076 log10/d at 4 °C and 0.0279 log10/d at 20 °C) result in a long natural T90 (time required for 1−log10 reduction) of 131 d at 4 °C and 36 d at 20 °C [208]. In WWTPs, HAdV is highly resistant to UV disinfection and is frequently detected in the effluent and receiving environmental waters [209,210]. Among four enteric viral pathogens, echovirus, coxsackievirus, poliovirus and HAdV type 2, a UV dose of 27 mW/cm2 sufficiently brought 3−log reductions to the first three viruses, whereas it is 119 mW/cm2 for HAdV type 2 [211]. One possible reason is that adenoviruses have a double-stranded DNA genome, which is more stable than RNA or single-stranded DNA genomes. Additionally, HAdV uses human cellular enzymes to repair its DNA damage [212]. In this case, HAdV is not truly resistant to UV radiation but is actively able to repair the damage to DNA brought by UV.
HAdV is typically found at much lower concentrations than E. coli, crAssphage, or Bacteroides, often at levels close to or lower than its detection limit. For example, HAdV can be detected in sewage samples at ~105 gene copies/L, and only 102–103 gene copies/L in rivers, urban streams and estuarine waters [209]. Such low concentrations in environmental waters can be a challenge for HAdV plaque assays, because it is estimated that 1–103 virions are required for 1 PFU to form depending on the virus [213]. Hence, environmental water samples should be concentrated for HAdV plaque assay by membrane filtration or other methods [214]. In culture, HAdV may take up to 1 week to infect, reproduce within and lyse human cells to generate visible PFUs [215]. The required time for a HAdV plaque assay is not practical for routine water quality monitoring or rapid decision making. Additionally, HAdV is pathogenic to humans, causing upper respiratory symptoms and fever, though it causes mild or asymptomatic infection in most cases [216].
Culture-independent methods to enumerate HAdV from environmental waters include regular PCR, nested PCR, qPCR, integrated cell culture qPCR, and flow cytometry [210,217]. qPCR assays using a nested primer set and a degenerate primer set targeting the hexon gene (Table 3) indicate excellent the host specificity of HAdV and bovine adenovirus (no false positives), with an overall sensitivity of 78% and 73%, respectively [58]. Additionally, fluorescent antibodies targeting two HAdV proteins, Hexon and E1A, can be used in fluorescence-activated cell sorting for HAdV rapid detection with excellent linearity between fluorescence intensity and HAdV concentration (r2 > 0.9) and sensitivity in the range of 1–104 PFU per assay [210].

2.2.4. Human Polyomavirus (HPyV)

HPyVs are a group of human enteric viruses that belong to the genera Alpha-, Beta- and Delta-Polyomavirus within the family Polyomaviridae, with circular double-stranded DNA genomes [218]. First isolated in 1971 from human brain tissue, there are 14 distinct HPyV species identified so far [218,219]; some are human feces-specific (e.g., HPyV-6 and HPyV-12) and some are human urine-specific (e.g., HPyV-9, BKPyV and JCPyV). These HPyVs are potential source tracking indicators due to their human specificity, environmental prevalence and resilience. Animal-specific PyVs, such as bovine, porcine, and ovine PyVs, are specific to cattle, pigs, or sheep, so they can be used for the identification and source tracking of animal fecal pollution [220].
HPyVs are more specific to humans when compared to FIB and are less likely to be detected in non-human fecal samples. For example, qPCR assays targeting HPyV (the T-antigen gene), Bacteroides HF183 and crAssphage (CPQ_56) among 359 animal feces samples exhibit a human specificity of 99.72%, 96.65% and 98.61%, respectively [56]. Despite the excellent human specificity, HPyV has variable sensitivity based on sample types. For example, urine-specific HPyV is detected in 6 out of 26 urine samples from healthy individuals, ranging from 6.61 × 10² to 1.2 × 10⁷ copies/mL, showing a limited sensitivity of 23.1% [200]. In WWTPs, however, HPyV is detected in 36/37 influent and effluent wastewater samples, showing a high sensitivity of 97.3% [209].
HPyV is primarily excreted in human urine and feces; hence, its presence in environmental waters reflects anthropogenic pollution. BKPyV and JCPyV, specific to human urine, are the first HPyV identified in environmental samples (from sewage) [221]. Since then, increasing HPyV species have been detected in many environmental waters. HPyV is prevalent in rivers, urban streams, recreational beaches and drinking water [209,222,223]. WWTPs are believed to be the key point for HPyV releasing to open water bodies. Though unable to multiply, JCPyV was reported to have a T90 as long as 64 d in sewage at 20 °C [224]. Viruses adsorbed onto particle surfaces may have prolonged survival relative to free viruses, possibly because particles reduce contact between viruses and disinfectants [225]. In that case, HPyVs excreted in human feces are expected to have longer environmental persistence than HPyVs being excreted in the urine.
Like HAdVs, HPyVs are present at low concentrations in environmental waters, and therefore HPyV enumeration often involves the concentration of large volumes of water samples. Simple membrane filtration, using a 0.22 or 0.45 μm filter, fails to concentrate HAdV or HPyV particles, as their size is much smaller than the pore size of regular filters. Salt and acidic pH may increase viral adsorption to the filter because viruses in ambient waters are negatively charged [226]. Hence, current membrane filtration for virus concentration often requires pH adjustment of the water sample, for example, acidification using HCl if a nitrocellulose membrane is used, to obtain a higher HPyV recovery without introducing PCR inhibitors [200,227].
Concentrated HPyVs can be quantified by plaque assay using human fetal glial cells or tumor cells, immunofluorescence, microarray and PCR/qPCR [56,228,229]. qPCR targeting the conserved T-antigen of BKPyV and JCPyV is the most extensively used molecular method for HPyV detection in environmental waters (Table 3), with a sensitivity (i.e., limit of detection) as low as 10 copies per reaction [200]. HPyVs detected by immunofluorescence assay are generally 2−log10 less than HPyVs detected by qPCR, because only infectious HPyVs can be detected by immunofluorescence assay or plaque assay, whereas both infections and non-infectious HPyVs can be detected by qPCR [228]. For some samples, it is important to analyze the infectivity of viruses, and culture-based methods remain the gold standard. Infectious HPyVs do not necessarily cause diseases, as HPyVs are generally not pathogenic and are categorized as Biosafety Level II.
Compared to bacterial indicators, HPyV better correlates with viral pathogens in the environmental waters. For example, norovirus, a human enteric pathogen, is generally not routinely monitored partially because of its pathogenicity and RNA genome. Norovirus cannot be efficiently predicted by FIB because it has longer environmental persistence and may be present in high concentrations in non-disinfected wastewater effluent and receiving waters, such as rivers, urban streams and estuarine water, without causing outbreaks [209,230]. Among these waters, HPyV is not only prevalent but also significantly correlates (p < 0.05) with norovirus (determined by reverse transcription qPCR). In recreational coastal beaches impacted by non-point source fecal pollution, HPyV levels may not be significantly associated with levels of Bacteroides, enterococci, total coliforms or fecal coliforms, but can be significantly associated with levels of HAdV [222]. The poor associations between fecal indicator viruses and FIB strengthen the need to employ fecal indicator viruses for water quality monitoring, as FIB are often poorly correlated with viral pathogens, whereas HAdVs and HPyVs themselves are human enteric pathogens, sharing similar environmental surviving strategies with other human enteric viral pathogens, and are therefore of greater potential to indicate health risks.

3. Emerging Bioengineering Enumeration Methods

All current biological methods have limitations. Culture-based methods (e.g., plate counting and membrane filtration) are labor- and time-consuming and often lead to delayed results that are insufficient to catch sudden bacterial outbreaks or to support proactive actions. It is possible that by the time fecal pollution is detected in drinking water using culture-based methods, the investigated water may have already been distributed and consumed. In addition, culture-based methods provide information on a fraction of the total bacterial population, because non-culturable bacteria or VBNC cells are not included. A limitation for molecular methods such as qPCR and metagenomics is that they cannot distinguish DNA of living and dead cells, i.e., they cannot exclude the interference of relic DNA. It is estimated that relic DNA can persist for weeks to years in soil, account for 40% of total DNA being sequenced, and have inflated the observed richness of prokaryotes and fungi by 55% [231]. Sample types (e.g., water, soil, plant) and DNA extraction methods also impact the DNA recovery. Multi-disciplinary platforms integrated with cutting-edge techniques in the fields of biology, engineering, chemistry and computer science may be powerful alternatives or supplements to current methods to overcome (at least some of) the existing limitations.

3.1. A Time-Lapse Coherent Imaging Platform

A lens-free imaging platform capable of early detection and species classification of living FIB on agar plates is a promising new technology [232], though manual membrane filtration of water samples and inoculation of concentrated indicator cells are required. When an inoculated agar plate is placed in the incubator, the imaging system scans the plate every 30 min, simultaneously with the bacterial incubation. Captured plate images are sent to the integrated software, where periodically captured plate images are digitally stitched together in chronological order to form time-lapse image stacks. These stacks are reconstructed to reveal static impurities (e.g., dust, air bubble and light speckle) and growing bacterial colonies on the agar surface.
Fifteen pure culture agar plates of three total coliform bacteria (E. coli, Klebsiella aerogenes, and Klebsiella pneumoniae) are blindly tested on this platform. For validation of colony recognition sensitivity and precision, colonies on these plates are also manually enumerated. A colony recognition sensitivity of 80% is achieved when E. coli, K. aerogenes and K. pneumoniae are incubated for ~6.8 h, ~8.8 h, and ~6.0 h, respectively. When incubation continues to 12 h, a sensitivity higher than 95% is achieved for all three coliforms. After 6 h incubation, precision for all three coliforms is close to 100%. A species classification accuracy of ~80% is achieved when E. coli, K. aerogenes and K. pneumoniae are incubated for ~8.0 h, ~12.0 h, and ~7.6 h, respectively. For E. coli and K. pneumoniae, higher species classification accuracies (~97.2% and ~98.5%) are achieved when incubated for 12 h. Colony recognition sensitivity, colony recognition precision, and species classification accuracy are positively correlated with the incubation period.
This platform enables a rapid (87 s to scan a 60-mm diameter petri dish), high-resolution (with a linewidth scanning resolution of ~3.5 μm) and automatic plate image capture for every 30 min (interval adjustable). Such a high scanning resolution enables early recognition of emerging colonies that are invisible to naked eyes. Compared to EPA-approved culture-based methods (e.g., 1103.1 and 1604 methods), this platform is more time- and labor-saving. In the blind testing, a whole test (bacterial incubation, colony recognition and species classification) can be completed within 12 h, with an excellent limit of detection as low as 1 CFU/L, at a low cost of only $0.6, including the cost of preparing an agar plate. However, this platform is not fully automatic because manual sample processing is still required.

3.2. An Online Culture-Independent Imaging Platform

Drinking water requires faster and more reliable quality monitoring than water for other purposes because it is directly consumed by humans. Though water utilities monitor water quality regularly, if culture-based methods are applied, results come out 1–3 d delayed and do not provide information of unculturable bacteria or VBNC cells. To resolve these problems, an automated, online and culture-independent platform capable of enumerating total bacteria within 10 min has been designed [233]. This platform is installed within drinking water pipeline systems, where drinking water flows through a flow cell under the pressure of the water source or an inlet pump. To initiate a measurement, the flow cell becomes sealed to trap 6 μL of water sample inside. The stagnant trapped water sample is scanned by a lens-based imaging system at different focuses, i.e., it undergoes a 3D scanning. Captured images are sent to the platform-integrated software for analysis. Then the flow cell reopens and gets flushed, preparing for the next measurement. By combining images of different focuses (i.e., depths), a 3D model of the water sample can be established from which particles will be recognized, together with their 59 optical parameters, such as area, length, contrast and granularity. Then, the pre-trained software classifies bacteria and abiotic particles based on the 59 optical parameters.
In blind testing using monotype suspensions containing either bacterial or abiotic particles, a classification accuracy of >80% is achieved for all bacterial suspensions, and less than 8% of abiotic particles are mistakenly classified as cells. The average classification accuracy for monotype suspensions is 90%. In the blind testing using mixed suspensions containing both bacteria and abiotic particles, the overall classification accuracy is 78%. It is worth noticing that for mixed suspensions, due to lack of manual curation, false negative (i.e., bacteria being classified as abiotic particles) and false-positive cases (abiotic particles being classified as bacteria) can both occur but cannot be distinguished [234]. Based on the small sampling volume (6 μL), this platform has a theoretical lower limit of detection of 1.6 × 10² particles/mL. Water samples with lower particle concentrations may be associated with high uncertainty due to sample inhomogeneity. On the other hand, an upper limit of 5 × 10⁶ particles/mL is also determined, because water samples with higher particle concentrations may not be detected due to strong background light scattering, and heavy water pollution will significantly shorten the lifespan of a flow cell.
This platform enables a fully automatic, rapid and high-frequency (10-min time resolution) monitoring of bacteria and abiotic particles, making it possible to detect sudden water quality changes and classify them as biotic or abiotic. This platform does not require chemical supplies or produce any hazardous wastes. Acquired data can be wirelessly transferred to a data server in real time (i.e., online). The only required maintenance is to replace the flow cell every few months. As a culture-independent platform without species preference, it is suitable to estimate the total bacterial biomass. However, dead or inactive bacteria (e.g., those inactivated by UV treatment), which are no longer of health risk, can still be detected, as long as their cells remain intact, with the same or similar optical parameters as living cells. In addition, it does not apply to enumerating virus or protozoa, which are relatively either too small or too big compared to water chemical particles.

3.3. An On-Site Microflow Cytometry Free of Fluorescence Staining

Flow cytometry can be used to enumerate bacteria and viruses in water samples, such as coliforms in drinking water and HAdV in sewage effluents [81,210]. These methods have limited on-site use because fluorescence staining is often involved, which requires a bulky cytometer, expensive reagents, and complicated sample preparation. The development of a microfluid-based portable microflow cytometer enables rapid and on-site E. coli enumeration without fluorescence staining [235]. A major part of this platform is a four-layer panel; between the middle two layers is a 50-μm-wide microfluidic channel. The water sample and sheath fluid are injected into the channel by a syringe pump. The sheath fluid is injected at a much higher rate than the water sample so that cells in the water sample are forced to pass through the channel one by one unidirectionally towards the outlet. An input light beam is perpendicular to the channel, where light is differentially scattered by cells, particles or water. An on-chip lens system beneath the panel records the side-scattered light signals to separate E. coli cells and particles.
This microflow cytometer is tested using two suspensions, one made of pure E. coli cells diluted in PBS buffer and the other made of both E. coli cells and polystyrene beads with diameters of 2 and 4 μm to mimic particles from environmental waters. For a pure E. coli suspension, the sample-to-sheath flow-rate ratio is found to be negatively correlated with detection efficiency. When E. coli is injected at 50 μL/h with a constant sheath flow of 313 μL/h, a high detection efficiency (97%) can be achieved. When the sample flow rates increase to 100 and 150 μL/h, the detection efficiencies decrease to 63% and 45%, respectively. Regardless of sample flow rates, the high signal/noise ratios (9.7 to 11) are supposed to reduce the possibility of false counting. For mixed suspension, the presence of 2 and 4 μm diameter polystyrene beads does not affect the detection of E. coli cells, because the site-scatter signal intensity is proportional to particle size, and therefore, the beads have significantly higher side-scatter signal intensities than E. coli cells. Furthermore, even the 2 and 4 μm beads have distinct intensities and can be distinguished. Therefore, the presence of particles larger than 2 μm is unlikely to affect the detection of E. coli by the platform.
This microflow cytometer features a rapid (50 s for a measurement), less costly (no fluorescence staining required) and on-site (portable equipment) enumeration of E. coli in water samples, with excellent cell detection efficiencies at low sample-to-sheath flow rate ratios. The high signal/noise ratios decrease false cell counting from the background noise, and particles of similar or larger sizes of E. coli do not interfere with cell detection. However, interference may arise when particles smaller than 2 μm are present; in that case, cells require other staining techniques, such as fluorescence staining, to be distinguished. One major limitation of this platform lies in its limited throughput, as higher sample injection rates would decrease detection efficiencies. Additionally, this platform is not suitable for long-term operation, because the throughput decreases over time due to cell precipitation in the syringe during measurements. In addition, E. coli and water have close refractive indexes, so a pre-concentration is required to increase cell density by 3–6 orders of magnitude; otherwise, site-scatter signals produced by E. coli cannot be sufficiently separated from the background noise.

4. Conclusions

Traditional water monitoring relies on E. coli, enterococci and total coliform testing, which are well-validated and widely used methods. These are routinely monitored in drinking water or recreational water because they are associated with waterborne illnesses and can be enumerated with ease. However, their limited host specificity hampers accurate source tracking of fecal pollution from nonpoint sources. It is particularly important to identify human sources of fecal pollution, as they usually present high health risks. Source tracking indicators, such as certain species/strains of Bacteroides, human adenovirus and crAssphage, have better host specificity and therefore can be used for human fecal pollution source tracking. Whether using fecal indicator bacteria or viruses, a single fecal indicator is unlikely to predict all pathogens or diseases; hence, multiple indicators are recommended to be used in combination to assess the water quality and health risks throughout. These additional tools can augment traditional monitoring and serve as a toolbox for researchers and engineers to determine appropriate combinations based on their needs.
The enumeration of fecal indicators by culture-based methods is relatively inexpensive and easy to perform. Among them, plate counting is the most common for bacterial indicators. In addition, cell-culture-based methods remain the gold standard to assess the infectivity of viral indicators/pathogens. However, culture-based methods are time-consuming, often leaving insufficient time for the water quality regulatory agencies to take proactive actions. In addition, unculturable, difficult-to-culture and viable-but-not-culturable fecal indicators are unlikely to be enumerated by culture-based methods. Thus, culture-based methods tend to underestimate the health risks. Molecular methods, such as qPCR and digital PCR, on the other hand, are rapid, of good replicability and have broader applicability to various fecal indicators. One limitation is that molecular methods cannot distinguish detected genetic materials from living or dead cells; therefore, they tend to overestimate the health risks, because dead or inactive indicators/pathogens cannot be excluded.
Emerging multidisciplinary bacterial enumeration platforms often incorporate cutting-edge techniques in biology, engineering and computer science, aiming to simplify procedures, prompt automation, improve detection sensitivity, and reduce the requirements of time, cost and labor. The first platform discussed here enables automatic colony plate counting and species classification; the second platform is suitable for high-frequency and long-term quality monitoring of drinking water, and the third platform introduces an on-site flow cytometry based on microfluidics without fluorescence staining. These platforms currently have individual limitations, but still can be powerful alternatives or supplements to current biological methods.

Author Contributions

Writing—original draft preparation, E.L., F.S.; writing—review and editing, H.E.S., T.A.E.; investigation, H.E.S., T.A.E.; supervision, H.E.S. All authors have read and agreed to the published version of the manuscript.

Funding

We gratefully acknowledge funding supporting environmental studies provided by the Ontario Research Excellence Fund (Grant # RE09-077, Ontario Ministry of Economic Development, Job Creation and Trade), the Ontario Ministry of Environment, Conservation and Parks (MECP), and the Natural Sciences and Engineering Research Council (NSERC) of Canada (Grant # ALLRP 554507-20).

Institutional Review Board Statement

Not applicable.

Informed Consent Statement

Not applicable.

Data Availability Statement

Not applicable.

Acknowledgments

We wish to thank our municipal and provincial partners, including the Ministry of the Environment, Conservation and Parks (MECP) and Toronto Public Health, for helpful discussions in support of our monitoring studies.

Conflicts of Interest

The authors declare no conflict of interest.

References

  1. Glassmeyer, S.T.; Furlong, E.T.; Kolpin, D.W.; Cahill, J.D.; Zaugg, S.D.; Werner, S.L.; Meyer, M.T.; Kryak, D.D. Transport of chemical and microbial compounds from known wastewater discharges: Potential for use as indicators of human fecal contamination. Environ. Sci. Technol. 2005, 39, 5157–5169. [Google Scholar] [CrossRef] [Green Version]
  2. Karkman, A.; Pärnänen, K.; Larsson, D.J. Fecal pollution can explain antibiotic resistance gene abundances in anthropogenically impacted environments. Nat. Commun. 2019, 10, 80. [Google Scholar] [CrossRef]
  3. Cabral, J.P. Water microbiology. Bacterial pathogens and water. Int. J. Environ. Res. Public Health 2010, 7, 3657–3703. [Google Scholar] [CrossRef] [PubMed]
  4. Paruch, L.; Paruch, A.M.; Eiken, H.G.; Sorheim, R. Faecal pollution affects abundance and diversity of aquatic microbial community in anthropo-zoogenically influenced lotic ecosystems. Sci. Rep. 2019, 9, 19469. [Google Scholar] [CrossRef] [PubMed]
  5. Anderson, K.L.; Whitlock, J.E.; Harwood, V.J. Persistence and differential survival of fecal indicator bacteria in subtropical waters and sediments. Appl. Environ. Microbiol. 2005, 71, 3041–3048. [Google Scholar] [CrossRef] [Green Version]
  6. Porter, K.D.H.; Quilliam, R.S.; Reaney, S.M.; Oliver, D.M. High resolution characterisation of E. coli proliferation profiles in livestock faeces. Waste Manag. 2019, 87, 537–545. [Google Scholar] [CrossRef] [PubMed]
  7. He, Q.; Qiu, S.; Jiang, Y.; Wu, Z.; Liu, Z. Land-use change caused microbial pollution in a karst underground river, Chongqing, China. Environ. Earth Sci. 2016, 75, 709. [Google Scholar] [CrossRef]
  8. Rehman, F.; Subyani, A.M.; Cheema, T.; Harbi, H.M.; Azeem, T.; Naseem, A.A.; Ullah, M.F.; Riaz, O.; Ur Rehman, S. Contribution to the comparative study of treated and untreated wastewater: A case study (Wadi Fatima and Al Misk Lake) in Saudi Arabia. Arab. J. Geosci. 2020, 13, 842. [Google Scholar] [CrossRef]
  9. Abd-Elhamid, H.F.; Abd-Elmoneem, S.M.; Abdelaal, G.M.; Zelenakova, M.; Vranayova, Z.; Abd-Elaty, I. Investigating and Managing the Impact of Using Untreated Wastewater for Irrigation on the Groundwater Quality in Arid and Semi-Arid Regions. Int. J. Environ. Res. Public Health 2021, 18, 7485. [Google Scholar] [CrossRef]
  10. Kuroda, K.; Murakami, M.; Oguma, K.; Muramatsu, Y.; Takada, H.; Taldzawa, S. Assessment of Groundwater Pollution in Tokyo Using PPCPs as Sewage Markers. Environ. Sci. Technol. 2012, 46, 1455–1464. [Google Scholar] [CrossRef]
  11. World Health Organization & the United Nations Children’s Fund. Progress on Drinking Water, Sanitation and Hygiene: 2017 Update and SDG Baselines; WHO: Geneva, Switzerland, 2017; Licence: CC BY-NC-SA 3.0 IGO. [Google Scholar]
  12. Troeger, C.; Blacker, B.F.; Khalil, I.A.; Rao, P.C.; Cao, S.; Zimsen, S.R.; Albertson, S.B.; Stanaway, J.D.; Deshpande, A.; Abebe, Z. Estimates of the global, regional, and national morbidity, mortality, and aetiologies of diarrhoea in 195 countries: A systematic analysis for the Global Burden of Disease Study 2016. Lancet Infect. Dis. 2018, 18, 1211–1228. [Google Scholar] [CrossRef] [Green Version]
  13. Fuhrmeister, E.R.; Ercumen, A.; Pickering, A.J.; Jeanis, K.M.; Ahmed, M.; Brown, S.; Arnold, B.F.; Hubbard, A.E.; Alam, M.; Sen, D.; et al. Predictors of Enteric Pathogens in the Domestic Environment from Human and Animal Sources in Rural Bangladesh. Environ. Sci. Technol. 2019, 53, 10023–10033. [Google Scholar] [CrossRef] [Green Version]
  14. Wanjugi, P.; Sivaganesan, M.; Korajkic, A.; McMinn, B.; Kelty, C.A.; Rhodes, E.; Cyterski, M.; Zepp, R.; Oshima, K.; Stachler, E.; et al. Incidence of somatic and F+ coliphage in Great Lake Basin recreational waters. Water Res. 2018, 140, 200–210. [Google Scholar] [CrossRef]
  15. Jagai, J.S.; Castronovo, D.A.; Monchak, J.; Naumova, E.N. Seasonality of cryptosporidiosis: A meta-analysis approach. Environ. Res. 2009, 109, 465–478. [Google Scholar] [CrossRef] [Green Version]
  16. Niendorf, S.; Ebner, W.; Marques, A.M.; Bierbaum, S.; Babikir, R.; Huzly, D.; Maaßen, S.; Grundmann, H.; Panning, M. Rotavirus outbreak among adults in a university hospital in Germany. J. Clin. Virol. 2020, 129, 104532. [Google Scholar] [CrossRef] [PubMed]
  17. Owusu-Ansah, E.d.-G.J.; Sampson, A.; Amponsah, S.K.; Abaidoo, R.C.; Dalsgaard, A.; Hald, T. Probabilistic quantitative microbial risk assessment model of norovirus from wastewater irrigated vegetables in Ghana using genome copies and fecal indicator ratio conversion for estimating exposure dose. Sci. Total Environ. 2017, 601, 1712–1719. [Google Scholar] [CrossRef] [PubMed]
  18. Wei, S.H.; Huang, A.S.; Liao, Y.S.; Liu, Y.L.; Chiou, C.S. A large outbreak of salmonellosis associated with sandwiches contaminated with multiple bacterial pathogens purchased via an online shopping service. Foodborne Pathog. Dis. 2014, 11, 230–233. [Google Scholar] [CrossRef] [PubMed] [Green Version]
  19. Minnesota Department of Health. Salmonellosis. 2010. Available online: https://www.health.state.mn.us/diseases/reportable/dcn/sum10/salmonellosis.html (accessed on 15 August 2021).
  20. U.S. Centers for Disease Control and Prevention. Multistate Outbreak of Multidrug-Resistant Salmonella Heidelberg Infections Linked to Foster Farms Brand Chicken (Final Update). Available online: https://www.cdc.gov/salmonella/heidelberg-10-13/ (accessed on 21 August 2021).
  21. Hopkins, J.; Hague, H.; Hudgin, G.; Ross, L.; Moore, D. An Outbreak of Cryptosporidium at a Recreational Water Park in Niagara Region, Canada. J. Environ. Health 2013, 75, 28–33. [Google Scholar]
  22. Waldron, L.S.; Ferrari, B.C.; Cheung-Kwok-Sang, C.; Beggs, P.J.; Stephens, N.; Power, M.L. Molecular epidemiology and spatial distribution of a waterborne cryptosporidiosis outbreak in Australia. Appl. Environ. Microbiol. 2011, 77, 7766–7771. [Google Scholar] [CrossRef] [Green Version]
  23. Chen, T.; Leung, R.K.; Zhou, Z.; Liu, R.; Zhang, X.; Zhang, L. Investigation of key interventions for shigellosis outbreak control in China. PLoS ONE 2014, 9, e95006. [Google Scholar] [CrossRef]
  24. Topal, S.; Çelik, H.; Yilmaz, Ş.; Özoğlu, E.; Karaoğlanoğlu, O.; Temel, F.; Şirin, H. Outbreak of Shigella sonnei infection in Terme City, Turkey, September 2012. Turk Hij. Deney. Biyol. Derg. 2019, 76, 141–148. [Google Scholar] [CrossRef]
  25. Gill, A.; Huszczynski, G. Enumeration of Escherichia coli O157:H7 in Outbreak-Associated Beef Patties. J. Food Prot. 2016, 79, 1266–1268. [Google Scholar] [CrossRef]
  26. Asia Pacific Emerging Infections Network, University of Washington, Seattle, USA. Japan: E. coli O157:H7 Outbreak, Pickled Cabbage. 2012. Available online: https://blogs.uw.edu/apecein/2012/08/31/japan-e-coli-o157h7-outbreak-pickled-cabbage/ (accessed on 11 August 2021).
  27. Kenyon, J.; Inns, T.; Aird, H.; Swift, C.; Astbury, J.; Forester, E.; Decraene, V. Campylobacter outbreak associated with raw drinking milk, North West England, 2016. Epidemiol. Infect. 2020, 148, e13. [Google Scholar] [CrossRef] [PubMed] [Green Version]
  28. Institute of Environmental Science and Research Funded by Ministry of Health, New Zealand. Annual Summary of Outbreaks in New Zealand. 2016. Available online: https://surv.esr.cri.nz/surveillance/annual_outbreak.php?we_objectID=4741 (accessed on 2 September 2021).
  29. Viray, M.; Hofmeister, M.; Johnston, D.; Krishnasamy, V.; Nichols, C.; Foster, M.; Balajadia, R.; Wise, M.; Manuzak, A.; Lin, Y. Public health investigation and response to a hepatitis A outbreak from imported scallops consumed raw—Hawaii, 2016. Epidemiol. Infect. 2019, 147, E28. [Google Scholar] [CrossRef] [PubMed] [Green Version]
  30. Rakesh, P.; Mainu, T.C.R.; Raj, A.; Babu, D.; Rajiv, M.; Mohandas, K.S.; Das, A.; Balasubramanian, A. Investigating a community wide outbreak of hepatitis A in Kerala, India. J. Fam. Med. Prim. Care 2018, 7, 1537. [Google Scholar]
  31. Maguire, J.E.; Glasgow, K.; Glass, K.; Roczo-Farkas, S.; Bines, J.E.; Sheppeard, V.; Macartney, K.; Quinn, H.E. Rotavirus epidemiology and monovalent rotavirus vaccine effectiveness in Australia: 2010–2017. Pediatrics 2019, 144, e20191024. [Google Scholar] [CrossRef]
  32. Kujawski, S.A.; Lu, X.; Schneider, E.; Blythe, D.; Boktor, S.; Farrehi, J.; Haupt, T.; McBride, D.; Stephens, E.; Sakthivel, S.K.; et al. Outbreaks of Adenovirus-associated Respiratory Illness on 5 College Campuses in the United States, 2018–2019. Clin. Infect. Dis. 2021, 72, 1992–1999. [Google Scholar] [CrossRef]
  33. Dai, M.; Wu, Y.; Tan, H.; Deng, J.; Hou, M.; Peng, W.; Chen, G.; Li, Y.; Li, H.; Pan, P. Cross-infection of adenovirus among medical staff: A warning from the intensive care unit in a tertiary care teaching hospital in China. Int. J. Infect. Dis. 2020, 98, 390–397. [Google Scholar] [CrossRef]
  34. Belluz, J. The Dreaded Norovirus Has Hit the Winter Olympics. at Least 199 People Are Sick. Vox. 2018. Available online: https://www.vox.com/science-and-health/2018/2/6/16980028/winter-olympics-norovirus (accessed on 15 September 2021).
  35. Fumian, T.M.; Ferreira, F.C.; de Andrade, J.d.S.R.; Canal, N.; Silva Gomes, G.; Teixeira, L.B.; Miagostovich, M.P. Norovirus Foodborne Outbreak Associated with the Consumption of Ice Pop, Southern Brazil, 2020. Food Environ. Virol. 2021, 1–7. [Google Scholar] [CrossRef]
  36. Rizzo, L.; Manaia, C.; Merlin, C.; Schwartz, T.; Dagot, C.; Ploy, M.; Michael, I.; Fatta-Kassinos, D. Urban wastewater treatment plants as hotspots for antibiotic resistant bacteria and genes spread into the environment: A review. Sci. Total Environ. 2013, 447, 345–360. [Google Scholar] [CrossRef] [Green Version]
  37. Palacios, O.A.; Contreras, C.A.; Muñoz-Castellanos, L.N.; González-Rangel, M.O.; Rubio-Arias, H.; Palacios-Espinosa, A.; Nevárez-Moorillón, G.V. Monitoring of indicator and multidrug resistant bacteria in agricultural soils under different irrigation patterns. Agric. Water Manag. 2017, 184, 19–27. [Google Scholar] [CrossRef]
  38. Proia, L.; Anzil, A.; Subirats, J.; Borrego, C.; Farre, M.; Llorca, M.; Balcazar, J.L.; Servais, P. Antibiotic resistance along an urban river impacted by treated wastewaters. Sci. Total Environ. 2018, 628–629, 453–466. [Google Scholar] [CrossRef] [PubMed]
  39. Liu, C.; Li, X.; Zheng, S.; Kai, Z.; Jin, T.; Shi, R.; Huang, H.; Zheng, X. Effects of wastewater treatment and manure application on the dissemination of antimicrobial resistance around swine feedlots. J. Clean. Prod. 2021, 280, 123794. [Google Scholar] [CrossRef]
  40. Luczkiewicz, A.; Jankowska, K.; Fudala-Ksiazek, S.; Olanczuk-Neyman, K. Antimicrobial resistance of fecal indicators in municipal wastewater treatment plant. Water Res. 2010, 44, 5089–5097. [Google Scholar] [CrossRef]
  41. Andreev, N.; Ronteltap, M.; Boincean, B.; Wernli, M.; Zubcov, E.; Bagrin, N.; Borodin, N.; Lens, P.N.L. Lactic acid fermentation of human urine to improve its fertilizing value and reduce odour emissions. J. Environ. Manag. 2017, 198, 63–69. [Google Scholar] [CrossRef]
  42. Shen, Y.; Ren, L.; Li, G.; Chen, T.; Guo, R. Influence of aeration on CH4, N2O and NH3 emissions during aerobic composting of a chicken manure and high C/N waste mixture. Waste Manag. 2011, 31, 33–38. [Google Scholar] [CrossRef]
  43. Han, Z.; Sun, D.; Wang, H.; Li, R.; Bao, Z.; Qi, F. Effects of ambient temperature and aeration frequency on emissions of ammonia and greenhouse gases from a sewage sludge aerobic composting plant. Bioresour. Technol. 2018, 270, 457–466. [Google Scholar] [CrossRef]
  44. Petkuviene, J.; Vaiciute, D.; Katarzyte, M.; Gecaite, I.; Rossato, G.; Vybernaite-Lubiene, I.; Bartoli, M. Feces from piscivorous and herbivorous birds stimulate differentially phytoplankton growth. Water 2019, 11, 2567. [Google Scholar] [CrossRef] [Green Version]
  45. Wang, Y.; Gu, X.; Zeng, Q.; Mao, Z.; Wang, W. Contrasting response of a plankton community to two filter-feeding fish and their feces: An in situ enclosure experiment. Aquaculture 2016, 465, 330–340. [Google Scholar] [CrossRef]
  46. Börjesson, G.; Kätterer, T. Soil fertility effects of repeated application of sewage sludge in two 30-year-old field experiments. Nutr. Cycl. Agroecosyst. 2018, 112, 369–385. [Google Scholar] [CrossRef] [Green Version]
  47. Pradhan, S.K.; Cofie, O.; Nikiema, J.; Heinonen-Tanski, H. Fecal sludge derived products as fertilizer for lettuce cultivation in urban agriculture. Sustainability 2019, 11, 7101. [Google Scholar] [CrossRef] [Green Version]
  48. Bartelme, R.P.; Oyserman, B.O.; Blom, J.E.; Sepulveda-Villet, O.J.; Newton, R.J. Stripping Away the Soil: Plant Growth Promoting Microbiology Opportunities in Aquaponics. Front. Microbiol. 2018, 9, 8. [Google Scholar] [CrossRef] [PubMed] [Green Version]
  49. Pradhan, S.K.; Nikiema, J.; Cofie, O.O.; Heinonen-Tanski, H.; Drechsel, P. Fecal sludge-derived pellet fertilizer in maize cultivation. J. Water Sanit. Hyg. Dev. 2016, 6, 474–481. [Google Scholar] [CrossRef]
  50. Hashemi, S.; Han, M. Optimizing source-separated feces degradation and fertility using nitrifying microorganisms. J. Environ. Manag. 2018, 206, 540–546. [Google Scholar] [CrossRef]
  51. Yoshizawa, N.; Usui, M.; Fukuda, A.; Asai, T.; Higuchi, H.; Okamoto, E.; Seki, K.; Takada, H.; Tamura, Y. Manure compost is a potential source of tetracycline-resistant Escherichia coli and tetracycline resistance genes in Japanese farms. Antibiotics 2020, 9, 76. [Google Scholar] [CrossRef] [Green Version]
  52. Korajkic, A.; McMinn, B.R.; Harwood, V.J. Relationships between microbial indicators and pathogens in recreational water settings. Int. J. Environ. Res. Public Health 2018, 15, 2842. [Google Scholar] [CrossRef] [Green Version]
  53. U.S. Environmental Protection Agency. Basic Information about Nonpoint Source (NPS) Pollution. 2020. Available online: https://www.epa.gov/nps/basic-information-about-nonpoint-source-nps-pollution (accessed on 5 August 2021).
  54. Edberg, S.C.; Rice, E.W.; Karlin, R.J.; Allen, M.J. Escherichia coli: The best biological drinking water indicator for public health protection. Symp. Ser. Soc. Appl. Microbiol. 2000, 88, 106S–116S. [Google Scholar] [CrossRef]
  55. Rochelle-Newall, E.; Nguyen, T.M.; Le, T.P.; Sengtaheuanghoung, O.; Ribolzi, O. A short review of fecal indicator bacteria in tropical aquatic ecosystems: Knowledge gaps and future directions. Front. Microbiol. 2015, 6, 308. [Google Scholar] [CrossRef]
  56. Ahmed, W.; Gyawali, P.; Feng, S.; McLellan, S.L. Host Specificity and Sensitivity of Established and Novel Sewage-Associated Marker Genes in Human and Nonhuman Fecal Samples. Appl. Environ. Microbiol. 2019, 85, e00641-19. [Google Scholar] [CrossRef] [Green Version]
  57. Tran, N.H.; Gin, K.Y.; Ngo, H.H. Fecal pollution source tracking toolbox for identification, evaluation and characterization of fecal contamination in receiving urban surface waters and groundwater. Sci. Total Environ. 2015, 538, 38–57. [Google Scholar] [CrossRef]
  58. Ahmed, W.; Goonetilleke, A.; Gardner, T. Human and bovine adenoviruses for the detection of source-specific fecal pollution in coastal waters in Australia. Water Res. 2010, 44, 4662–4673. [Google Scholar] [CrossRef] [Green Version]
  59. Hundesa, A.; Bofill-Mas, S.; Maluquer de Motes, C.; Rodriguez-Manzano, J.; Bach, A.; Casas, M.; Girones, R. Development of a quantitative PCR assay for the quantitation of bovine polyomavirus as a microbial source-tracking tool. J. Virol. Methods 2010, 163, 385–389. [Google Scholar] [CrossRef] [PubMed]
  60. Harrach, B.; Tarján, Z.L.; Benkő, M. Adenoviruses across the animal kingdom: A walk in the zoo. FEBS Lett. 2019, 593, 3660–3673. [Google Scholar] [CrossRef] [PubMed]
  61. Robinson, R.K. Encyclopedia of Food Microbiology; Academic Press: New York, NY, USA, 2014. [Google Scholar]
  62. Masiello, S.N.; Martin, N.H.; Trmcic, A.; Wiedmann, M.; Boor, K.J. Identification and characterization of psychrotolerant coliform bacteria isolated from pasteurized fluid milk. J. Dairy Sci. 2016, 99, 130–140. [Google Scholar] [CrossRef] [Green Version]
  63. Martin, N.H.; Trmčić, A.; Hsieh, T.-H.; Boor, K.J.; Wiedmann, M. The evolving role of coliforms as indicators of unhygienic processing conditions in dairy foods. Front. Microbiol. 2016, 7, 1549. [Google Scholar] [CrossRef]
  64. Craun, G.F.; Berger, P.S.; Calderon, R.L. Coliform bacteria and waterborne disease outbreaks. J.-Am. Water Work. Assoc. 1997, 89, 96–104. [Google Scholar] [CrossRef]
  65. U.S. Environmental Protection Agency. National Interim Primary Drinking Water Regulations; U.S. Environmental Protection Agency: Washington, DC, USA, 1976.
  66. U.S. Environmental Protection Agency. National Primary Drinking Water Regulations Total Coliforms Final Rule; U.S. Environmental Protection Agency: Washington, DC, USA, 1989.
  67. Das, S.K.; Das, S.K. Influence of phosphorus and organic matter on microbial transformation of arsenic. Environ. Technol. Innov. 2020, 19, 100930. [Google Scholar] [CrossRef]
  68. Rosenblueth, M.; Martinez, L.; Silva, J.; Martinez-Romero, E. Klebsiella variicola, a novel species with clinical and plant-associated isolates. Syst. Appl. Microbiol. 2004, 27, 27–35. [Google Scholar] [CrossRef] [Green Version]
  69. Kabler, P.W.; Clark, H.F. Coliform group and fecal coliform organisms as indicators of pollution in drinking water. J.-Am. Water Work. Assoc. 1960, 52, 1577–1579. [Google Scholar] [CrossRef]
  70. Coliform Bacteria in Drinking Water Supplies; New York State Department of Health, Center for Environmental Health: New York, NY, USA, 2017.
  71. Florini, S.; Shahsavari, E.; Ngo, T.; Aburto-Medina, A.; Smith, D.J.; Ball, A.S. Factors Influencing the Concentration of Fecal Coliforms in Oysters in the River Blackwater Estuary, UK. Water 2020, 12, 1086. [Google Scholar] [CrossRef]
  72. Bartram, J.; Ballance, R. Water Quality Monitoring: A Practical Guide to the Design and Implementation of Freshwater Quality Studies and Monitoring Programmes; CRC Press: Boca Raton, FL, USA, 1996. [Google Scholar]
  73. Leclercq, A.; Wanegue, C.; Baylac, P. Comparison of fecal coliform agar and violet red bile lactose agar for fecal coliform enumeration in foods. Appl. Environ. Microbiol. 2002, 68, 1631–1638. [Google Scholar] [CrossRef] [PubMed] [Green Version]
  74. Alonso, J.; Soriano, A.; Amoros, I.; Ferrus, M. Quantitative determination of E. coli, and fecal coliforms in water using a chromogenic medium. J. Environ. Sci. Health Part A 1998, 33, 1229–1248. [Google Scholar] [CrossRef]
  75. Evans, T.M.; LeChevallier, M.W.; Waarvick, C.E.; Seidler, R.J. Coliform species recovered from untreated surface water and drinking water by the membrane filter, standard, and modified most-probable-number techniques. Appl. Environ. Microbiol. 1981, 41, 657–663. [Google Scholar] [CrossRef] [Green Version]
  76. Dunling, W.; Fiessel, W. Evaluation of media for simultaneous enumeration of total coliform and Escherichia coli in drinking water supplies by membrane filtration techniques. J. Environ. Sci. 2008, 20, 273–277. [Google Scholar]
  77. Tominaga, T. Rapid quantification of coliforms in ready-to-eat foods using lateral-flow immunochromatographic assay. J. Food Saf. 2020, 40, e12835. [Google Scholar] [CrossRef]
  78. Hu, S.; Yu, Y.; Li, R.; Xia, X.; Xiao, X.; Li, X. Real-time TaqMan PCR for rapid detection and quantification of coliforms in chilled meat. Food Anal. Methods 2016, 9, 813–822. [Google Scholar] [CrossRef]
  79. Martin, M.C.; Martinez, N.; del Rio, B.; Ladero, V.; Fernandez, M.; Alvarez, M.A. A novel real-time polymerase chain reaction-based method for the detection and quantification of lactose-fermenting Enterobacteriaceae in the dairy and other food industries. J. Dairy Sci. 2010, 93, 860–867. [Google Scholar] [CrossRef] [Green Version]
  80. Li, X.; Harwood, V.J.; Nayak, B.; Staley, C.; Sadowsky, M.J.; Weidhaas, J. A novel microbial source tracking microarray for pathogen detection and fecal source identification in environmental systems. Environ. Sci. Technol. 2015, 49, 7319–7329. [Google Scholar] [CrossRef] [PubMed]
  81. Cheswick, R.; Cartmell, E.; Lee, S.; Upton, A.; Weir, P.; Moore, G.; Nocker, A.; Jefferson, B.; Jarvis, P. Comparing flow cytometry with culture-based methods for microbial monitoring and as a diagnostic tool for assessing drinking water treatment processes. Environ. Int. 2019, 130, 104893. [Google Scholar] [CrossRef]
  82. Xia, Y.; Li, A.-D.; Deng, Y.; Jiang, X.-T.; Li, L.-G.; Zhang, T. MinION nanopore sequencing enables correlation between resistome phenotype and genotype of coliform bacteria in municipal sewage. Front. Microbiol. 2017, 8, 2105. [Google Scholar] [CrossRef]
  83. Moore, A.C.; Herwaldt, B.L.; Craun, G.F.; Calderon, R.L.; Highsmith, A.K.; Juranek, D.D. Waterborne disease in the United States, 1991 and 1992. J.-Am. Water Work. Assoc. 1994, 86, 87–97. [Google Scholar] [CrossRef]
  84. U.S. Environmental Protection Agency. Test Methods for Escherichia coli and Enterococci in Water by the Membrane Filter Procedure; (Method #1103.1); U.S. Environmental Protection Agency: Washington, DC, USA, 1985.
  85. U.S. Environmental Protection Agency. Ambient Water Quality Criteria for Bacteria—1986; U.S. Environmental Protection Agency: Washington, DC, USA, 1986.
  86. Ishii, S.; Sadowsky, M.J. Escherichia coli in the Environment: Implications for Water Quality and Human Health. Microbes. Environ. 2008, 23, 101–108. [Google Scholar] [CrossRef] [PubMed] [Green Version]
  87. Souid, F.; Agoubi, B.; Hamdi, M.; Telahigue, F.; Kharroubi, A. Groundwater chemical and fecal contamination assessment of the Jerba unconfined aquifer, southeast of Tunisia. Arab. J. Geosci. 2017, 10, 231. [Google Scholar] [CrossRef]
  88. Dheenan, P.S.; Jha, D.K.; Das, A.K.; Vinithkumar, N.V.; Devi, M.P.; Kirubagaran, R. Geographic information systems and multivariate analysis to evaluate fecal bacterial pollution in coastal waters of Andaman, India. Environ. Pollut. 2016, 214, 45–53. [Google Scholar] [CrossRef] [PubMed]
  89. Byappanahalli, M.N.; Whitman, R.L.; Shively, D.A.; Sadowsky, M.J.; Ishii, S. Population structure, persistence, and seasonality of autochthonous Escherichia coli in temperate, coastal forest soil from a Great Lakes watershed. Environ. Microbiol. 2006, 8, 504–513. [Google Scholar] [CrossRef] [PubMed]
  90. Power, M.L.; Littlefield-Wyer, J.; Gordon, D.M.; Veal, D.A.; Slade, M.B. Phenotypic and genotypic characterization of encapsulated Escherichia coli isolated from blooms in two Australian lakes. Environ. Microbiol. 2005, 7, 631–640. [Google Scholar] [CrossRef]
  91. Escobar-Paramo, P.; Le Menac’h, A.; Le Gall, T.; Amorin, C.; Gouriou, S.; Picard, B.; Skurnik, D.; Denamur, E. Identification of forces shaping the commensal Escherichia coli genetic structure by comparing animal and human isolates. Environ. Microbiol. 2006, 8, 1975–1984. [Google Scholar] [CrossRef]
  92. Gordon, D.M.; Cowling, A. The distribution and genetic structure of Escherichia coli in Australian vertebrates: Host and geographic effects. Microbiology 2003, 149, 3575–3586. [Google Scholar] [CrossRef] [Green Version]
  93. Clermont, O.; Lescat, M.; O’Brien, C.L.; Gordon, D.M.; Tenaillon, O.; Denamur, E. Evidence for a human-specific Escherichia coli clone. Environ. Microbiol. 2008, 10, 1000–1006. [Google Scholar] [CrossRef] [Green Version]
  94. Williams, A.; Avery, L.; Killham, K.; Jones, D.L. Persistence of Escherichia coli O157 on farm surfaces under different environmental conditions. J. Appl. Microbiol. 2005, 98, 1075–1083. [Google Scholar] [CrossRef]
  95. Sinton, L.W.; Hall, C.H.; Lynch, P.A.; Davies-Colley, R.J. Sunlight inactivation of fecal indicator bacteria and bacteriophages from waste stabilization pond effluent in fresh and saline waters. Appl. Environ. Microbiol. 2002, 68, 1122–1131. [Google Scholar] [CrossRef] [Green Version]
  96. Brennan, F.P.; Grant, J.; Botting, C.H.; O’Flaherty, V.; Richards, K.G.; Abram, F. Insights into the low-temperature adaptation and nutritional flexibility of a soil-persistent Escherichia coli. FEMS Microbiol. Ecol. 2013, 84, 75–85. [Google Scholar] [CrossRef] [Green Version]
  97. Vital, M.; Hammes, F.; Egli, T. Competition of Escherichia coli O157 with a drinking water bacterial community at low nutrient concentrations. Water Res. 2012, 46, 6279–6290. [Google Scholar] [CrossRef]
  98. Haller, L.; Poté, J.; Loizeau, J.-L.; Wildi, W. Distribution and survival of faecal indicator bacteria in the sediments of the Bay of Vidy, Lake Geneva, Switzerland. Ecol. Indic. 2009, 9, 540–547. [Google Scholar] [CrossRef]
  99. Schwering, M.; Song, J.; Louie, M.; Turner, R.J.; Ceri, H. Multi-species biofilms defined from drinking water microorganisms provide increased protection against chlorine disinfection. Biofouling 2013, 29, 917–928. [Google Scholar] [CrossRef] [PubMed]
  100. Mellefont, L.A.; McMeekin, T.A.; Ross, T. Performance evaluation of a model describing the effects of temperature, water activity, pH and lactic acid concentration on the growth of Escherichia coli. Int. J. Food Microbiol. 2003, 82, 45–58. [Google Scholar] [CrossRef]
  101. Abia, A.L.; Ubomba-Jaswa, E.; Momba, M.N. Impact of seasonal variation on Escherichia coli concentrations in the riverbed sediments in the Apies River, South Africa. Sci. Total Environ. 2015, 537, 462–469. [Google Scholar] [CrossRef] [PubMed]
  102. Stocker, M.D.; Pachepsky, Y.A.; Hill, R.L.; Shelton, D.R. Depth-Dependent Survival of Escherichia coli and Enterococci in Soil after Manure Application and Simulated Rainfall. Appl. Environ. Microbiol. 2015, 81, 4801–4808. [Google Scholar] [CrossRef] [Green Version]
  103. Kleinheinz, G.T.; McDermott, C.M.; Hughes, S.; Brown, A. Effects of rainfall on E. coli concentrations at Door County, Wisconsin beaches. Int. J. Microbiol. 2009, 2009, 876050. [Google Scholar] [CrossRef] [Green Version]
  104. Mugler, C.; Ribolzi, O.; Viguier, M.; Janeau, J.L.; Jarde, E.; Latsachack, K.; Henry-Des-Tureaux, T.; Thammahacksa, C.; Valentin, C.; Sengtaheuanghoung, O.; et al. Experimental and modelling evidence of splash effects on manure borne Escherichia coli washoff. Environ. Sci. Pollut. Res. Int. 2021, 28, 33009–33020. [Google Scholar] [CrossRef]
  105. Stumpf, C.H.; Piehler, M.F.; Thompson, S.; Noble, R.T. Loading of fecal indicator bacteria in North Carolina tidal creek headwaters: Hydrographic patterns and terrestrial runoff relationships. Water Res. 2010, 44, 4704–4715. [Google Scholar] [CrossRef]
  106. Abia, A.L.; James, C.; Ubomba-Jaswa, E.; Benteke Momba, M.N. Microbial Remobilisation on Riverbed Sediment Disturbance in Experimental Flumes and a Human-Impacted River: Implication for Water Resource Management and Public Health in Developing Sub-Saharan African Countries. Int. J. Environ. Res. Public Health 2017, 14, 306. [Google Scholar] [CrossRef] [Green Version]
  107. Ducarmon, Q.R.; Zwittink, R.D.; Hornung, B.V.H.; van Schaik, W.; Young, V.B.; Kuijper, E.J. Gut Microbiota and Colonization Resistance against Bacterial Enteric Infection. Microbiol. Mol. Biol. Rev. 2019, 83, e00007-19. [Google Scholar] [CrossRef] [PubMed]
  108. Momose, Y.; Hirayama, K.; Itoh, K. Competition for proline between indigenous Escherichia coli and E. coli O157: H7 in gnotobiotic mice associated with infant intestinal microbiota and its contribution to the colonization resistance against E. coli O157: H7. Antonie Van Leeuwenhoek 2008, 94, 165–171. [Google Scholar] [CrossRef] [PubMed]
  109. Panhwar, S.; Aftab, A.; Keerio, H.A.; Sarmadivaleh, M.; Tamer, U. A Novel Approach for Real-Time Enumeration of Escherichia coli ATCC 47076 in Water through High Multi-Functional Engineered Nano-Dispersible Electrode. J. Electrochem. Soc. 2021, 168, 037514. [Google Scholar] [CrossRef]
  110. Centers for Disease Control and Prevention. National Shiga Toxin-Producing Escherichia coli (STEC) Surveillance Annual Report, 2016; CDC: Atlanta, GA, USA, 2018. [Google Scholar]
  111. Wong, S.Y.; Paschos, A.; Gupta, R.S.; Schellhorn, H.E. Insertion/deletion-based approach for the detection of Escherichia coli O157: H7 in freshwater environments. Environ. Sci. Technol. 2014, 48, 11462–11470. [Google Scholar] [CrossRef]
  112. Cox, C.R.; Gilmore, M.S. Native microbial colonization of Drosophila melanogaster and its use as a model of Enterococcus faecalis pathogenesis. Infect. Immun. 2007, 75, 1565–1576. [Google Scholar] [CrossRef] [Green Version]
  113. Ghosh, A.; Kukanich, K.; Brown, C.E.; Zurek, L. Resident Cats in Small Animal Veterinary Hospitals Carry Multi-Drug Resistant Enterococci and are Likely Involved in Cross-Contamination of the Hospital Environment. Front. Microbiol. 2012, 3, 62. [Google Scholar] [CrossRef] [Green Version]
  114. Cai, Y. Identification and characterization of Enterococcus species isolated from forage crops and their influence on silage fermentation. J. Dairy Sci. 1999, 82, 2466–2471. [Google Scholar] [CrossRef]
  115. Napier, M.D.; Haugland, R.; Poole, C.; Dufour, A.P.; Stewart, J.R.; Weber, D.J.; Varma, M.; Lavender, J.S.; Wade, T.J. Exposure to human-associated fecal indicators and self-reported illness among swimmers at recreational beaches: A cohort study. Environ. Health 2017, 16, 103. [Google Scholar] [CrossRef] [Green Version]
  116. Wade, T.J.; Sams, E.; Brenner, K.P.; Haugland, R.; Chern, E.; Beach, M.; Wymer, L.; Rankin, C.C.; Love, D.; Li, Q. Rapidly measured indicators of recreational water quality and swimming-associated illness at marine beaches: A prospective cohort study. Environ. Health 2010, 9, 66. [Google Scholar] [CrossRef] [PubMed] [Green Version]
  117. Wade, T.J.; Calderon, R.L.; Brenner, K.P.; Sams, E.; Beach, M.; Haugland, R.; Wymer, L.; Dufour, A.P. High sensitivity of children to swimming-associated gastrointestinal illness: Results using a rapid assay of recreational water quality. Epidemiology 2008, 19, 375–383. [Google Scholar] [CrossRef]
  118. U.S. Environmental Protection Agency. Recreational Water Quality Criteria; U.S. Environmental Protection Agency: Washington, DC, USA, 2012.
  119. Wymer, L.J.; Brenner, K.P.; Martinson, J.W.; Stutts, W.R.; Schaub, S.; Dufour, A.P. The EMPACT Beaches Project: Results from a Study on Microbiological Monitoring in Recreational Waters; USEPA: Washington, DC, USA, 2005.
  120. Health and Welfare Canada. Guidelines for Canadian Recreational Water Quality, 3rd ed.; Healthy Environments and Consumer Safety Branch, Health Canada: Ottawa, ON, Canada, 2012. [Google Scholar]
  121. Soller, J.A.; Schoen, M.E.; Bartrand, T.; Ravenscroft, J.E.; Ashbolt, N.J. Estimated human health risks from exposure to recreational waters impacted by human and non-human sources of faecal contamination. Water Res. 2010, 44, 4674–4691. [Google Scholar] [CrossRef] [PubMed]
  122. Miller, W.R.; Munita, J.M.; Arias, C.A. Mechanisms of antibiotic resistance in enterococci. Expert Rev. Anti-Infect. 2014, 12, 1221–1236. [Google Scholar] [CrossRef] [PubMed]
  123. Cheng, W.; Chen, J.-C. Effect of cultivation broth pH, temperature and NaCl concentration on virulence of an Enterococcus-like bacterium to the giant freshwater prawn Macrobrachium rosenbergii. Dis. Aquat. Org. 1999, 36, 233–237. [Google Scholar] [CrossRef]
  124. Dubin, K.; Pamer, E.G. Enterococci and their interactions with the intestinal microbiome. Microbiol. Spectr. 2017, 5, 5–6. [Google Scholar] [CrossRef] [Green Version]
  125. Roslev, P.; Iversen, L.; Sonderbo, H.L.; Iversen, N.; Bastholm, S. Uptake and persistence of human associated Enterococcus in the mussel Mytilus edulis: Relevance for faecal pollution source tracking. J. Appl. Microbiol. 2009, 107, 944–953. [Google Scholar] [CrossRef]
  126. Nishiyama, M.; Iguchi, A.; Suzuki, Y. Identification of Enterococcus faecium and Enterococcus faecalis as vanC-type vancomycin-resistant enterococci (VRE) from sewage and river water in the provincial city of Miyazaki, Japan. J. Environ. Sci. Health Part A 2015, 50, 16–25. [Google Scholar] [CrossRef]
  127. Piggot, A.M.; Klaus, J.S.; Johnson, S.; Phillips, M.C.; Solo-Gabriele, H.M. Relationship between enterococcal levels and sediment biofilms at recreational beaches in South Florida. Appl. Environ. Microbiol. 2012, 78, 5973–5982. [Google Scholar] [CrossRef] [Green Version]
  128. Wiegner, T.N.; Mead, L.H.; Molloy, S.L. A comparison of water quality between low-and high-flow river conditions in a tropical estuary, Hilo Bay, Hawaii. Estuaries Coasts 2013, 36, 319–333. [Google Scholar] [CrossRef]
  129. Deller, S.; Mascher, F.; Platzer, S.; Reinthaler, F.F.; Marth, E. Effect of solar radiation on survival of indicator bacteria in bathing waters. Cent. Eur. J. Public Health 2006, 14, 133–137. [Google Scholar] [CrossRef] [Green Version]
  130. Heim, S.; Del Mar Lleo, M.; Bonato, B.; Guzman, C.A.; Canepari, P. The viable but nonculturable state and starvation are different stress responses of Enterococcus faecalis, as determined by proteome analysis. J. Bacteriol. 2002, 184, 6739–6745. [Google Scholar] [CrossRef] [Green Version]
  131. Dorevitch, S.; Doi, M.; Hsu, F.C.; Lin, K.T.; Roberts, J.D.; Liu, L.C.; Gladding, R.; Vannoy, E.; Li, H.; Javor, M.; et al. A comparison of rapid and conventional measures of indicator bacteria as predictors of waterborne protozoan pathogen presence and density. J. Environ. Monit. 2011, 13, 2427–2435. [Google Scholar] [CrossRef]
  132. Mansilha, C.R.; Coelho, C.A.; Reinas, A.; Moutinho, A.; Ferreira, S.; Pizarro, C.; Tavares, A. Salmonella: The forgotten pathogen: Health hazards of compliance with European Bathing Water Legislation. Mar. Pollut. Bull. 2010, 60, 819–826. [Google Scholar] [CrossRef]
  133. Wang, H.; Naghavi, M.; Allen, C.; Barber, R.M.; Bhutta, Z.A.; Carter, A.; Casey, D.C.; Charlson, F.J.; Chen, A.Z.; Coates, M.M. Global, regional, and national life expectancy, all-cause mortality, and cause-specific mortality for 249 causes of death, 1980–2015: A systematic analysis for the Global Burden of Disease Study 2015. Lancet 2016, 388, 1459–1544. [Google Scholar] [CrossRef] [Green Version]
  134. Koo, B.S.; Hwang, E.H.; Kim, G.; Park, J.Y.; Oh, H.; Lim, K.S.; Kang, P.; Lee, H.Y.; Jeong, K.J.; Mo, I.; et al. Prevalence and characterization of Clostridium perfringens isolated from feces of captive cynomolgus monkeys (Macaca fascicularis). Anaerobe 2020, 64, 102236. [Google Scholar] [CrossRef]
  135. Matches, J.R.; Liston, J.; Curran, D. Clostridium perfringens in the environment. Appl. Microbiol. 1974, 28, 655–660. [Google Scholar] [CrossRef] [PubMed]
  136. Sabry, M.; Abd El-Moein, K.; Hamza, E.; Abdel Kader, F. Occurrence of Clostridium perfringens Types A, E, and C in Fresh Fish and Its Public Health Significance. J. Food Prot. 2016, 79, 994–1000. [Google Scholar] [CrossRef] [PubMed]
  137. Scott, A.; Tien, Y.C.; Drury, C.F.; Reynolds, W.D.; Topp, E. Enrichment of antibiotic resistance genes in soil receiving composts derived from swine manure, yard wastes, or food wastes, and evidence for multiyear persistence of swine Clostridium spp. Can. J. Microbiol. 2018, 64, 201–208. [Google Scholar] [CrossRef] [PubMed]
  138. Milton, A.A.P.; Sanjukta, R.; Gogoi, A.P.; Momin, K.M.; Priya, G.B.; Das, S.; Ghatak, S.; Sen, A.; Kandpal, B.K. Prevalence, molecular typing and antibiotic resistance of Clostridium perfringens in free range ducks in Northeast India. Anaerobe 2020, 64, 102242. [Google Scholar] [CrossRef]
  139. Fujioka, R.S. Monitoring coastal marine waters for spore-forming bacteria of faecal and soil origin to determine point from non-point source pollution. Water Sci. Technol. 2001, 44, 181–188. [Google Scholar] [CrossRef] [PubMed]
  140. Skanavis, C.; Yanko, W.A. Clostridium perfringens as a potential indicator for the presence of sewage solids in marine sediments. Mar. Pollut. Bull. 2001, 42, 31–35. [Google Scholar] [CrossRef]
  141. Paredes-Sabja, D.; Sarker, N.; Setlow, B.; Setlow, P.; Sarker, M.R. Roles of DacB and spm proteins in clostridium perfringens spore resistance to moist heat, chemicals, and UV radiation. Appl. Environ. Microbiol. 2008, 74, 3730–3738. [Google Scholar] [CrossRef] [PubMed] [Green Version]
  142. Wang, G.; Paredes-Sabja, D.; Sarker, M.; Green, C.; Setlow, P.; Li, Y.q. Effects of wet heat treatment on the germination of individual spores of C lostridium perfringens. J. Appl. Microbiol. 2012, 113, 824–836. [Google Scholar] [CrossRef] [PubMed]
  143. Savichtcheva, O.; Okabe, S. Alternative indicators of fecal pollution: Relations with pathogens and conventional indicators, current methodologies for direct pathogen monitoring and future application perspectives. Water Res. 2006, 40, 2463–2476. [Google Scholar] [CrossRef]
  144. Vijayavel, K.; Kashian, D. Evaluation of Clostridium perfringens as a tracer of sewage contamination in sediments by two enumeration methods. Environ. Monit. Assess. 2014, 186, 5617–5624. [Google Scholar] [CrossRef]
  145. Sartory, D. Membrane filtration enumeration of faecal clostridia and Clostridium perfringens in water. Water Res. 1986, 20, 1255–1260. [Google Scholar] [CrossRef]
  146. Sartory, D.P.; Field, M.; Curbishley, S.M.; Pritchard, A.M. Evaluation of two media for the membrane filtration enumeration of Clostridium perfringens from water. Lett. Appl. Microbiol. 1998, 27, 323–327. [Google Scholar] [CrossRef] [Green Version]
  147. Marshall, R.S.; Steenbergen, J.F.; McClung, L. Rapid technique for the enumeration of Clostridium perfringens. Appl. Microbiol. 1965, 13, 559–563. [Google Scholar] [CrossRef]
  148. Karpowicz, E.; Novinscak, A.; Barlocher, F.; Filion, M. qPCR quantification and genetic characterization of Clostridium perfringens populations in biosolids composted for 2 years. J. Appl. Microbiol. 2010, 108, 571–581. [Google Scholar] [CrossRef]
  149. Milton, A.A.P.; Momin, K.M.; Priya, G.B.; Ghatak, S.; Gandhale, P.N.; Angappan, M.; Das, S.; Sen, A. A novel in situ methodology for visual detection of Clostridium perfringens in pork harnessing saltatory rolling circle amplification. Anaerobe 2021, 69, 102324. [Google Scholar] [CrossRef]
  150. Bernhard, A.E.; Field, K.G. Identification of nonpoint sources of fecal pollution in coastal waters by using host-specific 16S ribosomal DNA genetic markers from fecal anaerobes. Appl. Environ. Microbiol. 2000, 66, 1587–1594. [Google Scholar] [CrossRef] [PubMed] [Green Version]
  151. Pilla, R.; Suchodolski, J.S. The Role of the Canine Gut Microbiome and Metabolome in Health and Gastrointestinal Disease. Front. Vet. Sci. 2019, 6, 498. [Google Scholar] [CrossRef] [Green Version]
  152. Bergamaschi, M.; Tiezzi, F.; Howard, J.; Huang, Y.J.; Gray, K.A.; Schillebeeckx, C.; McNulty, N.P.; Maltecca, C. Gut microbiome composition differences among breeds impact feed efficiency in swine. Microbiome 2020, 8, 110. [Google Scholar] [CrossRef] [PubMed]
  153. Kabiri, L.; Alum, A.; Rock, C.; McLain, J.E.; Abbaszadegan, M. Isolation of Bacteroides from fish and human fecal samples for identification of unique molecular markers. Can. J. Microbiol. 2013, 59, 771–777. [Google Scholar] [CrossRef] [PubMed]
  154. Ko, H.Y.; Cho, K.; Park, S.; Kim, J.H.; Kang, J.H.; Jeong, Y.S.; Choi, J.D.; Sin, Y.; Lee, C.; Ko, G. Host-Specific Bacteroides Markers-Based Microbial Source Tracking in Aquaculture Areas. Microbes Environ. 2018, 33, 151–161. [Google Scholar] [CrossRef] [Green Version]
  155. Kildare, B.J.; Leutenegger, C.M.; McSwain, B.S.; Bambic, D.G.; Rajal, V.B.; Wuertz, S. 16S rRNA-based assays for quantitative detection of universal, human-, cow-, and dog-specific fecal Bacteroidales: A Bayesian approach. Water Res. 2007, 41, 3701–3715. [Google Scholar] [CrossRef]
  156. Kobayashi, A.; Sano, D.; Hatori, J.; Ishii, S.; Okabe, S. Chicken- and duck-associated Bacteroides-Prevotella genetic markers for detecting fecal contamination in environmental water. Appl. Microbiol. Biotechnol. 2013, 97, 7427–7437. [Google Scholar] [CrossRef]
  157. Bernhard, A.E.; Field, K.G. A PCR assay To discriminate human and ruminant feces on the basis of host differences in Bacteroides-Prevotella genes encoding 16S rRNA. Appl. Environ. Microbiol. 2000, 66, 4571–4574. [Google Scholar] [CrossRef] [Green Version]
  158. Layton, A.; McKay, L.; Williams, D.; Garrett, V.; Gentry, R.; Sayler, G. Development of Bacteroides 16S rRNA gene TaqMan-based real-time PCR assays for estimation of total, human, and bovine fecal pollution in water. Appl. Environ. Microbiol. 2006, 72, 4214–4224. [Google Scholar] [CrossRef] [Green Version]
  159. Reischer, G.H.; Kasper, D.C.; Steinborn, R.; Farnleitner, A.H.; Mach, R.L. A quantitative real-time PCR assay for the highly sensitive and specific detection of human faecal influence in spring water from a large alpine catchment area. Lett. Appl. Microbiol. 2007, 44, 351–356. [Google Scholar] [CrossRef]
  160. Okabe, S.; Okayama, N.; Savichtcheva, O.; Ito, T. Quantification of host-specific Bacteroides-Prevotella 16S rRNA genetic markers for assessment of fecal pollution in freshwater. Appl. Microbiol. Biotechnol. 2007, 74, 890–901. [Google Scholar] [CrossRef]
  161. Dick, L.K.; Bernhard, A.E.; Brodeur, T.J.; Santo Domingo, J.W.; Simpson, J.M.; Walters, S.P.; Field, K.G. Host distributions of uncultivated fecal Bacteroidales bacteria reveal genetic markers for fecal source identification. Appl. Environ. Microbiol. 2005, 71, 3184–3191. [Google Scholar] [CrossRef] [Green Version]
  162. Bacic, M.K.; Smith, C.J. Laboratory maintenance and cultivation of bacteroides species. Curr. Protoc. Microbiol. 2008, 9, 13C-1. [Google Scholar] [CrossRef] [Green Version]
  163. Livingston, S.J.; Kominos, S.D.; Yee, R.B. New medium for selection and presumptive identification of the Bacteroides fragilis group. J. Clin. Microbiol. 1978, 7, 448–453. [Google Scholar] [CrossRef] [PubMed]
  164. Ho, P.L.; Ho, L.Y.; Yau, C.Y.; Tong, M.K.; Chow, K.H. A Novel Selective Medium for Isolation of Bacteroides fragilis from Clinical Specimens. J. Clin. Microbiol. 2017, 55, 384–390. [Google Scholar] [CrossRef] [PubMed] [Green Version]
  165. Jenkins, S.A.; Drucker, D.B.; Keaney, M.G.; Ganguli, L.A. Evaluation of the RAPID ID 32A system for the identification of Bacteroides fragilis and related organisms. J. Appl. Bacteriol. 1991, 71, 360–365. [Google Scholar] [CrossRef] [PubMed]
  166. Ahmed, W.; Hughes, B.; Harwood, V.J. Current status of marker genes of Bacteroides and related taxa for identifying sewage pollution in environmental waters. Water 2016, 8, 231. [Google Scholar] [CrossRef] [Green Version]
  167. Kirs, M.; Caffaro-Filho, R.A.; Wong, M.; Harwood, V.J.; Moravcik, P.; Fujioka, R.S. Human-associated Bacteroides spp. and human polyomaviruses as microbial source tracking markers in Hawaii. Appl. Environ. Microbiol. 2016, 82, 6757–6767. [Google Scholar] [CrossRef] [Green Version]
  168. Boehm, A.B.; Soller, J.A. Refined ambient water quality thresholds for human-associated fecal indicator HF183 for recreational waters with and without co-occurring gull fecal contamination. Microb. Risk Anal. 2020, 16, 100139. [Google Scholar] [CrossRef]
  169. Shanks, O.C.; Kelty, C.A.; Sivaganesan, M.; Varma, M.; Haugland, R.A. Quantitative PCR for genetic markers of human fecal pollution. Appl. Environ. Microbiol. 2009, 75, 5507–5513. [Google Scholar] [CrossRef] [Green Version]
  170. Toledo-Hernandez, C.; Ryu, H.; Gonzalez-Nieves, J.; Huertas, E.; Toranzos, G.A.; Santo Domingo, J.W. Tracking the primary sources of fecal pollution in a tropical watershed in a one-year study. Appl. Environ. Microbiol. 2013, 79, 1689–1696. [Google Scholar] [CrossRef] [PubMed] [Green Version]
  171. Zimmer-Faust, A.G.; Thulsiraj, V.; Marambio-Jones, C.; Cao, Y.; Griffith, J.F.; Holden, P.A.; Jay, J.A. Effect of freshwater sediment characteristics on the persistence of fecal indicator bacteria and genetic markers within a Southern California watershed. Water Res. 2017, 119, 1–11. [Google Scholar] [CrossRef] [PubMed] [Green Version]
  172. Stachler, E.; Kelty, C.; Sivaganesan, M.; Li, X.; Bibby, K.; Shanks, O.C. Quantitative CrAssphage PCR Assays for Human Fecal Pollution Measurement. Environ. Sci. Technol. 2017, 51, 9146–9154. [Google Scholar] [CrossRef] [PubMed]
  173. Okoh, A.I.; Sibanda, T.; Gusha, S.S. Inadequately treated wastewater as a source of human enteric viruses in the environment. Int. J. Environ. Res. Public Health 2010, 7, 2620–2637. [Google Scholar] [CrossRef] [Green Version]
  174. Liu, Y.; Gilchrist, A.; Zhang, J.; Li, X.F. Detection of viable but nonculturable Escherichia coli O157:H7 bacteria in drinking water and river water. Appl. Environ. Microbiol. 2008, 74, 1502–1507. [Google Scholar] [CrossRef] [PubMed] [Green Version]
  175. Kitajima, M.; Sassi, H.P.; Torrey, J.R. Pepper mild mottle virus as a water quality indicator. NPJ Clean Water 2018, 1, 19. [Google Scholar] [CrossRef] [Green Version]
  176. Dutilh, B.E.; Cassman, N.; McNair, K.; Sanchez, S.E.; Silva, G.G.; Boling, L.; Barr, J.J.; Speth, D.R.; Seguritan, V.; Aziz, R.K.; et al. A highly abundant bacteriophage discovered in the unknown sequences of human faecal metagenomes. Nat. Commun. 2014, 5, 4498. [Google Scholar] [CrossRef] [Green Version]
  177. McMinn, B.R.; Huff, E.M.; Rhodes, E.R.; Korajkic, A. Concentration and quantification of somatic and F+ coliphages from recreational waters. J. Virol. Methods 2017, 249, 58–65. [Google Scholar] [CrossRef]
  178. McMinn, B.R.; Rhodes, E.R.; Huff, E.M.; Korajkic, A. Decay of infectious adenovirus and coliphages in freshwater habitats is differentially affected by ambient sunlight and the presence of indigenous protozoa communities. Virol. J. 2020, 17, 1. [Google Scholar] [CrossRef]
  179. Tomat, D.; Balagué, C.; Casabonne, C.; Verdini, R.; Quiberoni, A. Resistance of foodborne pathogen coliphages to thermal and physicochemical treatments applied in food manufacture. Innov. Food Sci. Emerg. Technol. 2015, 30, 184–191. [Google Scholar] [CrossRef]
  180. Guan, D.; Kniel, K.; Calci, K.R.; Hicks, D.T.; Pivarnik, L.F.; Hoover, D.G. Response of four types of coliphages to high hydrostatic pressure. Food Microbiol. 2006, 23, 546–551. [Google Scholar] [CrossRef] [PubMed]
  181. Vergara, G.; Goh, S.; Rezaeinejad, S.; Chang, S.; Sobsey, M.; Gin, K. Evaluation of FRNA coliphages as indicators of human enteric viruses in a tropical urban freshwater catchment. Water Res. 2015, 79, 39–47. [Google Scholar] [CrossRef] [PubMed]
  182. Muniesa, M.; Mocé-Llivina, L.; Katayama, H.; Jofre, J. Bacterial host strains that support replication of somatic coliphages. Antonie Van Leeuwenhoek 2003, 83, 305–315. [Google Scholar] [CrossRef]
  183. U.S. Environmental Protection Agency. Male-Specific (F+) and Somatic Coliphage in Water by Two-Step Enrichment Procedure; U.S. Environmental Protection Agency: Wahington, DC, USA, 2001.
  184. U.S. Environmental Protection Agency. Method 1602: Male-Specific (F+) and Somatic Coliphage in Water by Single Agar Layer (SAL) Procedure; U.S. Environmental Protection Agency: Wahington, DC, USA, 2001.
  185. Muniesa, M.; Ballesté, E.; Imamovic, L.; Pascual-Benito, M.; Toribio-Avedillo, D.; Lucena, F.; Blanch, A.; Jofre, J. Bluephage: A rapid method for the detection of somatic coliphages used as indicators of fecal pollution in water. Water Res. 2018, 128, 10–19. [Google Scholar] [CrossRef]
  186. Mendez, J.; Toribio-Avedillo, D.; Mangas-Casas, R.; Martinez-Gonzalez, J. Bluephage, a method for efficient detection of somatic coliphages in one hundred milliliter water samples. Sci. Rep. 2020, 10, 2977. [Google Scholar] [CrossRef] [Green Version]
  187. Haramoto, E.; Yamada, K.; Nishida, K. Prevalence of protozoa, viruses, coliphages and indicator bacteria in groundwater and river water in the Kathmandu Valley, Nepal. Trans. R. Soc. Trop. Med. Hyg. 2011, 105, 711–716. [Google Scholar] [CrossRef]
  188. Lee, J.E.; Lee, H.; Cho, Y.H.; Hur, H.G.; Ko, G. F+ RNA coliphage-based microbial source tracking in water resources of South Korea. Sci. Total Environ. 2011, 412, 127–131. [Google Scholar] [CrossRef]
  189. Toribio-Avedillo, D.; Martin-Diaz, J.; Blanco-Picazo, P.; Blanch, A.R.; Muniesa, M. F-specific coliphage detection by the Bluephage method. Water Res. 2020, 184, 116215. [Google Scholar] [CrossRef]
  190. Agullo-Barcelo, M.; Galofre, B.; Sala, L.; Garcia-Aljaro, C.; Lucena, F.; Jofre, J. Simultaneous detection of somatic and F-specific coliphages in different settings by Escherichia coli strain CB390. FEMS Microbiol. Lett. 2016, 363. [Google Scholar] [CrossRef] [Green Version]
  191. Benjamin-Chung, J.; Arnold, B.F.; Wade, T.J.; Schiff, K.; Griffith, J.F.; Dufour, A.P.; Weisberg, S.B.; Colford, J.M., Jr. Coliphages and Gastrointestinal Illness in Recreational Waters: Pooled Analysis of Six Coastal Beach Cohorts. Epidemiology 2017, 28, 644–652. [Google Scholar] [CrossRef]
  192. Shkoporov, A.N.; Khokhlova, E.V.; Fitzgerald, C.B.; Stockdale, S.R.; Draper, L.A.; Ross, R.P.; Hill, C. ΦCrAss001 represents the most abundant bacteriophage family in the human gut and infects Bacteroides intestinalis. Nat. Commun. 2018, 9, 4781. [Google Scholar] [CrossRef] [Green Version]
  193. Edwards, R.A.; Vega, A.A.; Norman, H.M.; Ohaeri, M.; Levi, K.; Dinsdale, E.A.; Cinek, O.; Aziz, R.K.; McNair, K.; Barr, J.J.; et al. Global phylogeography and ancient evolution of the widespread human gut virus crAssphage. Nat. Microbiol. 2019, 4, 1727–1736. [Google Scholar] [CrossRef] [Green Version]
  194. Kongprajug, A.; Mongkolsuk, S.; Sirikanchana, K. CrAssphage as a potential human sewage marker for microbial source tracking in Southeast Asia. Environ. Sci. Technol. Lett. 2019, 6, 159–164. [Google Scholar] [CrossRef]
  195. Stachler, E.; Crank, K.; Bibby, K. Co-occurrence of crAssphage with antibiotic resistance genes in an impacted urban watershed. Environ. Sci. Technol. Lett. 2019, 6, 216–221. [Google Scholar] [CrossRef]
  196. Ahmed, W.; Payyappat, S.; Cassidy, M.; Besley, C. A duplex PCR assay for the simultaneous quantification of Bacteroides HF183 and crAssphage CPQ_056 marker genes in untreated sewage and stormwater. Environ. Int. 2019, 126, 252–259. [Google Scholar] [CrossRef] [PubMed]
  197. Stachler, E.; Akyon, B.; de Carvalho, N.A.; Ference, C.; Bibby, K. Correlation of crAssphage qPCR Markers with Culturable and Molecular Indicators of Human Fecal Pollution in an Impacted Urban Watershed. Environ. Sci. Technol. 2018, 52, 7505–7512. [Google Scholar] [CrossRef] [PubMed]
  198. Wu, Z.; Greaves, J.; Arp, L.; Stone, D.; Bibby, K. Comparative fate of CrAssphage with culturable and molecular fecal pollution indicators during activated sludge wastewater treatment. Environ. Int. 2020, 136, 105452. [Google Scholar] [CrossRef]
  199. Wolf, S.; Hewitt, J.; Greening, G.E. Viral multiplex quantitative PCR assays for tracking sources of fecal contamination. Appl. Environ. Microbiol. 2010, 76, 1388–1394. [Google Scholar] [CrossRef] [PubMed] [Green Version]
  200. McQuaig, S.M.; Scott, T.M.; Lukasik, J.O.; Paul, J.H.; Harwood, V.J. Quantification of human polyomaviruses JC virus and BK virus by TaqMan quantitative PCR and comparison to other water quality indicators in water and fecal samples. Appl. Environ. Microbiol. 2009, 75, 3379–3388. [Google Scholar] [CrossRef] [PubMed] [Green Version]
  201. Pal, A.; Sirota, L.; Maudru, T.; Peden, K.; Lewis, A.M., Jr. Real-time, quantitative PCR assays for the detection of virus-specific DNA in samples with mixed populations of polyomaviruses. J. Virol. Methods 2006, 135, 32–42. [Google Scholar] [CrossRef] [PubMed]
  202. Ahmed, W.; Zhang, Q.; Kozak, S.; Beale, D.; Gyawali, P.; Sadowsky, M.J.; Simpson, S. Comparative decay of sewage-associated marker genes in beach water and sediment in a subtropical region. Water Res. 2019, 149, 511–521. [Google Scholar] [CrossRef] [PubMed]
  203. Rowe, W.P.; Huebner, R.J.; Gilmore, L.K.; Parrott, R.H.; Ward, T.G. Isolation of a cytopathogenic agent from human adenoids undergoing spontaneous degeneration in tissue culture. Proc. Soc. Exp. Biol. Med. 1953, 84, 570–573. [Google Scholar] [CrossRef]
  204. Parks, R.J. Adenovirus protein IX: A new look at an old protein. Mol. Ther. 2005, 11, 19–25. [Google Scholar] [CrossRef]
  205. Matthews, D.A. Adenovirus protein V induces redistribution of nucleolin and B23 from nucleolus to cytoplasm. J. Virol. 2001, 75, 1031–1038. [Google Scholar] [CrossRef] [Green Version]
  206. Noble, R.T.; Allen, S.M.; Blackwood, A.D.; Chu, W.; Jiang, S.C.; Lovelace, G.L.; Sobsey, M.D.; Stewart, J.R.; Wait, D.A. Use of viral pathogens and indicators to differentiate between human and non-human fecal contamination in a microbial source tracking comparison study. J. Water Health 2003, 1, 195–207. [Google Scholar] [CrossRef] [Green Version]
  207. Hundesa, A.; De Motes, C.M.; Albinana-Gimenez, N.; Rodriguez-Manzano, J.; Bofill-Mas, S.; Sunen, E.; Girones, R.R. Development of a qPCR assay for the quantification of porcine adenoviruses as an MST tool for swine fecal contamination in the environment. J. Virol. Methods 2009, 158, 130–135. [Google Scholar] [CrossRef]
  208. Ogorzaly, L.; Bertrand, I.; Paris, M.; Maul, A.; Gantzer, C. Occurrence, survival, and persistence of human adenoviruses and F-specific RNA phages in raw groundwater. Appl. Environ. Microbiol. 2010, 76, 8019–8025. [Google Scholar] [CrossRef] [PubMed] [Green Version]
  209. Hewitt, J.; Greening, G.E.; Leonard, M.; Lewis, G.D. Evaluation of human adenovirus and human polyomavirus as indicators of human sewage contamination in the aquatic environment. Water Res. 2013, 47, 6750–6761. [Google Scholar] [CrossRef]
  210. Li, D.; He, M.; Jiang, S.C. Detection of infectious adenoviruses in environmental waters by fluorescence-activated cell sorting assay. Appl. Environ. Microbiol. 2010, 76, 1442–1448. [Google Scholar] [CrossRef] [Green Version]
  211. Gerba, C.P.; Gramos, D.M.; Nwachuku, N. Comparative inactivation of enteroviruses and adenovirus 2 by UV light. Appl. Environ. Microbiol. 2002, 68, 5167–5169. [Google Scholar] [CrossRef] [Green Version]
  212. Eischeid, A.C.; Thurston, J.A.; Linden, K.G. UV disinfection of adenovirus: Present state of the research and future directions. Crit. Rev. Environ. Sci. Technol. 2011, 41, 1375–1396. [Google Scholar] [CrossRef]
  213. Flint, S.J.; Enquist, L.W.; Racaniello, V.R.; Skalka, A.M. Principles of Virology: Molecular Biology, Pathogenesis, and Control; ASM Press: Washington, DC, USA, 2000. [Google Scholar]
  214. Sassoubre, L.M.; Love, D.C.; Silverman, A.I.; Nelson, K.L.; Boehm, A.B. Comparison of enterovirus and adenovirus concentration and enumeration methods in seawater from Southern California, USA and Baja Malibu, Mexico. J. Water Health 2012, 10, 419–430. [Google Scholar] [CrossRef] [PubMed] [Green Version]
  215. Lipp, E.K.; Lukasik, J.; Rose, J.B. Human enteric viruses and parasites in the marine environment. Methods Microbiol. 2001, 30, 559–588. [Google Scholar]
  216. Lachiewicz, A.; Cianciolo, R.; Miller, M.; Derebail, V. Adenovirus causing fever, upper respiratory infection, and allograft nephritis complicated by persistent asymptomatic viremia. Transpl. Infect. Dis. 2014, 16, 648–652. [Google Scholar] [CrossRef] [PubMed]
  217. Demoliner, M.; Gularte, J.S.; Girardi, V.; Eisen, A.K.A.; de Souza, F.G.; Staggemeier, R.; Henzel, A.; Spilki, F.R. Microbial Source Tracking in Small Farms: Use of Different Methods for Adenovirus Detection. Water Air Soil Pollut. 2021, 232, 63. [Google Scholar] [CrossRef]
  218. Schoch, C.L.; Ciufo, S.; Domrachev, M.; Hotton, C.L.; Kannan, S.; Khovanskaya, R.; Leipe, D.; Mcveigh, R.; O’Neill, K.; Robbertse, B. NCBI Taxonomy: A comprehensive update on curation, resources and tools. Database 2020, 2020, baaa062. [Google Scholar] [CrossRef] [PubMed]
  219. Padgett, B.; Zurhein, G.; Walker, D.; Eckroade, R.; Dessel, B. Cultivation of papova-like virus from human brain with progressive multifocal leucoencephalopathy. Lancet 1971, 297, 1257–1260. [Google Scholar] [CrossRef]
  220. Bofill-Mas, S.; Rusiñol, M.; Fernandez-Cassi, X.; Carratalà, A.; Hundesa, A.; Girones, R. Quantification of human and animal viruses to differentiate the origin of the fecal contamination present in environmental samples. BioMed Res. Int. 2013, 2013, 192089. [Google Scholar] [CrossRef]
  221. Bofill-Mas, S.; Pina, S.; Girones, R. Documenting the epidemiologic patterns of polyomaviruses in human populations by studying their presence in urban sewage. Appl. Environ. Microbiol. 2000, 66, 238–245. [Google Scholar] [CrossRef] [Green Version]
  222. McQuaig, S.; Griffith, J.; Harwood, V.J. Association of fecal indicator bacteria with human viruses and microbial source tracking markers at coastal beaches impacted by nonpoint source pollution. Appl. Environ. Microbiol. 2012, 78, 6423–6432. [Google Scholar] [CrossRef] [Green Version]
  223. Albinana-Gimenez, N.; Clemente-Casares, P.; Calgua, B.; Huguet, J.M.; Courtois, S.; Girones, R. Comparison of methods for concentrating human adenoviruses, polyomavirus JC and noroviruses in source waters and drinking water using quantitative PCR. J. Virol. Methods 2009, 158, 104–109. [Google Scholar] [CrossRef]
  224. Bofill-Mas, S.; Albinana-Gimenez, N.; Clemente-Casares, P.; Hundesa, A.; Rodriguez-Manzano, J.; Allard, A.; Calvo, M.; Girones, R. Quantification and stability of human adenoviruses and polyomavirus JCPyV in wastewater matrices. Appl. Environ. Microbiol. 2006, 72, 7894–7896. [Google Scholar] [CrossRef] [PubMed] [Green Version]
  225. Templeton, M.R.; Andrews, R.C.; Hofmann, R. Particle-associated viruses in water: Impacts on disinfection processes. Crit. Rev. Environ. Sci. Technol. 2008, 38, 137–164. [Google Scholar] [CrossRef] [Green Version]
  226. Haramoto, E.; Katayama, H. Application of acidic elution to virus concentration using electropositive filters. Food Environ. Virol. 2013, 5, 77–80. [Google Scholar] [CrossRef]
  227. Ahmed, W.; Harwood, V.; Gyawali, P.; Sidhu, J.P.; Toze, S. Comparison of concentration methods for quantitative detection of sewage-associated viral markers in environmental waters. Appl. Environ. Microbiol. 2015, 81, 2042–2049. [Google Scholar] [CrossRef] [Green Version]
  228. Calgua, B.; Barardi, C.R.M.; Bofill-Mas, S.; Rodriguez-Manzano, J.; Girones, R. Detection and quantitation of infectious human adenoviruses and JC polyomaviruses in water by immunofluorescence assay. J. Virol. Methods 2011, 171, 1–7. [Google Scholar] [CrossRef]
  229. Wong, M.V.; Hashsham, S.A.; Gulari, E.; Rouillard, J.-M.; Aw, T.G.; Rose, J.B. Detection and characterization of human pathogenic viruses circulating in community wastewater using multi target microarrays and polymerase chain reaction. J. Water Health 2013, 11, 659–670. [Google Scholar] [CrossRef] [PubMed]
  230. Hewitt, J.; Leonard, M.; Greening, G.E.; Lewis, G.D. Influence of wastewater treatment process and the population size on human virus profiles in wastewater. Water Res. 2011, 45, 6267–6276. [Google Scholar] [CrossRef] [PubMed]
  231. Carini, P.; Marsden, P.J.; Leff, J.W.; Morgan, E.E.; Strickland, M.S.; Fierer, N. Relic DNA is abundant in soil and obscures estimates of soil microbial diversity. Nat. Microbiol. 2016, 2, 16242. [Google Scholar] [CrossRef]
  232. Wang, H.; Koydemir, H.C.; Qiu, Y.; Bai, B.; Zhang, Y.; Jin, Y.; Tok, S.; Yilmaz, E.C.; Gumustekin, E.; Rivenson, Y. Early detection and classification of live bacteria using time-lapse coherent imaging and deep learning. Light Sci. Appl. 2020, 9, 118. [Google Scholar] [CrossRef]
  233. Højris, B.; Christensen, S.C.B.; Albrechtsen, H.-J.; Smith, C.; Dahlqvist, M. A novel, optical, on-line bacteria sensor for monitoring drinking water quality. Sci. Rep. 2016, 6, 23935. [Google Scholar] [CrossRef] [PubMed] [Green Version]
  234. Simões, J.; Yang, Z.; Dong, T. An ultrasensitive fluorimetric sensor for pre-screening of water microbial contamination risk. Spectrochim. Acta Part A Mol. Biomol. Spectrosc. 2021, 258, 119805. [Google Scholar] [CrossRef] [PubMed]
  235. Guo, T.; Wei, Y.; Xu, C.; Watts, B.R.; Zhang, Z.; Fang, Q.; Zhang, H.; Selvaganapathy, P.R.; Deen, M.J. Counting of Escherichia coli by a microflow cytometer based on a photonic–microfluidic integrated device. Electrophoresis 2015, 36, 298–304. [Google Scholar] [CrossRef] [PubMed]
Figure 1. Relationship between the use of selected microbial markers, potential monitoring sites, and diagnostic information by process operators and regulators. Use of these biological markers can facilitate actionable remedial measures by public health officials.
Processes 09 02058 g001
Figure 2. Relationships of coliforms and Escherichia coli.
Processes 09 02058 g002
Table 1. Examples of outbreaks of waterborne and foodborne diseases from 2011 to 2021.
Leading PathogenDiseasesYearCountryNo. of CasesCitation
Salmonella spp.Salmonellosis2010China324[18]
Salmonellosis2010USA695[19]
Gastroenteritis2013USA634[20]
CryptosporidiumCryptosporidiosis2010Canada12[21]
Cryptosporidiosis2011Australia1141[22]
Shigella sonneiShigellosis2012China134[23]
Shigellosis2012Turkey4239[24]
E. coli O157:H7Diarrhea/Vomiting2012Canada5[25]
Diarrhea/Vomiting2012Japan115[26]
CampylobacterCampylobacteriosis2016UK69[27]
Campylobacteriosis2016New Zelaland967[28]
Hepatitis A virusHepatitis A2016USA292[29]
Jaundice2016India233[30]
Rotavirus G2PGastroenteritis2017Germany32[16]
Rotavirus G3PGastroenteritis2017Australia2319[31]
AdenovirusRespiratory illness2018USA168[32]
Fever2019China27[33]
NorovirusDiarrhea/Vomiting2018South Korea199[34]
Gastroenteritis2020Brazil176[35]
Table 2. Host-specific 16S rDNA fragments of Bacteroides spp. used to discriminate fecal pollution from human and animal hosts.
HostPrimer SetSequence (5′ → 3′) Citation
HumanHF183F/Bac708RF: ATCATGAGTTCACATGTCCG[157]
R: CAATCGGAGTTCTTCGTG
HF134F/HF654RF: GCCGTCTACTCTTGGCC[157]
R: CCTGCCTCTACTGTACTC
HuBac566F/HuBac 692RF: GGGTTTAAAGGGAGCGTAGG[158]
R: CTACACCACGAATTCCGCCT
BacHF/BacHRF: CTTGGCCAGCCTTCTGAAAG[159]
R: CCCCATCGTCTACCGAAAATAC
CattleCF128F/Bac708RF: CCAACYTTCCCGWTACTC[157]
R: See above
CS406F/Bac581RF: GAAGGATGAAGGTTCTATGGATTGT[160]
R: CGCTCCCTTTAAACCCAATAAA
CS621F/Bac725RF: AACCACAGCCCGCGATT[160]
R: CAATCGGAGTTCTTCGTGATATCTA
SwineBac41F/PS183RF: TACAGGCTTAACACATGCAAGTCG[160]
R: CTCATACGGTATTAATCCGCCTTT
PigBac1F/PigBac1RF: CGGGTTGTAAACTGCTTTTATGAAG[160]
R: CGCTCCCTTTAAACCCAATAAA
PF163F/Bac708RF: GCGGATTAATACCGTATGA[161]
R: See above
DogBacCan-545F/Bac725RF: GGAGCGCAGACGGGTTTT[155]
R: See above
ChickenC160F-HU/Bac265R-HUF: AAGGGAGATTAATACCCGATGATG[156]
R: CCGTTACCCCGCCTACTAC
DuckBac366F-HU/Duck474R-HUF: TTGGTCAATGGGCGGAAG[156]
R: GCACATTCCCACACGTGAGA
Table 3. Available primers for qPCR detection of crAssphage, HAdV and HPyV.
Target VirusqPCR AssayPrimer or Probe Sequence (5′ → 3′)Target GeneCitation
CrAssphageCPQ_056F: CAGAAGTACAAACTCCTAAAAAACGTAGAGPredicted
coding region
[172]
R: GATGACCAATAAACAAGCCATTAGC
Probe: [FAM]-AATAACGATTTACGTGATGTAAC-[MGB]
CPQ_064F: TGTATAGATGCTGCTGCAACTGTACTCPredicted
coding region
[172]
R: CGTTGTTTTCATCTTTATCTTGTCCAT
Probe: [FAM]-CTGAAATTGTTCATAAGCAA-[MGB]
HAdVVTB-1-HAdVFF: GCCTGGGGAACAAGTTCAGAHexon[199]
R: GCGTAAAGCGCACTTTGTAAG
Probe: [Quasar]-CAGTCGCTGYGACCTGTCTGTGGTT-[BHQ2]
VTB-2-HAdVCF: GAGACGTACTTCAGCCTGAATHexon[199]
R: GATGAACCGCAGCGTCAA
Probe: [FAM]-CCTACGCACGACGTGACCACAGA-[BHQ1]
HPyVBKPyV and JCPyVSM2: AGTCTTTAGGGTCTTCTACCTTTConserved
T-antigen
[200]
P6: GGTGCCAACCTATGGAACAG
KGJ3 probe: [FAM]-TCATCACTGGCAAACAT-[MGB]
HPyV-2F: ATGTTTGCCAGTGATGATGAAAAJVGP5[201]
R: GGAAAGTCTTTAGGGTCTTCTACCTTT
Probe: [FAM]-AGGATCCCAACACTCTACCCCACCTAAAAAGA-[MGB]
Publisher’s Note: MDPI stays neutral with regard to jurisdictional claims in published maps and institutional affiliations.

