Article

Influence of MAP on the Postharvest Quality of Glehnia littoralis Fr. Schmidt ex Miq.

Postharvest Technology Division, National Institute of Horticultural and Herbal Science, Rural Development Administration, Wanju 55365, Korea
*
Authors to whom correspondence should be addressed.
Processes 2021, 9(11), 2052; https://doi.org/10.3390/pr9112052
Submission received: 30 September 2021 / Revised: 11 November 2021 / Accepted: 14 November 2021 / Published: 16 November 2021
(This article belongs to the Special Issue Method Optimization of Various Food Processing Technologies)

Abstract

:
In Korea, to prevent the extinction of Glehnia littoralis, a cultivation method to improve productivity is being studied and quality maintenance technology is required after harvest. The objective of this study was to determine the effect of MAP on the postharvest quality of G. littoralis. The control showed a weight loss rate of more than 5% after 3 days of storage and lost its marketability, whereas MAP treatment (PE or MPE) showed a weight loss rate of about 2–3% during storage for more than 30 days. In the control, MDA and electrolyte leakage increased due to chilling injury. The total chlorophyll content was low and remained constant until about 23 days of storage in the PE treatment group and 15 days in the MPE treatment group. Among the phenolic compounds, chlorogenic acid, rutin, isoquercetin, and nicotiflorin were maintained at significantly higher levels in the PE than in the MPE. In addition, bergapten showed a highly significant upward trend in the MPE, especially after 25 days of storage when the yellowing progressed. In conclusion, MAP treatment effectively maintains quality while minimizing lipid peroxidation and maintaining phenolic compounds during low-temperature storage after harvest of G. littoralis.

1. Introduction

Horticultural crops are a major source of nutrients such as carbohydrates, proteins, organic acids, and vitamins. However, as they go through each stage, such as selection, transportation, and storage, after harvest, their loss rate increases due to various reasons including moisture loss, vibration, physical damage caused by crushing, and pathogenic diseases caused by certain infectious microorganisms [1,2]. Appropriate postharvest treatment can minimize the water loss and decrease the nutrients used as respiratory substrates by reduced respiration [3,4]. Moisture loss due to transpiration and evaporation is the most critical factor impairing the postharvest quality [5]. Water loss during crop storage results in wilting, which is directly related to the decrease in levels of antioxidant compounds such as ascorbic acid and carotene in Kale [6]. It also causes the generation of excessive active oxygen species (AOS). Representative AOS occurring in plant tissues are singlet oxygen, superoxide, hydrogen peroxide, and hydroxyl radicals [7,8].
The most effective way to reduce water loss in horticultural crops after harvest is to create an atmosphere with high humidity through a modified atmosphere package (MAP) [1,4,5]. By MAP treatment, high CO2 and low O2 conditions are created around fruits and vegetables inside the packaging. Under these atmospheric conditions, spoilage, respiration rate, ethylene production, enzymatic activity, etc., can be controlled, and, consequently, the quality of horticultural crops is maintained after harvest [4,9]. Low temperature storage with MAP treatment is effective in reducing postharvest loss while maintaining the postharvest quality of leafy vegetables and reducing mold growth because the MAP treatment creates an atmosphere suitable for leafy vegetables [10]. However, unsuitable atmosphere conditions such as high carbon dioxide and ethylene accumulation cause deterioration of the postharvest quality [11]. Baby leafy treated with MAP at 8 °C with 20,000 cm3 OTR film maintained leafy vegetable quality with high antioxidant activity and low odor generation [12]. MAP treatment maintained carotene and sugars in netted muskmelon and was effective in both preventing non-enzymatic browning and maintaining membrane integrity [13].
Beach silvertop (Glehnia littoralis Fr. Schmidt ex Miq.) belonging to the Apiaceae family is a medicinal plant found in Korea. G. littoralis is designated as an endangered and protected species in South Korea. G. littoralis mainly inhabits sandy soils containing salinity on the seashore and is losing habitat due to rapid coastal development. Efforts to restore the spontaneous land of G. littoralis, due to reckless damage, to spontaneous land were made in the East Coast of Korea and in Hokkaido in Japan [14]. At the same time, research on vegetative propagation and seed propagation technology was conducted in Korea to prevent the extinction of G. littoralis [15]. As a result, many farmers grow G. littoralis in the open field and greenhouses; the above-ground parts are sold in supermarkets like ordinary vegetables; and its roots are used as medicine [15,16]. In Korea, processed products have also been developed and used as G. littoralis rice wine and bath products. G. littoralis has high antifungal activity, anti-obesity properties, and contains various antioxidants such as quercetin, isoquercetin, rutin, chlorogenic acid, caffeic acid, imperatorin, and bergapten [17,18,19].
According to a study by Hong et al. [17], it was reported that the extraction of G. littoralis can effectively act in the treatment of obesity by inhibiting adipocyte differentiation and intracellular lipid accumulation by downregulating the expression of adipogenic genes. Phenolic compounds are the main secondary metabolites of horticultural crops and have various health-promoting characteristics, such as preventing the accumulation of active oxygen and lipid peroxidation [20,21]. The Apiaceae family, such as G. littoralis, contains various phytochemicals and is reported to have high antioxidant activity [22]. Among the Apiaceae family, celery and parsley are representative aromatic plants, and their flavonoid components have antiradical properties and are significant substances regulating various disorders [22,23]. These flavonoids and polyphenols act to protect the membrane by binding to the phospholipids of the cell membrane [23].
Although the quality of the above-ground part of G. littoralis, used as a leafy vegetable, is easily deteriorated due to weight loss as a result of moisture loss during distribution, no the postharvest quality control technology has been reported.
In this study, the effect of MAP for the postharvest quality maintenance and shelf-life extension of the above-ground parts of G. littoralis was determined and changes in major physico–chemical properties following MAP treatment were also investigated.

2. Materials and Methods

2.1. Plant Material and Treatment

The above-ground parts (leaves and stem) of G. littoralis grown for 24 days from a 3-year-old root were harvested from a farmhouse in Gangneung, Gangwon-do. About 70 g of fresh G. littoralis was MAP-treated using polyethylene film (0.03 mm thickness; length, 0.25 m; and width, 0.25 m). MAP treatment was classified into micro-perforated PE (MPE, 32 pinholes) and PE based on the presence or absence of pinholes, respectively. Bags containing leaves were sealed and stored at 4 ± 0.5 °C (90–95% RH). The control was packaged in paper boxes (length, 0.25 m; width, 0.25 m; and height, 0.05 m) and stored under the same conditions. The quality was investigated by complete random sampling of three bags for the treatment group at intervals of 5 days and the control at 3 days. However, the control, which was not treated with MAP, was stored for 7 days and MAP-treated groups were stored for 37 days. In the control, which was not treated with MAP, the water loss rate increased by more than 20% in 7 days, thus no further quality investigation and analysis tests were conducted.

2.2. Weight Loss and Color Characteristics

The weight change rate during the storage period was expressed as a percentage of decrease from the initial weight. Changes in the leaf color of G. littoralis were measured using a CR-400 colorimeter (Minolta, Osaka, Japan). Color parameters were CIE L*, a*, b*, chroma, and hue angles. Here, CIE L* represents lightness (0 = black; 100 = white), a* represents redness (+)—greenness (−), and b* represents yellowness (+)—blueness (−). CIE a* and b* were converted to hue angle (H° = tan − 1 (b/a)) and chroma (C = (a2 + b2)1/2) to represent color (0° = red-purple; 90° = yellow; 180° = bluish-green; and 270° = blue) and intensity, respectively.

2.3. Total Chlorophyll Content

The total chlorophyll content was determined using a UV/VIS spectrophotometer (Specord 40, Analytik Jena, Jena, German) with some modifications to the previously published method of Wonglom et al. [24]. One gram of fresh G. littoralis and 20 mL of 80% acetone were homogenized with IKA T 18 (IKA T 18 digital ULTRA-TURRAX, IKA Works GmbH & Co. KG, Staufen, Germany) at a speed of 5000 rpm for 3 min and extracted overnight at 4 °C in the dark. The total chlorophyll content was calculated by the following equation.
Chlorophyll a (mg/L) = 12.7 A663 − 2.69 A645
Chlorophyll b (mg/L) = 22.9 A645 − 4.68 A663
Total chlorophyll (mg/L) = 20.31 A645 + 8.05 A663
where A = absorbance at specific wavelength. The total chlorophyll content was converted to mg/g fresh weight.

2.4. Electrolyte Leakage

The degree of chilling injury during storage was confirmed by measuring electrolyte leakage using an electrical conductivity meter [25,26]. A leaf sample of 200 mg from 10 leaves was cut into pieces of 5 mm length, put into 30 mL of distilled deionized water, and incubated while being agitated at a speed of 500 rpm. The electrolyte content of the solution was measured after 1 min (C1) and 3 h (C2) during incubation at room temperature. After that, the samples were autoclaved at 125 °C for 25 min to kill the cells of the tissue and all the electrolytes in the solution were eluted as well as cooled at 25 °C to measure the final electrical conductivity (EC2). The results were expressed as a percentage of electrolyte leakage.
%EL = [(C2 − C1)/EC2] × 100

2.5. Malondialdehyde Content

The degree of lipid peroxidation was confirmed by measuring the malondialdehyde (MDA) content. MDA is a decomposition product of polyunsaturated fatty acids and is measured using the thiobarbituric acid (TBA) reaction [27,28]. About 1 g of the fresh sample was homogenized in 10 mL of ice-cold 0.1% trichloroacetic acid and centrifuged for 10 min (4 °C, 1822× g). One mL of the supernatant was taken and mixed with 4 mL of 0.25% TBA in 10% trichloroacetic acid. After incubation at 95 °C for 15 min, the mixture was rapidly cooled and centrifuged for 10 min (4 °C, 1822× g). The absorbance of the supernatant was measured using a spectrophotometer, calculated by the following equation, and converted to μmol/kg fresh weight.
MDA content (μmol/kg) = [(A532 − A600) × DF]/(ε × 103)
where:
  • ε (molar extinction coefficient): 155 mM−1 cm−1 for MDA; and
  • DF: dilution factor.

2.6. HPLC Analysis of the Phenolic Compounds

G. littoralis sampled over the storage period was freeze-dried and ground into a fine powder using mortar and pestle. A 0.1 g of the powdered sample was extracted using 1 mL of 70% ethanol at 30 °C for 12 h. The mixture was centrifuged (15,000× g, 4 °C) for 20 min and the supernatant was collected. The phenolic composition was determined using ethanol extract. The phenolic compounds were analyzed by a Prominence HPLC system (Shimadzu, Kyoto, Japan) equipped with a diode array UV-vis detector for monitoring at 280 nm and 330 nm. Each component was separated using a C18 column (250 × 4.6 mm, 5 μm, Shimadzu, Kyoto, Japan). Binary gradient elution was performed with solvent A (3 mL of distilled water with 0.1% formic acid) and solvent B (acetonitrile with 0.1% formic acid), which were delivered at a flow rate of 0.7 mL/min as follows: 0 min, 12% B; 20 min, 30% B; 50 min, 80% B; 53 min, 80% B; 54 min, 88% B; and 60 min, 88% B. The injection volume was 10 μL and the column temperature was maintained at 40 °C. Among the phenolic compounds, caffeic acid, vanillic acid, ferulic acid, bergapten, and imperatorin were detected at 280 nm for qualitative and quantitative detection, and chlorogenic acid, rutin, isoquercetin, nicotiflorin, quercetin, and kaempferol were detected at 330 nm. The phenolic compounds were quantified in the ethanolic extracts using an external standard calibration in the linear range of 6.25–100 mg/L.

2.7. Statistical Analysis

The experiment was performed using a completely randomized batch method and all analyses were performed in triplicates. Data is expressed as mean ± standard deviation. Statistical analyses were performed using SAS ANOVA (version 7.1). The significance of each measurement was determined using Fisher’s least significant difference (LSD) test at a significance level of p < 0.05.

3. Results and Discussion

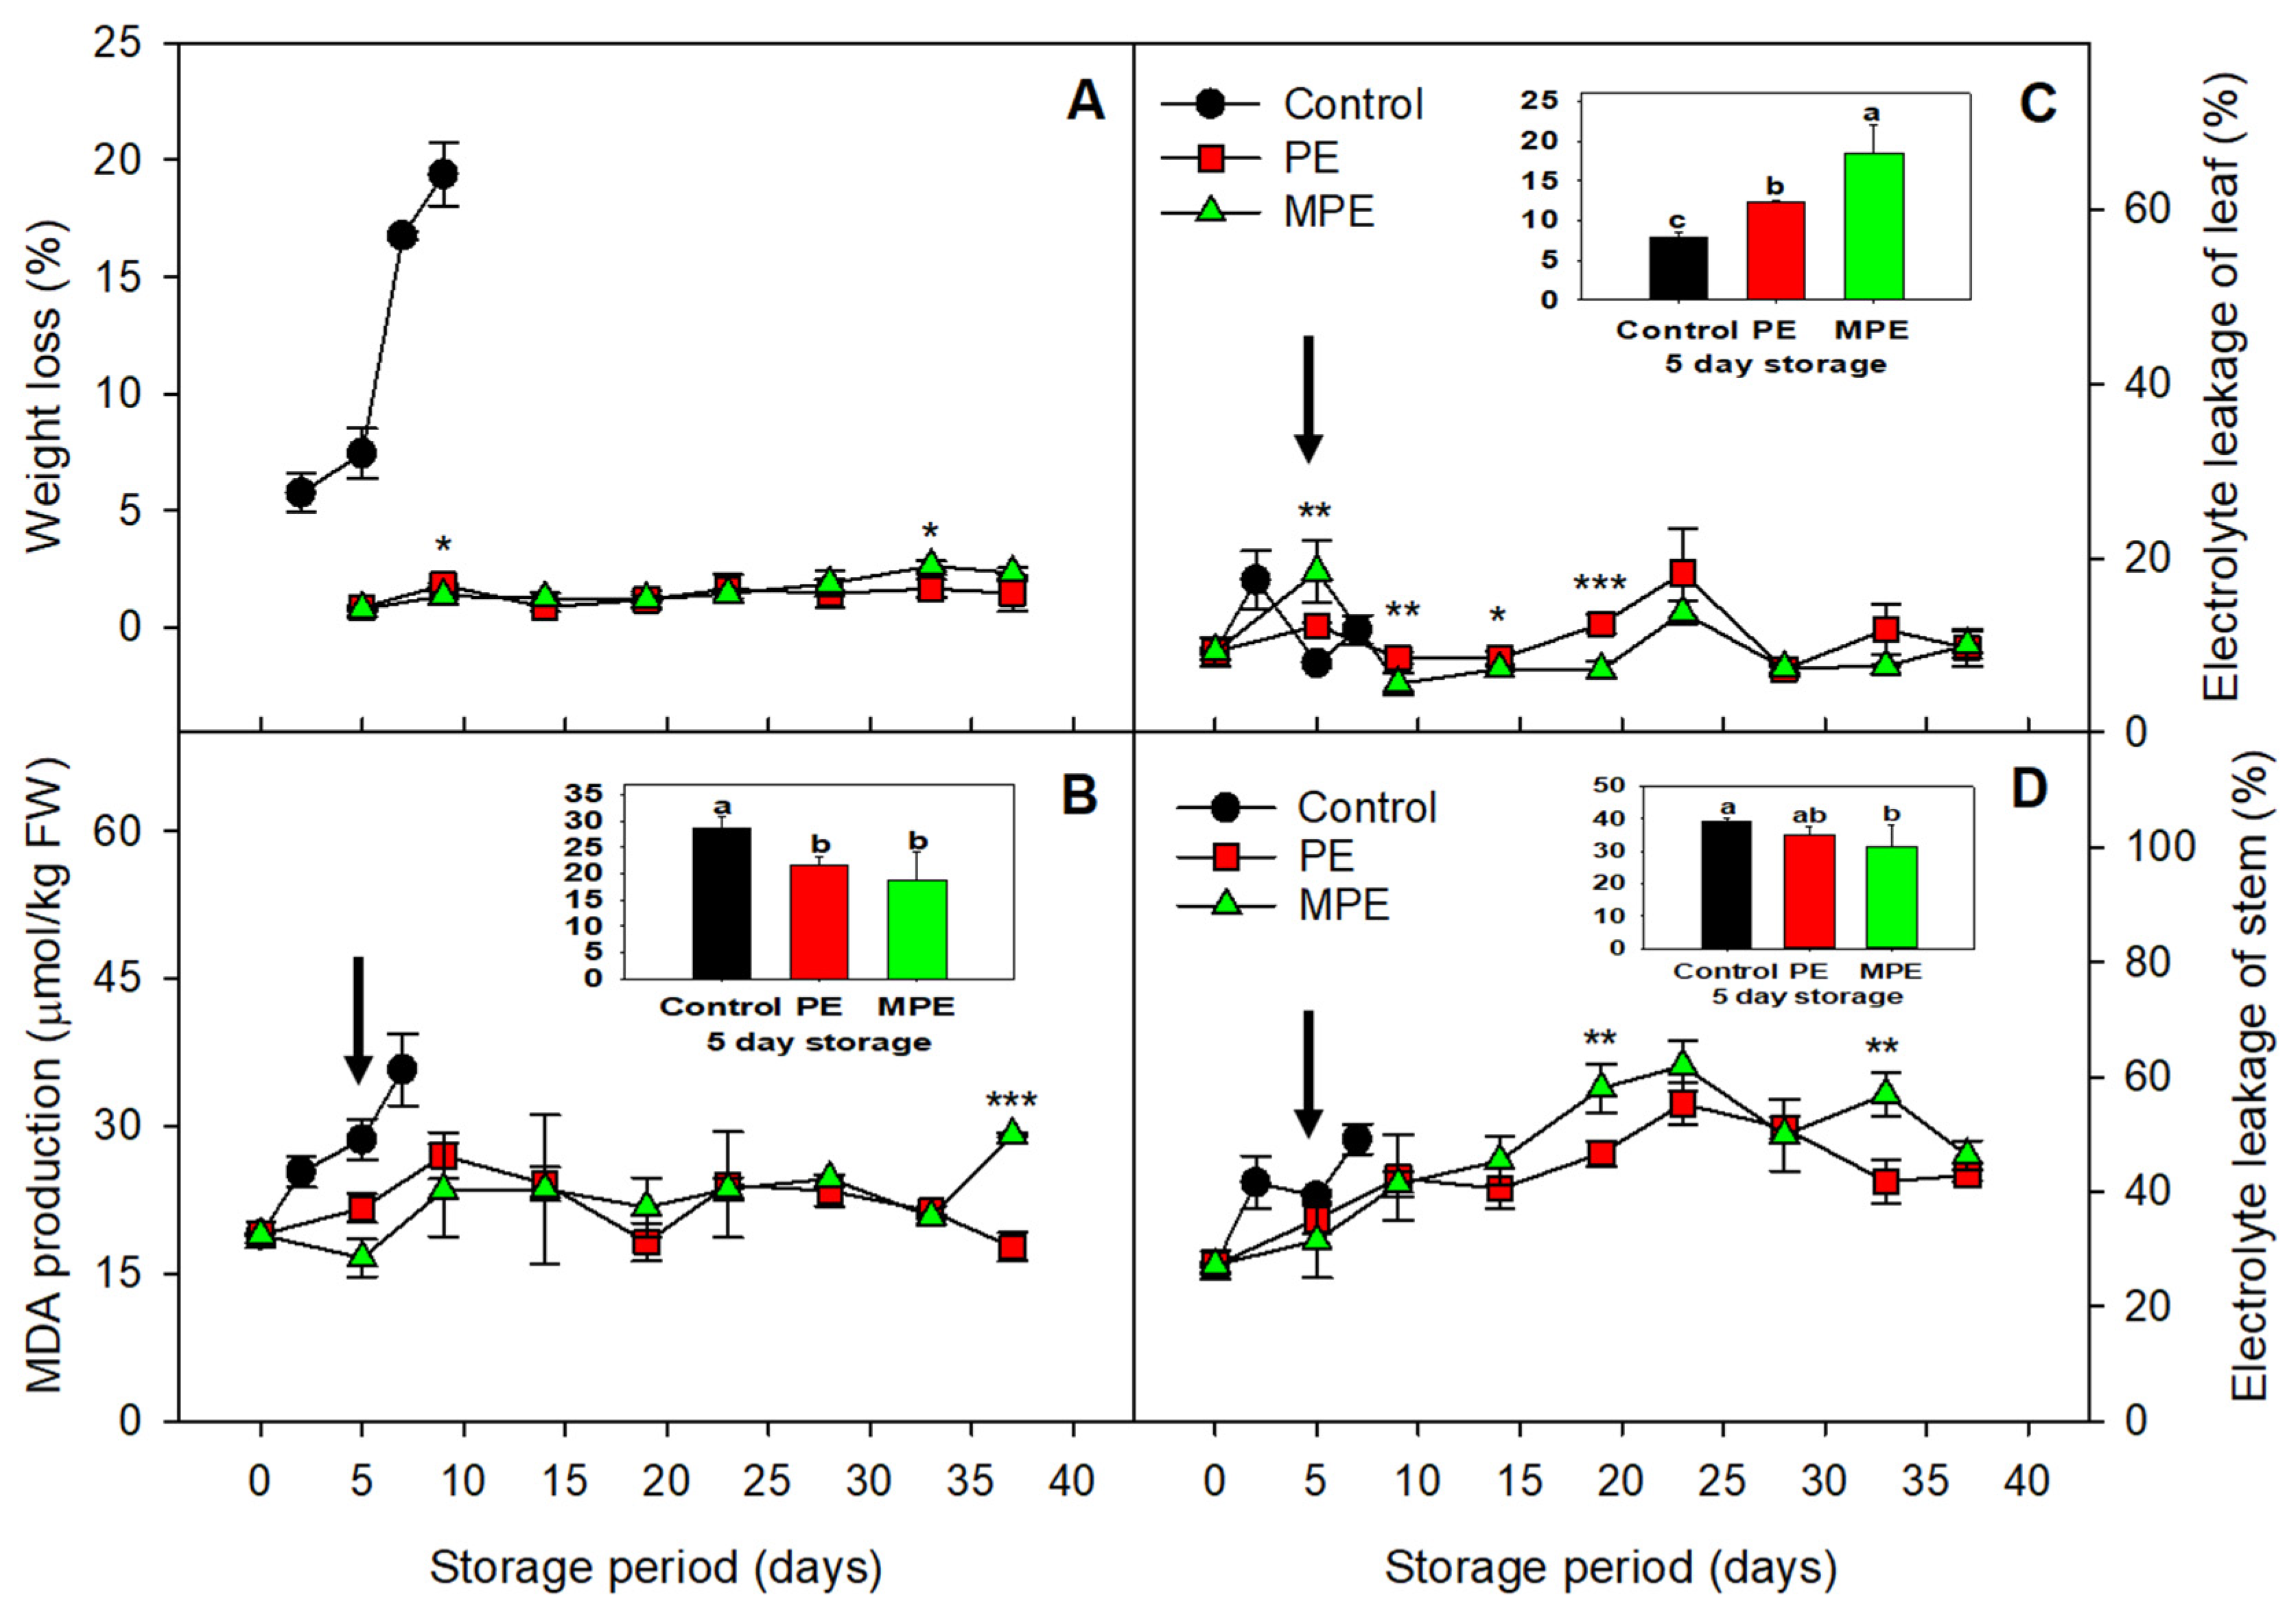
3.1. Changes in Weight Loss, MDA, and Electrolyte Leakage

In order to extend the shelf life of G. littoralis, the quality of MAP-treated G. littoralis was checked during storage. MAP treatment (PE or MPE) was found to be effective in reducing the weight loss rate of G. littoralis during storage, as the water loss rate was around 2–3% (Figure 1A). In addition, the control showed a weight loss rate of 5% or more after 3 days of storage and lost its marketability. In G. littoralis treated with MAP, especially after 28 days of storage, the weight loss rate showed a more significant (p < 0.05) increase in the MPE treatment group compared to the PE treatment group. The quality was thus maintained. In general, the marketability of most fruits and vegetables is lost when the water loss rate is about 5–10% of the initial weight, resulting in quality loss due to wilting [29,30]. MAP treatment reduces transpiration by providing a barrier against airflow around the fruit which is the diffusion of water from the peel to the surrounding area in the form of water vapor [9,30]. In addition, the change in the air composition inside the package by MAP treatment is effective in reducing water loss by suppressing the transpiration and minimizing the respiration rate in fruits and vegetables [30].
Since the MAP-treated G. littoralis were stored at a low temperature of 4 °C for a long time, there is a possibility that it may suffer from chilling injury. The occurrence of chilling injury can be determined by the degree of damage to the cell membrane. In order to check the integrity of the cell membrane, changes in MDA content and electrolyte leakage were checked during storage. In the control, MDA production increased sharply after 3 days of storage, showed a maximum at 8 days of storage, and then decreased. In contrast, the MAP treatment group did not show a significant difference (p < 0.05) between the PE and MPE treatments, and there was a high MDA increase in the MPE treatment group after 37 days of storage (Figure 1B). MDA is a secondary metabolite produced by the oxidation of polyunsaturated fatty acids and is an indicator of the lipid peroxidation caused by abiotic stress [31]. The intensity of lipid peroxidation varies according to the degree of exposure to low temperatures. An increase in MDA means that the cell membrane is under oxidative stress from free radicals such as AOS [32]. In the case of bananas, when exposed to a low temperature of 8 °C, the production of MDA was high, whereas when stored at 25 °C, the amount of MDA production was significantly lower and the difference increased with time [31]. In the control, the trend of increasing MDA was similar to that of the increasing water loss rate. It is believed that MDA increases due to the oxidative stress caused by water loss. Hodges et al. [33] reported that water loss leads to a decrease in antioxidants. In kale and cabbage, the amount of ascorbic acid decreased due to water loss and the content of carotene also had decreased in kale [33]. Water loss in crops caused large amounts of hydrogen peroxide production but high-humidity MAP treatment inhibited the development of AOS while maintaining the ascorbic acid and total carotene content in the fruit, as well as its membrane integrity [34]. Additionally, one of the symptoms of chilling injury is water loss. When cucumbers were stored at 0, 5, and 10°C, the water loss and EL content was higher at 5 °C when compared to 0 and 10 °C [35].
In G. littoralis, where both leaves and stems are used, electrolyte leakage observations of the leaves and stems were analyzed separately for chilling injury (Figure 1C,D). In G. littoralis, electrolyte leakage was higher in the stem than in the leaves. The leaves of G. littoralis have many wax layers and a thick mesophyll, whereas the stem does not. It is considered that this morphological difference induced the difference in the electrolyte leakage. The leaf EL in the control increased on the third day but decreased after 5 days of storage and was relatively high in the MPE treatment, and there was no clear trend at the beginning of the storage. However, stem EL showed a steady increase. In particular, the MPE treatment after 15 days of storage showed a higher EL than the PE treatment group. Lipid peroxidation caused by loss of cell membrane integrity has a negative effect on electrolyte leakage [25]. The generation of MDA, an indicator of lipid peroxidation, exacerbates cell membrane damage and, consequently, electrolyte leakage. An increased MDA can reflect the degree of cell membrane damage that occurs in response to various stresses [36]. It seems that the stress response of the control when exposed to low temperature causes electrolyte leakage and an increase in the levels of MDA.

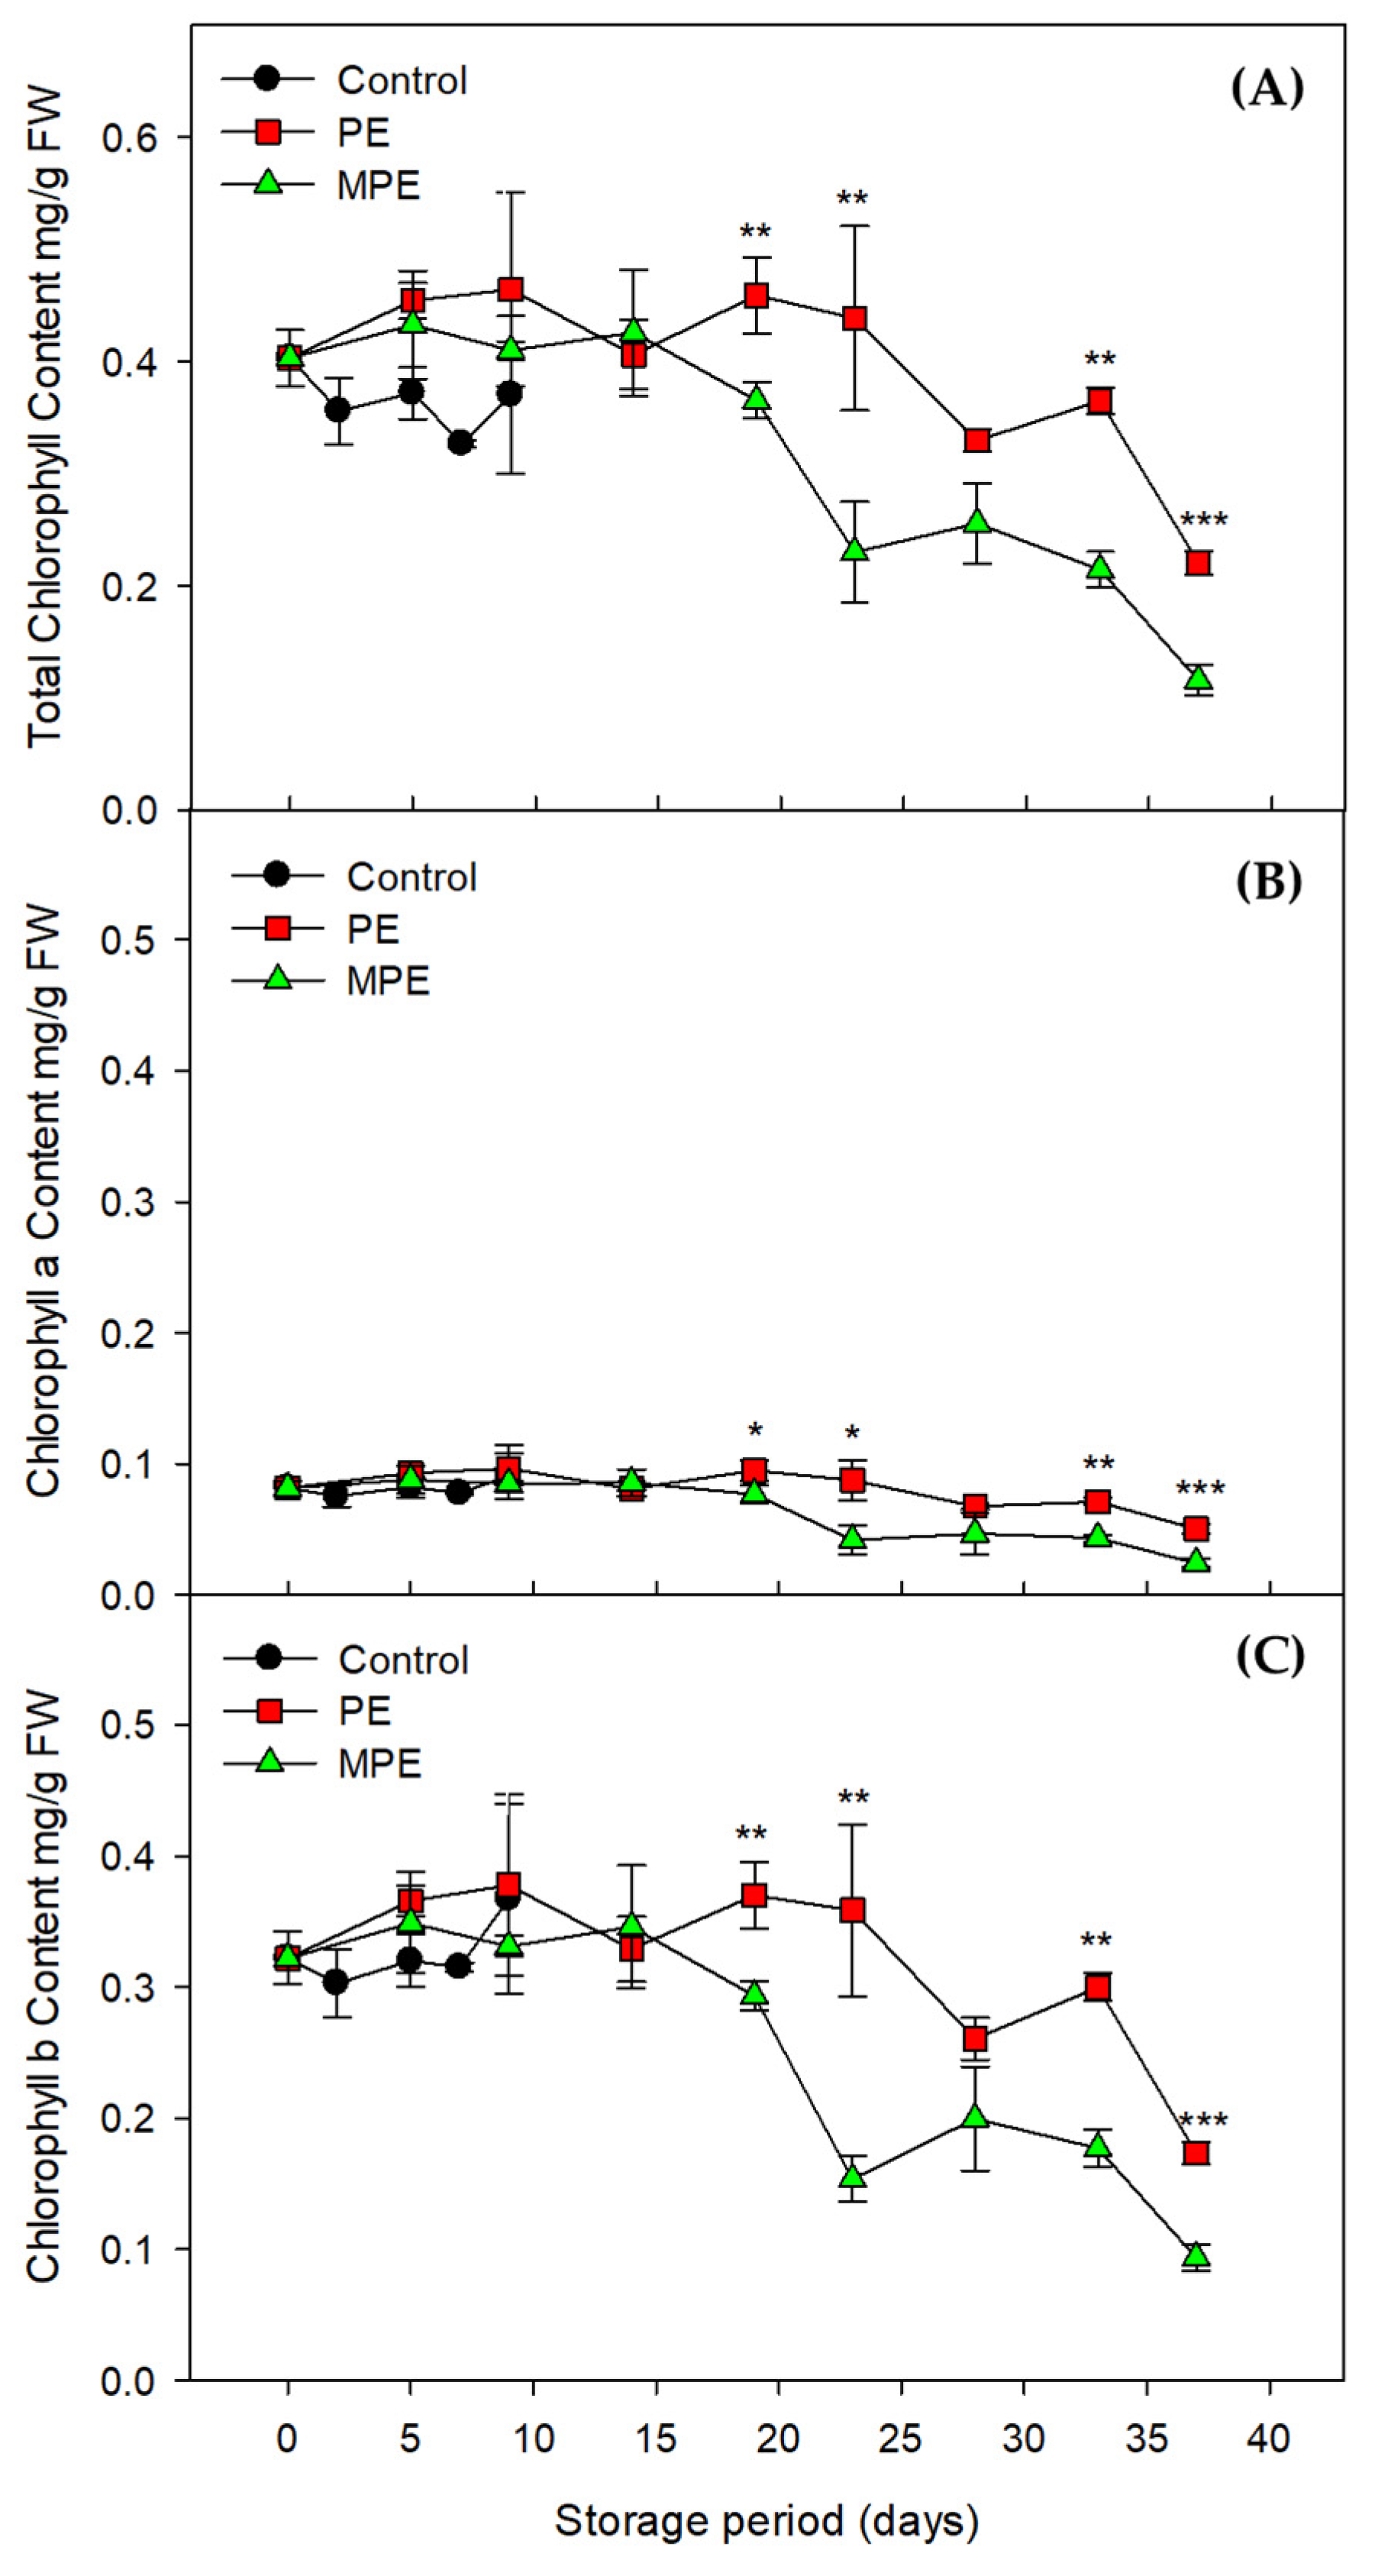
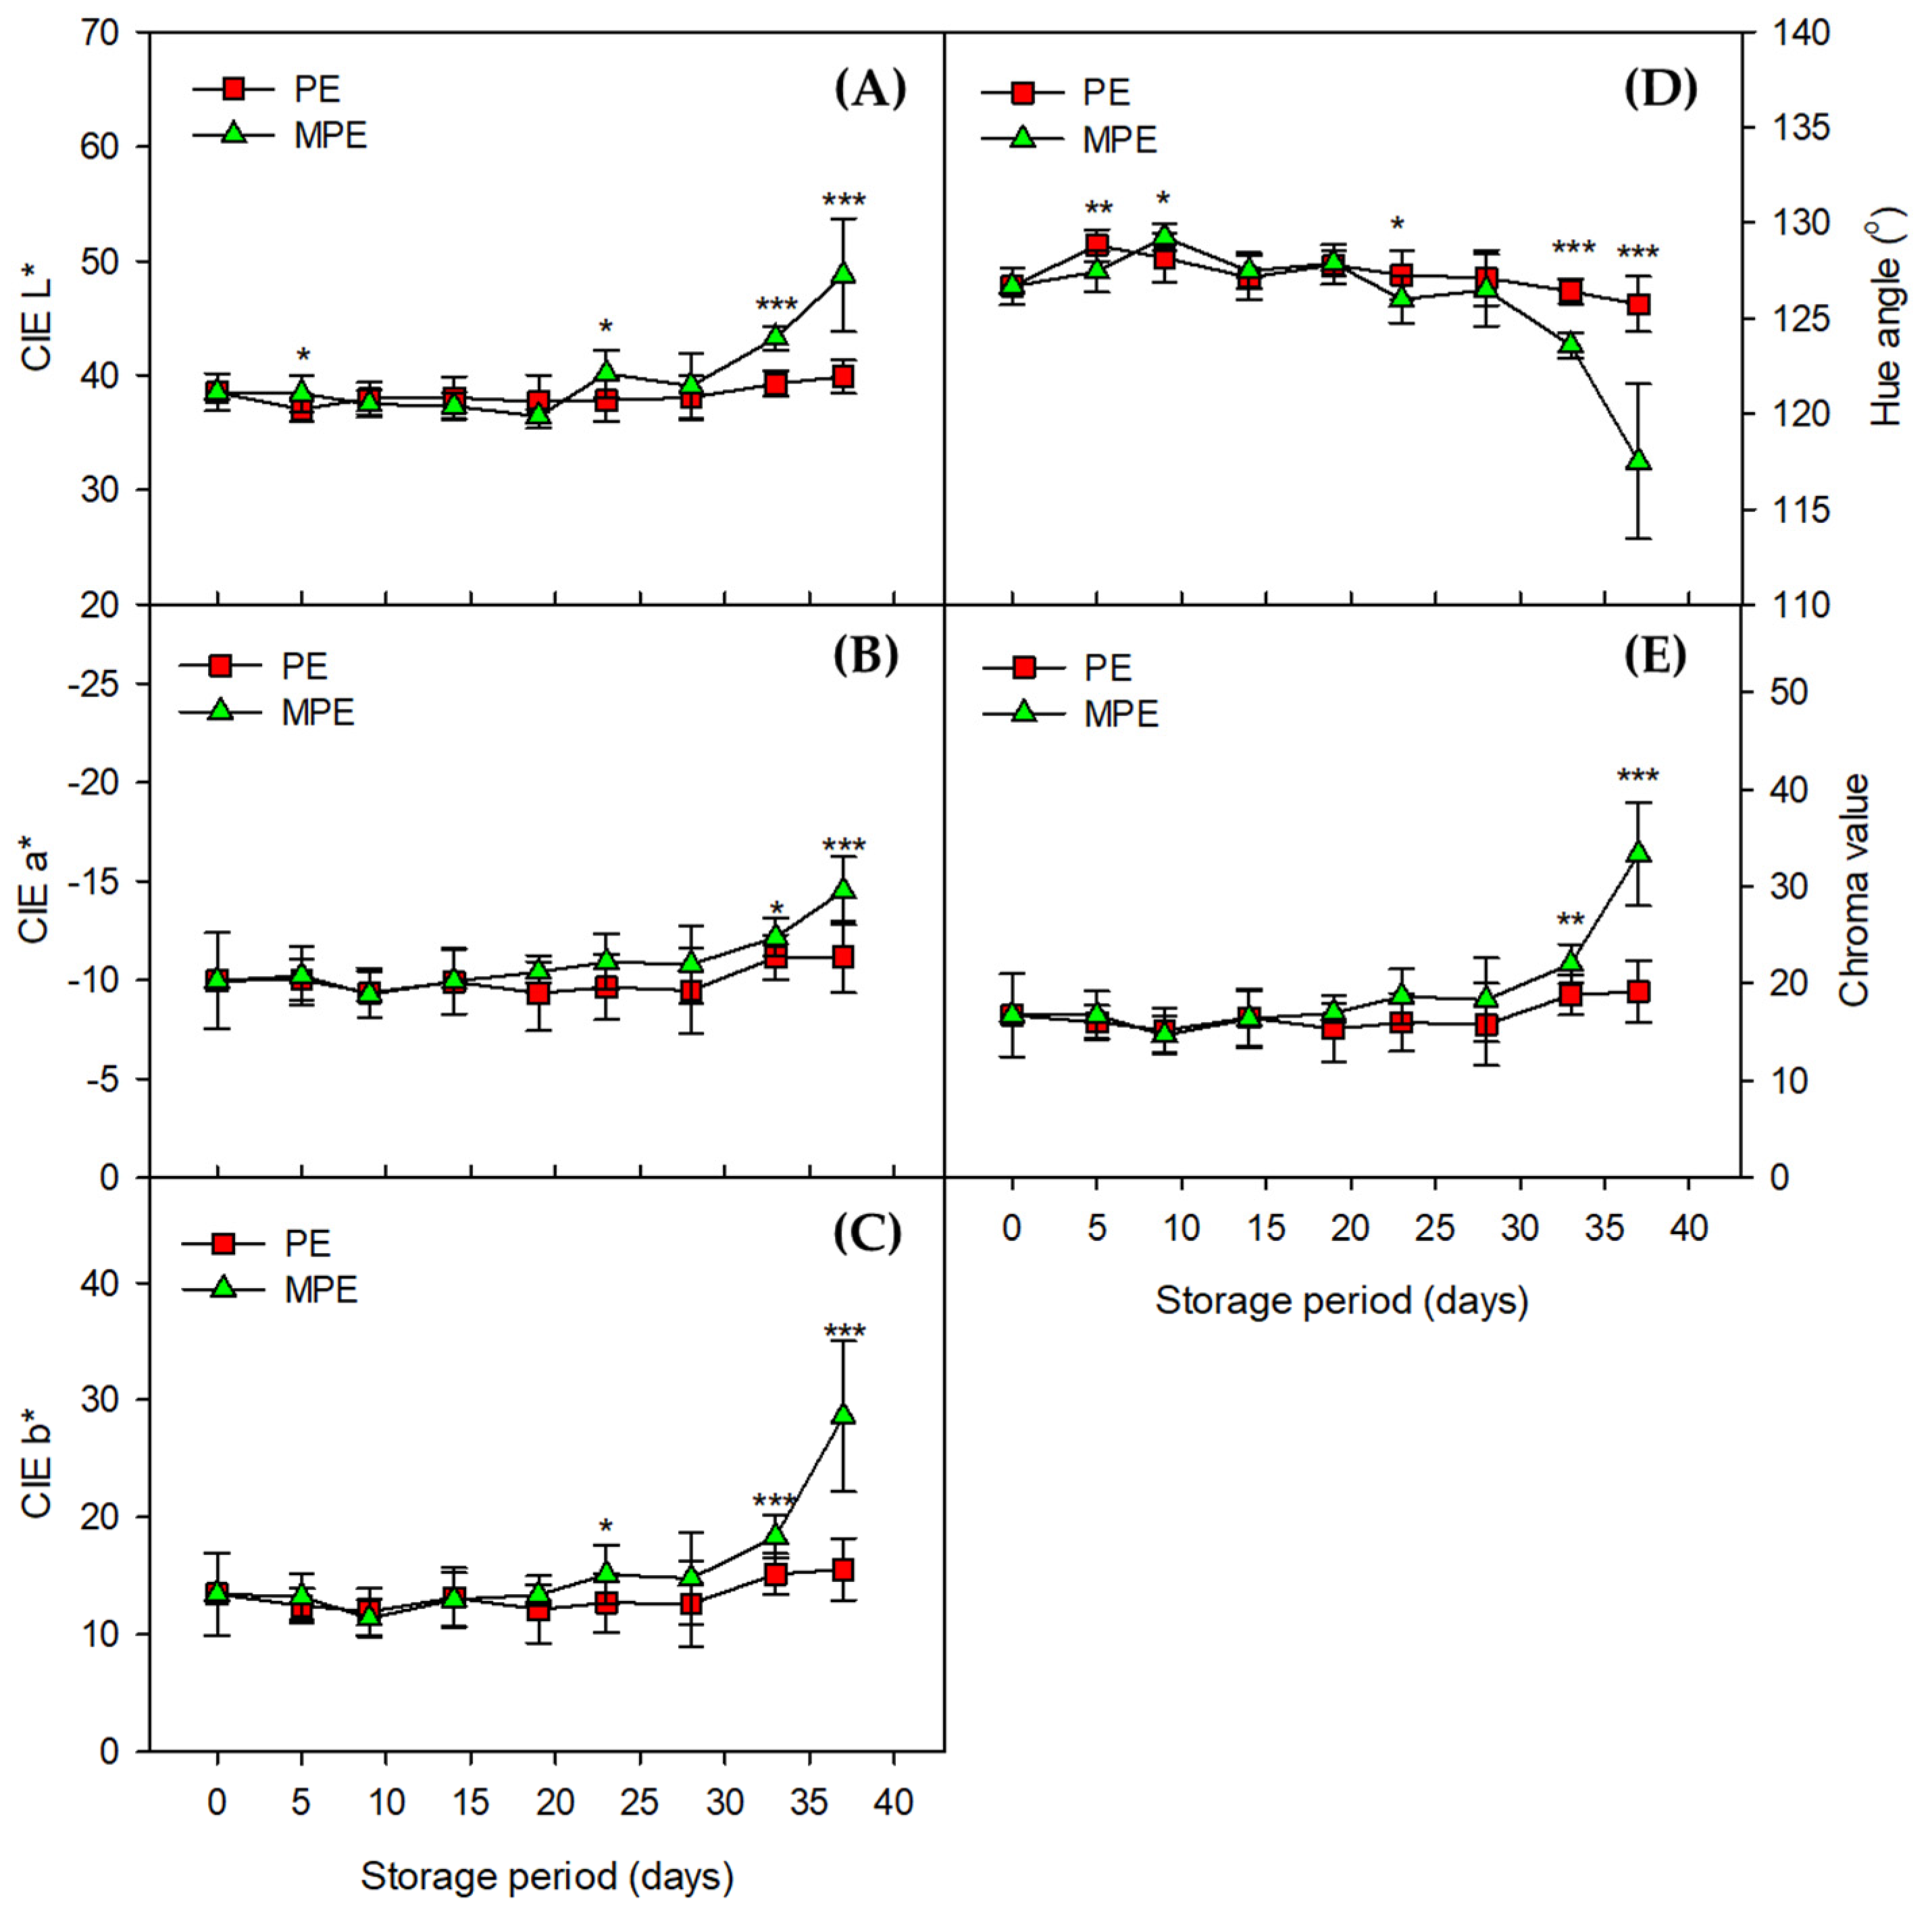
3.2. Changes in Total Chlorophyll Content and Color Values

G. littoralis, a leafy vegetable, undergoes yellowing by decomposition of chlorophyll during storage. The total chlorophyll content was the lowest in the control but remained high in the MAP treatment group for a certain period (Figure 2A). In the PE treatment group, the initial chlorophyll content was maintained until the 23rd day of storage, whereas in the MPE treatment group, it was maintained until around the 15th day of storage, but showed a sharp decrease thereafter (p < 0.05). A similar trend was observed in chlorophyll a and chlorophyll b (Figure 2B,C). The time point at which the total chlorophyll content decreased in the MPE treatment coincided with the time at which the stem electrolyte leakage increased (Figure 1D and Figure 2A).
In addition, during the storage of G. littoralis treated with MAP, a decrease in the total chlorophyll content and a changing pattern of the leaf color was observed. CIE L* showed a highly significant difference (p < 0.001) between PE and MPE treatment after 30 days of storage and the time point at which CIE b* increased coincided with the time point at which the total chlorophyll content decreased (Figure 3A,C). The hue angle representing the color of the PE treatment was maintained at approximately 125° (green color) during storage, while that of the MPE treatment was completely yellow due to a decrease in the total chlorophyll content after 37 days of storage. Thus, the intensity of the color increased (Figure 3D,E). Yellowing caused by the destruction of chlorophyll in leafy vegetables is one of the aging processes and the appearance of yellowing means that aging has already begun. This yellowing phenomenon can be controlled by storage conditions [37,38]. Moisture stress, temperature, and the occurrence of ethylene in the initial stage of the decomposition of chlorophyll accelerate the yellowing phenomenon [39].

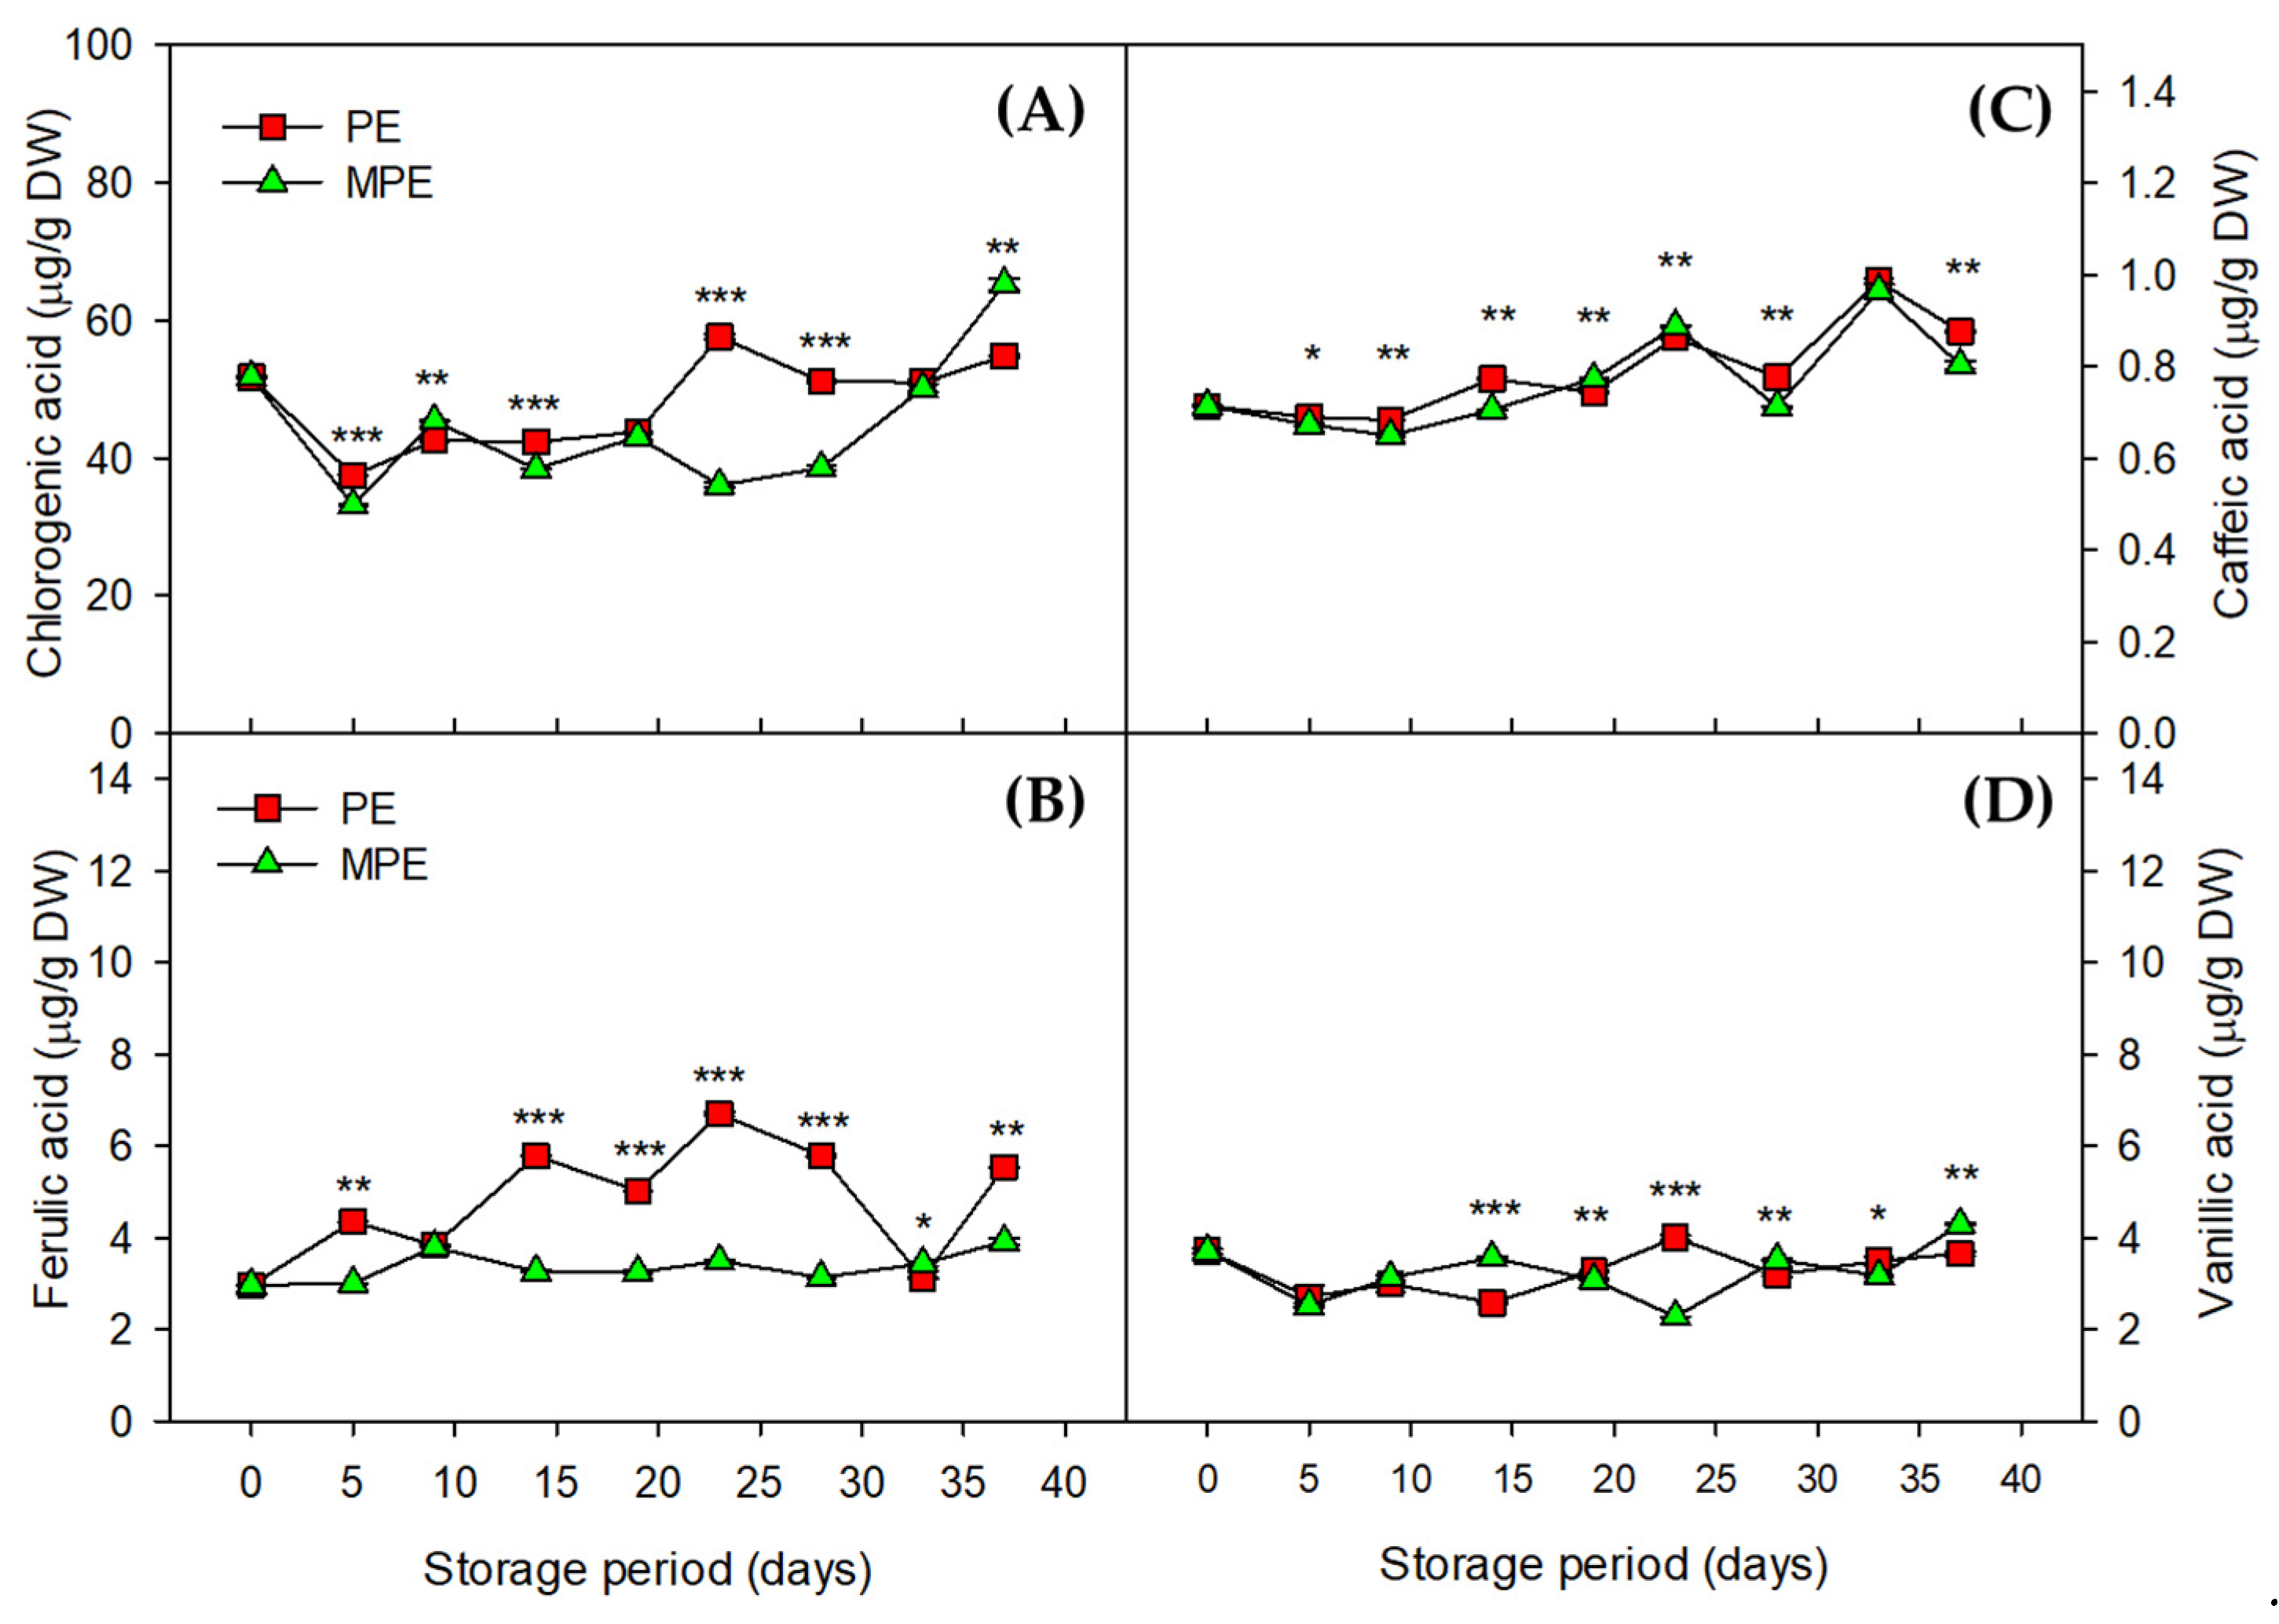
3.3. Changes in Phenolic Compounds

Polyphenols, including phenolic acids, flavonoids, coumarin, stilbene, and tannin, are essential antioxidants in horticultural crops [7]. Polyphenols contain aromatic rings with -OH or -OCH3 substituents. They inhibit AOS and prevent lipid peroxidation by binding to lipid alkoxyl radicals [7]. The content of phenolic compounds in G. littoralis was investigated in the MAP treatment group only for the control, as it had a short storage period due to water loss. Various types of polyphenols exist in G. littoralis (Figure 4). The phenolic acid present in G. littoralis has three types of hydroxycinnamic acid groups, namely ferulic acid, caffeic acid, and chlorogenic acid, and one type of a hydroxybenzoic acid group, namely vanillic acid. The main phenolic acid of G. littoralis was chlorogenic acid, followed by ferulic acid, vanillic acid, and caffeic acid. Chlorogenic acid was maintained at a higher amount in the PE treatment group than in the MPE treatment group depending on the storage period (Figure 5). Chlorogenic acid is produced from the esterification of caffeic acid and quinic acid, and is a major hydroxycinnamic acid derivative, which acts as an antidiabetic and anti-inflammatory agent [20].
Another type of polyphenol with high antioxidant capacity is flavonoids, which are also present in large amounts in G. littoralis. The main flavonoids of G. littoralis are rutin, isoquercetin, nicotiflorin, quercetin, and kaempferol (Figure 6). During storage of MAP-treated G. littoralis, the flavonoids that were significantly (p < 0.01) high in the PE treatment group were rutin, isoquercetin, and nicotiflorin. These three types of flavonoids accounted for more than 80% of the total flavonoids. The main flavonoid in G. littoralis is rutin, which is also the most abundant polyphenol present in it. Flavonoids are widely present in fruits and vegetables, and are effective against various diseases such as cancer and cardiovascular diseases [40]. In particular, the product of rutin, which is abundantly present in the above-ground part of G. littoralis, is dependent on light. White asparagus grown in low levels of light have a low rutin content [41]. The dark green leaves of G. littoralis have exceptionally high rutin levels, which remains constant during storage (Figure 6A). According to a study by Przeor et al. [42], it is reported that rutin and chlorogenic acid have antidiabetic effects. Chlorogenic acid has the effect of reducing glucose absorption by lowering glycogenolysis and rutin has the effect of both preventing cancer and inhibiting peroxidation of LDL cholesterol. This effect was increased by conditioning a polish variety of white mulberry (Morus alba L., Folium Mori) at 32–35 °C for 1–4 h.
Coumarins such as imperatorin and bergapten are the kinds of polyphenols present in G. littoralis. The levels of imperatorin were about three times higher than bergapten. While bergapten showed a highly significant and steady upward trend in the MPE treatment group, imperatorin showed no particular trend while repeating the increase and decrease in both the PE and MPE treatment groups, and its value at the end of the storage period was same as the initial value (Figure 7). It has been reported that bergapten is effective against leukemia, hepatitis, and skin tumors as it has high anti-inflammatory activity. In plants, it shows a rapid increase when under stress conditions such as bacterial infection or drying [37,43,44]. Additionally, in this study, the bergapten of the MPE treatment group was maintained at a higher amount during storage compared to the PE treatment group and showed an increasing pattern in the MPE treatment group from around 15 days of storage, but showed a sharp increase after 25 days of storage particularly when the yellowing phenomenon progressed (Figure 2A and Figure 7A).
As a result of analyzing polyphenols such as phenolic acids, flavonoids, and coumarins of G. littoralis, the PE treatment group showed higher levels polyphenols than the MPE treatment group. Polyphenols were maintained at a high amount by PE film treatment as it minimizes the lipid peroxidation of G. littoralis stored for a long time when at low temperatures. In addition, when G. littoralis was MAP-treated and stored, the PE and MPE treatment had little effect on the quality of G. littoralis during a short-term storage of 15 days but PE treatment was more effective when stored for more than 15 days.

4. Conclusions

MAP treatment was effective on G. littoralis stored at 4 °C for a long-term period. The control showed a weight loss rate of 5% or more after 3 days of storage and lost its marketability, whereas the MAP treatment groups showed a weight loss rate of about 2–3% during the storage period of 30 days or more. In the control group, MDA and electrolyte leakage, which are indicators of lipid peroxidation, increased due to chilling injury from 3 days after exposure to low temperatures. The total chlorophyll content was also low in the control but remained high in the MAP treatment groups for a certain period. In particular, the PE treatment maintained the initial chlorophyll content until the 23rd day of storage, whereas the MPE treatment maintained the chlorophyll content until about the 15th day of storage, but showed a sharp decrease thereafter. The main phenolic acid of G. littoralis was chlorogenic acid and was maintained at a higher amount in the PE treatment group than in the MPE treatment group depending on the storage period. The important flavonoids, including rutin, isoquercetin, and nicotiflorin, were also significantly higher in the PE treatment group. Among the coumarin components, bergapten showed a significant increase in the MPE treatment group, especially after 25 days of storage when yellowing progressed. Polyphenol levels maintained at a high amount by PE treatment could minimize the lipid peroxidation of G. littoralis stored for a long time at low temperatures and PE treatment without micro-perforation is practical for long-term storage periods of more than 15 days.

Author Contributions

Conceptualization, H.-L.E. and M.-S.C.; methodology, M.-H.C.; formal analysis, H.-L.E. and M.-H.C.; investigation, M.-H.P. and J.-S.L.; writing—original draft preparation, H.-L.E.; writing—review and editing, H.-L.E. and M.-S.C. All authors have read and agreed to the published version of the manuscript.

Funding

This study was funded by the RDA project (project number PJ01502901) of the Rural Development Administration of the Republic of Korea.

Institutional Review Board Statement

Not applicable.

Informed Consent Statement

Not applicable.

Data Availability Statement

Not applicable.

Acknowledgments

This study was supported by 2021 RDA Fellowship Program of the National Institute of Horticultural and Herbal Science, Rural Development Administration, Republic of Korea.

Conflicts of Interest

The authors declare no conflict of interest.

References

  1. Babich, O.; Dyshlyuk, L.; Sukhikh, S.; Prosekov, A.; Ivanova, S.; Pavsky, V.; Chaplygina, T.; Kriger, O. Effects of biopreservatives combined with modified atmosphere packaging on the quality of apples and tomatoes. Pol. J. Food Nutr. Sci. 2019, 69, 289–296. [Google Scholar] [CrossRef]
  2. Kader, A.A. Postharvest Technology of Horticultural Crops, 3rd ed.; University of California, Agriculture and Natural Resources: Los Angeles, CA, USA, 2002. [Google Scholar]
  3. Hong, S.J.; Yeoung, Y.R.; Eum, H.L. Phytochemical composition of everbearing strawberries and storage quality of strawberry fruit treated by precooling. Food Sci. Biotechnol. 2018, 27, 1675–1683. [Google Scholar] [CrossRef] [PubMed]
  4. Sahoo, N.R.; Panda, M.K.; Bal, L.M.; Pal, U.S.; Sahoo, D. Comparative study of MAP and shrink wrap packaging techniques for shelf life extension of fresh guava. Sci. Hortic. 2015, 182, 1–7. [Google Scholar] [CrossRef]
  5. Rai, D.R.; Paul, S. Packaging requirements of highly respiring produce under modified atmosphere packaging: A review. J. Food Sci. Technol. 2007, 44, 10–15. [Google Scholar]
  6. Toivonen, P.M.A. Effects of storage conditions and postharvest procedures on oxidative stress in fruits and vegetables. In Postharvest Oxidative Stress in Horticultural Crops; Hodges, D.M., Ed.; Food Products Press: New York, NY, USA, 2003; pp. 69–90. [Google Scholar]
  7. Meitha, K.; Pramestim, Y.; Suhandono, S. Reactive oxygen species and antioxidants in postharvest vegetables and fruits. Int. J. Food Sci. 2020, 2020, 8817778. [Google Scholar] [CrossRef]
  8. Yan, J.Q.; Wang, J.; Tissue, D.; Holiday, A.S.; Allen, R.; Zhang, H. Photosynthesis and seed production under water-deficit condition in transgenic tobacco plants that over-express an Arabidopsis ascorbate peroxidase gene. Crop Sci. 2003, 43, 1477–1483. [Google Scholar] [CrossRef]
  9. Selcuk, N.; Erkan, M. Changes in antioxidant activity and postharvest quality of sweet pomegranates cv. Hicrannar under modified atmosphere packaging. Postharvest Biol. Technol. 2014, 92, 29–36. [Google Scholar] [CrossRef]
  10. Kader, A.A.; Zagory, D.; Kerbel, E.L. Modified atmosphere packaging of fruits and vegetables. Crit. Rev. Food Sci. Nutr. 1989, 28, 1–30. [Google Scholar] [CrossRef]
  11. Islam, M.Z.; Mele, M.A.; Lee, H.J.; Lee, K.S.; Hong, S.M.; Jeong, M.J.; Kim, I.-S.; Hong, S.-K.; Choi, I.-L.; Kang, H.M. Selection of non-perforated breathable film to enhance storability of cherry tomato for modified atmosphere storage at different temperatures. J. Bio-Environ. Control 2014, 23, 116–122. [Google Scholar] [CrossRef]
  12. Islam, M.Z.; Lee, Y.T.; Mele, M.A.; Choi, I.-L.; Jang, D.C.; Ko, Y.W.; Kim, Y.D.; Kang, H.M. Effect of modified atmosphere packaging on quality and shelf life of baby leaf lettuce. Qual. Assur. Saf. Crop. Foods 2019, 11, 749–756. [Google Scholar] [CrossRef]
  13. Lester, G.E. Oxidative stress affecting fruit senescence. In Postharvest Oxidative Stress in Horticultural Crops; Hodges, D.M., Ed.; Food Products Press: New York, NY, USA, 2003; pp. 113–129. [Google Scholar]
  14. Kwon, S.M.; Jeong, H.W.; Lee, H.R.; Jo, H.G.; Hwang, H.S.; Hwang, S.J. Growth and bioactive compound contents of Glehnia littoralis Fr. Schmidt ex Miquel as affected by different NaCl concentrations and treatment timing on nutrient solution of hydroponic system. J. Bio-Environ. Control 2021, 30, 101–109. [Google Scholar] [CrossRef]
  15. Lee, B.K.; Han, M.S.; Jung, Y.K.; Rha, E.S.; Yun, S.J.; Yoo, N.H. Comparative effect of plant growth regulators on callus induction and plant regeneration in Glehnia littoralis Schmidt et Miquel. Korean J. Plant Res. 2004, 17, 153–160. [Google Scholar]
  16. Jang, J.H.; Shin, H.I.; Park, J.S. Analysis of growth and functional substance for Cyperus rotundus and Glehnia littoralis by EC treatment in reclaimed soil conditions. J. Bio-Environ. Control 2019, 28, 411–419. [Google Scholar] [CrossRef]
  17. Hong, H.; dela Cruz, J.F.; Kim, W.S.; Yoo, K.; Hwang, S.G. Glehnia littoralis root extract inhibits fat accumulation in 3T3-L1 cells and high-fat diet-induced obese mice by down regulating adipogenic gene expression. Evid. Based Complement. Altern. Med. 2018, 2018, 1243049. [Google Scholar] [CrossRef] [Green Version]
  18. McCutcheon, A.R.; Ellis, S.M.; Hancock, R.E.W.; Towers, G.H.N. Antifungal screening of medicinal plants of British Columbian native peoples. J. Ethnopharmacol. 1994, 44, 157–169. [Google Scholar] [CrossRef]
  19. Yuan, Z.; Tezuka, Y.; Fan, W.; Kadota, S.; Li, X. Constituents of the underground parts of Glehnia littoralis. Chem. Pharm. Bull. 2002, 50, 73–77. [Google Scholar] [CrossRef] [PubMed] [Green Version]
  20. Dias, M.I.; Sousa, M.J.; Alves, R.C.; Ferreira, I.C.F.R. Exploring plant tissue culture to improve the production of phenolic compounds: A review. Ind. Crop Prod. 2016, 82, 9–12. [Google Scholar] [CrossRef] [Green Version]
  21. González-Romero, J.; Arranz-Arranz, S.; Verardo, V.; García-Villanova, B.; Guerra-Hernández, E.J. Bioactive compounds and antioxidant capacity of Moringa leaves grown in Spain versus 28 leaves commonly consumed in pre-packaged salads. Processes 2020, 8, 1297. [Google Scholar] [CrossRef]
  22. Derouich, M.; Bouhlali, E.D.T.; Bammou, M.; Hmidani, A.; Sellam, K.; Alem, C. Bioactive compounds and antioxidant, antiperoxidative, andantihemolytic properties investigation of three Apiaceae species grown in the southeast of Morocco. Scientifica 2020, 2020, 3971041. [Google Scholar] [CrossRef] [PubMed]
  23. Chaudhuri, S.; Banerjee, A.; Basu, K.; Sengupta, B.; Sengupta, P.K. Interaction of flavonoids with red blood cell membrane lipids and proteins: Antioxidant and antihemolytic effects. Int. J. Biol. Macromol. 2007, 41, 42–48. [Google Scholar] [CrossRef]
  24. Wonglom, P.; Ito, S.; Sunpapao, A. Volatile organic compounds emitted from endophytic fungus Trichoderma asperellum T1 mediate antifungal activity, defense response and promote plant growth in lettuce (Lactuca sativa). Fungal Ecol. 2020, 43, 100867. [Google Scholar] [CrossRef]
  25. Campos, P.S.; Quartin, V.; Ramalho, J.C.; Nunes, M.A. Electrolyte leakage and lipid degradation account for cold sensitivity in leaves of Coffea sp. plants. J. Plant Physiol. 2003, 160, 283–292. [Google Scholar] [CrossRef] [Green Version]
  26. Lee, M.; Lim, S.; Kim, J.; Oh, M. Heat shock treatments induce the accumulation of phytochemicals in kale sprouts. J. Hortic. Sci. Technol. 2012, 30, 509–518. [Google Scholar]
  27. Kaniuga, Z.; Michalski, W. Photosynthetic apparatus in chilling-sensitive plants. II. Changes in free fatty acid composition and photoperoxidation in chloroplasts following cold storage and illumination of leaves in relation to hill reaction activity. Planta 1978, 140, 129–136. [Google Scholar] [CrossRef]
  28. Dipierro, S.; Leonardis, S.D. The ascorbate system and lipid peroxidation in stored potato (Solanum tuberosum L.) tubers. J. Exp Bot. 1997, 48, 779–783. [Google Scholar] [CrossRef]
  29. Hong, S.J.; Park, N.I.; Kim, B.S.; Eum, H.L. Postharvest application of 1-MCP to maintain quality during storage on kimchi cabbage ‘Choongwang’. Hortic. Sci. Technol. 2018, 36, 215–223. [Google Scholar]
  30. Lufu, R.; Ambaw, A.; Opara, U.L. Water loss of fresh fruit: Influencing preharvest, harvest and Postharvest factors. Sci. Hortic. 2020, 272, 109519. [Google Scholar] [CrossRef]
  31. Pongprasert, N.; Sekozawa, Y.; Sugaya, S.; Gemma, H. A novel postharvest UV-C treatment to reduce chilling injury (membrane damage, browning and chlorophyll degradation) in banana peel. Sci. Hortic. 2011, 130, 73–77. [Google Scholar] [CrossRef]
  32. Shao, H.B.; Liang, Z.S.; Shao, M.A.; Wang, B.C. Changes of anti-oxidative enzymes and membrane peroxidation for soil water deficits among 10 wheat genotypes at seedling stage. Colloids Surf. B 2005, 42, 107–113. [Google Scholar] [CrossRef] [PubMed]
  33. Hodges, D.M.; Lester, G.E.; Munro, K.D.; Toivonen, P.M.A. Oxidative stress: Importance for postharvest quality. HortScience 2004, 39, 924–929. [Google Scholar] [CrossRef] [Green Version]
  34. Barth, M.M.; Zhuang, H. Packaging design affects antioxidant vitamin retention and quality of broccoli florets during postharvest storage. Postharvest Biol. Technol. 1996, 9, 141–150. [Google Scholar] [CrossRef]
  35. Fukushima, T.; Yamazaki, M.; Tsugiyama, T. Chilling injury in cucumber fruits. I. Effects of storage temperature on symptoms and physiological changes. Sci. Hortic. 1977, 6, 185–197. [Google Scholar] [CrossRef]
  36. Wang, J.; Zhang, Y.; Yan, X.; Guo, J. Physiological and transcriptomic analyses of yellow horn (Xanthoceras sorbifolia) provide important insights into salt and saline-alkali stress tolerance. PLoS ONE 2002, 15, e0244365. [Google Scholar] [CrossRef] [PubMed]
  37. Ferrante, A.; Incrocci, L.; Maggini, R.; Serra, G.; Tognoni, F. Colour changes of fresh-cut leafy vegetables during storage. J. Food Agric. Environ. 2004, 2, 40–44. [Google Scholar]
  38. Manolopoulou, E.; Varzakas, T. Effect of temperature in color change of green vegetables. Curr. Res. Nutr. Food Sci. 2016, 4, 10–17. [Google Scholar] [CrossRef]
  39. Taylor, A.O.; Graig, A.S. Plants under climatic stress, II. Low temperature, high light effects on chloroplast ultrastructure. Plant Physiol. 1971, 47, 719–725. [Google Scholar] [CrossRef] [PubMed] [Green Version]
  40. Pacher, P.; Beckman, J.S.; Liaudet, L. Nitric oxide and peroxynitrite in health and disease. Physiol. Rev. 2007, 87, 315–424. [Google Scholar] [CrossRef] [Green Version]
  41. Eum, H.L.; Yi, T.G.; Hong, S.J.; Park, N. Variations of bioactive compound contents and antioxidant capacity of Asparagus seedlings in 23 varieties. Hortic. Sci. Technol. 2020, 38, 291–302. [Google Scholar]
  42. Przeor, M.; Flaczyk, E.; Kmiecik, D.; Buchowski, M.S.; Staniek, H.; Tomczak-Graczyk, A.; Kobus-Cisowska, J.; Gramza-Michałowska, A.; Foksowicz-Flaczyk, J. Functional Properties and Antioxidant Activity of Morus alba L. Leaves var. Zolwinska Wielkolistna (WML-P)—The Effect of Controlled Conditioning Process. Antioxidants 2020, 9, 668. [Google Scholar] [CrossRef]
  43. Hiraoka, N.; Chang, J.I.; Bohm, L.R.; Bohm, B.A. Furanocoumarin and polyacetylenic compound composition of wild Glehnia littoralis in North America. Biochem. Syst. Ecol. 2002, 30, 321–325. [Google Scholar] [CrossRef]
  44. Yang, W.; Ye, M.; Liu, M.; Kong, D.; Shi, R.; Shi, X.; Zhang, K.; Wang, Q.; Lantong, Z. A practical strategy for the characterization of coumarins in Radix Glehniae by liquid chromatography coupled with triple quadrupole-linear ion trap mass spectrometry. J. Chromatogr. A 2010, 1217, 4587–4600. [Google Scholar] [CrossRef] [PubMed]
Figure 1. Weight loss (A), MDA production (B), electrolyte leakage of leaf (C), and electrolyte leakage of stem (D) of G. littoralis during storage at 4 °C. MAP treatment was classified into micro-perforated PE (MPE, 32 pinholes) and PE on the basis of the presence or absence of pinholes, respectively. Values are shown as mean ± standard deviation. Statistical significance was shown by a t-test between PE and MPE at each time point during storage (*** p < 0.001, ** p < 0.01, and * p < 0.05). The arrow indicates (BD) the time point after 5 days of storage and the statistical analysis of each value between the control and MAP treatment is displayed as a bar graph in the inner box. The different letters represent the significant differences by Fisher’s least significant difference (LSD) test; p < 0.05.
Processes 09 02052 g001
Figure 2. Total chlorophyll content (A), chlorophyll a content (B), and chlorophyll b content (C) of G. littoralis during storage at 4 °C. MAP treatment was classified into micro-perforated PE (MPE, 32 pinholes) and PE on the basis of the presence or absence of pinholes, respectively. Values are shown as mean ± standard deviation. Statistical significance was shown by a t-test between PE and MPE at each time point during storage (*** p < 0.001, ** p < 0.01, and * p < 0.05).
Processes 09 02052 g002
Figure 3. Changes in color values of G. littoralis during storage at 4 °C. (A), CIE L* value; (B), CIE a* value; (C), CIE b* value; (D), hue angle; and (E), chroma value. MAP treatment was classified into micro-perforated PE (MPE, 32 pinholes) and PE on the basis of the presence or absence of pinholes, respectively. Values are shown as mean ± standard deviation. Statistical significance was shown by a t-test between PE and MPE at each time point during storage (*** p < 0.001, ** p < 0.01, and * p < 0.05).
Processes 09 02052 g003
Figure 4. HPLC chromatograms of phenolic acids (chlorogenic acid, r2 = 0.9999; ferulic acid, r2 = 1; caffeic acid, r2 = 1; and vanillic acid, r2 = 1), flavonoids (rutin, r2 = 0.9999; isoquercetin, r2 = 0.9999; nicotiflorin, r2 = 0.9999; quercetin, r2 = 0.9998; and kaempferol, r2 = 0.9999), and coumarins (bergapten, r2 = 1 and imperatorin, r2 = 1) in the ethanolic extract of G. littoralis.
Processes 09 02052 g004
Figure 5. Changes in the phenolic acids of G. littoralis during storage at 4 °C. (A), chlorogenic acid; (B), ferulic acid; (C), caffeic acid; and (D), vanillic acid. MAP treatment was classified into micro-perforated PE (MPE, 32 pinholes) and PE on the basis of the presence or absence of pinholes, respectively. Values are shown as mean ± standard deviation. Statistical significance was shown by a t-test between PE and MPE at each time point during storage (*** p < 0.001, ** p < 0.01, and * p < 0.05).
Processes 09 02052 g005
Figure 6. Changes in the flavonoids of G. littoralis during storage at 4 °C. (A), rutin; (B), isoquercetin; (C), nicotiflorin; (D), quercetin; and (E), kaempferol. MAP treatment was classified into micro-perforated PE (MPE, 32 pinholes) and PE on the basis of the presence or absence of pinholes, respectively. Values are shown as mean ± standard deviation. Statistical significance was shown by a t-test between PE and MPE at each time point during storage (*** p < 0.001, ** p < 0.01, and * p < 0.05).
Processes 09 02052 g006
Figure 7. Changes in the coumarins of G. littoralis during storage at 4 °C. (A), bergapten and (B), imperatorin. MAP treatment was classified into micro-perforated PE (MPE, 32 pinholes) and PE on the basis of the presence or absence of pinholes, respectively. Values are shown as mean ± standard deviation. Statistical significance was shown by a t-test between PE and MPE at each time point during storage (*** p < 0.001, ** p < 0.01, and * p < 0.05).
Processes 09 02052 g007
Publisher’s Note: MDPI stays neutral with regard to jurisdictional claims in published maps and institutional affiliations.

