
Effectiveness of Ozonated Water for Preserving Quality and Extending Storability of Star Ruby Grapefruit


Abstract
:1. Introduction
2. Materials and Methods
2.1. Fruit Material
2.2. Preparation of Aqueous Ozone
2.3. Treatment Applied and Storage Conditions
| T1 | 0.3 ppm ozonated water for 5 min at 5 °C |
| T2 | 0.6 ppm ozonated water for 5 min at 5 °C |
| T3 | 0.3 ppm ozonated water for 10 min at 15 °C |
| T4 | 0.6 ppm ozonated water for 10 min at 15 °C |
| T5 | Control dipping fruits with distilled water |
2.4. Fruit Quality Attributes
2.4.1. Weight Loss
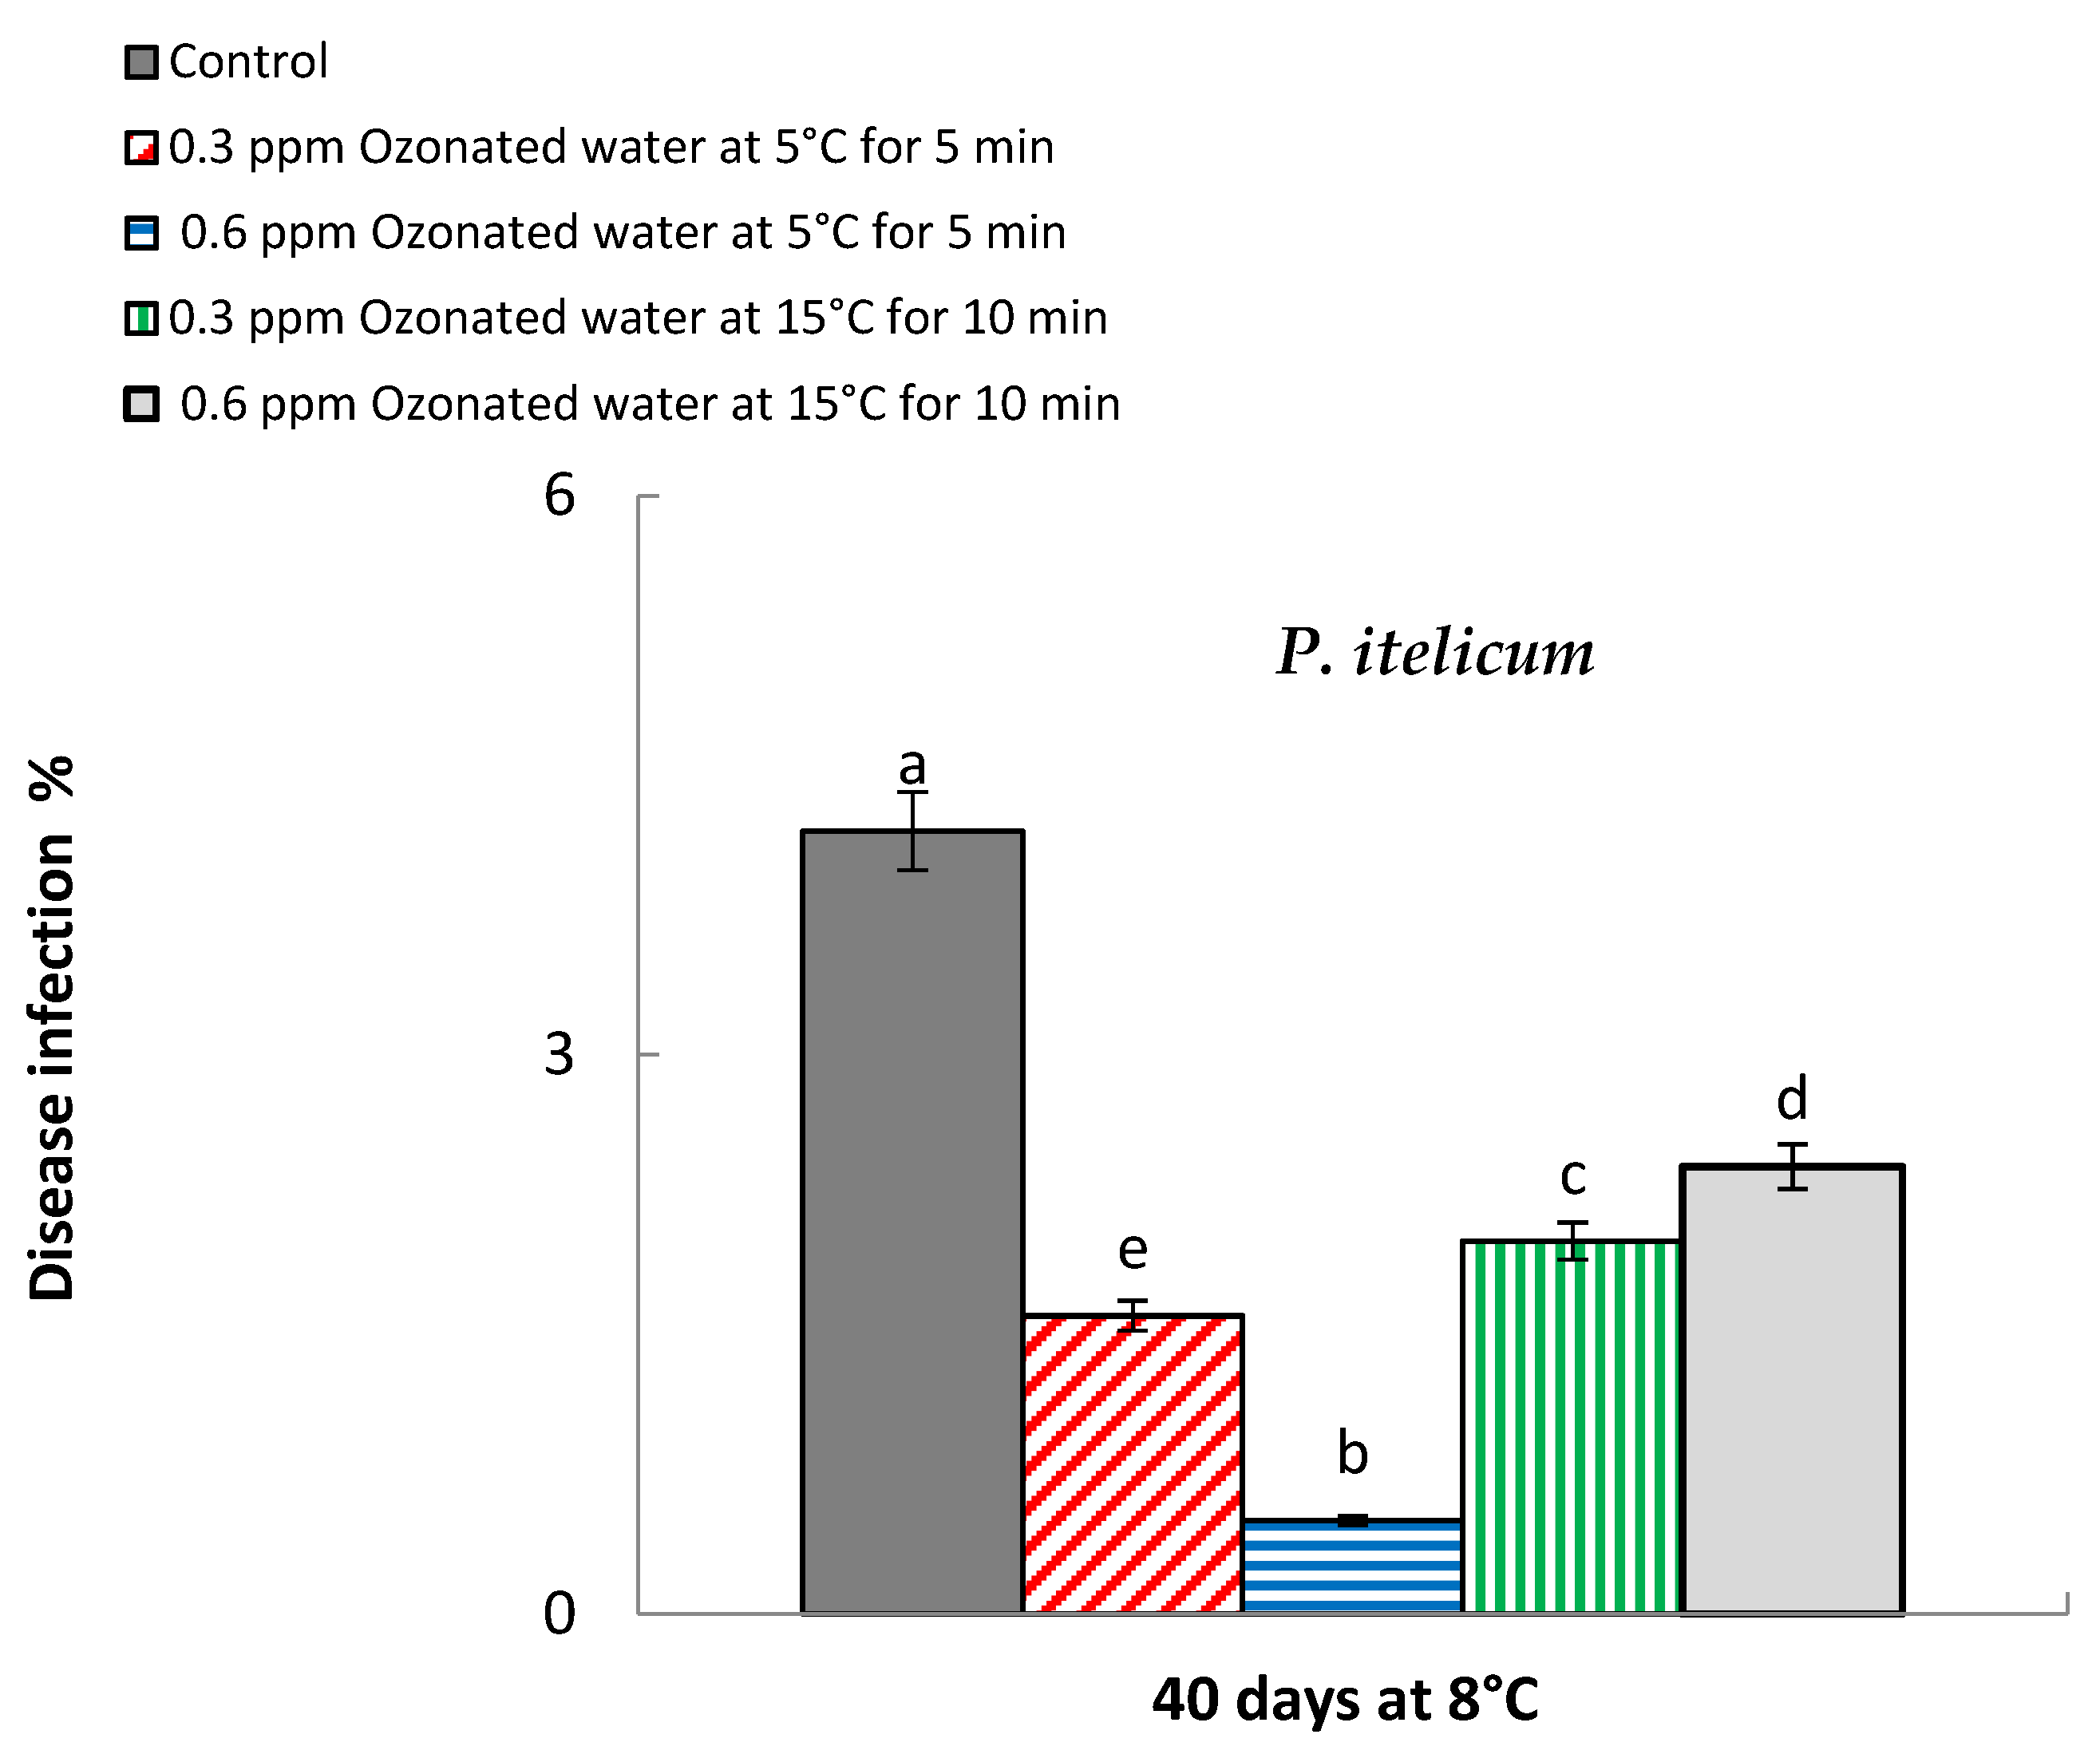
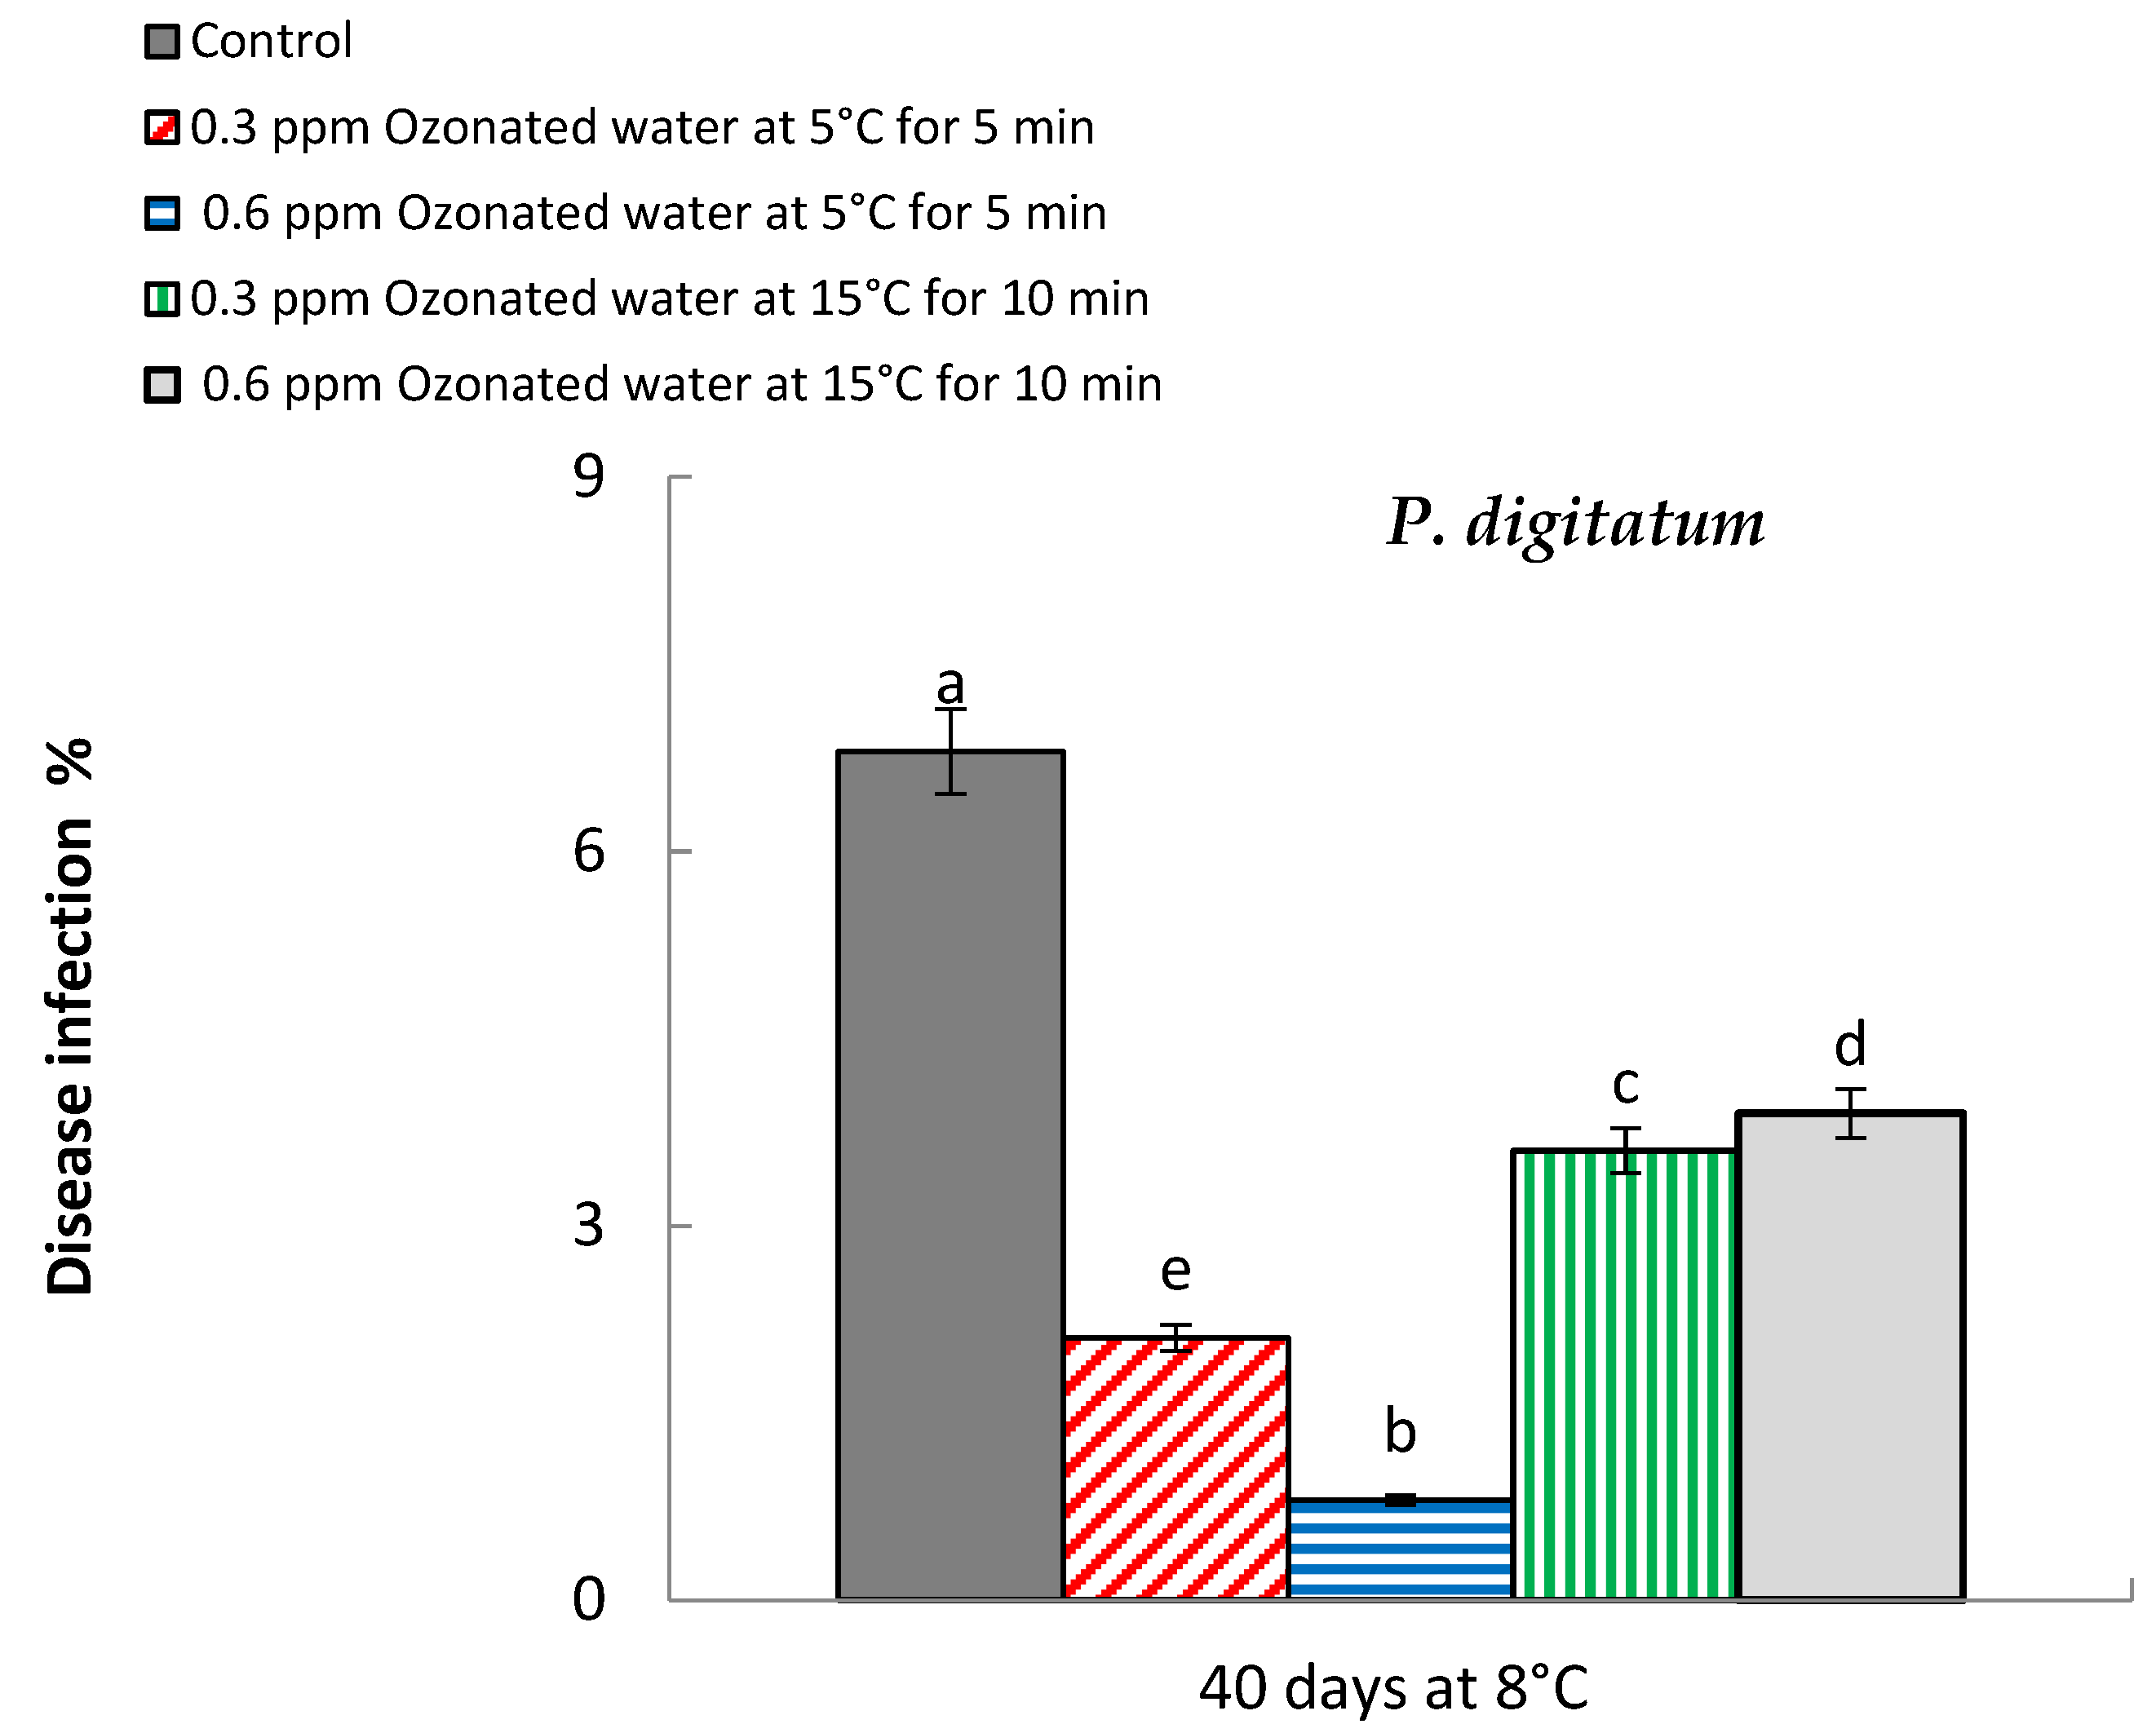
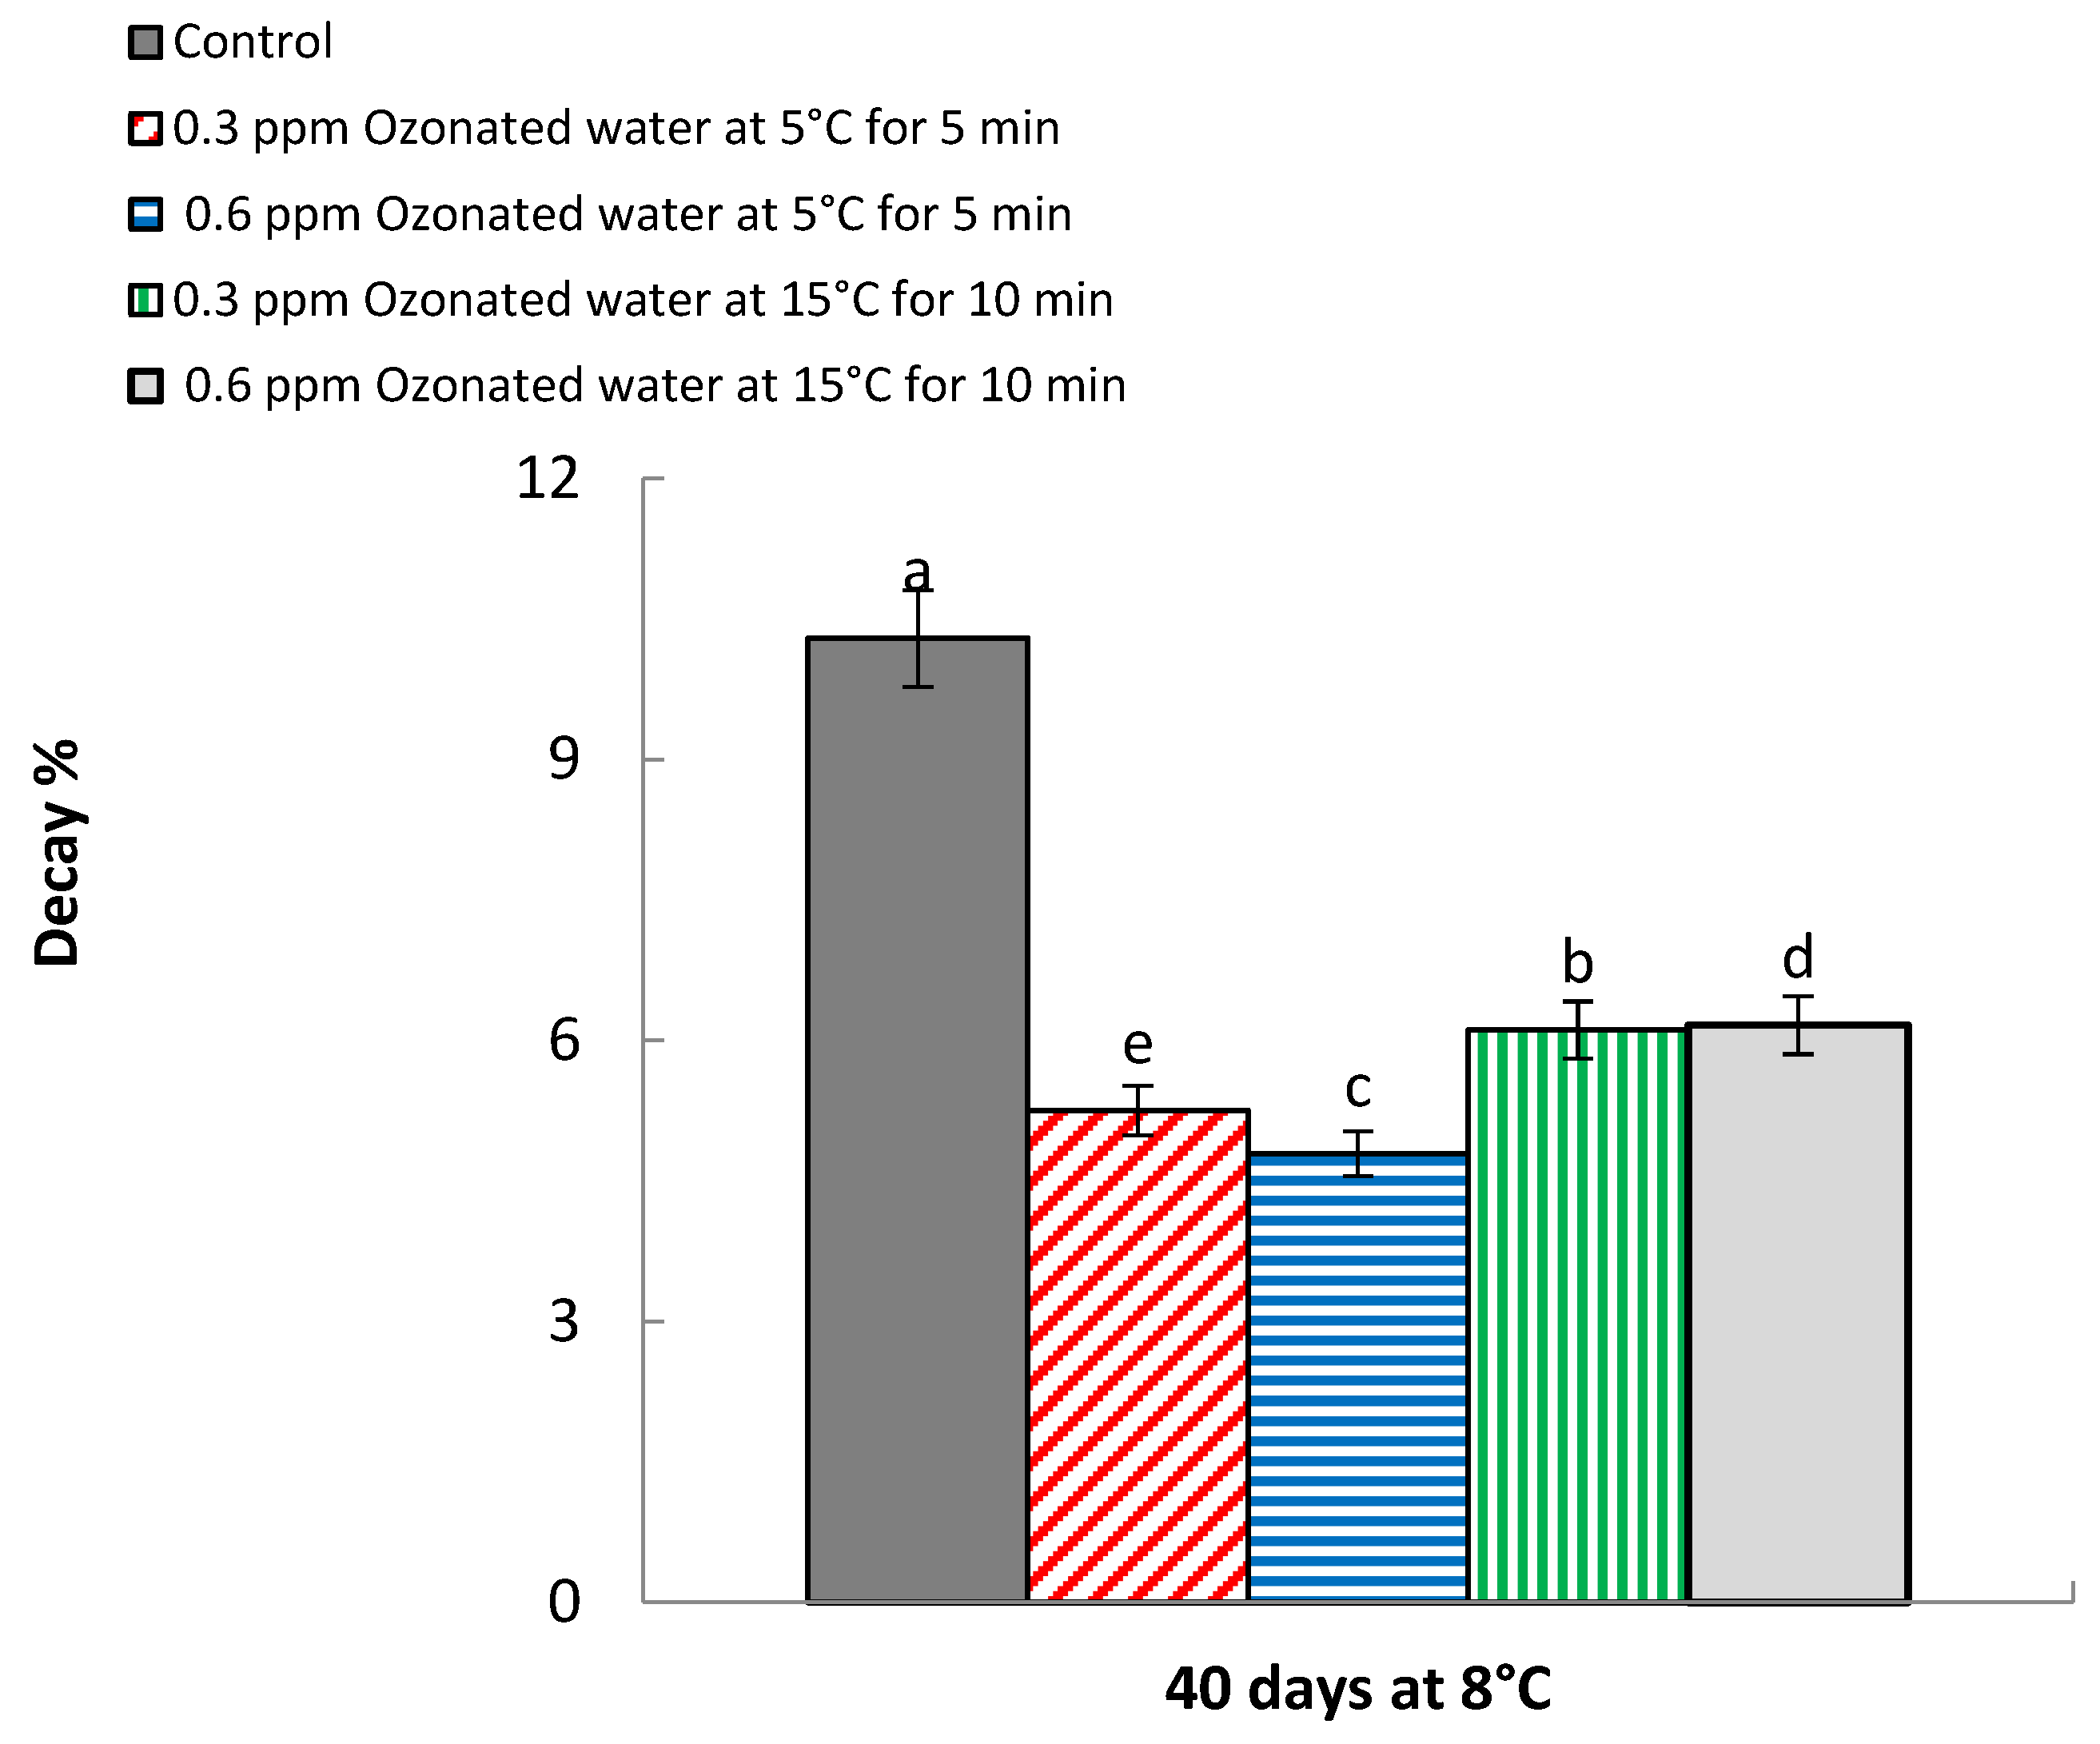
2.4.2. Disease Infection and Decay Percentage
Decay Percentage
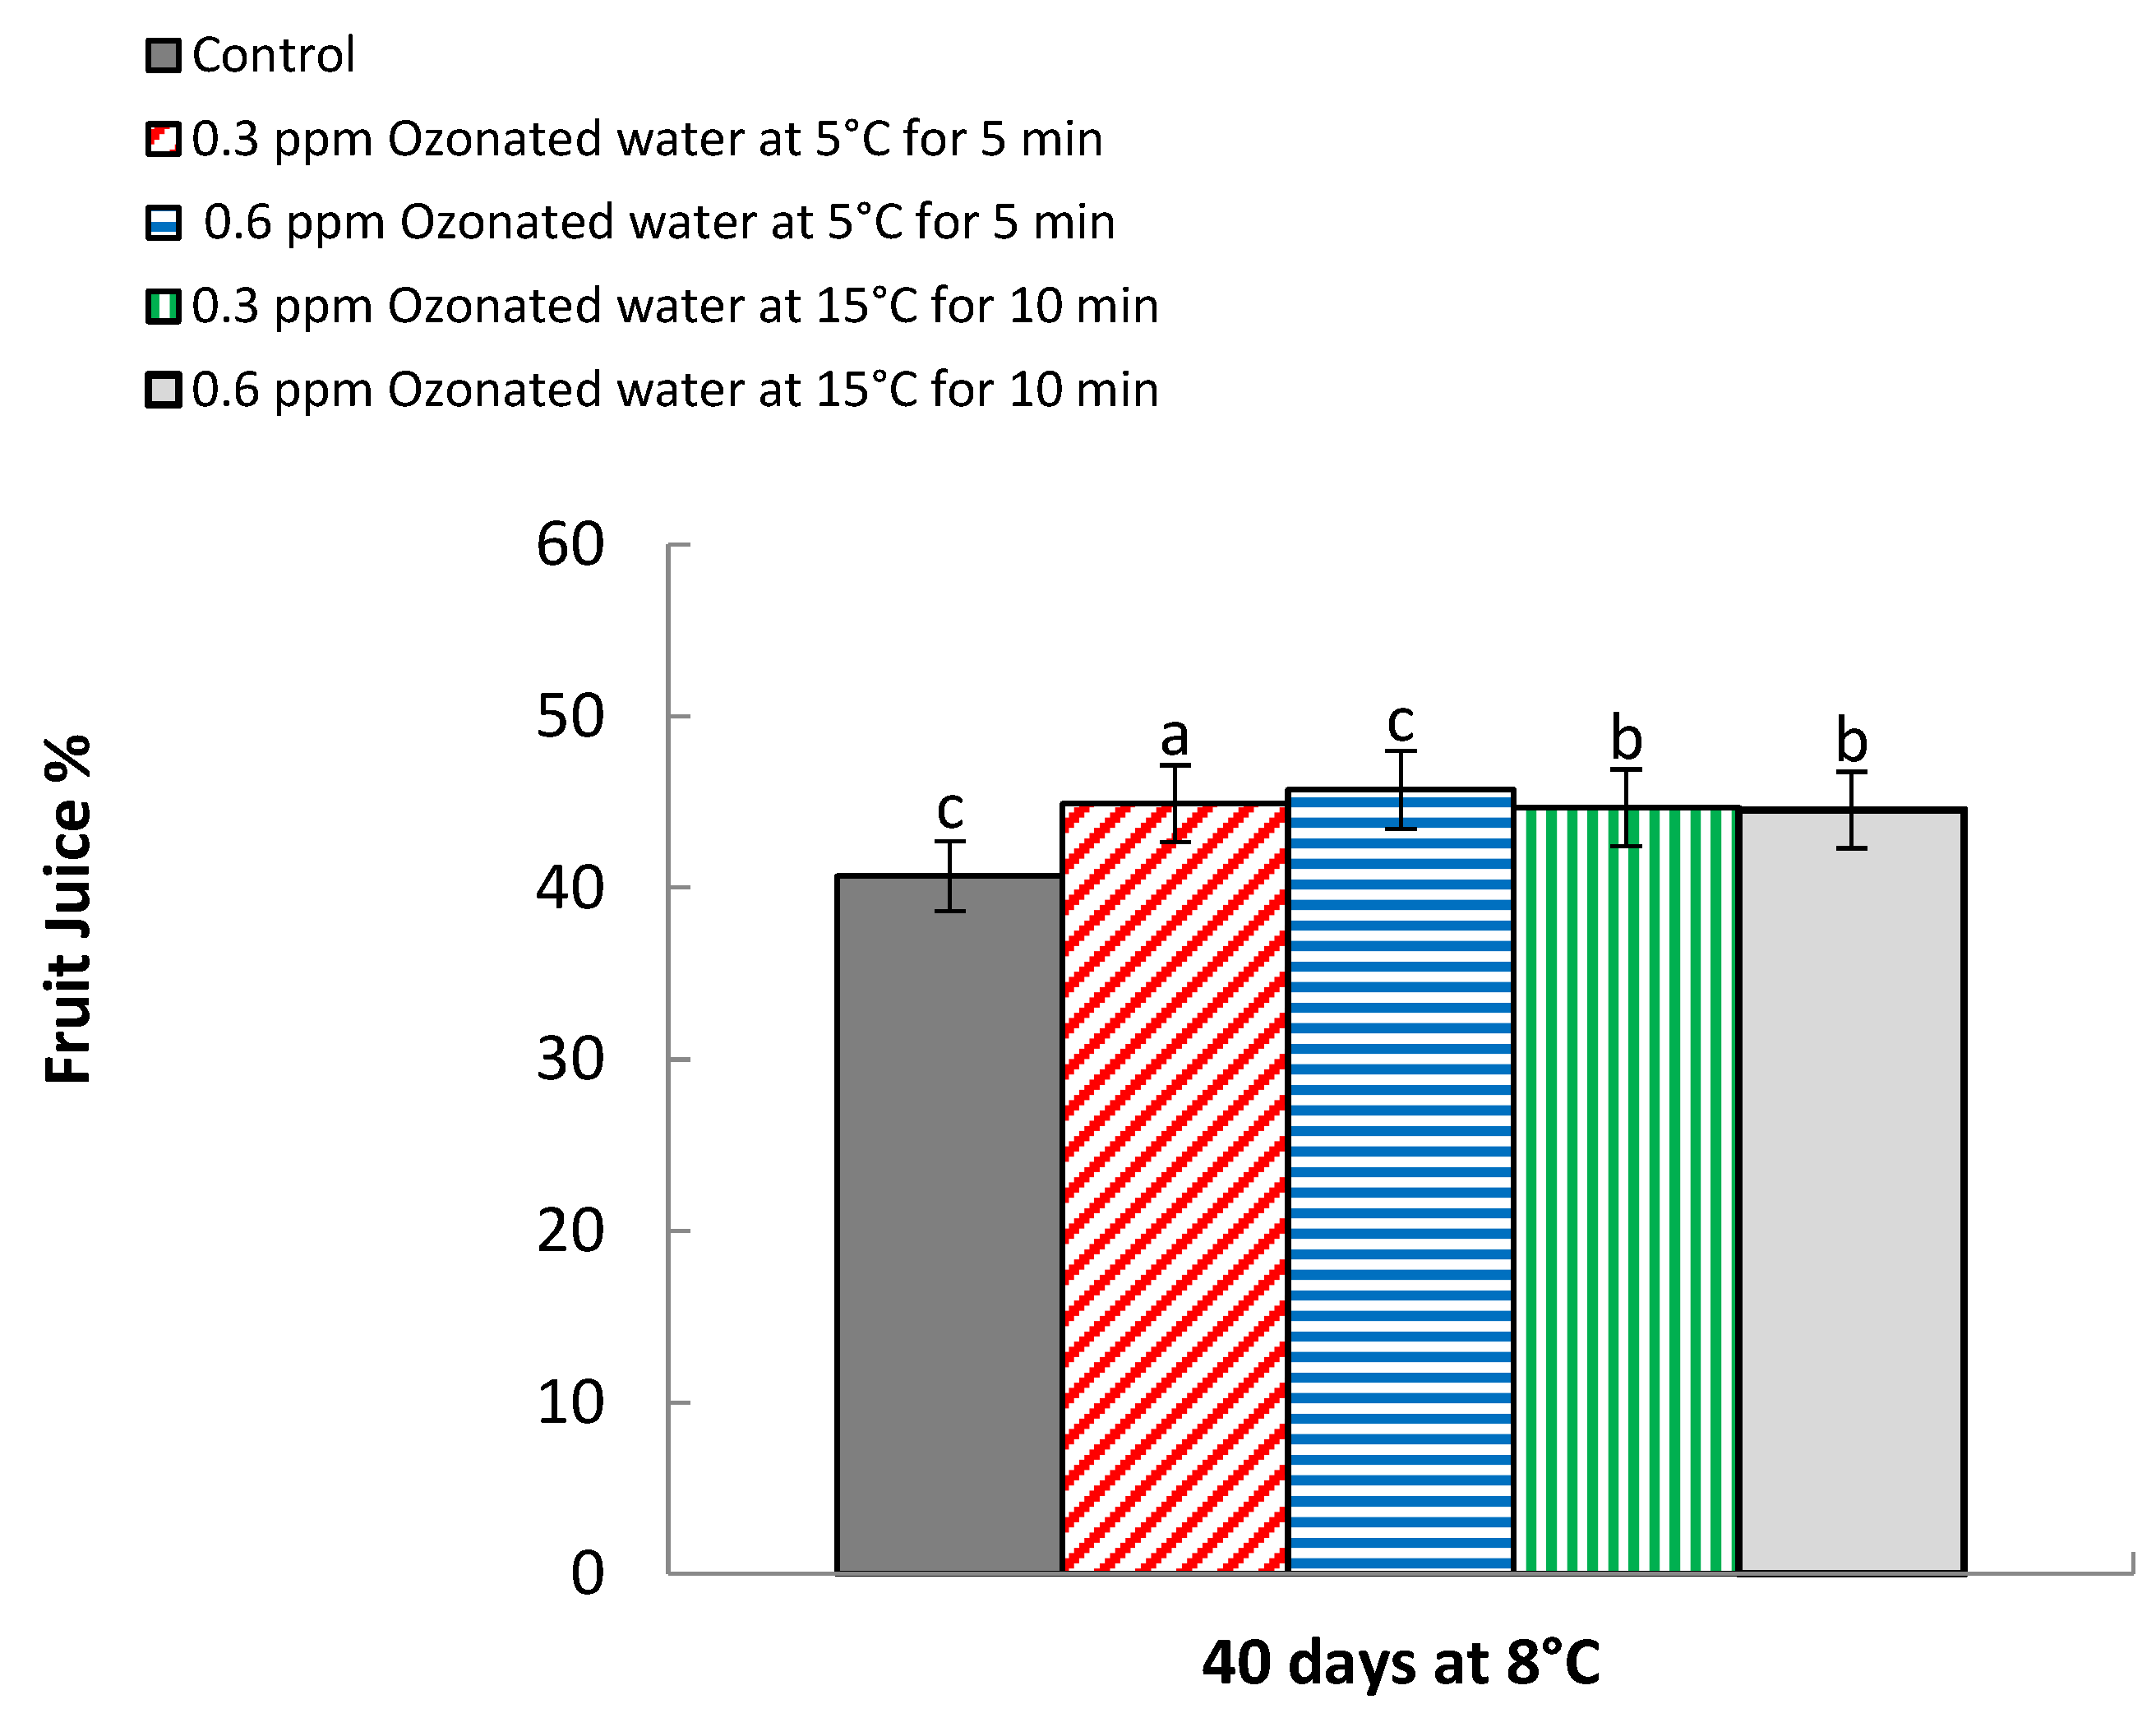
2.4.3. Fruit Juice Percentage
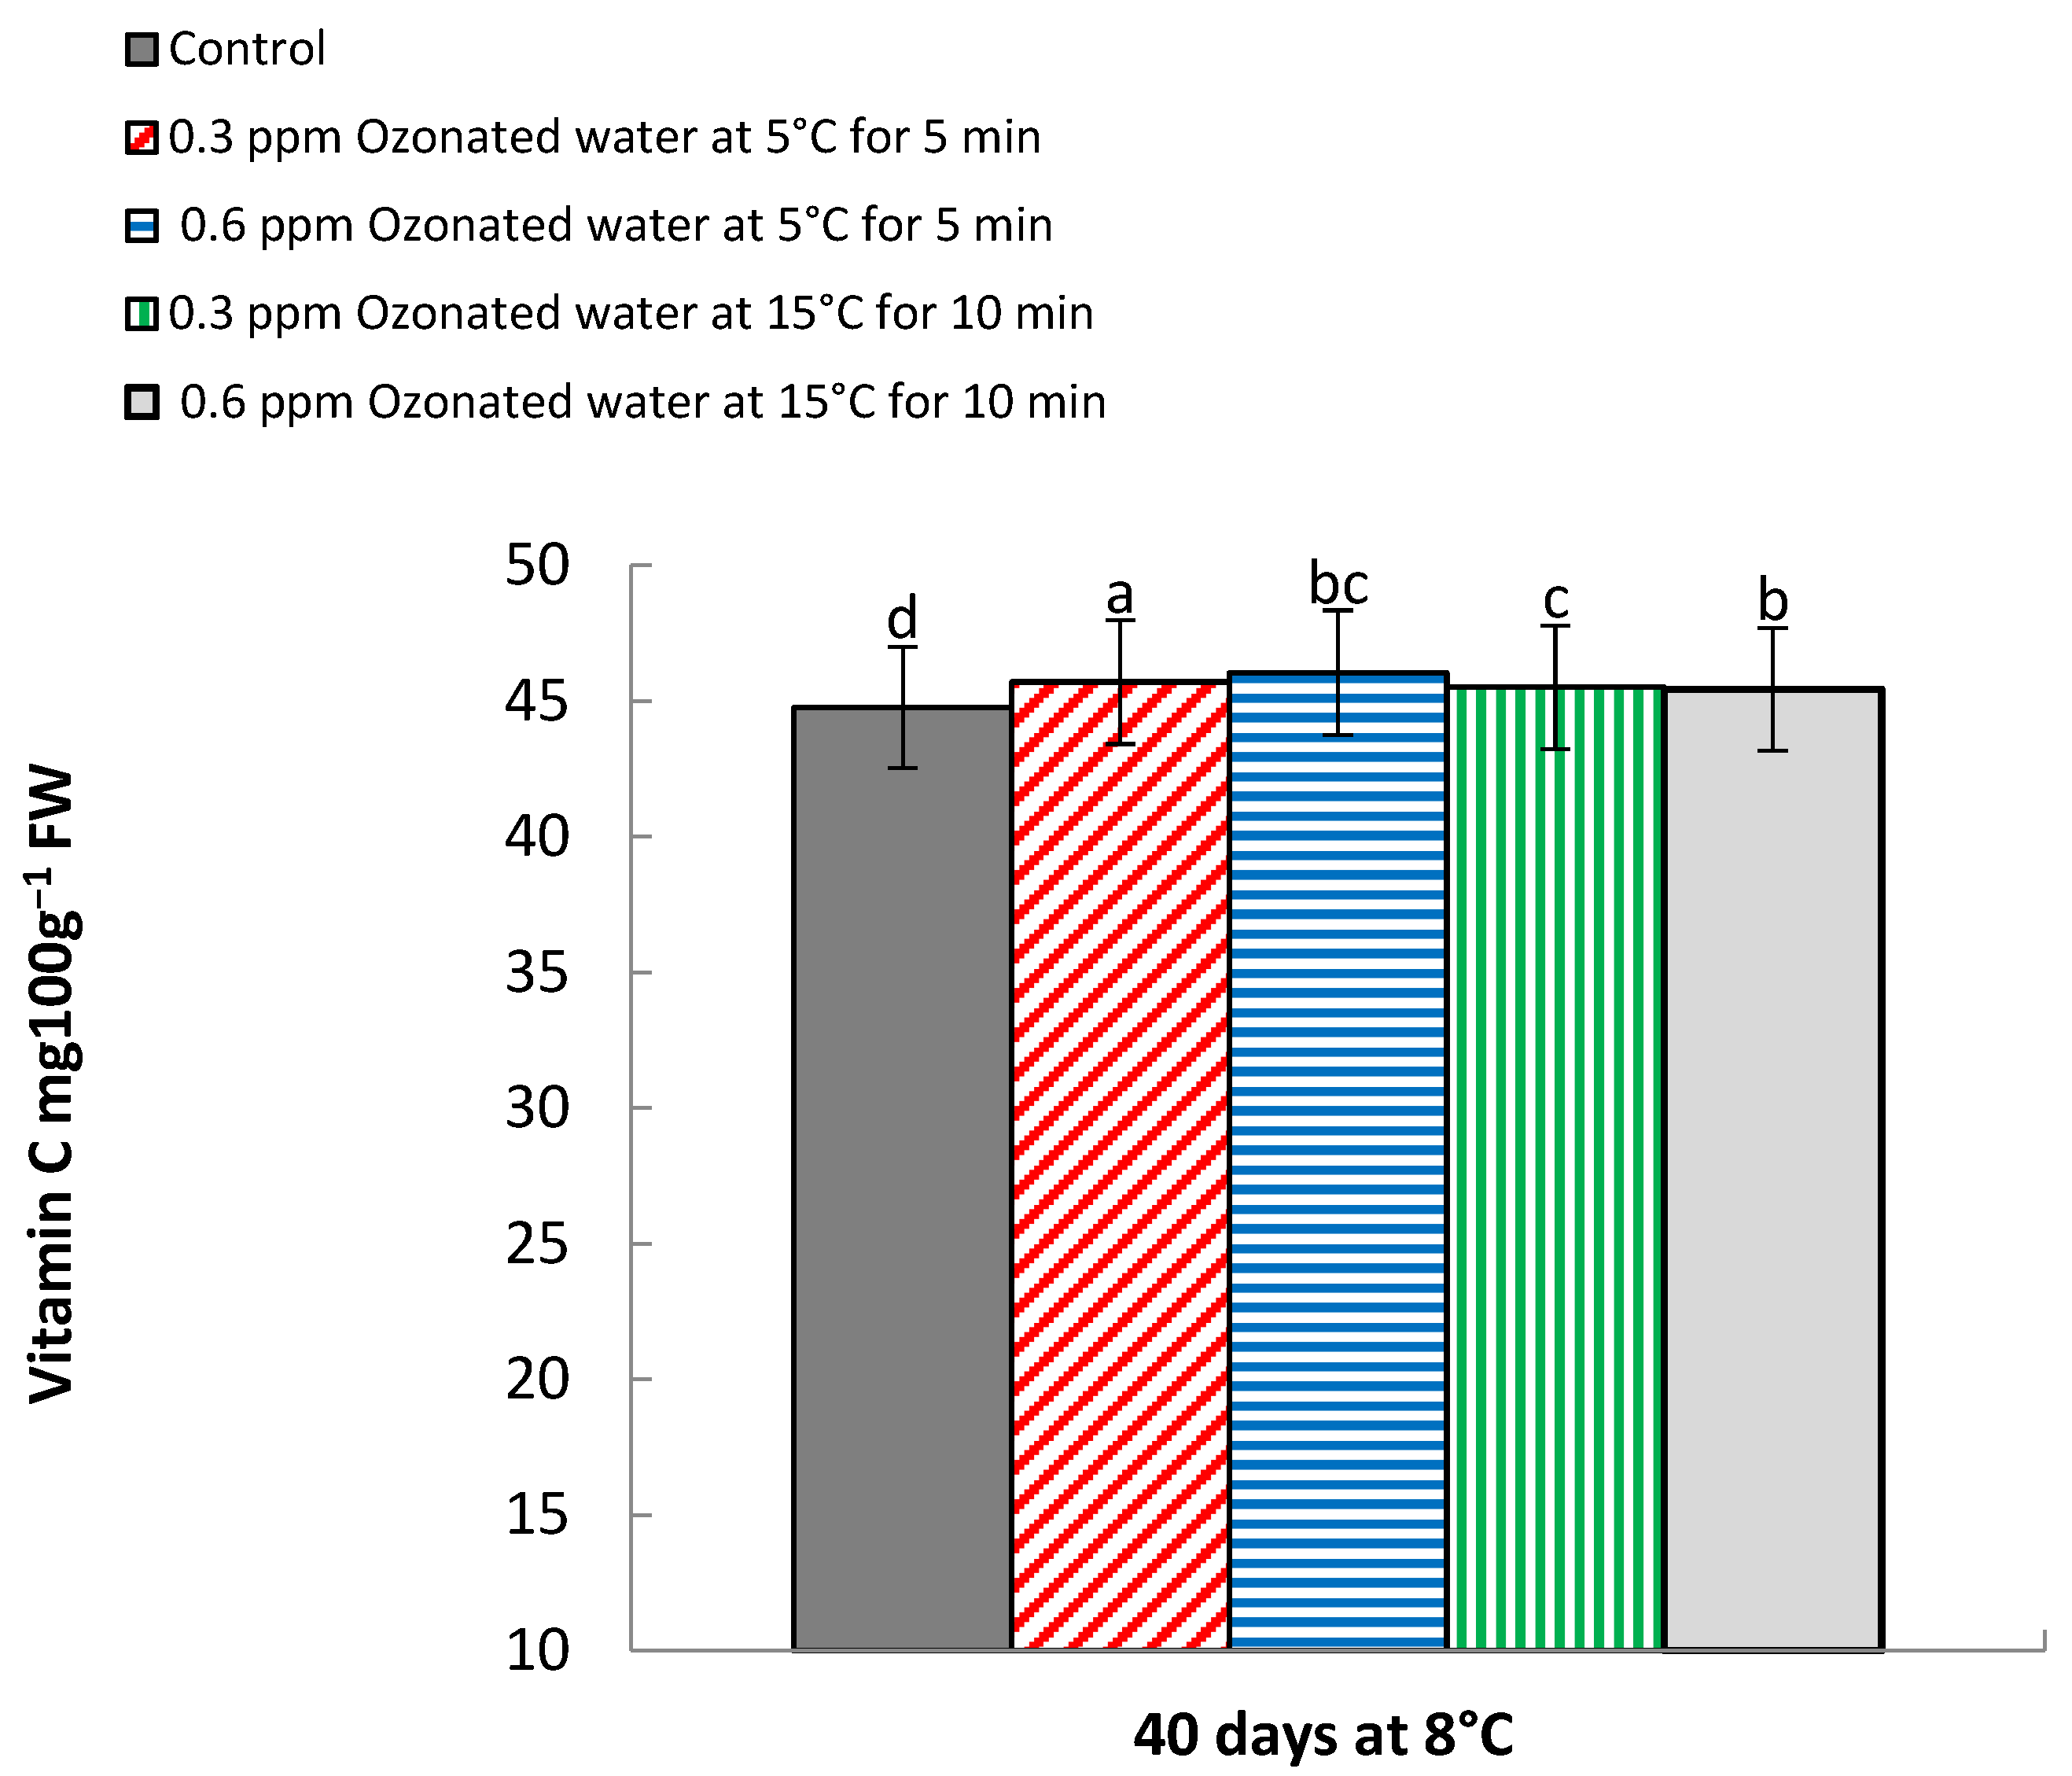
2.4.4. Vitamin C (mg 100 g−1 Fresh Weight)
2.4.5. Total Soluble Solids (TSS %)
2.4.6. Titratable Acidity (TA %)
2.4.7. Total Soluble Solids/Acid Ratio (%)
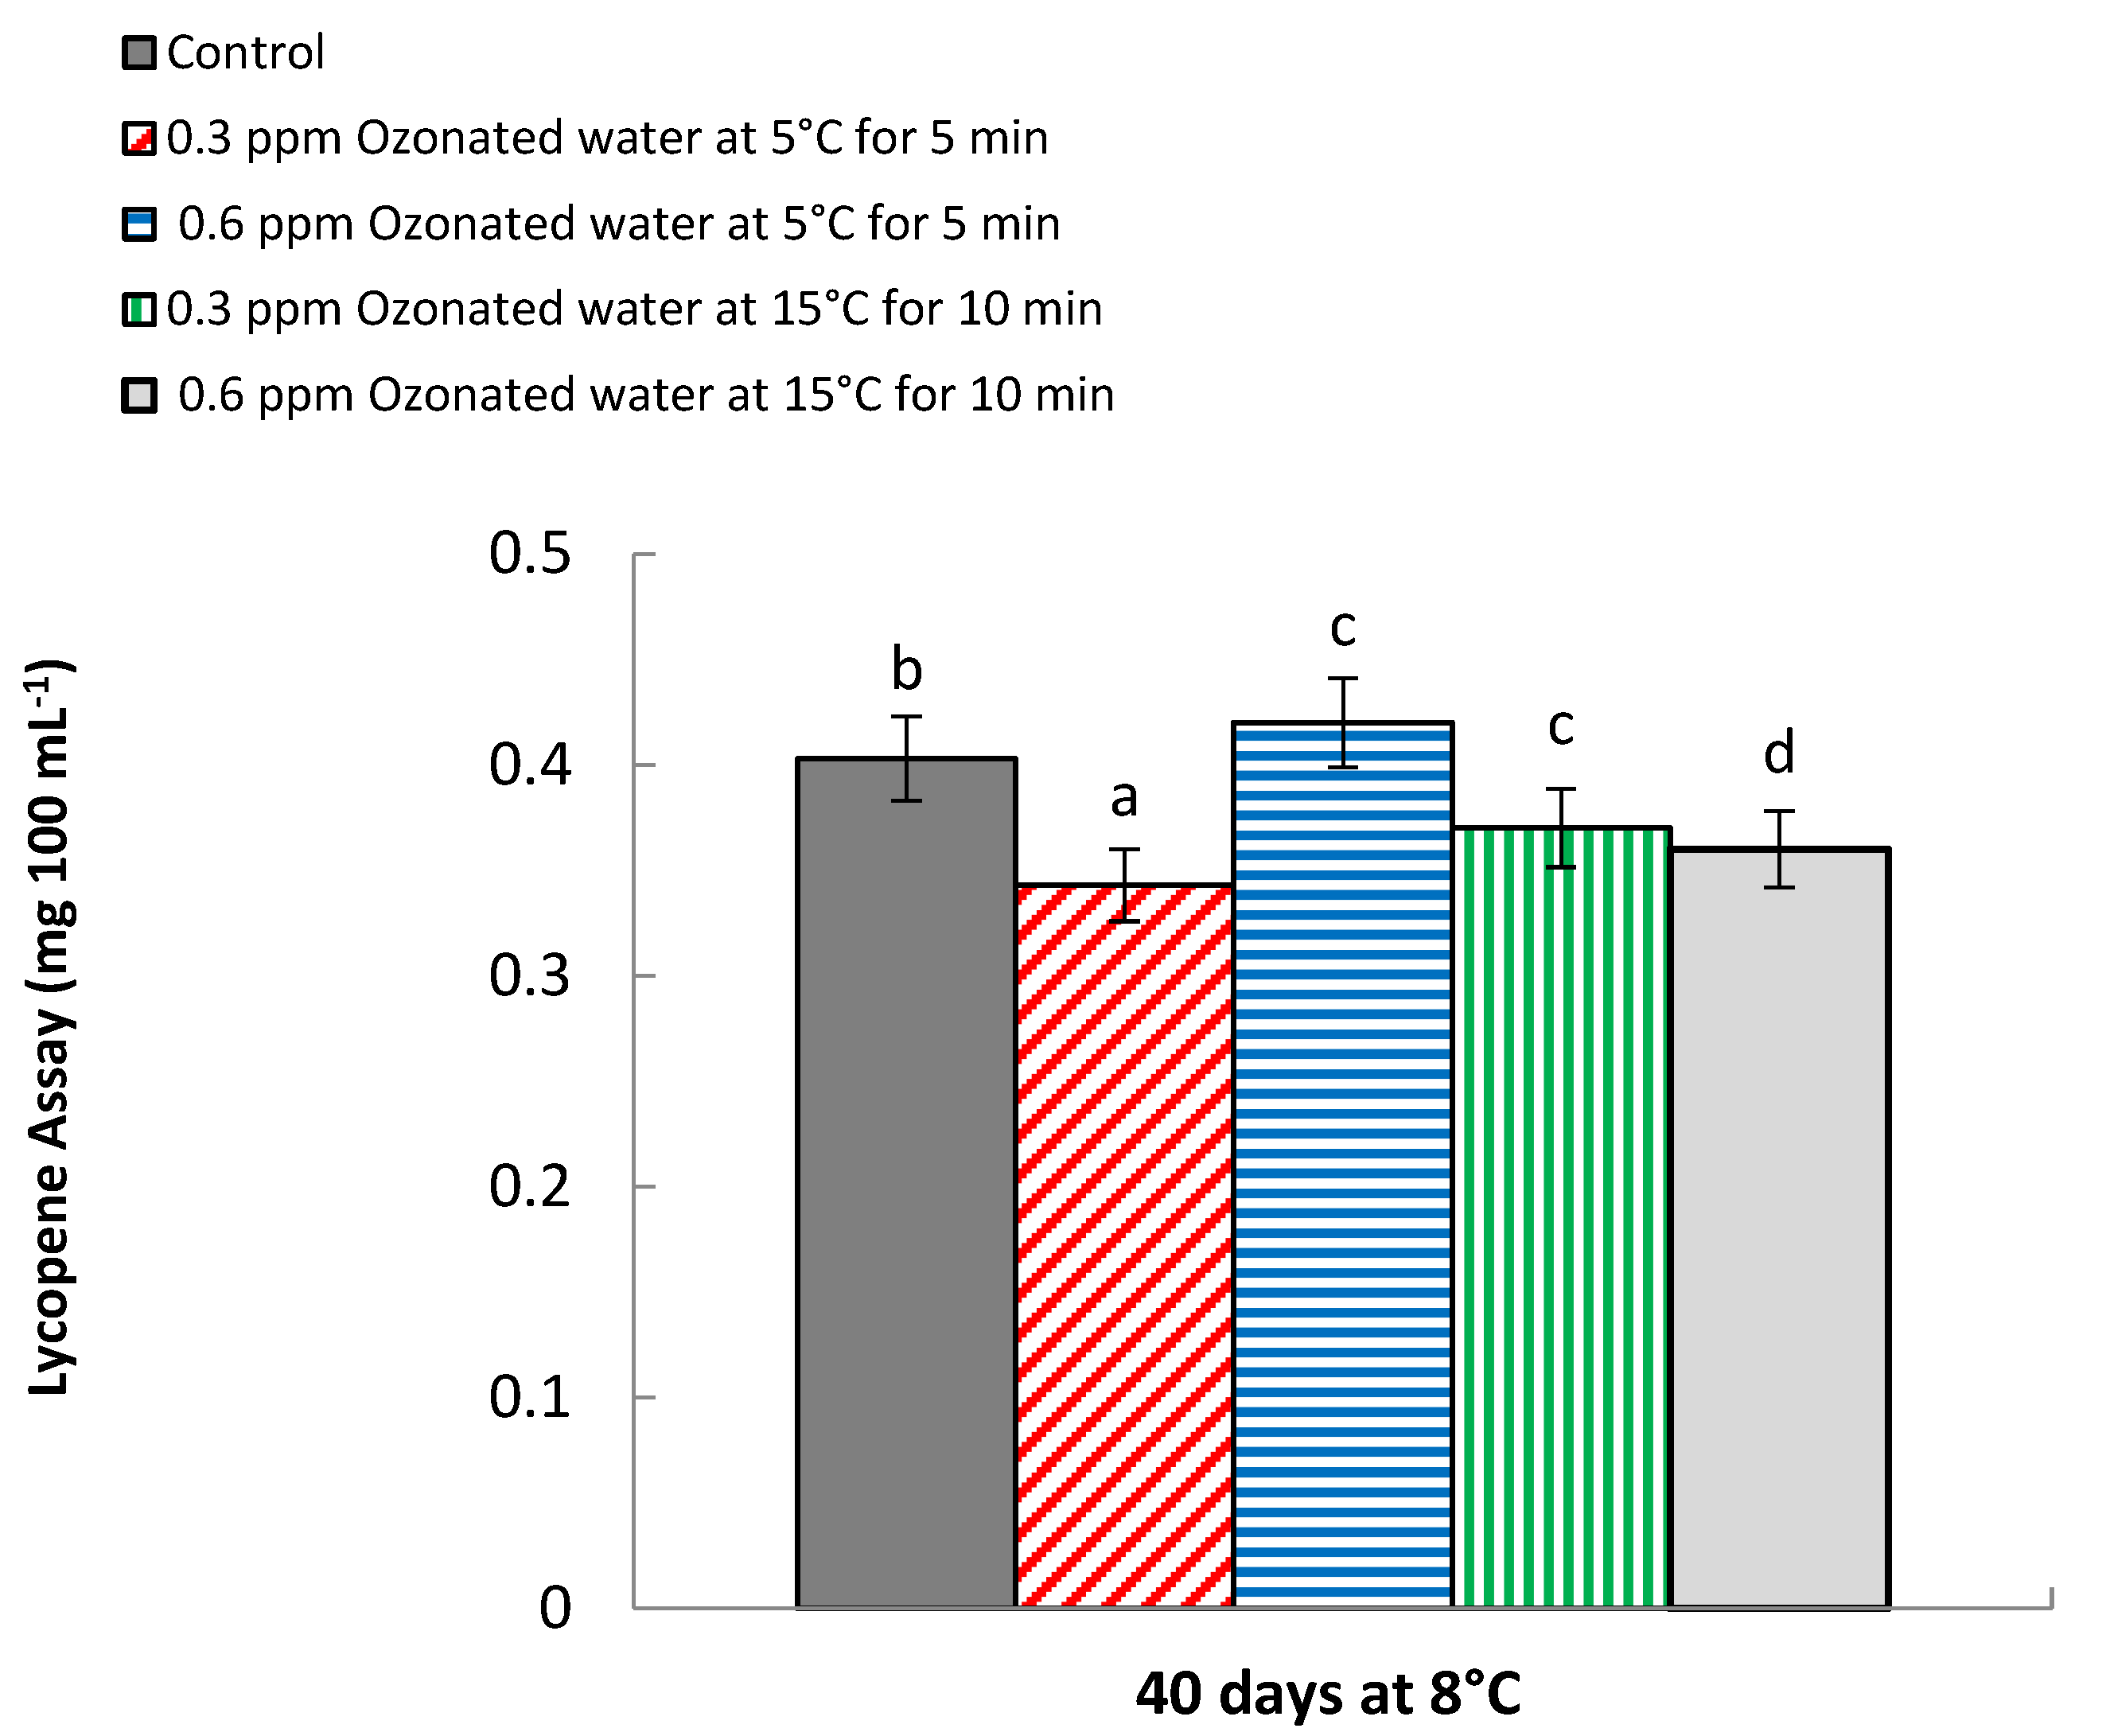
2.4.8. Lycopene Assay
2.4.9. Total Phenolic Compounds (mg g−1 FW)
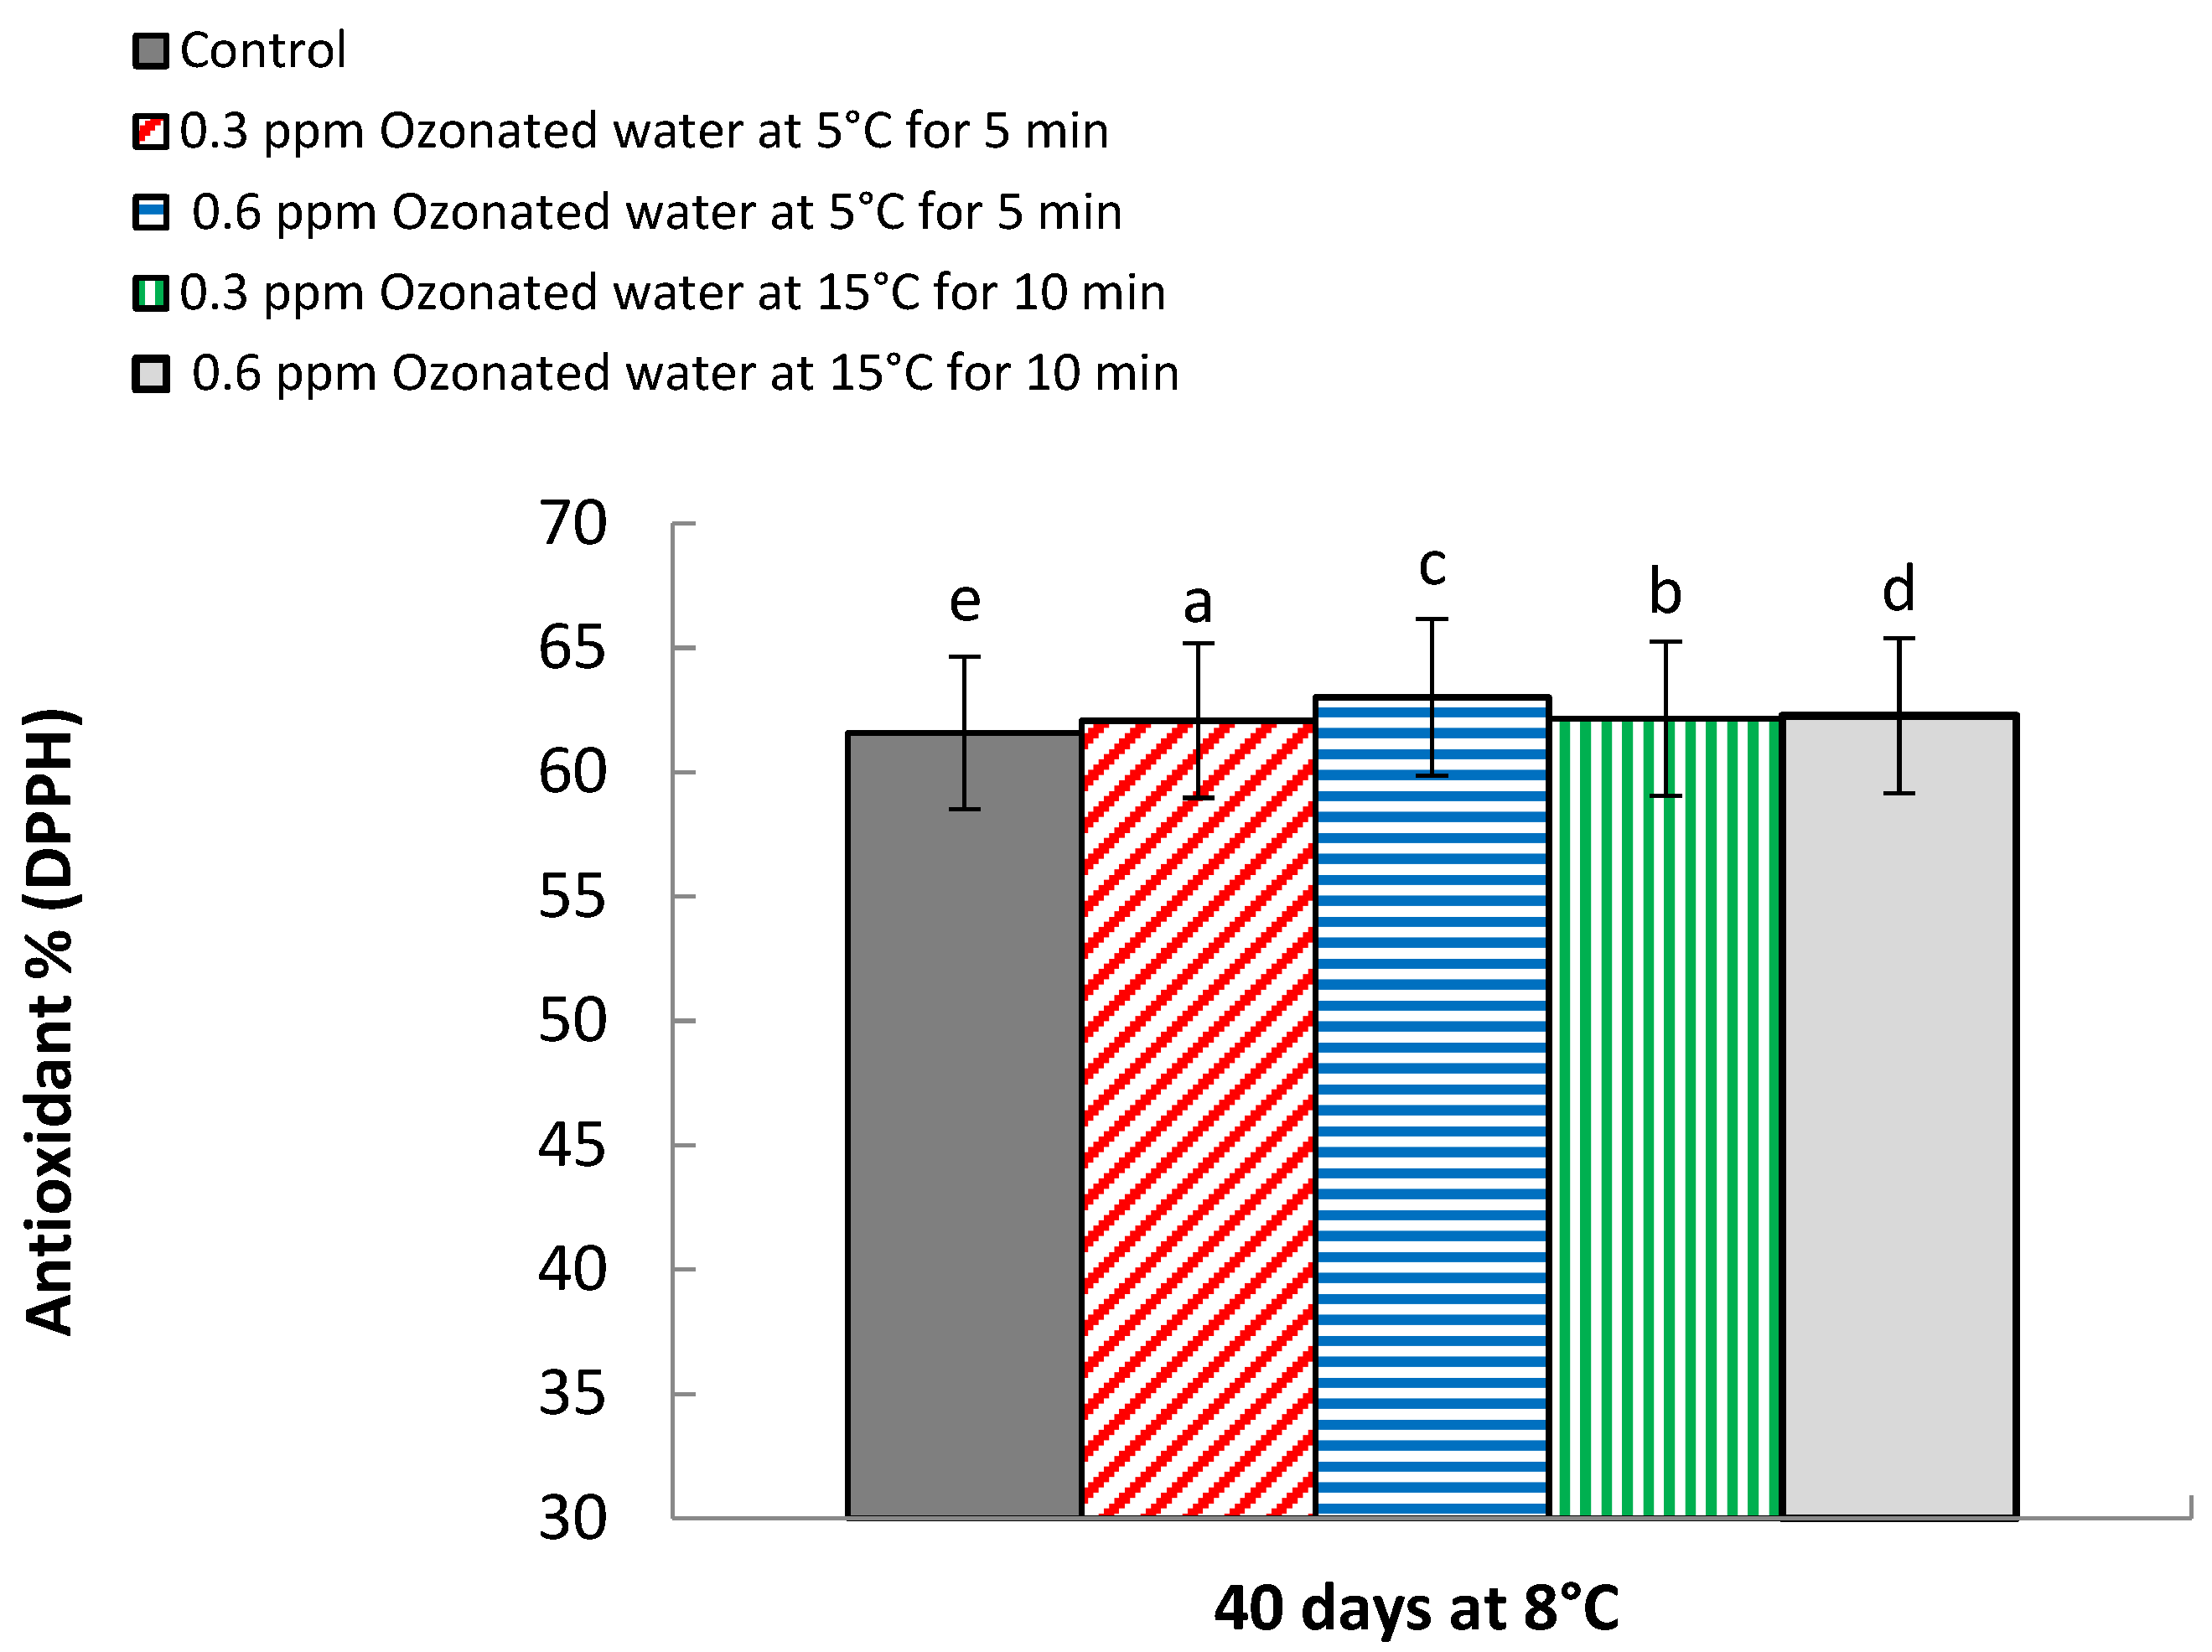
2.4.10. Antioxidant Activity (%)
2.5. Statistical Analysis
3. Results
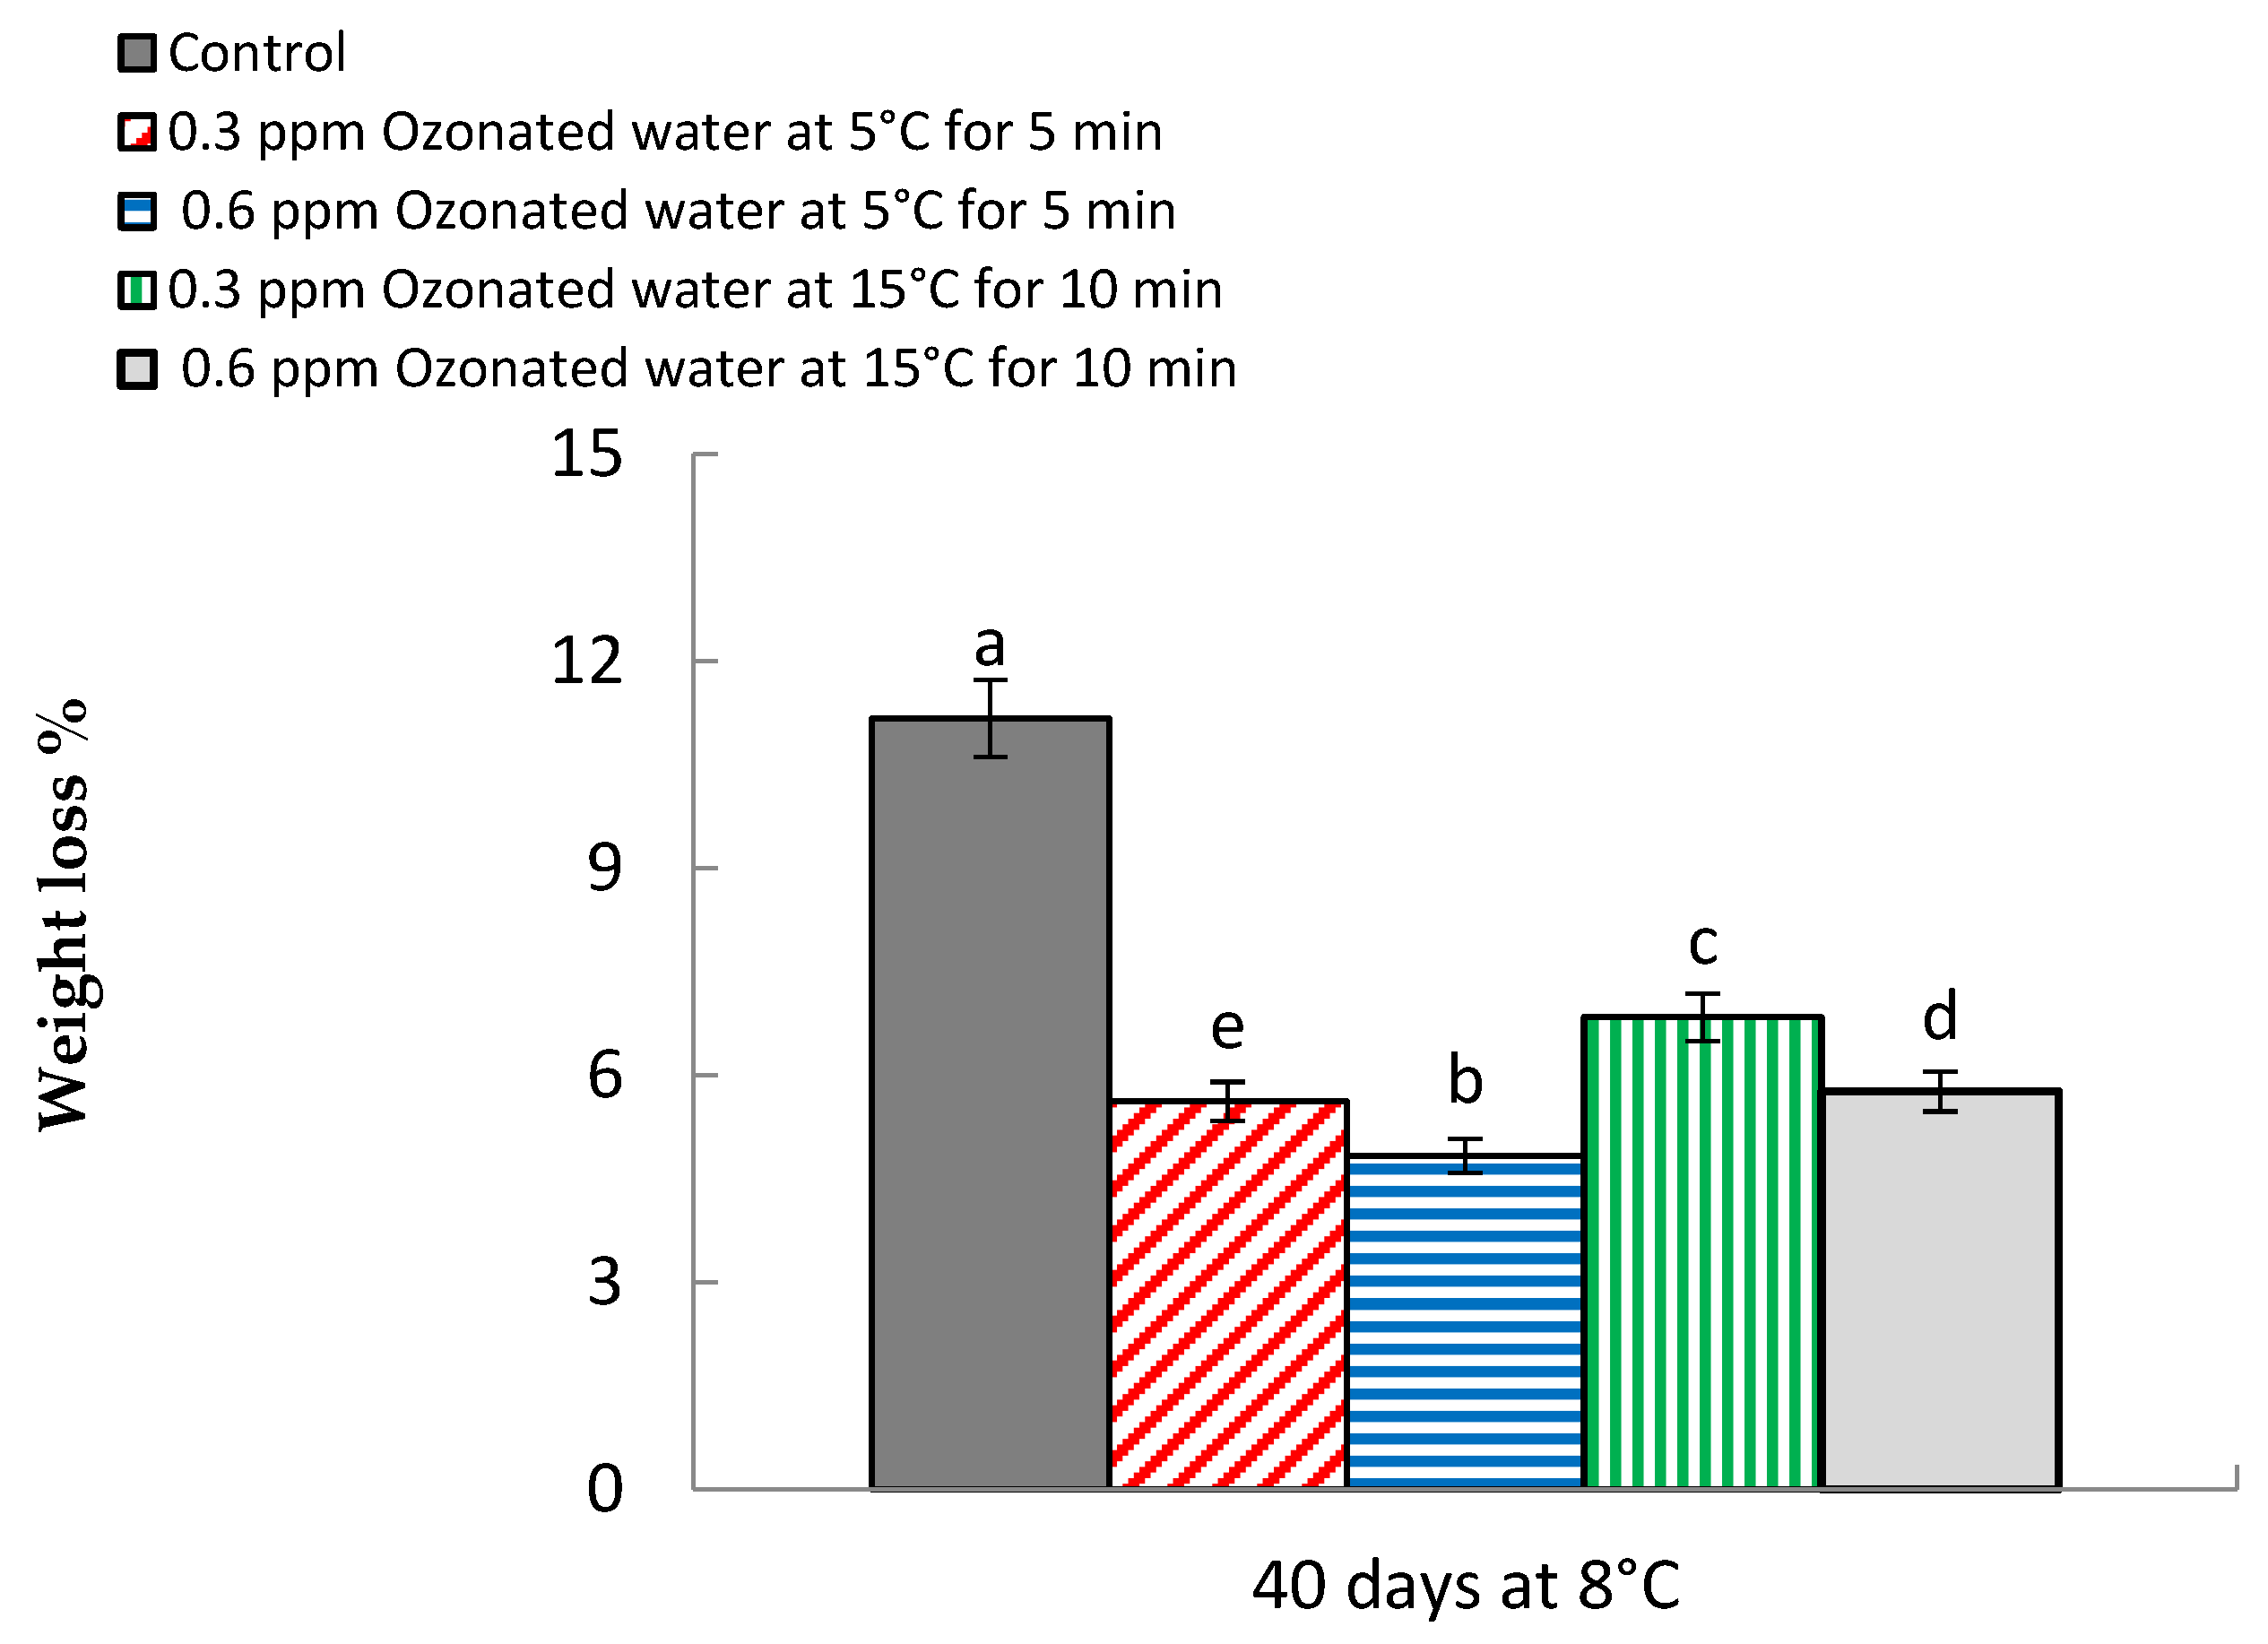
3.1. Weight Loss %
3.2. Decay Percentage
3.3. Fruit Juice Content
3.4. Vitamin C (mg 100 g−1 FW)
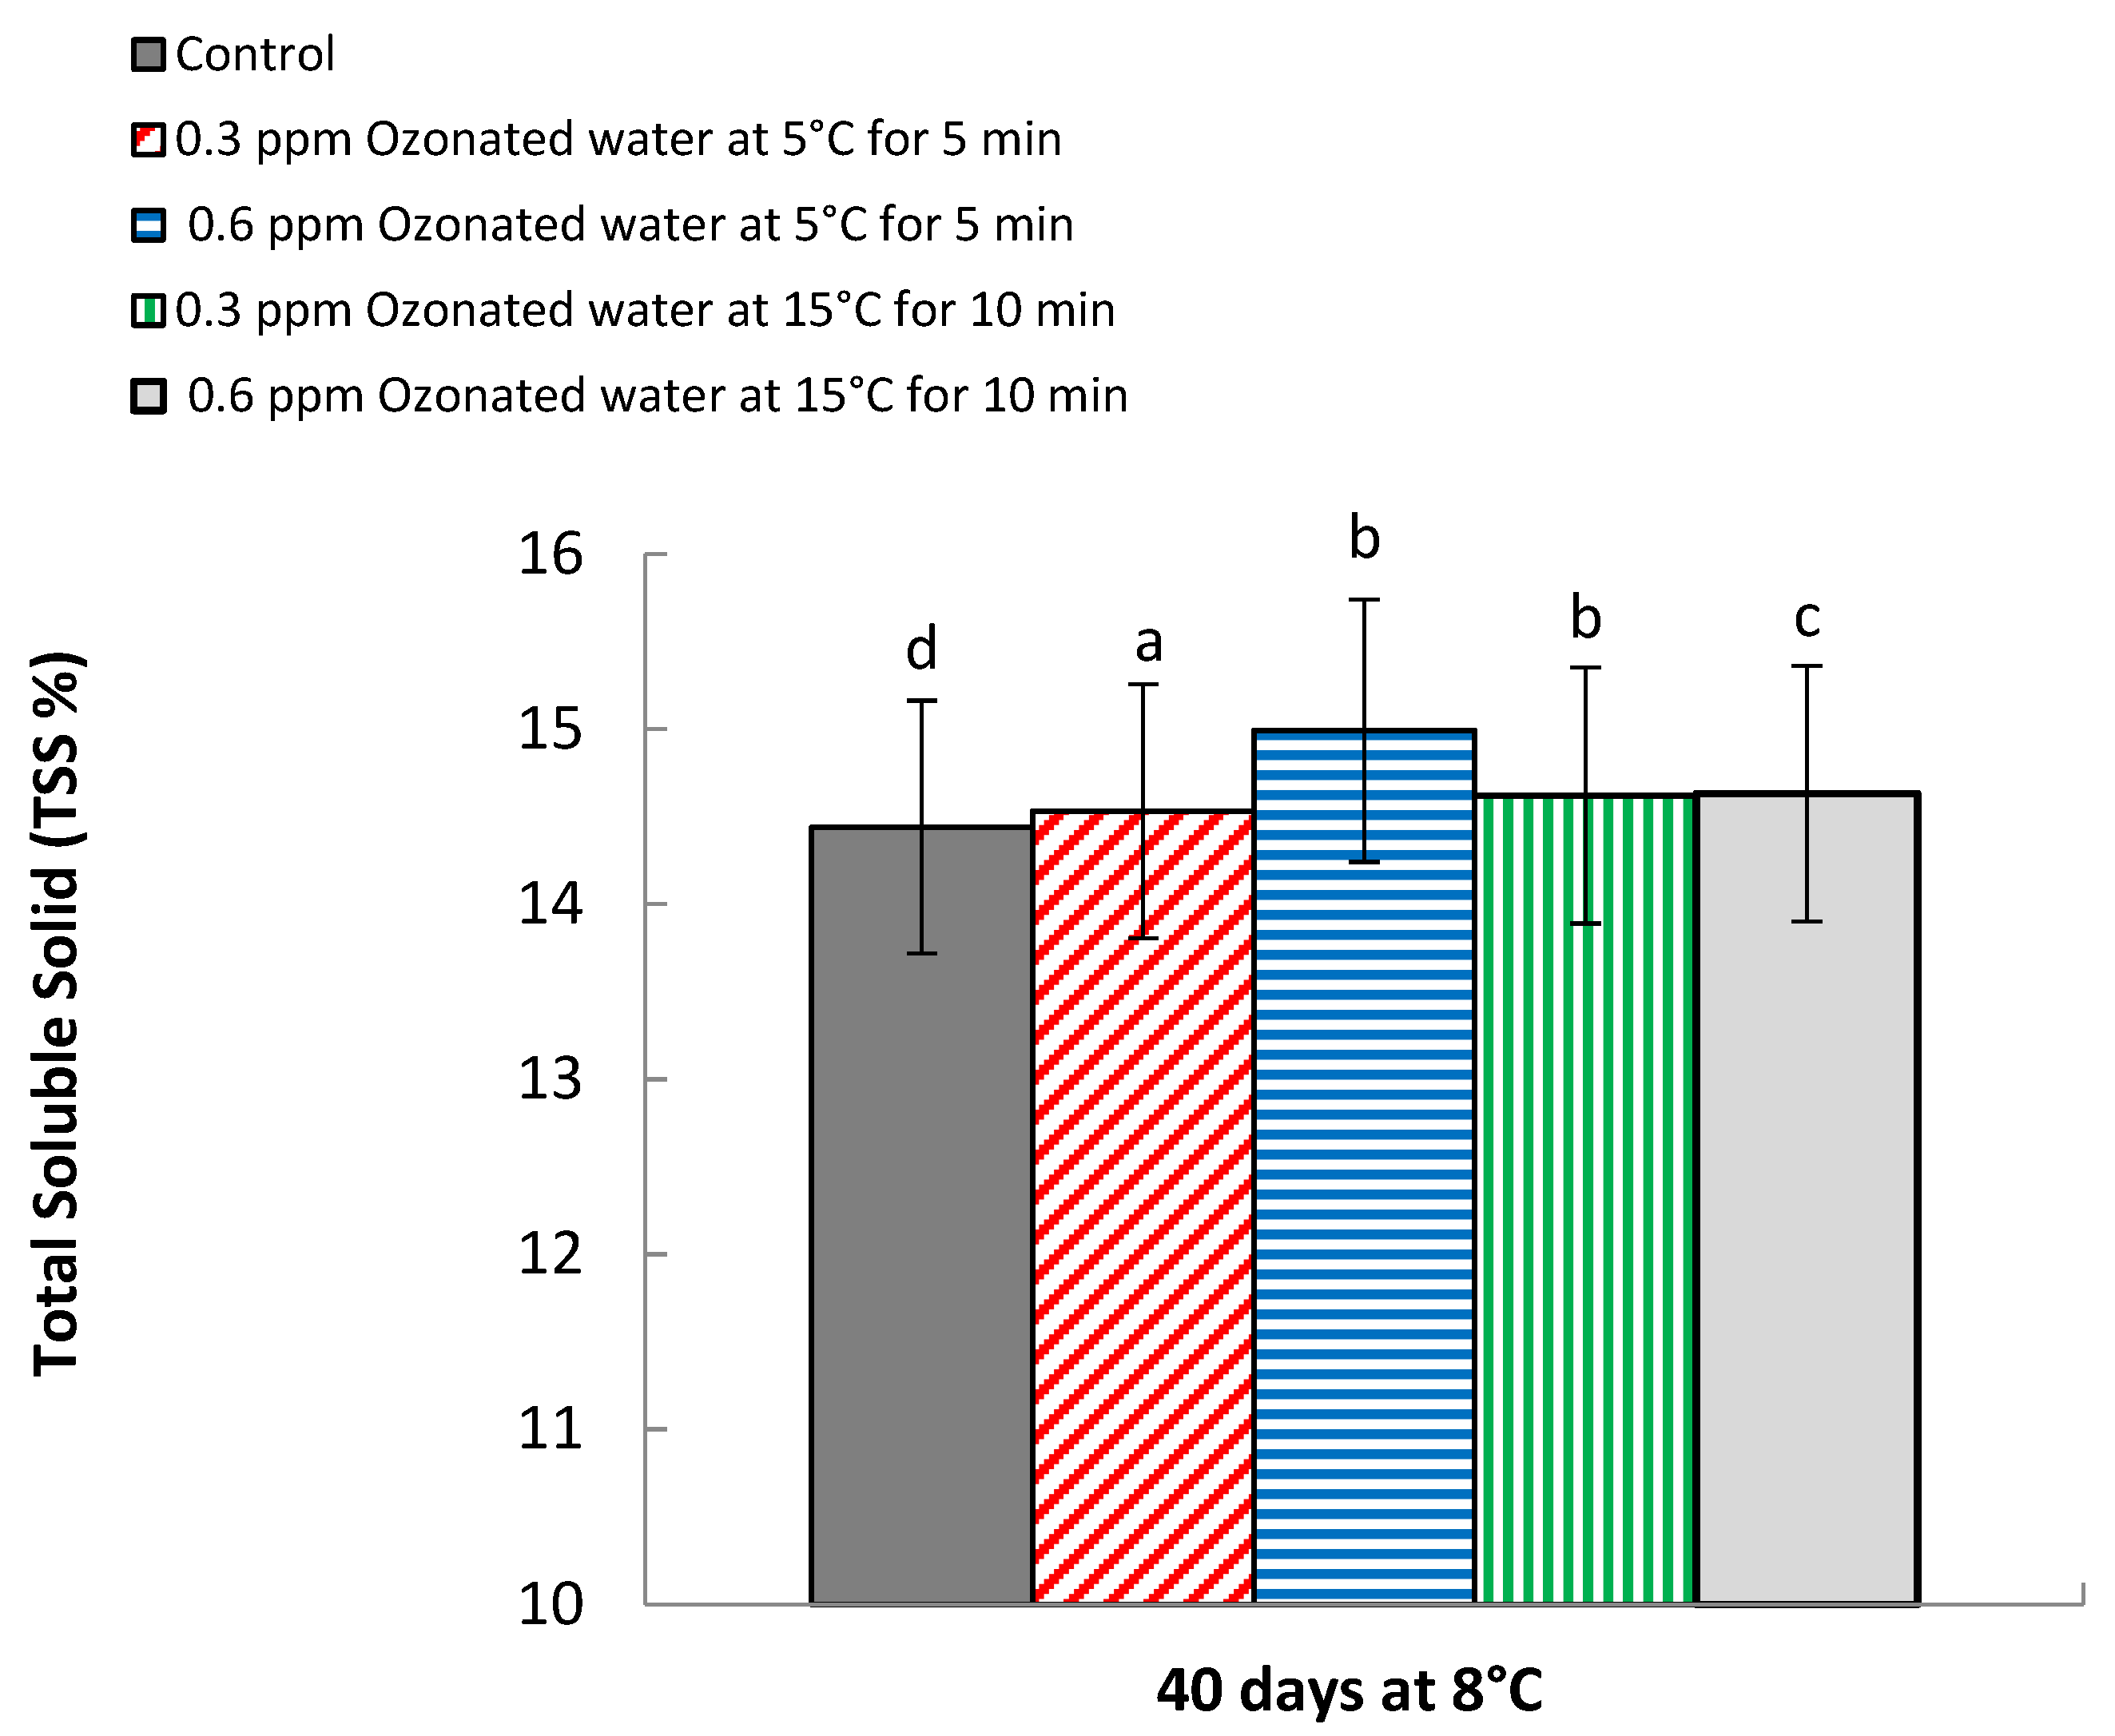
3.5. Total Soluble Solid (TSS %)
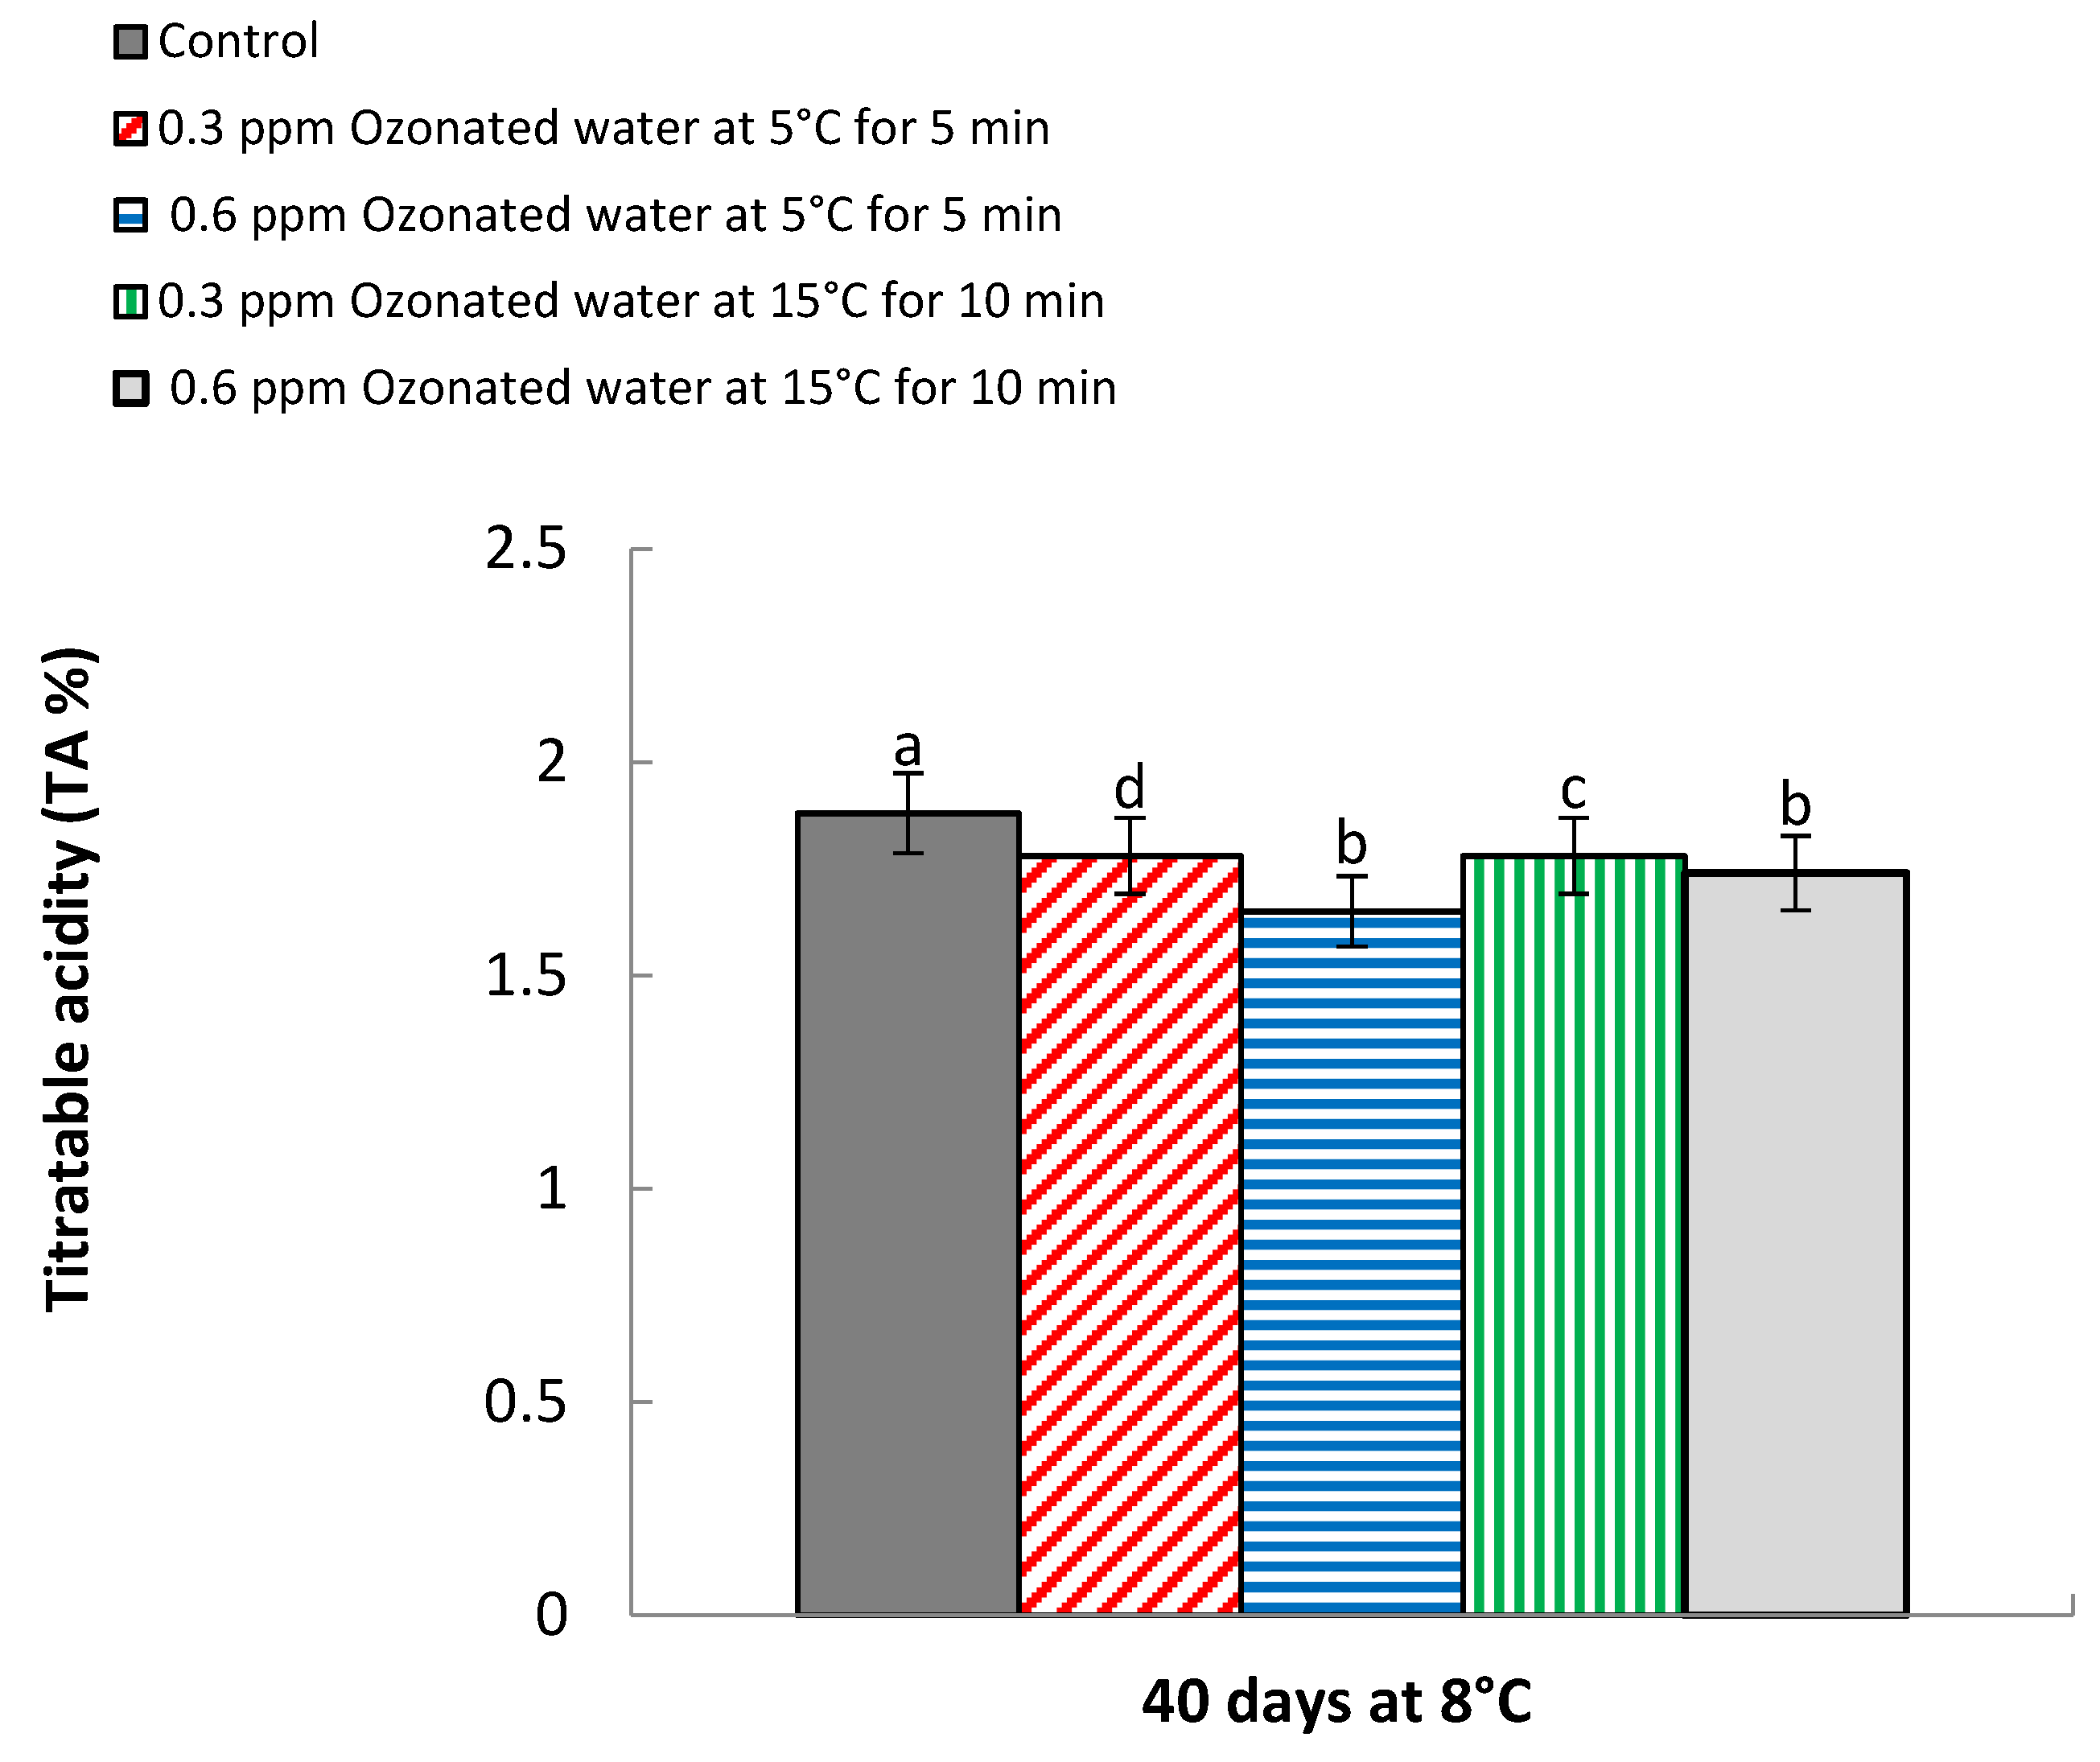
3.6. Titratable Acidity (TA %)
3.7. TSS/Acid Ratio (%)
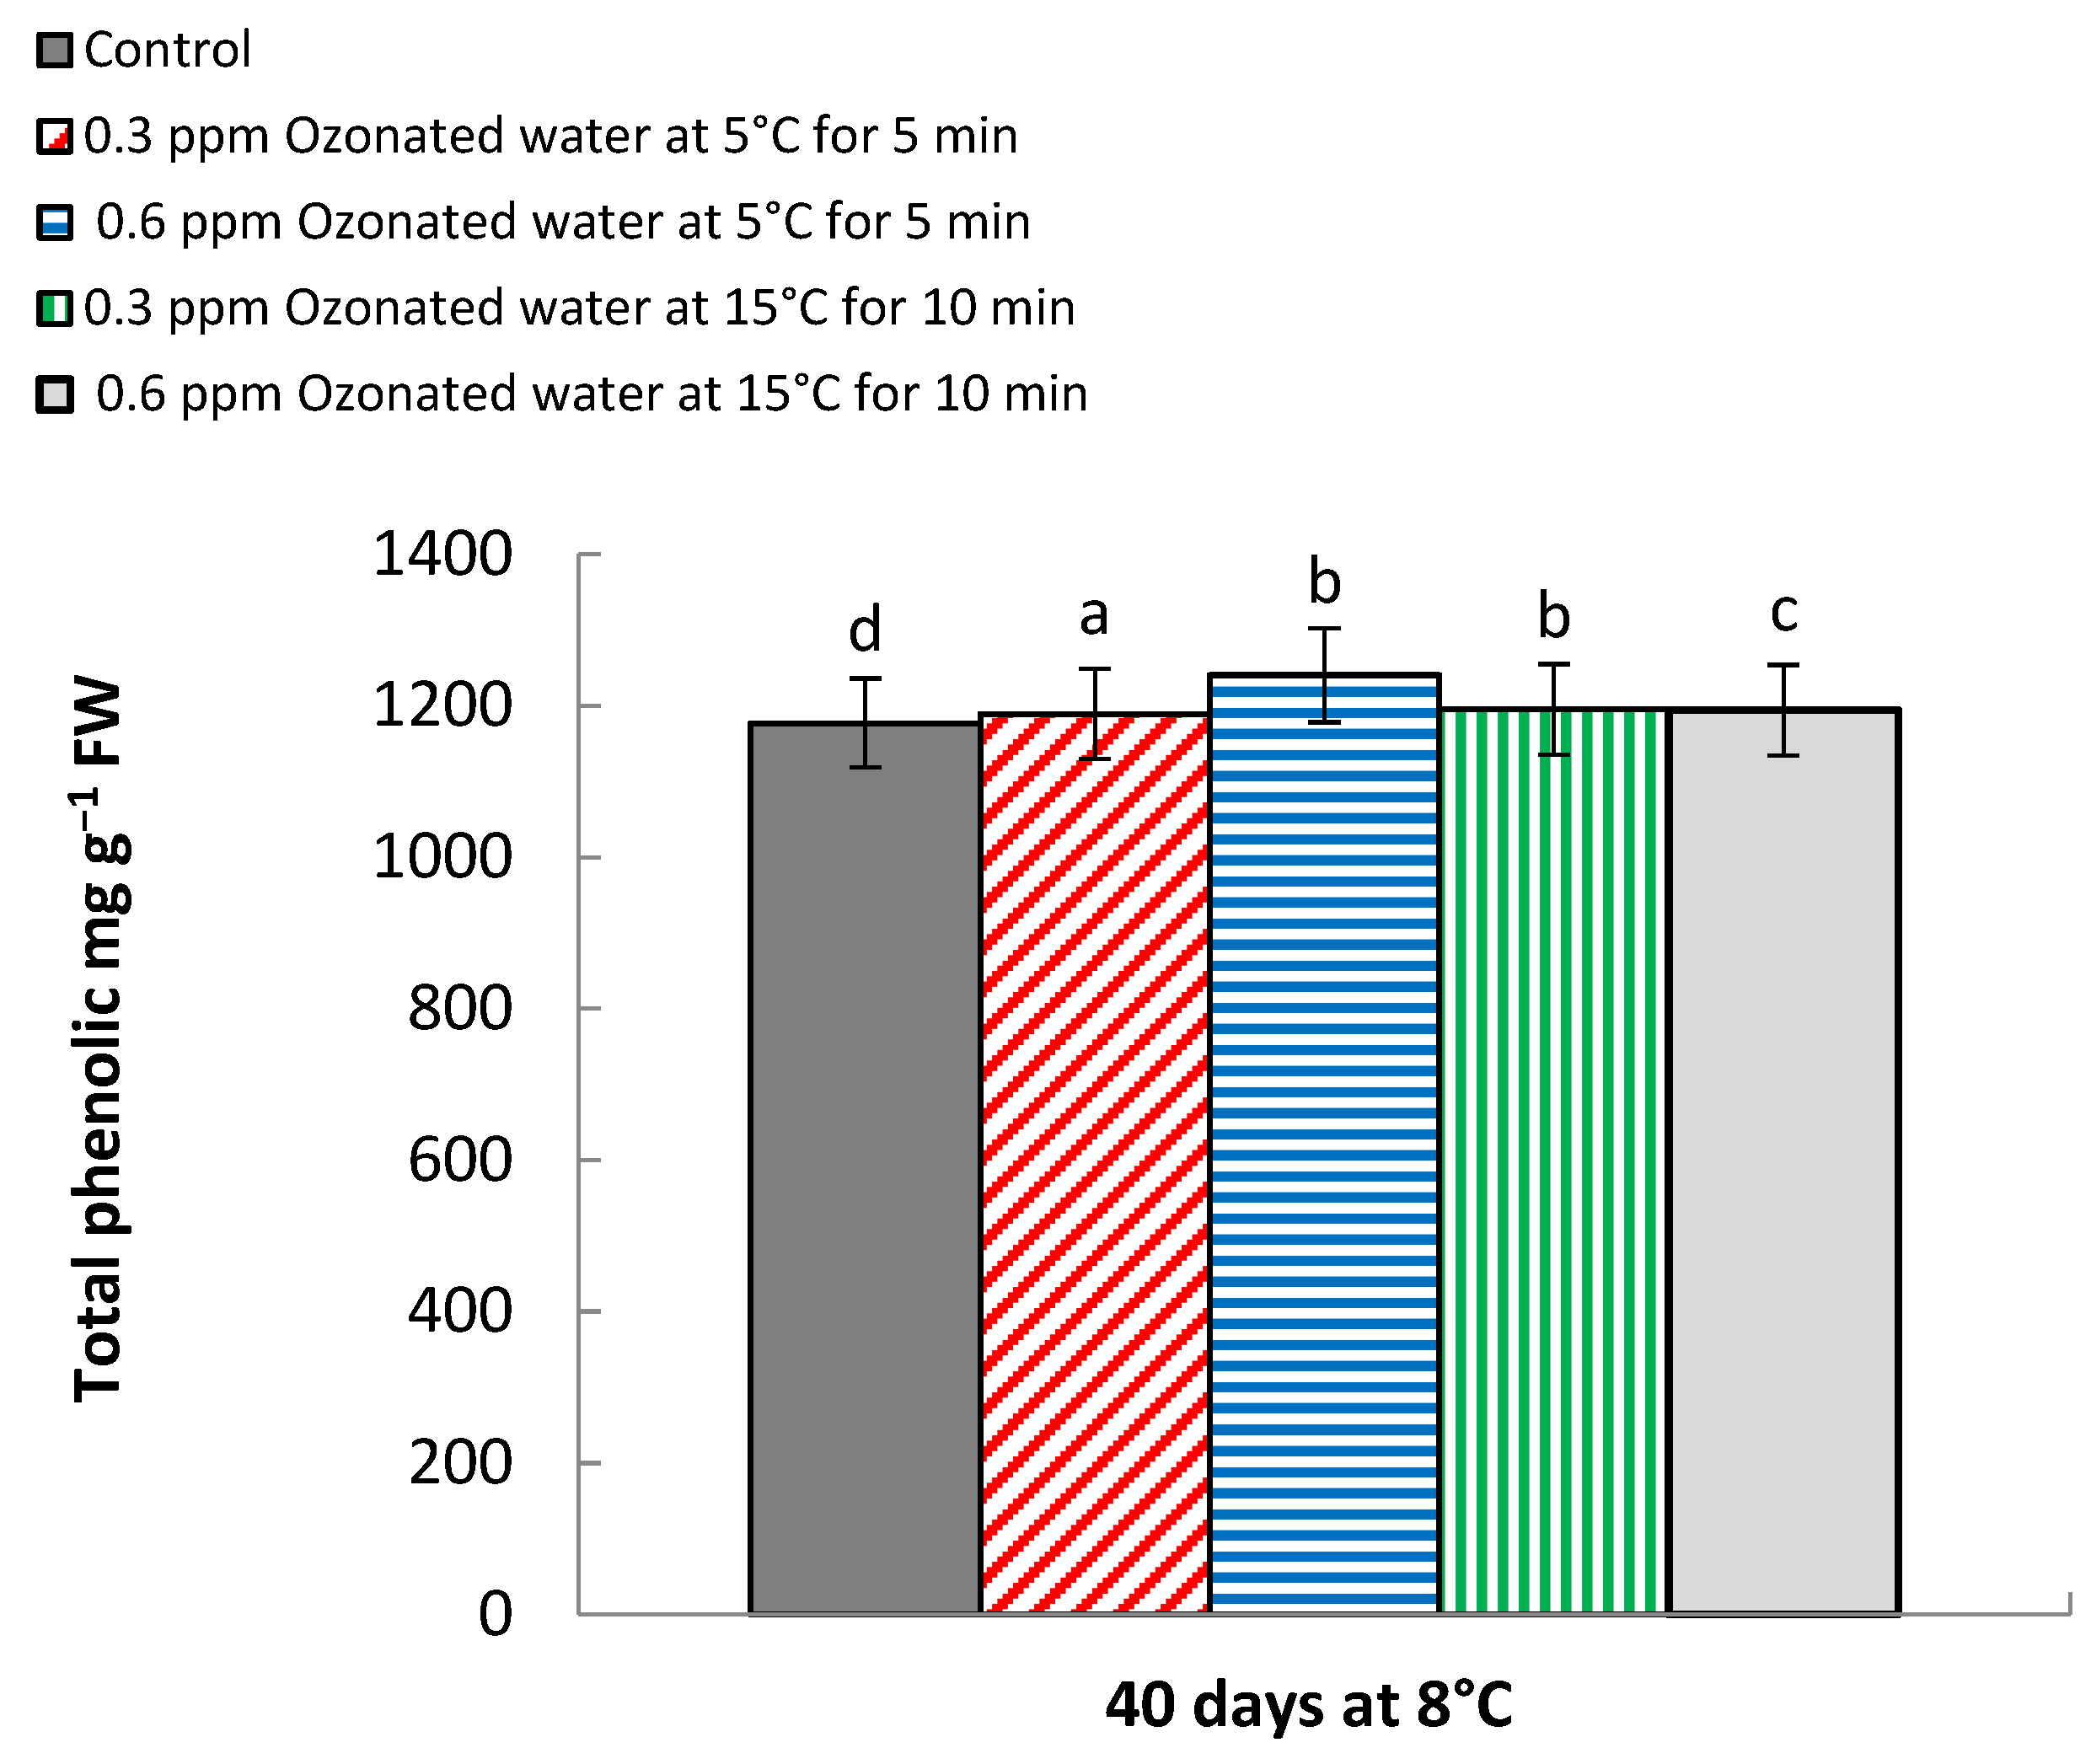
3.8. Total Phenolic Contents (mg g−1 FW)
3.9. Lycopene Assay (mg 100 mL−1)
3.10. Antioxidant % (DPPH Radical Scavenging Assay)
4. Discussion
5. Conclusions
Author Contributions
Funding
Institutional Review Board Statement
Informed Consent Statement
Data Availability Statement
Acknowledgments
Conflicts of Interest
References
- Singh, S.; Gill, P.; Aulakh, P.; Singh, S. Changes of minerals in fruit peel and pulp of grapefruit (Citrus paradisi Macf.) cv. Star Ruby during fruit development. Res. Crops 2015, 16, 669–674. [Google Scholar] [CrossRef]
- Zhu, X.; Jiang, J.; Yin, C.; Li, G.; Jiang, Y.; Shan, Y. Effect of ozone treatment on flavonoid accumulation of Satsuma mandarin (Citrus unshiu Marc.) during ambient storage. Biomolecules 2019, 9, 821. [Google Scholar]
- Pailly, O.; Tison, G.; Amouroux, A. Harvest time and storage conditions of ‘Star Ruby’grapefruit (Citrus paradisi Macf.) for short distance summer consumption. Postharvest Biol. Technol. 2004, 34, 65–73. [Google Scholar] [CrossRef]
- Regnier, T.; Combrinck, S.; Veldman, W.; Du Plooy, W. Application of essential oils as multi-target fungicides for the control of Geotrichum citri-aurantii and other postharvest pathogens of citrus. Ind. Crops Prod. 2014, 61, 151–159. [Google Scholar] [CrossRef]
- García-Martín, J.F.; Olmo, M.; García, J.M. Effect of ozone treatment on postharvest disease and quality of different citrus varieties at laboratory and at industrial facility. Postharvest Biol. Technol. 2018, 137, 77–85. [Google Scholar] [CrossRef] [Green Version]
- Lafuente, M.; Zacarias, L.; Sala, J.; Sanchez-Ballesta, M.; Gosalbes, M.; Marcos, J.; Gonzalez-Candelas, L.; Lluch, Y.; Granell, A. Understanding the basis of chilling injury in citrus fruit. Acta Hortic. 2005, 682, 831–842. [Google Scholar] [CrossRef]
- Pinto, L.; Baruzzi, F.; Ippolito, A. Recent advances to control spoilage microorganisms in washing water of fruits and vegetables: The use of electrolyzed water. In Proceedings of the III International Symposium on Postharvest Pathology: Using Science to Increase Food Availability 1144, Bari, Italy, 7 June 2015; pp. 379–384. [Google Scholar]
- Zamuner, C.F.; Dilarri, G.; Bonci, L.C.; Saldanha, L.L.; Behlau, F.; Marin, T.G.; Sass, D.C.; Bacci, M.; Ferreira, H. A cinnamaldehyde-based formulation as an alternative to sodium hypochlorite for post-harvest decontamination of citrus fruit. Trop. Plant Pathol. 2020, 45, 701–709. [Google Scholar]
- Kopacki, M.; Pawłat, J.; Skwaryło-Bednarz, B.; Jamiołkowska, A.; Stępniak, P.M.; Kiczorowski, P.; Golan, K. Physical crop postharvest storage and protection methods. Agronomy 2021, 11, 93. [Google Scholar] [CrossRef]
- Duan, X.; Jing, G.; Fan, F.; Tao, N. Control of postharvest green and blue molds of citrus fruit by application of sodium dehydroacetate. Postharvest Biol. Technol. 2016, 113, 17–19. [Google Scholar] [CrossRef]
- Papoutsis, K.; Mathioudakis, M.M.; Hasperué, J.H.; Ziogas, V. Non-chemical treatments for preventing the postharvest fungal rotting of citrus caused by Penicillium digitatum (green mold) and Penicillium italicum (blue mold). Trends Food Sci. Technol. 2019, 86, 479–491. [Google Scholar] [CrossRef]
- Shezi, S.; Magwaza, L.S.; Mditshwa, A.; Tesfay, S.Z. Changes in biochemistry of fresh produce in response to ozone postharvest treatment. Sci. Hortic. 2020, 269, 109397. [Google Scholar] [CrossRef]
- Campayo, A.; Serrano de la Hoz, K.; García-Martínez, M.M.; Salinas, M.R.; Alonso, G.L. Novel endotherapy-based applications of ozonated water to Bobal grapevines: Effect on grape quality. Agronomy 2020, 10, 1218. [Google Scholar] [CrossRef]
- Tzortzakis, N.; Singleton, I.; Barnes, J. Deployment of low-level ozone-enrichment for the preservation of chilled fresh produce. Postharvest Biol. Technol. 2007, 43, 261–270. [Google Scholar] [CrossRef]
- Ali, A.; Ong, M.K.; Forney, C.F. Effect of ozone pre-conditioning on quality and antioxidant capacity of papaya fruit during ambient storage. Food Chem. 2014, 142, 19–26. [Google Scholar] [CrossRef] [PubMed]
- Rice, R.G. Handbook of Ozone Technology and Applications. Ann. Arbor. Sci. 1982. Available online: https://ci.nii.ac.jp/naid/10010393623/ (accessed on 13 August 2021).
- Palou, L.; Smilanick, J.L.; Crisosto, C.H.; Mansour, M. Effect of gaseous ozone exposure on the development of green and blue molds on cold stored citrus fruit. Plant Dis. 2001, 85, 632–638. [Google Scholar]
- Seydim, G.; Greene, A.K.; Seydim, A. Use of ozone in the food industry. LWT-Food Sci. Technol. 2004, 37, 453–460. [Google Scholar] [CrossRef]
- Liu, C.; Ma, T.; Hu, W.; Tian, M.; Sun, L. Effects of aqueous ozone treatments on microbial load reduction and shelf life extension of fresh-cut apple. Int. J. Food Sci. Technol. 2016, 51, 1099–1109. [Google Scholar]
- Zhu, F. Effect of ozone treatment on the quality of grain products. Food Chem. 2018, 264, 358–366. [Google Scholar] [CrossRef]
- Sachadyn-Król, M.; Agriopoulou, S. Ozonation as a method of abiotic elicitation improving the health-promoting properties of plant products—A review. Molecules 2020, 25, 2416. [Google Scholar] [CrossRef]
- Ong, K.; Cash, J.; Zabik, M.; Siddiq, M.; Jones, A. Chlorine and ozone washes for pesticide removal from apples and processed apple sauce. Food Chem. 1996, 55, 153–160. [Google Scholar]
- Artés-Hernández, F.; Artés, F.; Tomás-Barberán, F.A. Quality and enhancement of bioactive phenolics in cv. Napoleon table grapes exposed to different postharvest gaseous treatments. J. Agric. Food Chem. 2003, 51, 5290–5295. [Google Scholar] [CrossRef] [PubMed]
- Lin, S.; Chen, C.; Luo, H.; Xu, W.; Zhang, H.; Tian, J.; Ju, R.; Wang, L. The combined effect of ozone treatment and polyethylene packaging on postharvest quality and biodiversity of Toona sinensis (A. Juss.) M. Roem. Postharvest Biol. Technol. 2019, 154, 1–10. [Google Scholar]
- Miller, F.A.; Silva, C.L.; Brandão, T.R. A review on ozone-based treatments for fruit and vegetables preservation. Food Eng. Rev. 2013, 5, 77–106. [Google Scholar]
- Alencar, E.R.; Faroni, L.R.; Pinto, M.S.; da Costa, A.R.; Carvalho, A.F. Effectiveness of ozone on postharvest conservation of pear (Pyrus communis L.). J. Food Processing Technol. 2014, 5, 317. [Google Scholar]
- Karaca, H. Use of ozone in the citrus industry. Ozone Sci. Eng. 2010, 32, 122–129. [Google Scholar]
- Tarabih, M.; El-Eryan, E. Glycine Betaine and Proline with Thinning Technique for Resistance Abiotic Stress of Cristalina Cactus Pear. Pak. J. Biol. Sci. PJBS 2020, 23, 68–80. [Google Scholar] [CrossRef] [PubMed]
- Ali, H.M.; El-Abeid, S.E.; Shaaban, S.A. Effect of Some Organic Acids on Growth, Yield, Oil Production and Enhancing Anatomical Changes to Reduce Fusarium Wilt of Nigella sativa L. Plant 2020, 20, 9231–9243. [Google Scholar]
- EL-Eryan, E.; Tarabih, M.; EL-Metwally, M. Influence of natural extracts dipping to maintenance fruit quality and shelf life of Egyptian guava. J. Plant Prod. 2017, 8, 1431–1438. [Google Scholar] [CrossRef] [Green Version]
- Rokaya, P.R.; Baral, D.R.; Gautam, D.M.; Shrestha, A.K.; Paudyal, K.P. Effect of postharvest treatments on quality and shelf Life of mandarin (Citrus reticulata Blanco). Am. J. Plant Sci. 2016, 7, 1098. [Google Scholar] [CrossRef] [Green Version]
- Ranganna, S. Hand Book of Analysis and Quality Control for Fruit and Vegetable Products, 2nd ed.; Tata McGraw-Hill Education: New, York, NY, USA, 1995; pp. 30–65. [Google Scholar]
- AOAC. Official Methods of Analysis, 16th ed.; Association of Official Analytical Chemists: Washington, DC, USA, 2005; Volume 16. [Google Scholar]
- Rao, A.; Waseem, Z.; Agarwal, S. Lycopene content of tomatoes and tomato products and their contribution to dietary lycopene. Food Res. Int. 1998, 31, 737–741. [Google Scholar] [CrossRef]
- Fish, W.W.; Perkins-Veazie, P.; Collins, J.K. A quantitative assay for lycopene that utilizes reduced volumes of organic solvents. J. Food Compos. Anal. 2002, 15, 309–317. [Google Scholar] [CrossRef] [Green Version]
- Lee, M.; Chen, B. Separation of lycopene and itscis isomers by liquid chromatography. Chromatographia 2001, 54, 613–617. [Google Scholar] [CrossRef]
- Jayaprakasha, G.K.; Singh, R.; Sakariah, K. Antioxidant activity of grape seed (Vitis vinifera) extracts on peroxidation models in vitro. Food Chem. 2001, 73, 285–290. [Google Scholar] [CrossRef]
- Ao, C.; Li, A.; Elzaawely, A.A.; Xuan, T.D.; Tawata, S. Evaluation of antioxidant and antibacterial activities of Ficus microcarpa L. fil. extract. Food Control 2008, 19, 940–948. [Google Scholar] [CrossRef]
- Tarabih, M. Maintenance Quality and Reduce Chilling Injury of Naomi Mango Fruits During Cold Quarantine. Pak. J. Biol. Sci. PJBS 2020, 23, 190–205. [Google Scholar] [CrossRef]
- O’Donnell, C.; Tiwari, B.; Cullen, P.; Rice, R.G. Ozone in Food Processing; Blackwell Publishing: Hoboken, NJ, USA, 2012. [Google Scholar]
- Zalewska, M.; Górska-Horczyczak, E.; Marcinkowska-Lesiak, M. Effect of Applied Ozone Dose, Time of Ozonization, and Storage Time on Selected Physicochemical Characteristics of Mushrooms (Agaricus bisporus). Agriculture 2021, 11, 748. [Google Scholar] [CrossRef]
- Rice, R.G.; Robson, C.M.; Miller, G.W.; Hill, A.G. Uses of ozone in drinking water treatment. J. -Am. Water Work. Assoc. 1981, 73, 44–57. [Google Scholar] [CrossRef]
- Palou, L.; Smilanick, J.L.; Margosan, D.A. Ozone applications for sanitation and control of postharvest diseases of fresh fruits and vegetables. In Recent Advances in Alternative Postharvest Technologies to Control Fungal Diseases in Fruits and Vegetables; Transworld Research Network: Trivandrum, India, 2007; pp. 39–70. [Google Scholar]
- Strano, M.C.; Timpanaro, N.; Allegra, M.; Foti, P.; Pangallo, S.; Romeo, F.V. Effect of ozonated water combined with sodium bicarbonate on microbial load and shelf life of cold stored clementine (Citrus clementina Hort. ex Tan.). Sci. Hortic. 2021, 276, 109775. [Google Scholar] [CrossRef]
- Özdemir, A.E.; Candir, E.E.; Kaplankiran, M.; Soylu, E.M.; Şahinler, N.; Gül, A. The effects of ethanol-dissolved propolis on the storage of grapefruit cv. Star Ruby. Turk. J. Agric. For. 2010, 34, 155–162. [Google Scholar]
- Freitas-Silva, O.; Venâncio, A. Ozone applications to prevent and degrade mycotoxins: A review. Drug Metab. Rev. 2010, 42, 612–620. [Google Scholar] [CrossRef] [PubMed]
- Horvitz, S.; Arancibia, M.; Arroqui, C.; Chonata, E.; Vírseda, P. Effects of Gaseous Ozone on Microbiological Quality of Andean Blackberries (Rubus glaucus Benth). Foods 2021, 10, 2039. [Google Scholar] [CrossRef] [PubMed]
- Lim, J.; Song, J.-S.; Eom, S.; Yoon, J.W.; Ji, S.-H.; Kim, S.B.; Ryu, S. The Effect of Gaseous Ozone Generated by Surface Dielectric Barrier Discharge on the Decay and Quality of Stored Onion Bulbs. Agronomy 2021, 11, 1058. [Google Scholar] [CrossRef]
- Cayuela, J.A.; Vázquez, A.; Pérez, A.; García, J. Control of table grapes postharvest decay by ozone treatment and resveratrol induction. Food Sci. Technol. Int. 2009, 15, 495–502. [Google Scholar] [CrossRef]
- Kim, J.-G.; Yousef, A.E.; Dave, S. Application of ozone for enhancing the microbiological safety and quality of foods: A review. J. Food Prot. 1999, 62, 1071–1087. [Google Scholar] [CrossRef] [PubMed]
- Sakhale, B.; Kapse, B. Short communication Studies on shelf life extension of sweet oranges (Citrus sinensis L.). Int. Food Res. J. 2012, 19, 779–781.3p. [Google Scholar]
- El-Anany, A.; Hassan, G.; Ali, F.R. Effects of edible coatings on the shelf-life and quality of Anna apple (Malus domestica Borkh) during cold storage. J. Food Technol. 2009, 7, 5–11. [Google Scholar]
- Horvitz, S.; Cantalejo, M. Application of ozone for the postharvest treatment of fruits and vegetables. Crit. Rev. Food Sci. Nutr. 2014, 54, 312–339. [Google Scholar] [CrossRef]
- Foyer, C.H.; Noctor, G. Ascorbate and glutathione: The heart of the redox hub. Plant Physiol. 2011, 155, 2–18. [Google Scholar] [CrossRef] [Green Version]
- Shwartz, E.; Glazer, I.; Bar-Ya’akov, I.; Matityahu, I.; Bar-Ilan, I.; Holland, D.; Amir, R. Changes in chemical constituents during the maturation and ripening of two commercially important pomegranate accessions. Food Chem. 2009, 115, 965–973. [Google Scholar] [CrossRef]
- Alam, M.S.; Kaur, B.; Gupta, K.; Kumar, S. Studies on refrigerated storage of minimally processed papaya (Carica papaya L.). Agric. Eng. Int. CIGR J. 2013, 15, 275–280. [Google Scholar]
- Yaman, Ö.; Bayoιndιrlι, L. Effects of an edible coating and cold storage on shelf-life and quality of cherries. LWT-Food Sci. Technol. 2002, 35, 146–150. [Google Scholar] [CrossRef]
- Silva, G.M.C.; Silva, W.B.; Medeiros, D.B.; Salvador, A.R.; Cordeiro, M.H.M.; da Silva, N.M.; Santana, D.B.; Mizobutsi, G.P. The chitosan affects severely the carbon metabolism in mango (Mangifera indica L. cv. Palmer) fruit during storage. Food Chem. 2017, 237, 372–378. [Google Scholar] [CrossRef] [PubMed]
- Karaca, H.; Velioglu, Y.S. Ozone applications in fruit and vegetable processing. Food Rev. Int. 2007, 23, 91–106. [Google Scholar] [CrossRef]
- Chebrolu, K.K.; Jayaprakasha, G.; Yoo, K.S.; Jifon, J.L.; Patil, B.S. An improved sample preparation method for quantification of ascorbic acid and dehydroascorbic acid by HPLC. LWT 2012, 47, 443–449. [Google Scholar] [CrossRef]
- Restuccia, C.; Lombardo, S.; Pandino, G.; Licciardello, F.; Muratore, G.; Mauromicale, G. An innovative combined water ozonisation/O3-atmosphere storage for preserving the overall quality of two globe artichoke cultivars. Innov. Food Sci. Emerg. Technol. 2014, 21, 82–89. [Google Scholar] [CrossRef]
- Sachadyn-Król, M.; Materska, M.; Chilczuk, B. Ozonation of hot red pepper fruits increases their antioxidant activity and changes some antioxidant contents. Antioxidants 2019, 8, 356. [Google Scholar] [CrossRef] [Green Version]
- Alquezar, B.; Rodrigo, M.J.; Lado, J.; Zacarías, L. A comparative physiological and transcriptional study of carotenoid biosynthesis in white and red grapefruit (Citrus paradisi Macf.). Tree Genet. Genomes 2013, 9, 1257–1269. [Google Scholar] [CrossRef]
- Javanmardi, J.; Kubota, C. Variation of lycopene, antioxidant activity, total soluble solids and weight loss of tomato during postharvest storage. Postharvest Biol. Technol. 2006, 41, 151–155. [Google Scholar] [CrossRef]
- Pan, Z.; Liu, Q.; Yun, Z.; Guan, R.; Zeng, W.; Xu, Q.; Deng, X. Comparative proteomics of a lycopene-accumulating mutant reveals the important role of oxidative stress on carotenogenesis in sweet orange (Citrus sinensis [L.] osbeck). Proteomics 2009, 9, 5455–5470. [Google Scholar] [CrossRef]
- Aizawa, K.; Iwasaki, Y.; Ouchi, A.; Inakuma, T.; Nagaoka, S.-i.; Terao, J.; Mukai, K. Development of singlet oxygen absorption capacity (SOAC) assay method. 2. Measurements of the SOAC values for carotenoids and food extracts. J. Agric. Food Chem. 2011, 59, 3717–3729. [Google Scholar] [CrossRef] [PubMed]
- Valenzuela, J.L.; Manzano, S.; Palma, F.; Carvajal, F.; Garrido, D.; Jamilena, M. Oxidative stress associated with chilling injury in immature fruit: Postharvest technological and biotechnological solutions. Int. J. Mol. Sci. 2017, 18, 1467. [Google Scholar] [CrossRef] [PubMed]
- Botondi, R.; Barone, M.; Grasso, C. A Review into the Effectiveness of Ozone Technology for Improving the Safety and Preserving the Quality of Fresh-Cut Fruits and Vegetables. Foods 2021, 10, 748. [Google Scholar] [CrossRef] [PubMed]
- Alothman, M.; Kaur, B.; Fazilah, A.; Bhat, R.; Karim, A.A. Ozone-induced changes of antioxidant capacity of fresh-cut tropical fruits. Innov. Food Sci. Emerg. Technol. 2010, 11, 666–671. [Google Scholar] [CrossRef]
- Gonzalez-Aguilar, G.A.; Villa-Rodriguez, J.A.; Ayala-Zavala, J.F.; Yahia, E.M. Improvement of the antioxidant status of tropical fruits as a secondary response to some postharvest treatments. Trends Food Sci. Technol. 2010, 21, 475–482. [Google Scholar] [CrossRef]


| Treatments | Weight Loss (%) * | Decay (%) * | ||
|---|---|---|---|---|
| 2018 | 2019 | 2018 | 2019 | |
| 0.00 f | 0.00 f | 0.00 e | 0.00 f | |
| Control | 11.25 a | 11.13 a | 10.21 a | 10.36 a |
| 0.3 ppm ozonated water at 5 °C for 5 min | 0.00 f | 0.00 f | 0.00 e | 0.00 f |
| 5.60 d | 5.63 d | 5.23 c | 5.26 d | |
| 0.6 ppm ozonated water at 5 °C for 5 min | 0.00 g | 0.00 f | 0.00 e | 0.00 f |
| 4.83 e | 4.81 e | 4.73 d | 4.85 e | |
| 0.3 ppm ozonated water at 15 °C for 10 min | 0.00 f | 0.00 f | 0.00 e | 0.00 f |
| 6.75 b | 6.92 b | 6.06 b | 6.15 c | |
| 0.6 ppm ozonated water at 15 °C for 10 min | 0.00 f | 0.00 f | 0.00 e | 0.00 f |
| 5.81 c | 5.71 c | 6.08 b | 6.25 b | |
| Treatments | Storage Period (days) | Fruit Juice | Vitamin C | ||
|---|---|---|---|---|---|
| (%) * | (mg 100 g−1 FW) * | ||||
| 2018 | 2019 | 2018 | 2019 | ||
| 0 | 55.30 a | 53.85 a | 52.26 a | 51.0 a | |
| Control | 40 | 40.17 d | 41.17 d | 45.26 e | 44.26 e |
| 0.3 ppm ozonated water at 5 °C for 5 min | 0 | 55.30 a | 53.85 a | 52.26 a | 51.0 a |
| 40 | 45.08 c | 44.06 c | 46.16 c | 45.11 c | |
| 0.6 ppm ozonated water at 5 °C for 5 min | 0 | 55.30 a | 53.85 a | 52.26 a | 51.0 a |
| 40 | 45.76 b | 44.66 b | 46.54 b | 45.53 b | |
| 0.3 ppm ozonated water at 15 °C for 10 min | 0 | 55.30 a | 53.85 a | 52.26 a | 51.0 a |
| 40 | 45.0 c | 44.07 c | 46.03 cd | 45.0 d | |
| 0.6 ppm ozonated water at 15 °C for 10 min | 0 | 55.30 a | 53.85 a | 52.26 a | 51.0 a |
| 40 | 45.0 c | 44.08 c | 45.75 d | 45.06 c | |
| Storage Period (Days) | TSS (%) * | Titratable Acidity (%) * | |||
|---|---|---|---|---|---|
| 2018 | 2019 | 2018 | 2019 | ||
| 0 | 13.98 e | 13.84 f | 2.05 a | 1.95 a | |
| Control | 40 | 14.64 d | 14.24 e | 1.94 b | 1.81 b |
| 0.3 ppm ozonated water at 5 °C for 5 min | 0 | 13.98 e | 13.84 f | 2.05 a | 1.95 a |
| 40 | 14.73 c | 14.33 d | 1.84 c | 1.73 c | |
| 0.6 ppm ozonated water at 5 °C for 5 min | 0 | 13.98 e | 13.84 f | 2.05 a | 1.95 a |
| 40 | 15.06 a | 14.91 a | 1.70 d | 1.60 e | |
| 0.3 ppm ozonated water at 15 °C for 10 min | 0 | 13.98 e | 13.84 f | 2.05 a | 1.95 a |
| 40 | 14.77 c | 14.46 b | 1.83 c | 1.73 c | |
| 0.6 ppm ozonated water at 15 °C for 10 min | 0 | 13.98 e | 13.84 f | 2.05 a | 1.95 a |
| 40 | 14.86 b | 14.40 c | 1.78 c | 1.70 d | |
| Treatments | Storage Period (Days) | TSS/acid Ratio (%) * | Total Phenolic | ||
|---|---|---|---|---|---|
| (mg g−1 FW) * | |||||
| 2018 | 2019 | 2018 | 2019 | ||
| 0 | 6.81 e | 7.09 e | 1093 e | 1099 f | |
| Control | 40 | 7.54 d | 7.88 d | 1182 d | 1172 e |
| 0.3 ppm ozonated water at 5 °C for 5 min | 0 | 6.81 e | 7.09 e | 1093 e | 1099 f |
| 40 | 8.0 c | 8.28 c | 1186 c | 1192 d | |
| 0.6 ppm ozonated water at 5 °C for 5 min | 0 | 6.81 e | 7.09 e | 1093 e | 1099 f |
| 40 | 8.85 a | 9.31 a | 1235 a | 1245 a | |
| 0.3 ppm ozonated water at 15 °C for 10 min | 0 | 6.81 e | 7.09 e | 1093 e | 1099 f |
| 40 | 8.07 c | 8.35 c | 1191 b | 1200 b | |
| 0.6 ppm ozonated water at 15 °C for 10 min | 0 | 6.81 e | 7.09 e | 1093 e | 1099 f |
| 40 | 8.34 b | 8.47 b | 1192 b | 1196 c | |
| Treatments | Storage Period (Days) | Lycopene | Antioxidant activity (%) * | ||
|---|---|---|---|---|---|
| (mg 100 mL−1) * | |||||
| 2018 | 2019 | 2018 | 2019 | ||
| 0 | 0.015 e | 0.018 f | 60.01 f | 61.33 c | |
| Control | 40 | 0.326 d | 0.360 e | 61.15 e | 62.0 bc |
| 0.3 ppm ozonated water at 5 °C for 5 min | 0 | 0.015 e | 0.018 f | 60.01 f | 61.33 c |
| 40 | 0.383 a | 0.420 b | 62.01 d | 62.13 b | |
| 0.6 ppm ozonated water at 5 °C for 5 min | 0 | 0.015 e | 0.018 f | 60.01 f | 61.33 c |
| 40 | 0.386 a | 0.450 a | 62.93 a | 63.10 a | |
| 0.3 ppm ozonated water at 15 °C for 10 min | 0 | 0.015 e | 0.018 f | 60.01 f | 61.33 c |
| 40 | 0.363 b | 0.383 c | 62.10 c | 62.23 b | |
| 0.6 ppm ozonated water at 15 °C for 10 min | 0 | 0.015 e | 0.018 f | 60.01 f | 61.33 c |
| 40 | 0.353 c | 0.370 d | 62.24 b | 62.30 b | |
Publisher’s Note: MDPI stays neutral with regard to jurisdictional claims in published maps and institutional affiliations. |
© 2022 by the authors. Licensee MDPI, Basel, Switzerland. This article is an open access article distributed under the terms and conditions of the Creative Commons Attribution (CC BY) license (https://creativecommons.org/licenses/by/4.0/).
Share and Cite
Kassem, H.S.; Tarabih, M.E.; Ismail, H.; Eleryan, E.E. Effectiveness of Ozonated Water for Preserving Quality and Extending Storability of Star Ruby Grapefruit. Processes 2022, 10, 277. https://doi.org/10.3390/pr10020277
Kassem HS, Tarabih ME, Ismail H, Eleryan EE. Effectiveness of Ozonated Water for Preserving Quality and Extending Storability of Star Ruby Grapefruit. Processes. 2022; 10(2):277. https://doi.org/10.3390/pr10020277
Chicago/Turabian StyleKassem, Hazem S., Mohamed E. Tarabih, Hamed Ismail, and Eman E. Eleryan. 2022. "Effectiveness of Ozonated Water for Preserving Quality and Extending Storability of Star Ruby Grapefruit" Processes 10, no. 2: 277. https://doi.org/10.3390/pr10020277
APA StyleKassem, H. S., Tarabih, M. E., Ismail, H., & Eleryan, E. E. (2022). Effectiveness of Ozonated Water for Preserving Quality and Extending Storability of Star Ruby Grapefruit. Processes, 10(2), 277. https://doi.org/10.3390/pr10020277