1. Introduction
As climate change and carbon-neutral issues emerge worldwide, interests in eco-friendly renewable energy and research and development requirements are increasing rapidly. Wave energy is a renewable energy source from the ocean, and it accounts for an irreversible proportion in terms of energy quantity [
1]. Wave energy converters (WECs) are used to generate power from wave energy. Among the different types of WECs, the oscillating water column (OWC) is the most widely used device because its main energy conversion unit is located in the air and has a simple structure [
2].
Pico Plant played the leading role in developing OWC technology and started operations in 1999. It powered Pico Island and was dismantled in 2018 after building abundant experience and valuable data in operation and maintenance [
3]. Mutriku OWC, which has operated since 2011, has achieved a capacity factor of 0.11 by combining the power generation history from 2014 to 2016 [
4]. In 2017, South Korea installed the Yongsoo OWC pilot plant with two 250 kW impulse turbines in the western sea of Jeju Island. It used the facility as a substation for the open-sea test site and a berth to test the air turbine installed on the OWC chamber. In addition, research is being conducted to demonstrate the feasibility of commercializing OWC technology in the United States (500 kW), Korea (30 kW), Italy (10 kW), and so on [
5].
When evaluating the energy conversion performance of an OWC pilot plant, it is necessary to estimate the airflow rate generated by the chamber. This airflow is related to the pneumatic energy input to the turbine. It is used as basic data for evaluating the energy conversion efficiency of the turbine and controlling power conversion. However, installing a sensor to measure the airflow rate directly in a duct installed in a pilot plant is unsuitable because of concerns about the transmitter failure and the obstruction of airflow into the turbine. Sensor failure may damage turbine systems. The method for estimating the flow rate by measuring the wave amplitude inside the chamber is also inefficient because of the high risk of damage to the extreme environment of the wave gauge. A method of reversely calculating the amplitude of waves inside the chamber from the water pressure and finally estimating the airflow rate to overcome such practical difficulties can be applied by installing a pressure sensor in the chamber water. This method does not interfere with the energy conversion process and has a low risk of damage.
In this study, a method for estimating the airflow of an OWC pilot plant was developed based on data measured using a water pressure sensor attached to the Yongsoo OWC pilot plant. The proposed method was first verified through computational fluid dynamics (CFD) simulations and then used to analyze real sea test data of the pilot plant. The feasibility of the proposed method was verified by comparing the results with the estimated airflow rate results obtained using another approach.
CFD has been used to analyze the energy conversion performance of the OWC chamber in relevant previous studies. Many validations have been conducted, such as evaluating air pressure and airflow rates and comparing them with the results of a two-dimensional wave flume model test. This is achieved by performing regular wave simulations using the volume of fluid (VOF) method for an OWC chamber modeled with an orifice or porous media [
6,
7,
8,
9,
10,
11,
12,
13]. The reliability of the simulation method based on Star-CCM+, a commercial software used in this study, was validated by comparing the model test results with the wave basin results of the sloped OWC model developed in a previous study [
14].
This paper presents a method for calculating the OWC airflow rate (called the “pressure method”). Moreover, the paper describes a verification process using CFD simulations and compares the interpolation method results based on a turbine performance chart called the “turbine DB method.” The comparison is performed based on the measurement data of the Yongsoo OWC pilot plant, which is in operation.
2. Method for Evaluating Airflow Rate
2.1. Description of Method
Due to the chamber wall structure, progressive waves entering the OWC chamber are partially converted to standing waves. The water pressure from the waves is divided into static and dynamic components, expressed as follows based on the linear wave theory [
15]:
where
is the total pressure of water,
is the hydrostatic pressure,
is the hydrodynamic pressure,
is the water density,
is the gravitational acceleration,
is the vertical coordinate for measuring the total pressure, which is negative below the mean sea level,
is the wave amplitude,
is the wave number, and
is the water depth.
The air pressure generated by the sealed chamber structure in the form of waves existed at the top of the wave formed inside the chamber. Because this air pressure acts on the entire water inside the chamber, the pressure component of Equation (1) can be expressed as Equation (2) by adding a pneumatic pressure term in the presence of the chamber. By combining Equations (1) and (2), the wave amplitude inside the OWC chamber can be expressed by Equation (3).
In Equation (3),
is the air pressure inside the chamber. Hence, the wave amplitude inside the chamber can be calculated using the total pressure and air pressure inside the chamber, and the airflow rate (
) entering the turbine can be estimated using the principle of mass conservation.
is the horizontal surface area inside the chamber. This method for estimating the airflow rate is called the “pressure method” for convenience.
2.2. Verification of Method through CFD Simulations
CFD analysis was performed using Star-CCM+. Based on incompressible three-dimensional unsteady Reynolds-Averaged Navier–Stokes equations, the k-epsilon turbulence model was adopted. The VOF method was applied to replicate the Stokes fifth-order regular waves. The turbine damping effect was modeled by replacing it with an orifice, and the orifice diameter was 40% of the duct diameter. The inlet and outlet were spaced apart by six times the incident wavelength (
) in the front and rear of the OWC chamber. The horizontal grid spacing (1/80 of the wavelength) and the vertical grid spacing (1/13 of the wave height) were applied around the mean sea level. The chamber length and orifice diameter were set to 1/30 and 1/17 size grids, respectively. A grid system consisting of approximately eight million cells was used for an incident wave period of 6 s and a wave height of 1.0 m.
Figure 1 shows the domain, boundary conditions, and grid systems used for the CFD simulations. The chamber shape of the Yongsoo OWC pilot plant was simplified and modeled, and the chamber length, width, skirt depth, skirt thickness, and duct inner diameters were 10, 35, 2, 1.7, and 1.8 m, respectively. The water depth of 16.5 m was considered in the simulation.
CFD simulations were performed for regular waves with a wave period of 6 s and a wave height of 1.0 m. The water pressure at the central position of the rear wall is located 5.73 m below the mean sea level inside the chamber, wave amplitude at the central point of the chamber horizontal plane, air pressure inside the chamber, and airflow rate passing through the duct were monitored during the simulations.
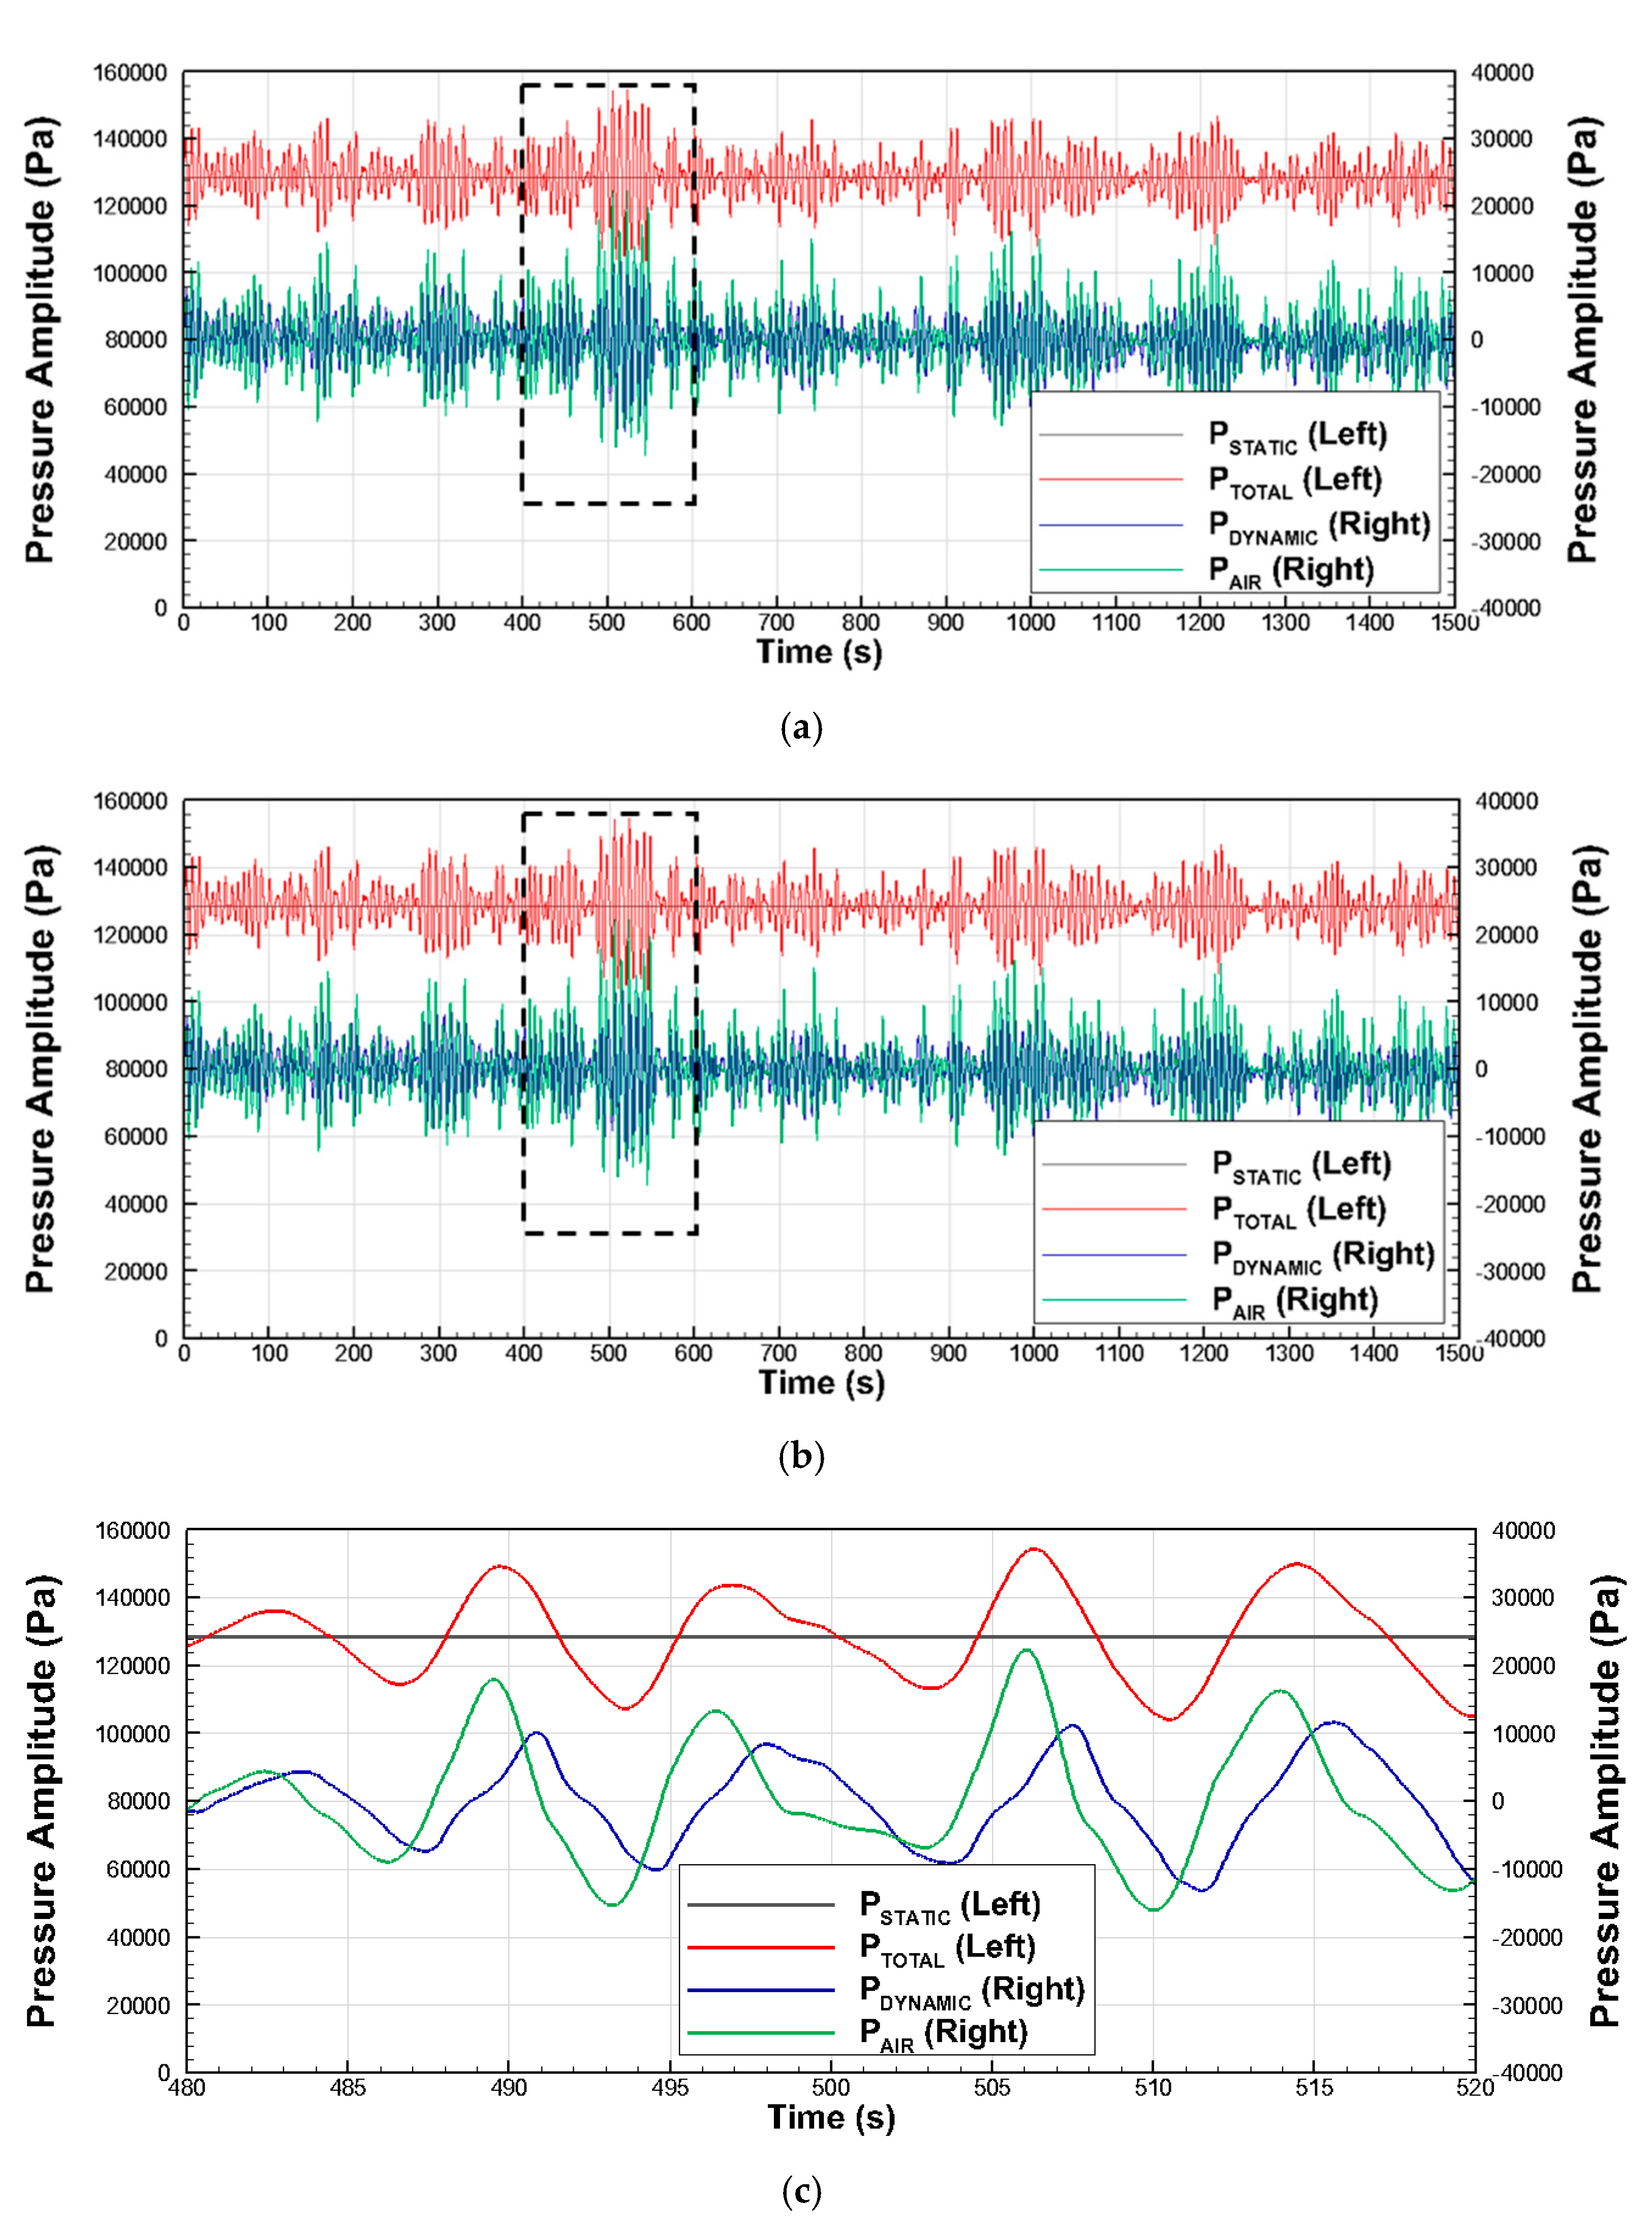
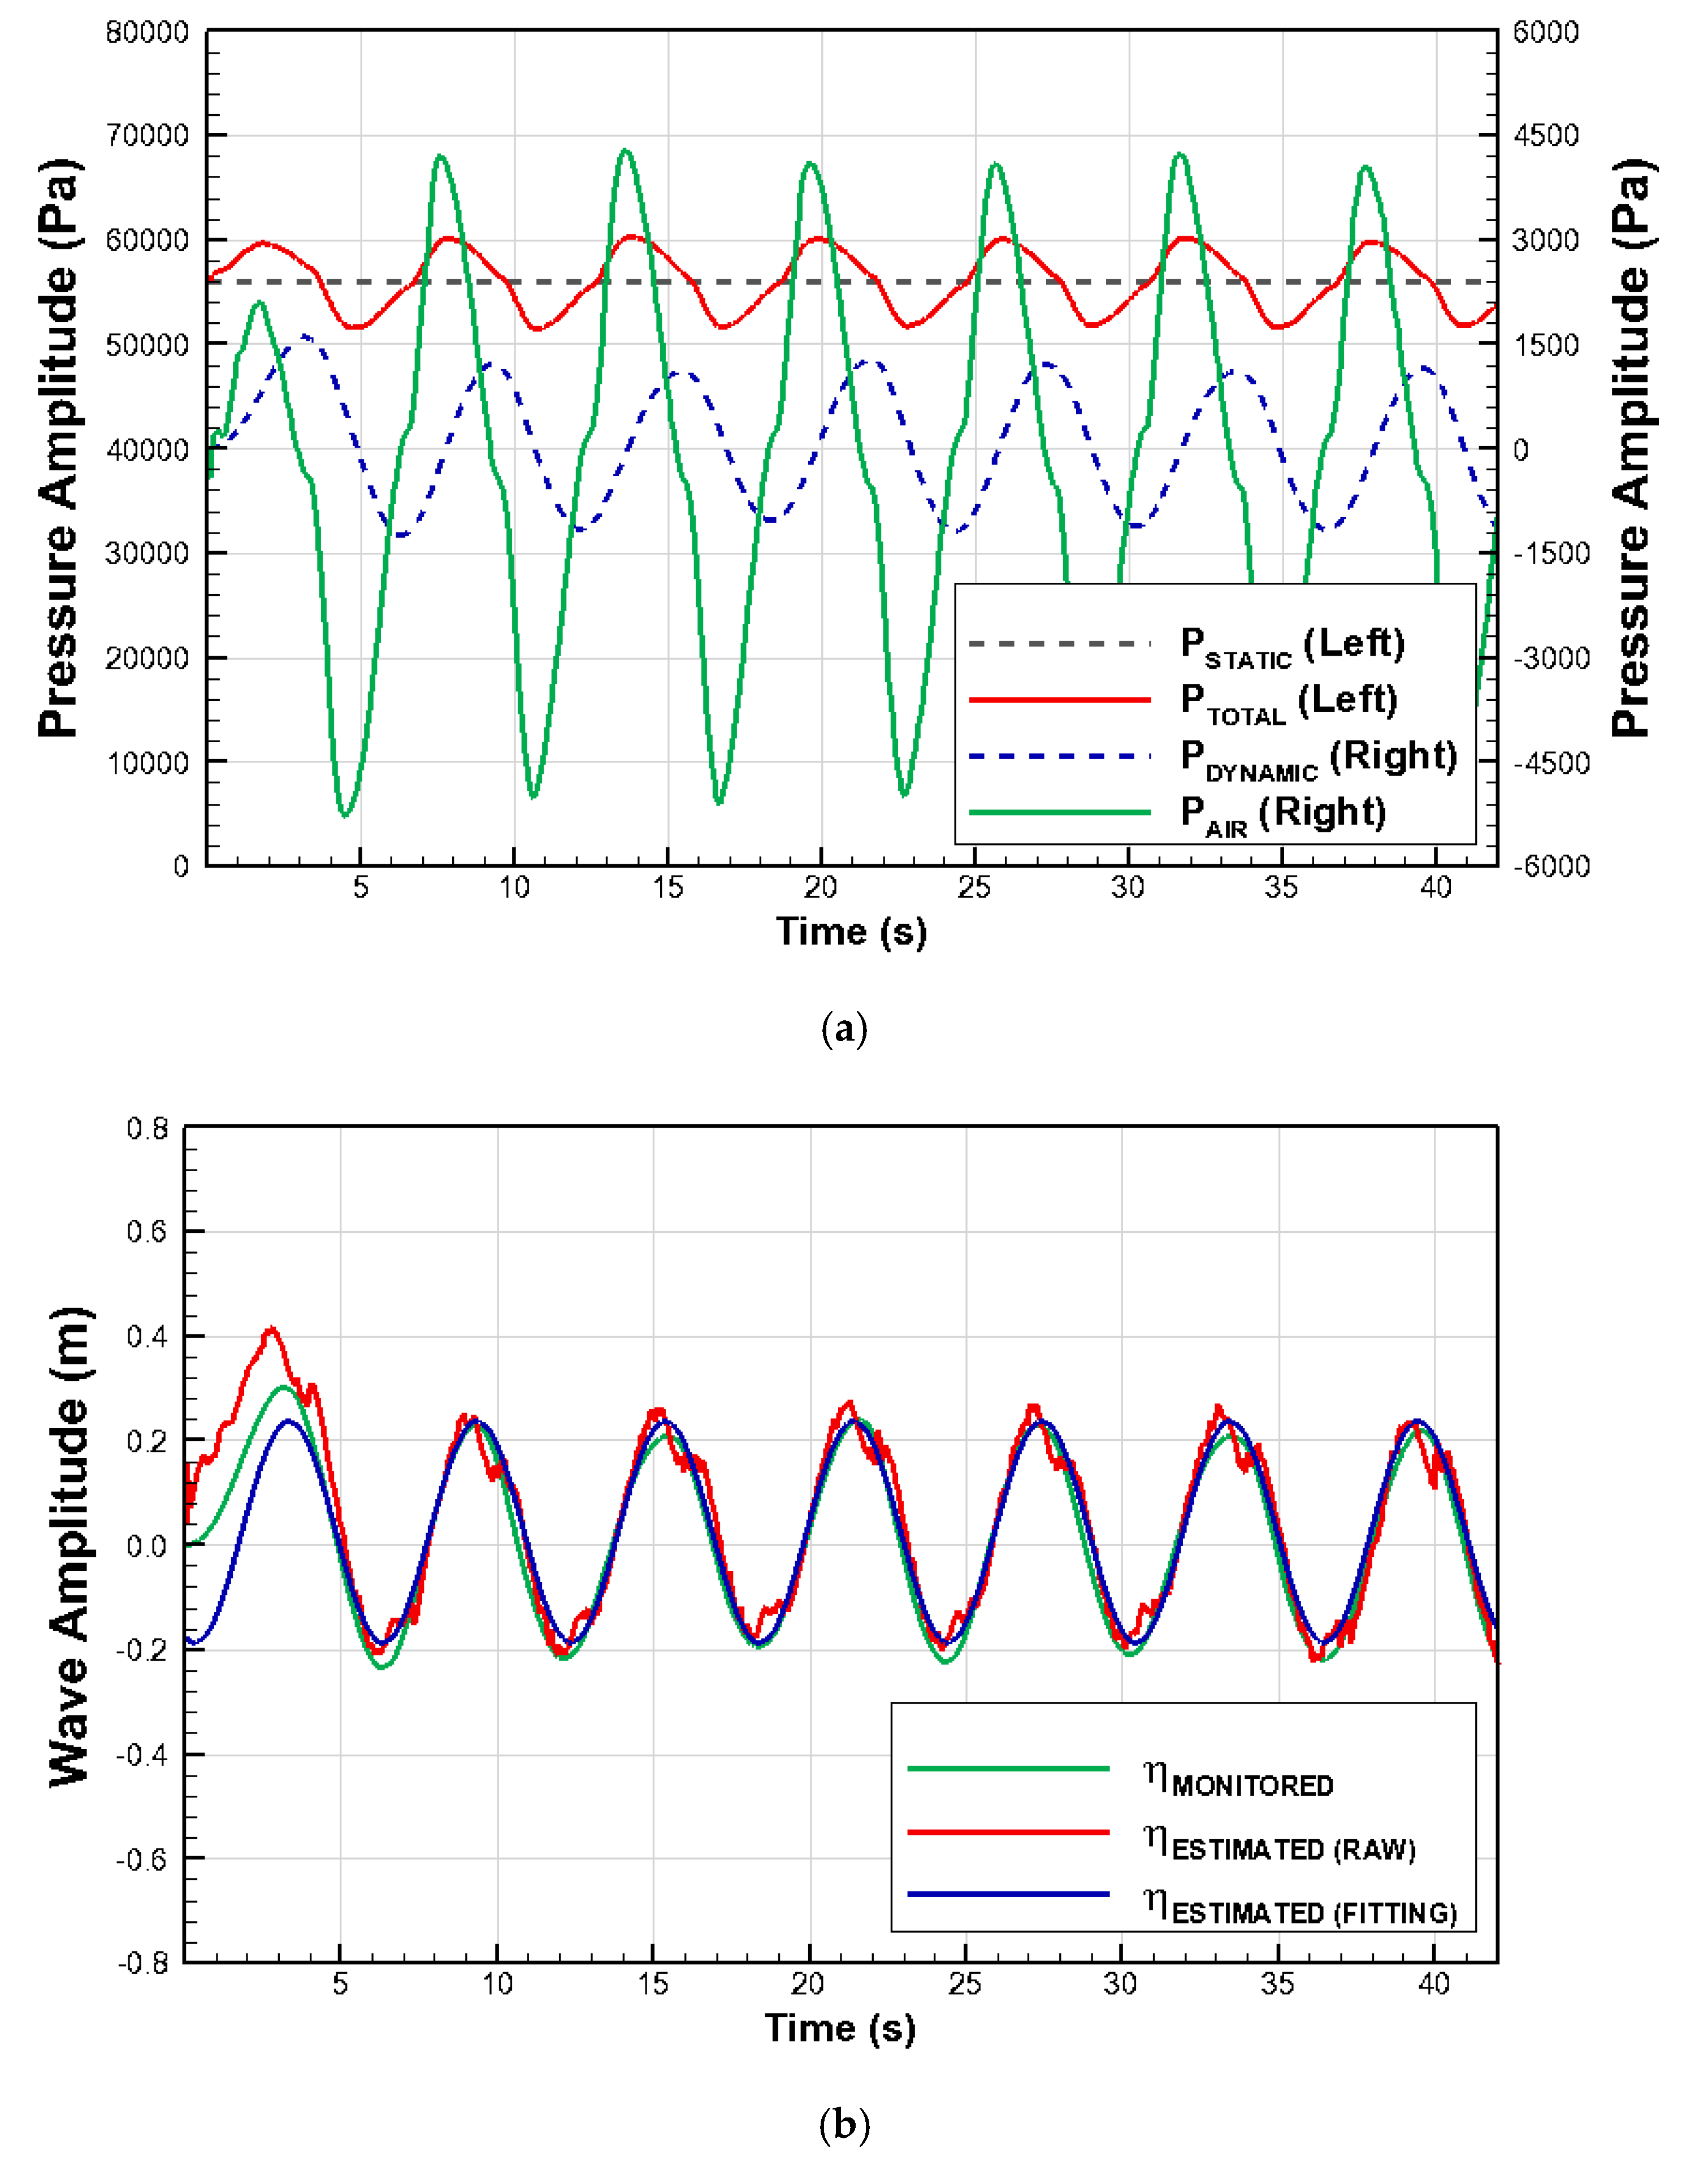
Figure 2 shows the time series of the pressure variables obtained from the CFD simulations. The hydrostatic pressure can be calculated using Equation (1), and the hydrodynamic pressure can be calculated by substituting the wave amplitude simulated through CFD analysis into
. Both parameters were compared with the total pressure in water and the air pressure inside the chamber obtained through CFD simulations (
Figure 2a). The total pressure oscillated at an amplitude of approximately 8% based on the hydrostatic pressure. The maximum dynamic pressure generated by the wave amplitude inside the chamber was approximately 28% of the maximum air pressure.
Figure 2 compares the wave amplitude estimated using the pressure method, and that monitored inside the chamber. The estimated wave amplitude was analyzed by applying curve fitting using a Fourier series to resolve the instability during differentiation at discrete time intervals. The Fourier fitting was applied as
, with 138.6, −1068, −348.1, and 1.043 as the values of
,
,
, and
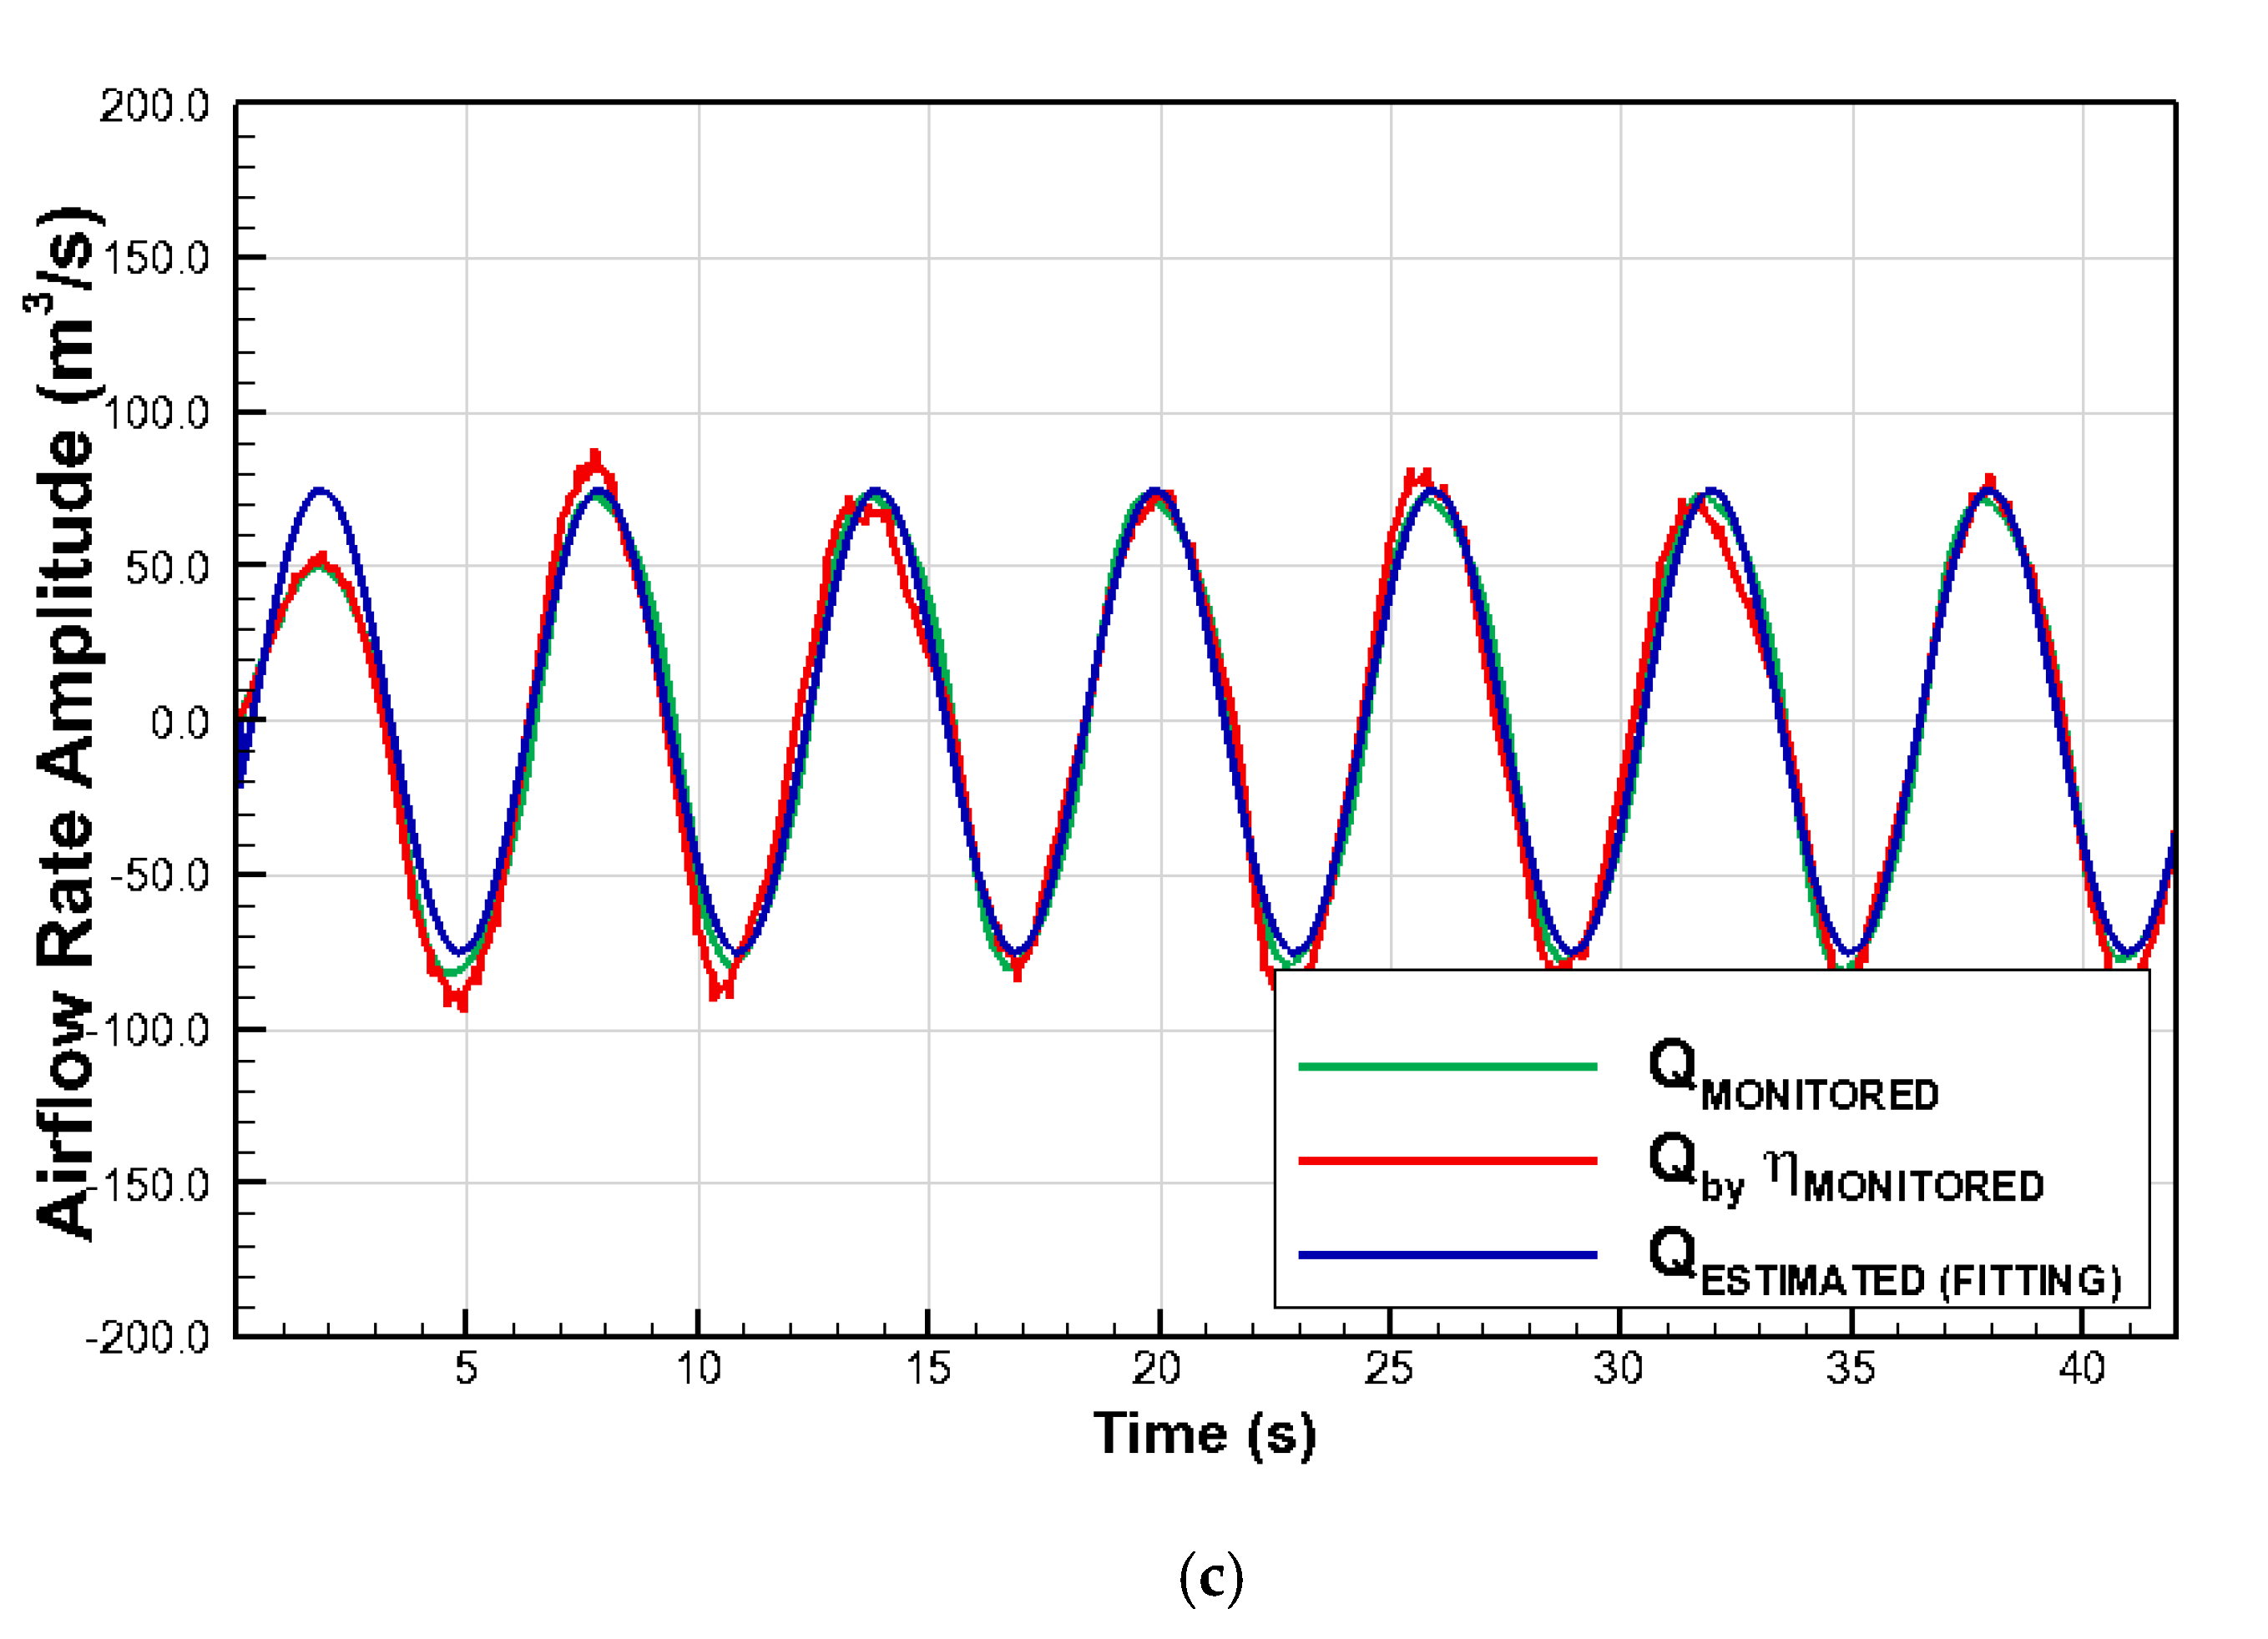
, respectively. The results indicated that the wave amplitudes in the chamber were directly monitored, and the wave amplitudes estimated using the pressure method were consistent. In addition, the airflow rate obtained by differentiating the wave amplitude using Equation (4) was consistent with the results obtained by differentiating the directly monitored wave amplitude and the flow rate directly passing through the duct (
Figure 2c).
3. Evaluation of Airflow Rate for Demonstration Plant
3.1. Data from Yongsoo OWC Pilot Plant
The Youngsoo OWC pilot plant is an OWC demonstration plant installed in the western sea of Jeju Island, South Korea, in 2017. The plant is equipped with an induction generator and a synchronic generator for two 250 kW impulse turbines and has a chamber structure consisting of a concrete caisson. Please refer to [
5] for detailed system structures and specifications. In this study, real sea test data for approximately 25 min, obtained from 18:05 to 18:30 on 18 January 2021, were used.
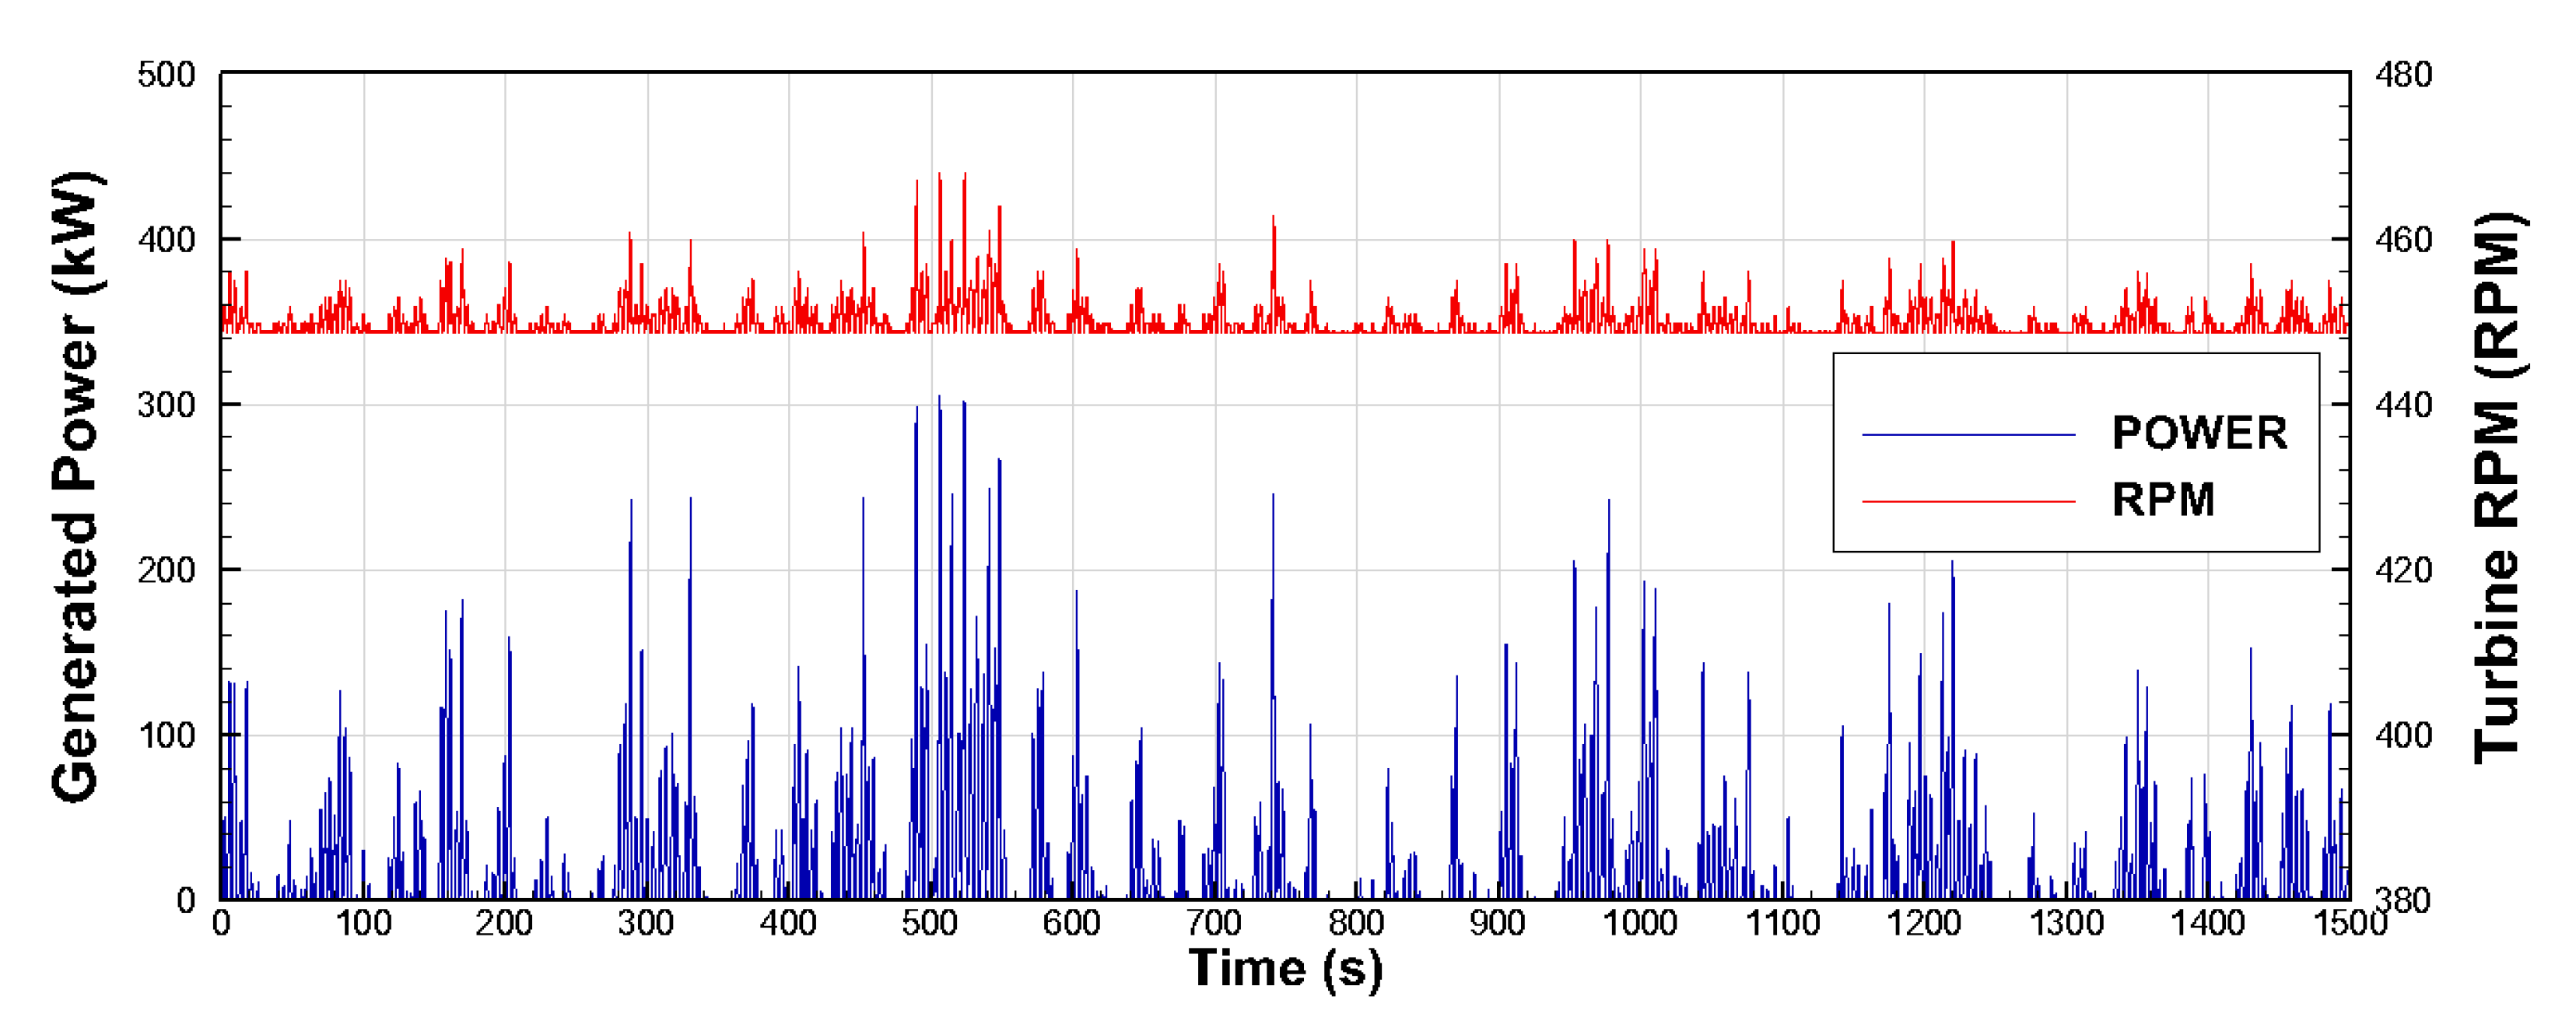
Figure 3 shows the time series of the generated power and revolution per minute (RPM) of the generator obtained using a single impulse turbine and an induction generator during operations. The system produced up to approximately 300 kW output during 25 min at an instantaneous time and 16.1 kWh power.
3.2. Evaluation of Airflow Rate for Yongsoo OWC Pilot Plant
Figure 4 compares the water pressure and pneumatic pressure measured under the relevant operating conditions in the pilot plant with the calculated hydrostatic pressure and hydrodynamic pressure. The hydrostatic pressure was obtained by averaging the measured water pressure over the entire time, and the hydrodynamic pressure was calculated by subtracting the hydrostatic and pneumatic pressures from the water pressure. The trend between each pressure component was similar to the CFD regular wave simulation results, and the calculated hydrodynamic pressure was delayed by approximately 1/4 T for each unit wave compared to the pneumatic pressure. Based on the maximum value, approximately 56% of the air pressure existed as hydrodynamic pressure.
Adequate analysis of the wavenumber (
) was required to calculate the wave amplitude and the airflow rate using the pressure method based on water and pneumatic pressures. The wavenumber can be directly applied when the incident wave period input is known, such as in CFD simulations. Still, the proper approximation is required if the irregular wave state of the sea is not measured, such as in pilot plants. In this study, the wavenumber was approximated from the dispersion relation equation (
) for finite water depth by resolving the calculated hydrodynamic pressure time series into each unit wave through zero-up crossings to obtain the wavenumber for each time instant in irregular waves. In addition, when calculating the airflow rate by differentiating the estimated wave-amplitude time series, a band-pass filter was applied to solve the instability of the discrete measurement time interval. The calculated airflow rate results were compared (
Figure 5).
3.3. Alternative Method
An alternative method for calculating the airflow rate of a pilot plant was developed to validate the flow-rate calculation results obtained using the pressure method.
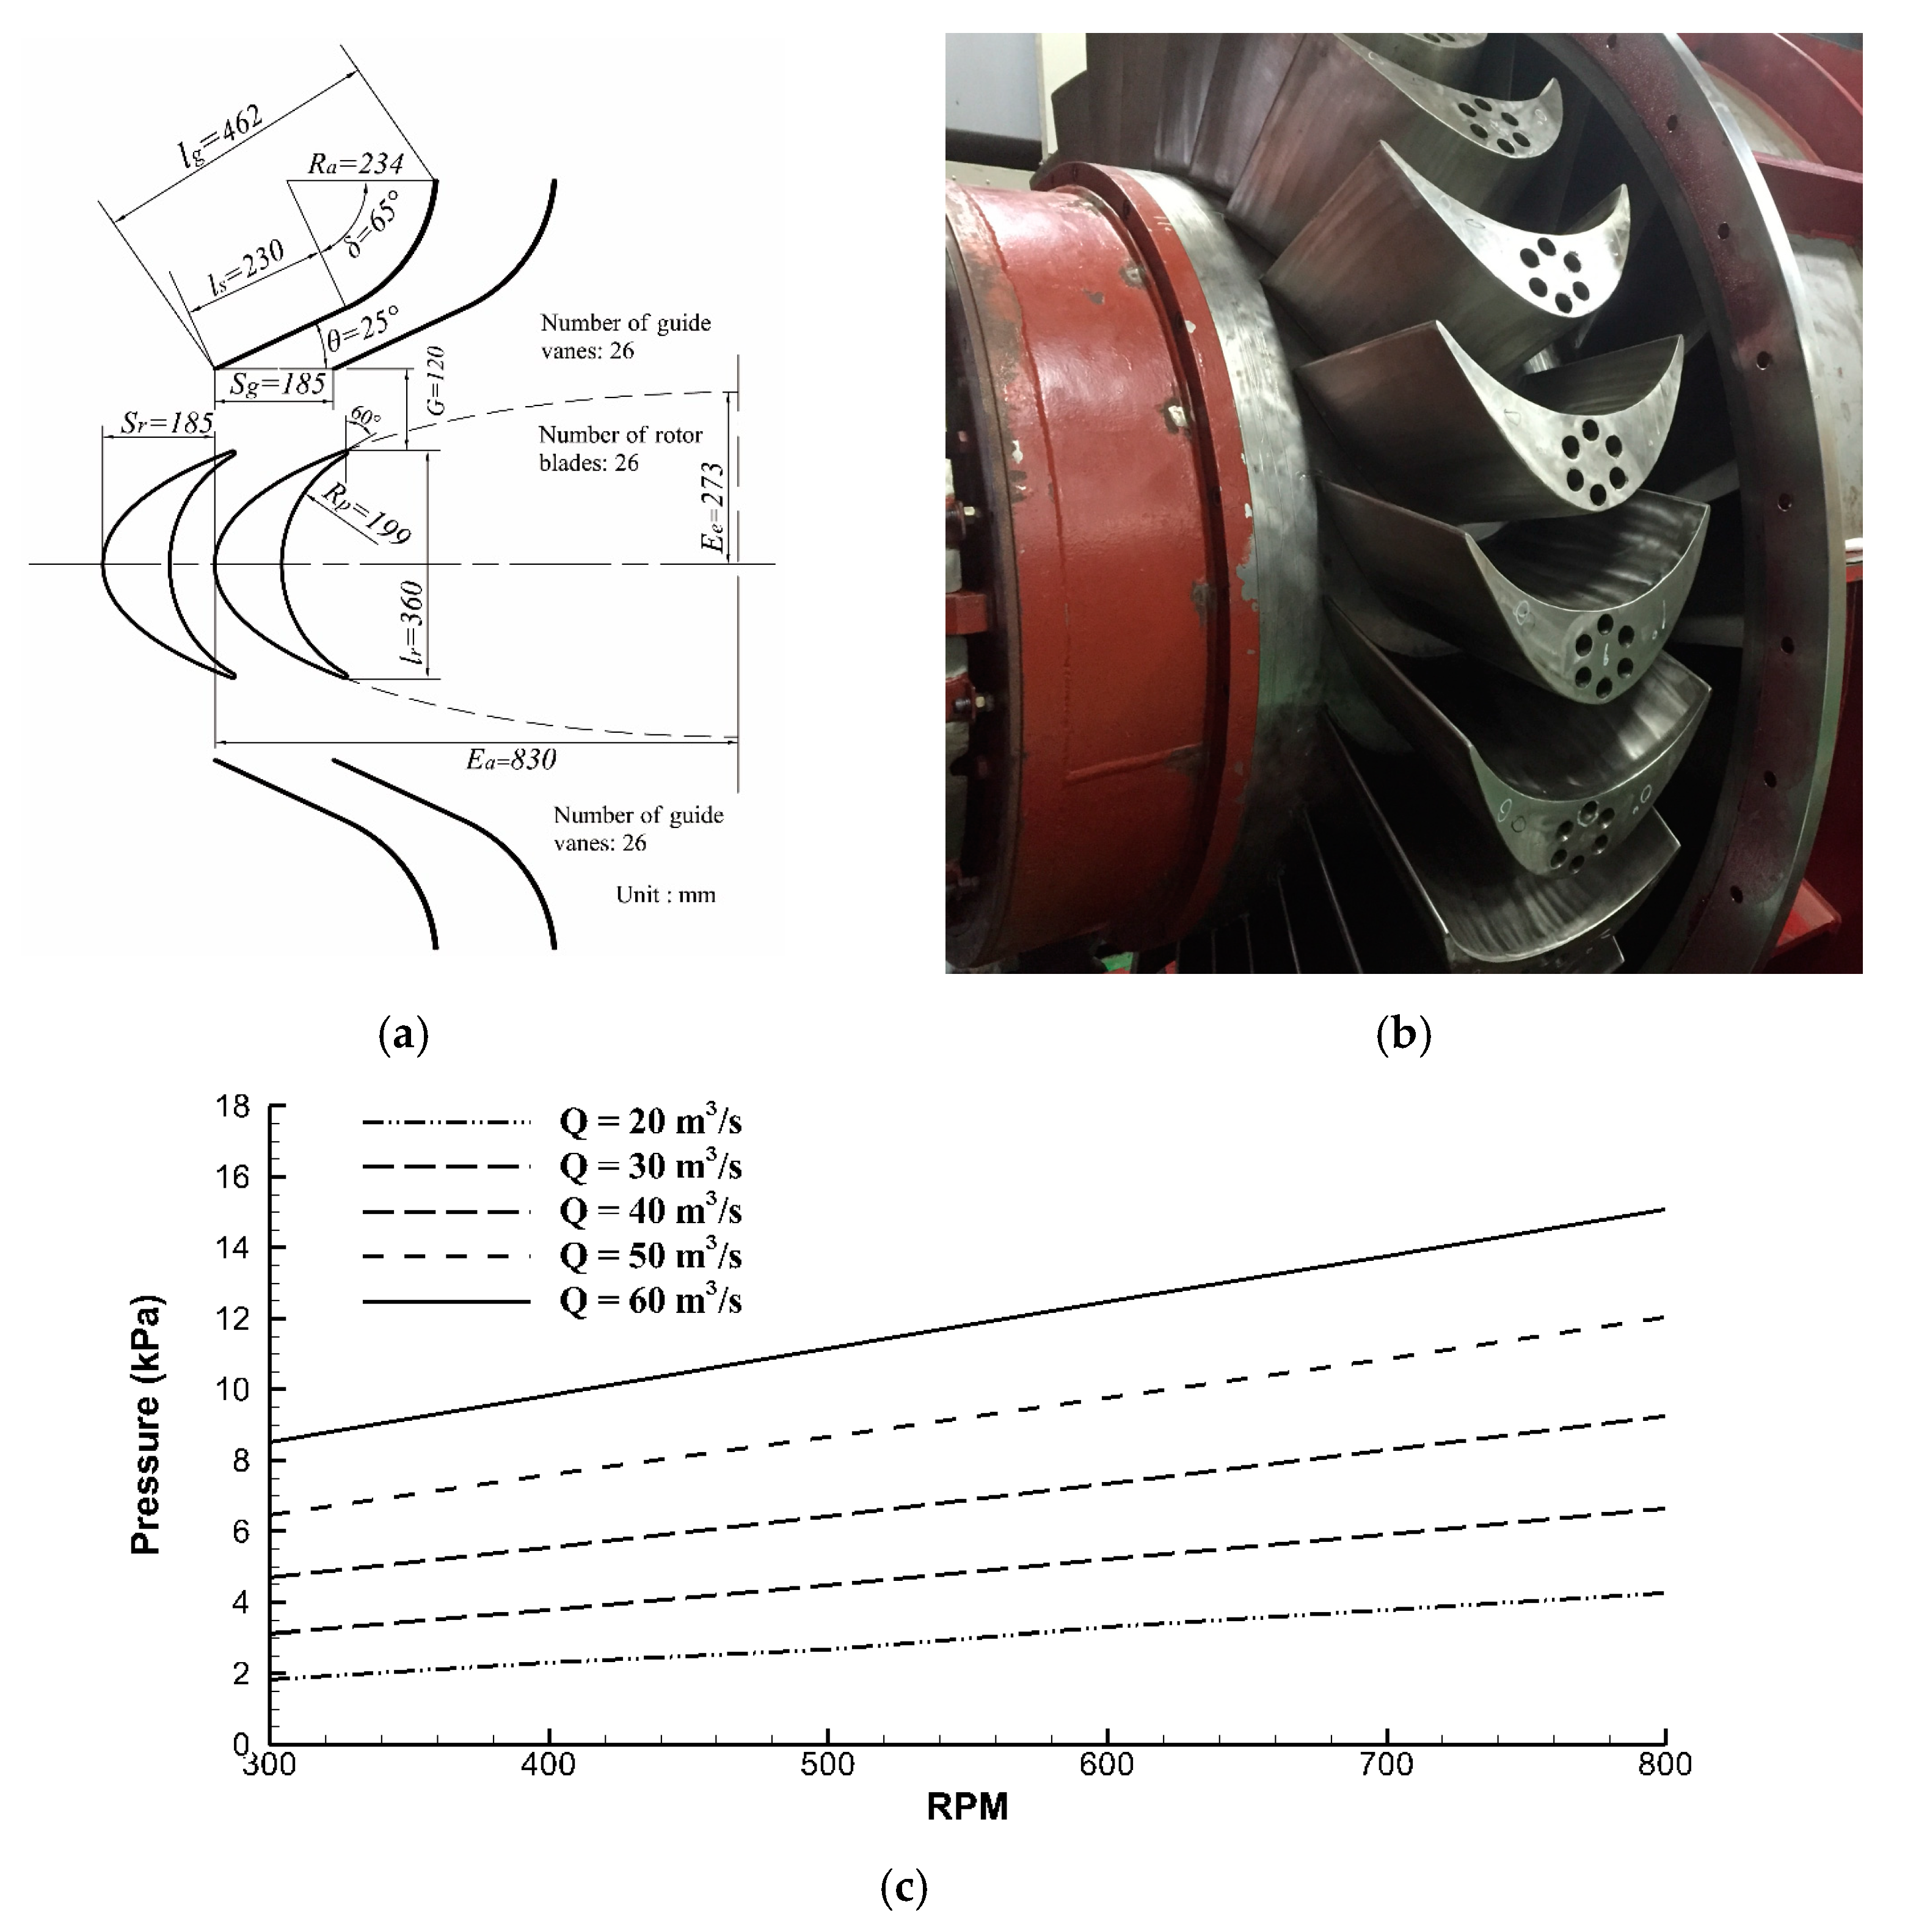
Figure 5 defines geometry and performance data for the 250 kW impulse turbine in the Yongsoo OWC pilot plant. The turbine has a rotor composed of 26 blades that have symmetric airfoils, and 26 guide vanes symmetrically mounted upwind and downwind the rotor, respectively. The performance chart was defined for the turbine in
Figure 5c, which was drawn using the CFD analysis method described in detail in Reference [
16]. The performance chart defines various airflow rate–turbine RPM–pneumatic pressure inter-relationships and yielded discrete values. The airflow rate corresponding to the turbine RPM and the air pressure in a specific state could be determined through linear interpolation from the turbine performance chart. Next, the time series of the airflow rate in the pilot plant was obtained by interpolating the measured turbine RPM and air pressure in the pilot plant at each time instant. It was assumed that the turbine performance chart plotted for the quasi-steady state was valid for continuous RPM and air pressure oscillation, owing to the nature of the impulse turbine. The method described above is called the “turbine DB method” for convenience.
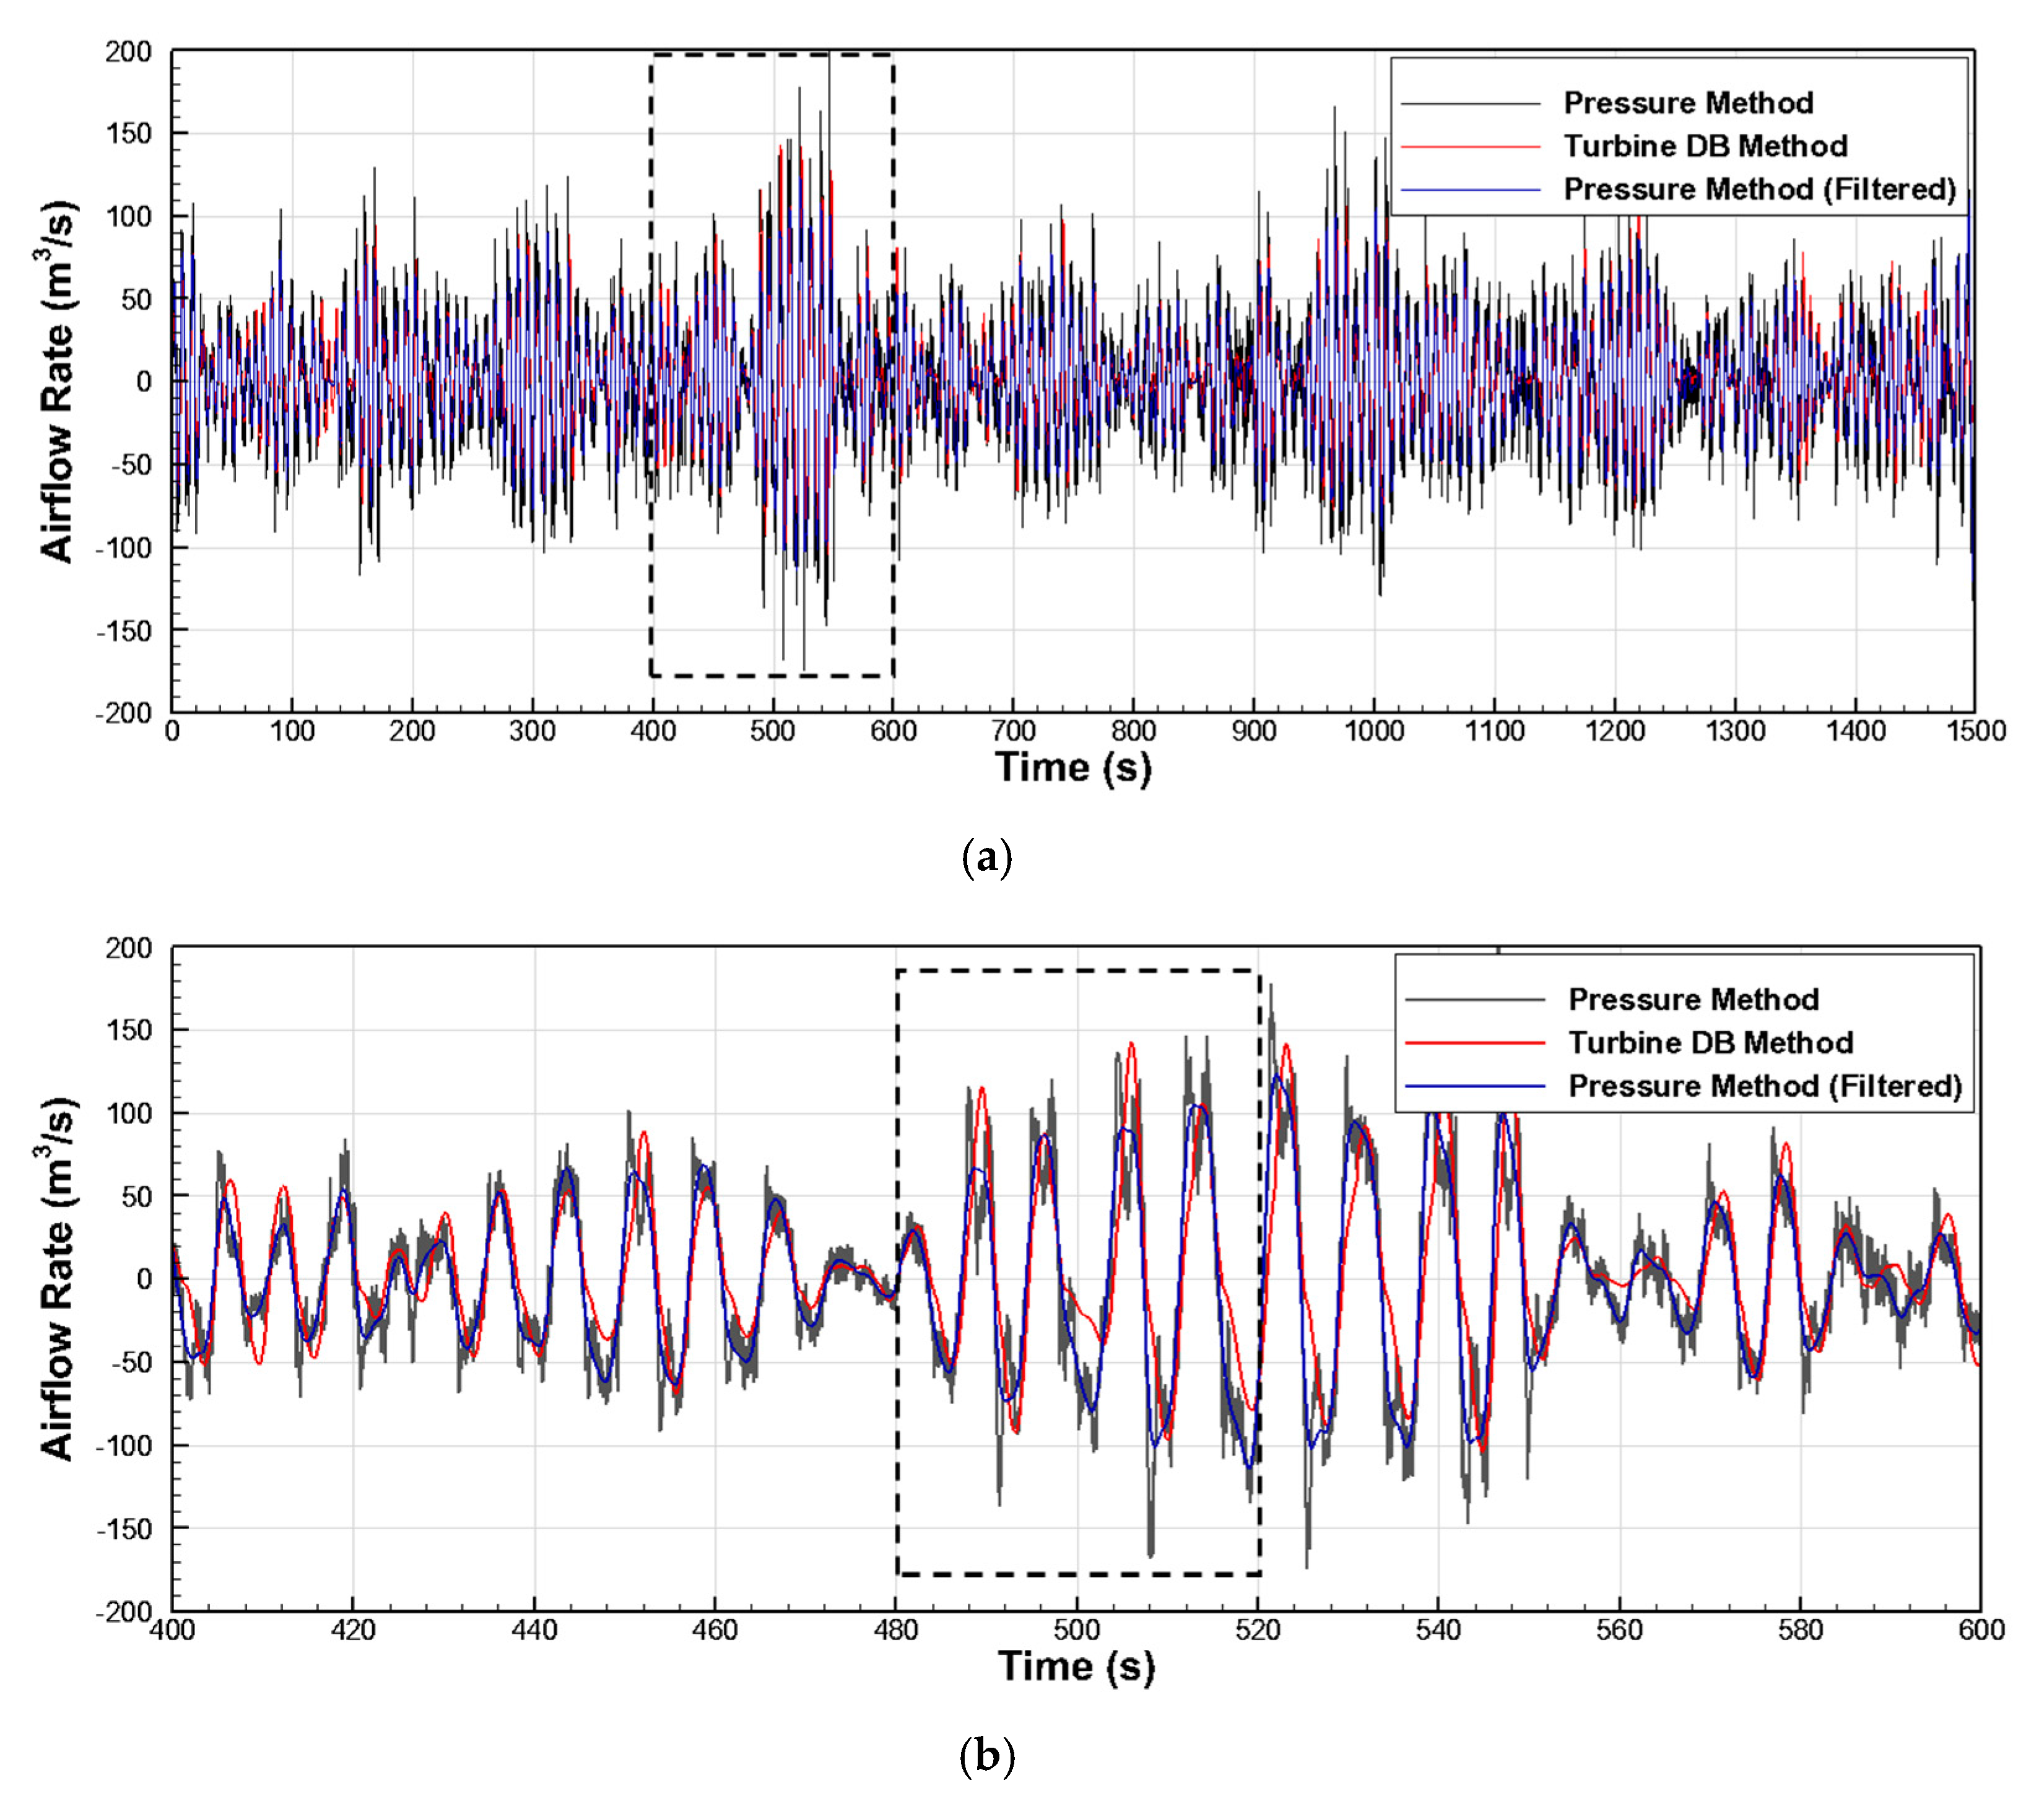
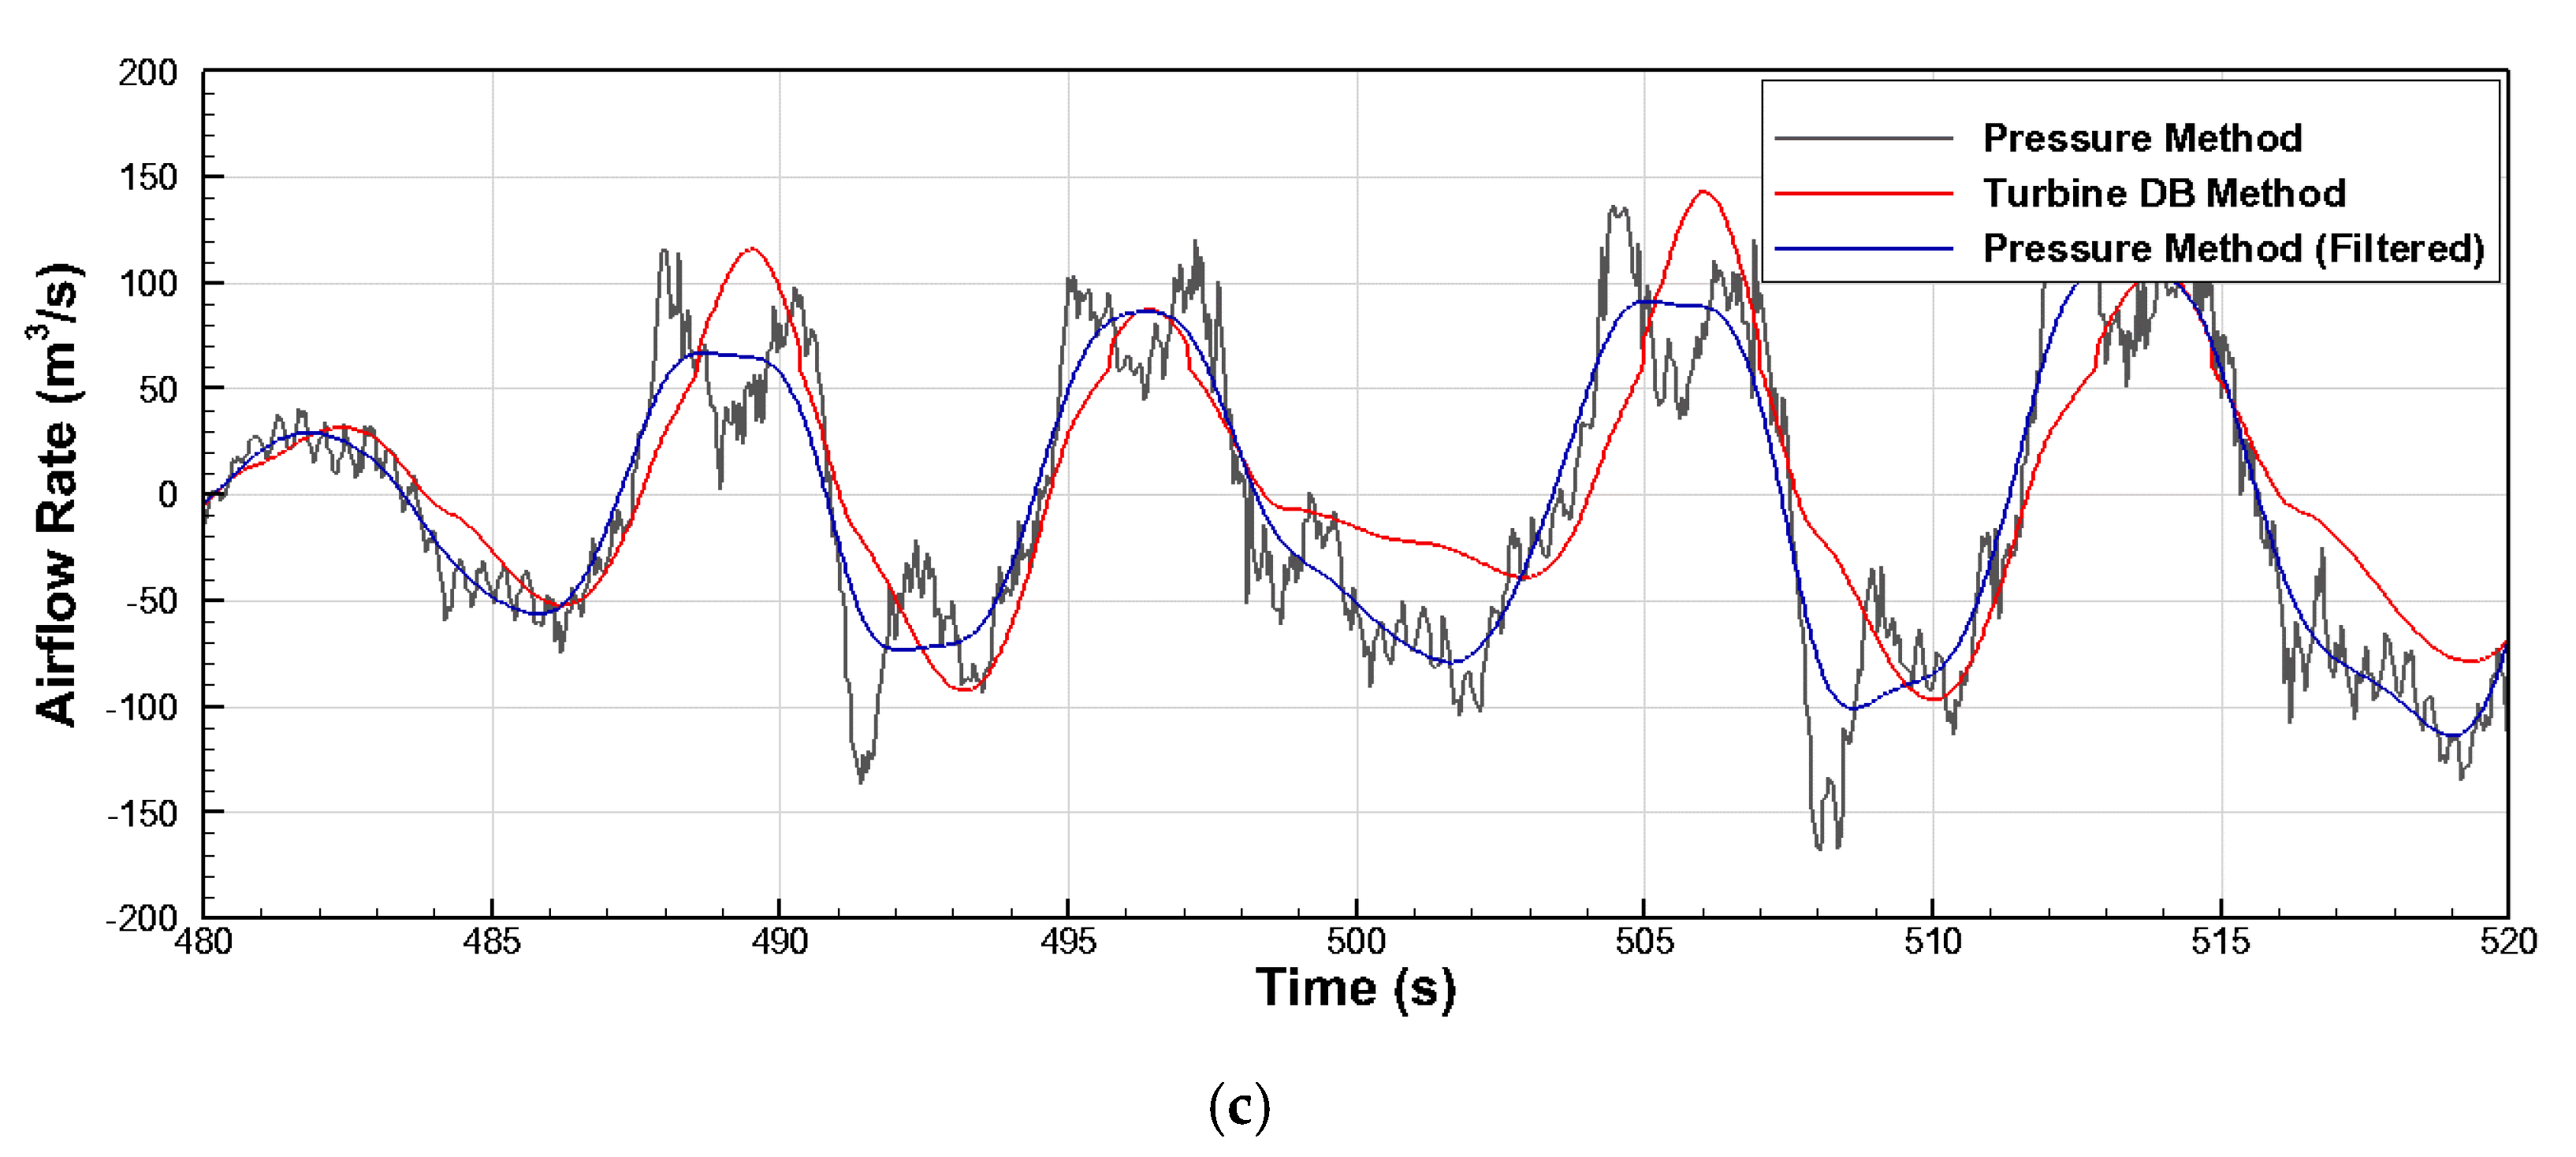
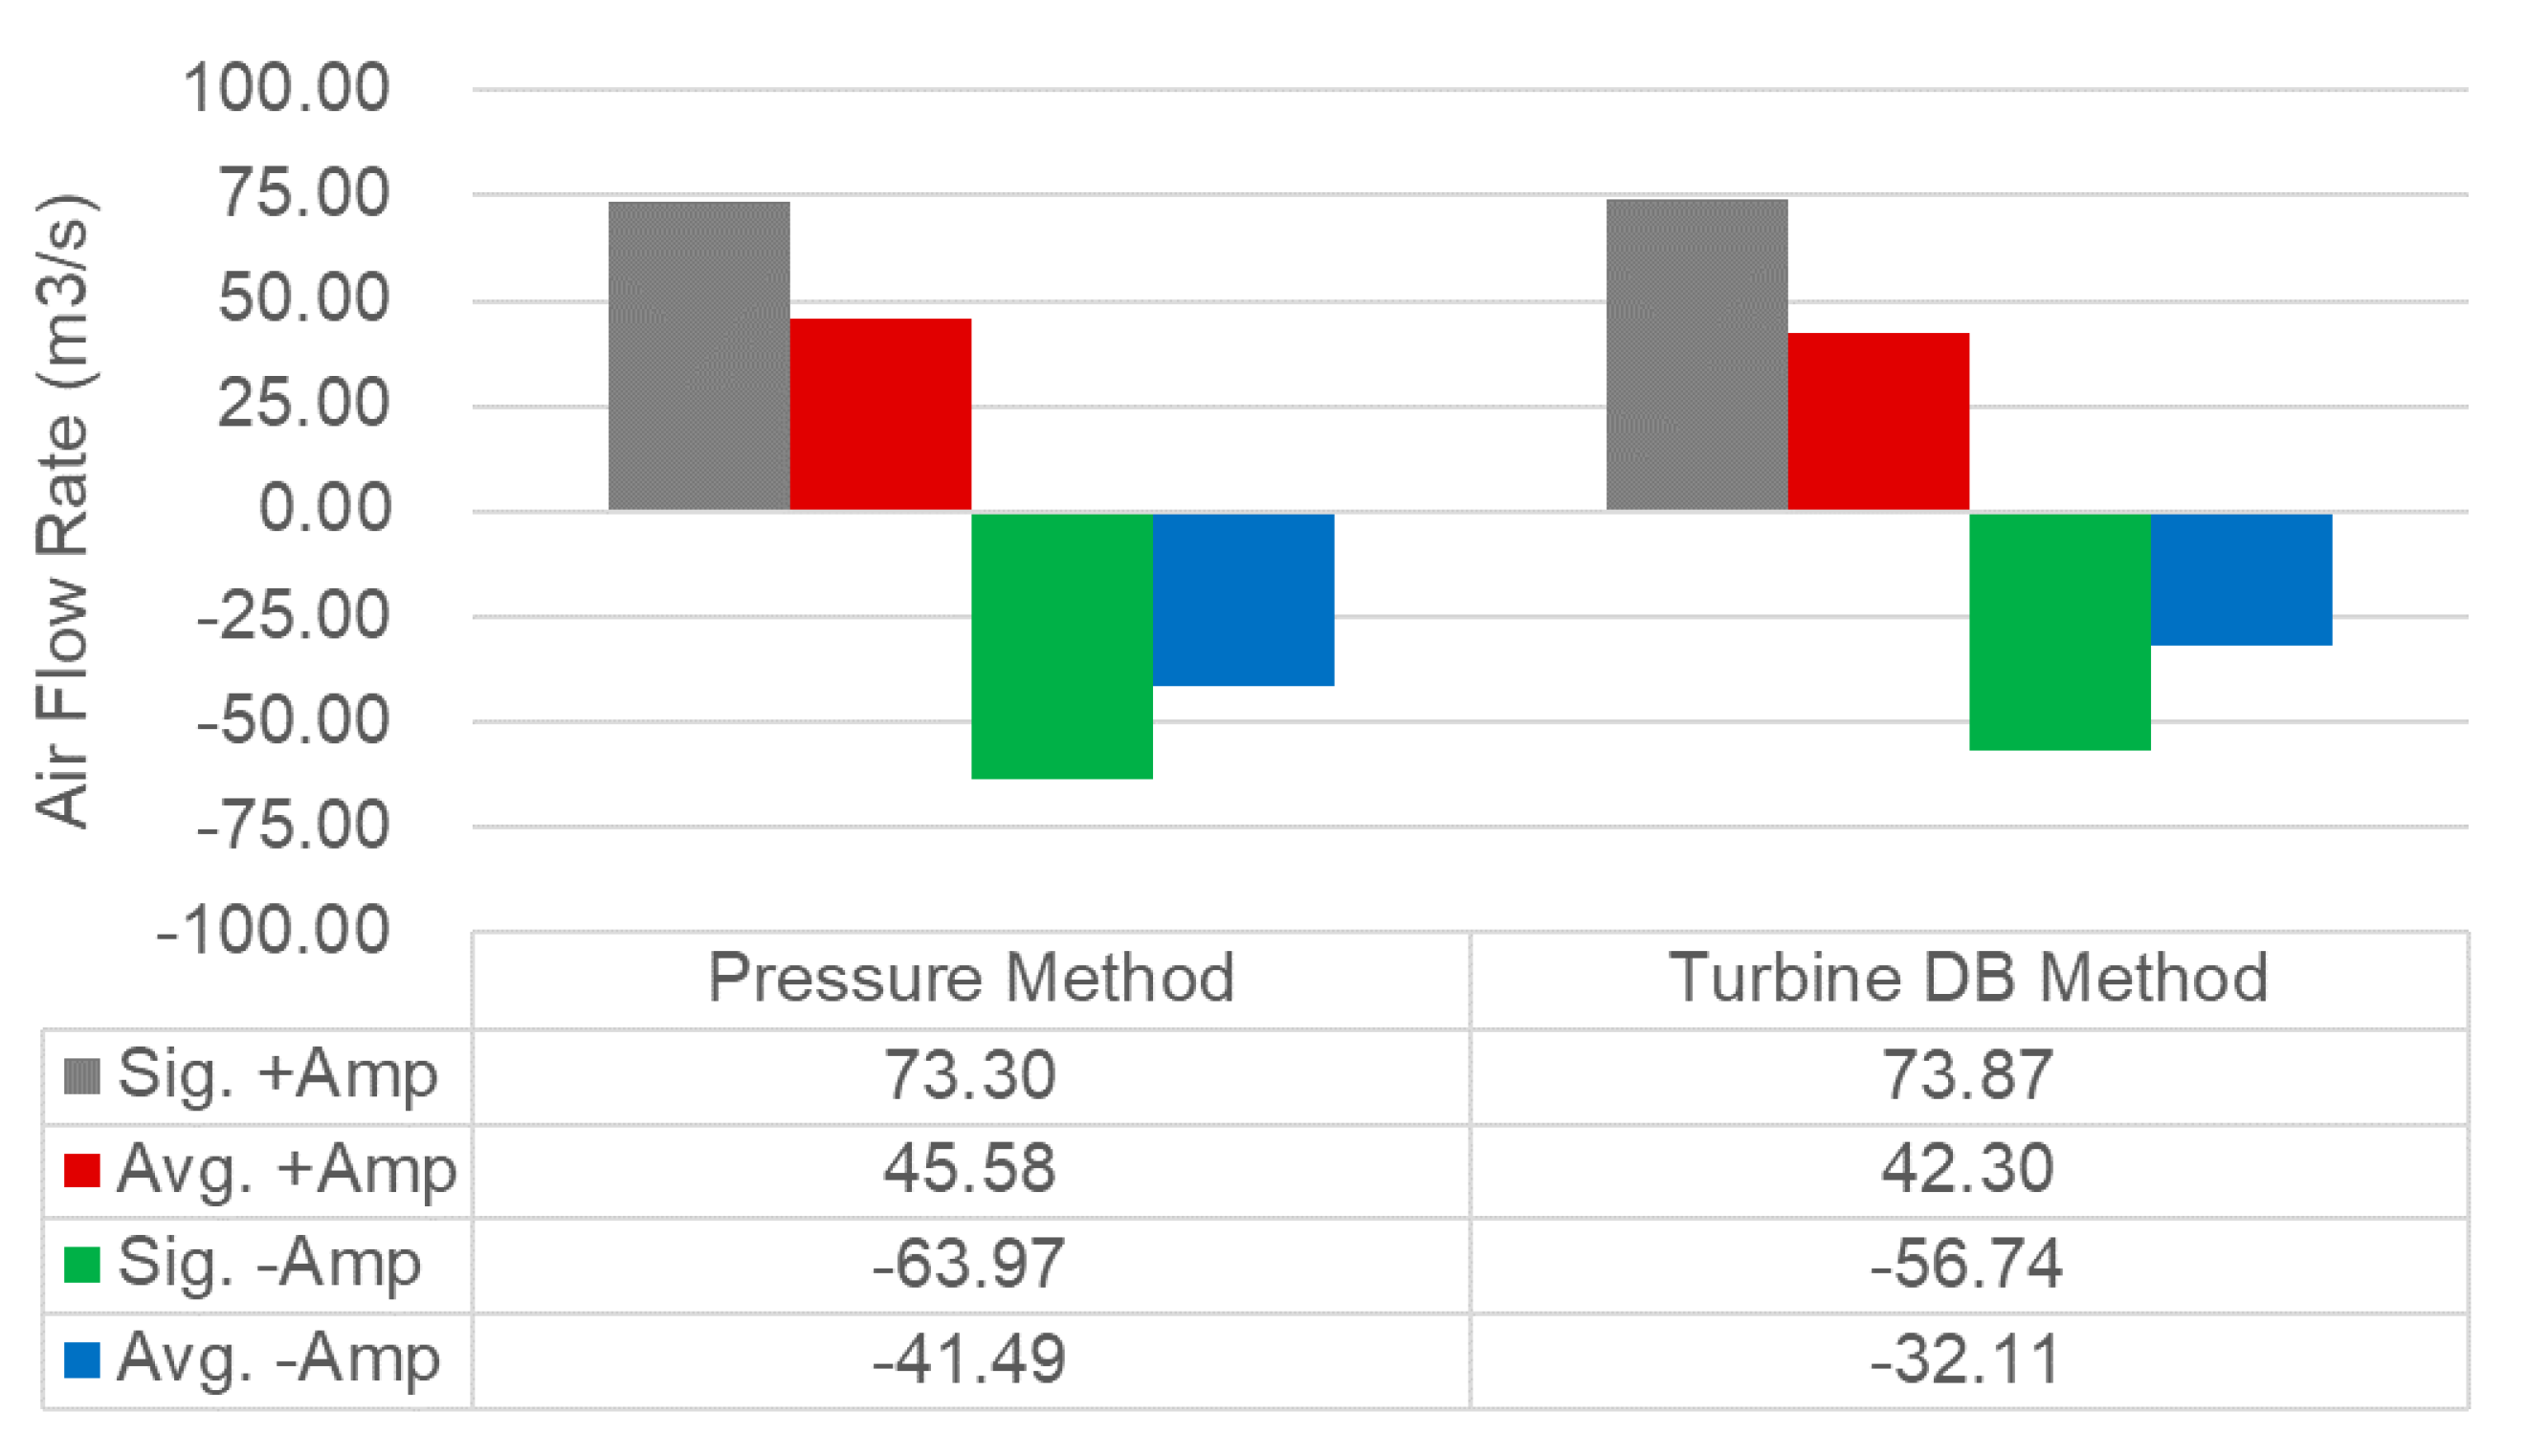
Figure 6 shows the estimated airflow results obtained using the pressure method and the turbine DB method based on the measurement data of the Youngsoo OWC pilot plant. As mentioned previously, the pressure method results also were corrected through the band-pass filter. The oscillation period and amplitude of the airflow rate for each unit wave were reasonably consistent throughout the entire time.
Figure 7 compares the statistics of the airflow rate calculation results of the pressure method and the turbine DB method. The significant and averaged amplitudes of the airflow rate estimated using the pressure method were slightly higher than those estimated using the turbine DB method. For positive amplitude values corresponding to the exhaust of the OWC, the significant amplitude was almost identical, and the average amplitude difference was approximately 8%. However, for negative amplitude values corresponding to the intake of the OWC, both the significant and averaged amplitudes showed differences of approximately 13% and 29%, respectively, indicating a somewhat higher difference than OWC exhaust.
4. Conclusions
In this study, a method for effectively estimating the airflow rate of an OWC pilot plant, which is difficult to measure the airflow rate directly, owing to several practical causes, was developed.
Based on the linear wave theory, the wave amplitude generated inside the OWC chamber was assumed using an analytical formula, and its validity was verified through CFD regular wave simulations.
The airflow rate was calculated using the pressure method based on real sea measurement data of the Yongsoo OWC pilot plant. Based on the turbine performance chart, the results were compared with the airflow rate estimated using the turbine DB method. The results obtained using the pressure and turbine DB methods were reasonably consistent for the pilot plant data; however, the turbine DB method estimated comparatively lower airflow rates during OWC intake.
The pressure method is expected to be more accurate than the turbine DB method because its effectiveness has been verified through CFD simulations with relatively low uncertainty. Moreover, the turbine DB method may be an alternative if it is difficult to install a pressure sensor under the water in the chamber of the OWC pilot plant.
Author Contributions
Conceptualization, J.-H.O. and S.-H.S.; methodology, C.-H.L. and K.H.; validation, S.P. and K.K.; formal analysis, S.P.; investigation, J.-Y.P.; writing—original draft preparation, S.P., K.H. and S.-H.S.; writing—review and editing, S.P., K.K. and J.-H.O.; visualization, K.K. and C.-H.L.; supervision, K.H.; funding acquisition, S.-H.S. All authors have read and agreed to the published version of the manuscript.
Funding
This research was supported by a grant from the National R&D Project “Development of Wave Energy Converters Applicable to Breakwater and Connected to Micro-Grid with Energy Storage System” funded by Ministry of Oceans and Fisheries, Korea (PMS4590).
Data Availability Statement
Data available in a publicly accessible repository.
Conflicts of Interest
The authors declare no conflict of interest.
References
- Folley, M. The wave energy resource. In Handbook of Ocean Wave Energy; Pecher, A., Kofoed, J., Eds.; Springer: Cham, Switzerland, 2017; Volume 7, pp. 45–46. [Google Scholar]
- Falcão, A.F.O.; Henriques, J.C.C. Oscillating-water-column wave energy converters and air turbines: A review. Renew. Energy 2016, 85, 1391–1424. [Google Scholar] [CrossRef]
- Falcão, A.F.O.; Sarmento, A.J.N.A.; Gato, L.M.C.; Brito-Melo, A. The Pico OWC wave power plant: Its lifetime from conception to closure 1986–2018. Appl. Ocean Res. 2020, 98, 102104. [Google Scholar] [CrossRef]
- Ibarra-Berastegi, G.; Sáenz, J.; Ulazia, A.; Serras, P.; Esnaola, G. Electricity production, capacity factor, and plant efficiency index at the Mutriku wave farm (2014–2016). Ocean Eng. 2018, 147, 20–29. [Google Scholar] [CrossRef] [Green Version]
- Ocean Energy Systems. Available online: https://www.ocean-energy-systems.org/about-us/annual-report/ (accessed on 15 August 2021).
- Elhanafi, A.; Fleming, A.; Macfarlane, G.; Leong, Z. Numerical hydrodynamic analysis of an offshore stationary-floating oscillating water column-wave energy converter using CFD. Int. J. Nav. Arch. Ocean 2017, 9, 77–99. [Google Scholar] [CrossRef] [Green Version]
- Iturrioz, A.; Guanche, R.; Lara, J.L.; Vida, C.; Losada, I.J. Validation of OpenFOAM® for Oscillating Water Column three-dimensional modeling. Ocean Eng. 2015, 107, 222–236. [Google Scholar] [CrossRef]
- Kamath, A.; Bihs, H.; Arntsen, Ø.A. Numerical modeling of power take-off damping in an oscillating water column device. Int J. Mar. Energy 2015, 10, 1–16. [Google Scholar] [CrossRef] [Green Version]
- Lopez, I.; Pereiras, B.; Castro, F.; Iglesias, G. Optimisation of turbine-induced damping for an OWC wave energy converter using a RANS-VOF numerical model. Appl. Energy 2014, 127, 105–114. [Google Scholar] [CrossRef]
- Luo, Y.; Nader, J.-R.; Cooper, P.; Zhu, S.-P. Nonlinear 2D analysis of the efficiency of fixed oscillating water column wave energy converters. Renew. Energy 2015, 64, 255–265. [Google Scholar] [CrossRef]
- Vyzikas, T.; Deshoulieres, S.; Giroux, O.; Barton, M.; Greaves, D. Numerical study of fixed oscillating water column with RANS-type two-phase CFD model. Renew. Energy 2017, 102, 294–305. [Google Scholar] [CrossRef] [Green Version]
- Xu, C.; Huang, Z. Three-dimensional CFD simulation of a circular OWC with a nonlinear power-takeoff: Model validation and a discussion on resonant sloshing inside the pneumatic chamber. Ocean Eng. 2019, 176, 184–198. [Google Scholar] [CrossRef]
- Wang, C.; Zhang, Y. Numerical investigation on the wave power extreaction for a 3D dual-chamber oscillating water column system composed of two closely connected circular sub-units. Appl. Energy 2021, 295, 117009. [Google Scholar] [CrossRef]
- Park, S.; Kim, K.-H.; Nam, B.-W.; Kim, J.-S.; Hong, K. Experimental and Numerical Analysis of Performance of Oscillating Water Column Wave Energy Converter Applicable to Breakwaters. In Proceedings of the ASME 2019 38th International Conference on Ocean, Offshore and Arctic Engineering, Glasgow, UK, 9–14 June 2021. [Google Scholar]
- Dean, R.G.; Dalrymple, R.A. Engineering wave properties. In Water Wave Mechanics for Engineers and Scientists; World Scientific: Singapore, 1991; Volume 2, pp. 83–92. [Google Scholar]
- Liu, Z.; Jin, J.; Cui, Y.; Fan, H. Numerical analysis of impulse turbine for isolated pilot OWC system. Adv. Mech. Eng. 2013, 5, 416109. [Google Scholar] [CrossRef] [Green Version]
| Publisher’s Note: MDPI stays neutral with regard to jurisdictional claims in published maps and institutional affiliations. |
© 2021 by the authors. Licensee MDPI, Basel, Switzerland. This article is an open access article distributed under the terms and conditions of the Creative Commons Attribution (CC BY) license (https://creativecommons.org/licenses/by/4.0/).


 and
and 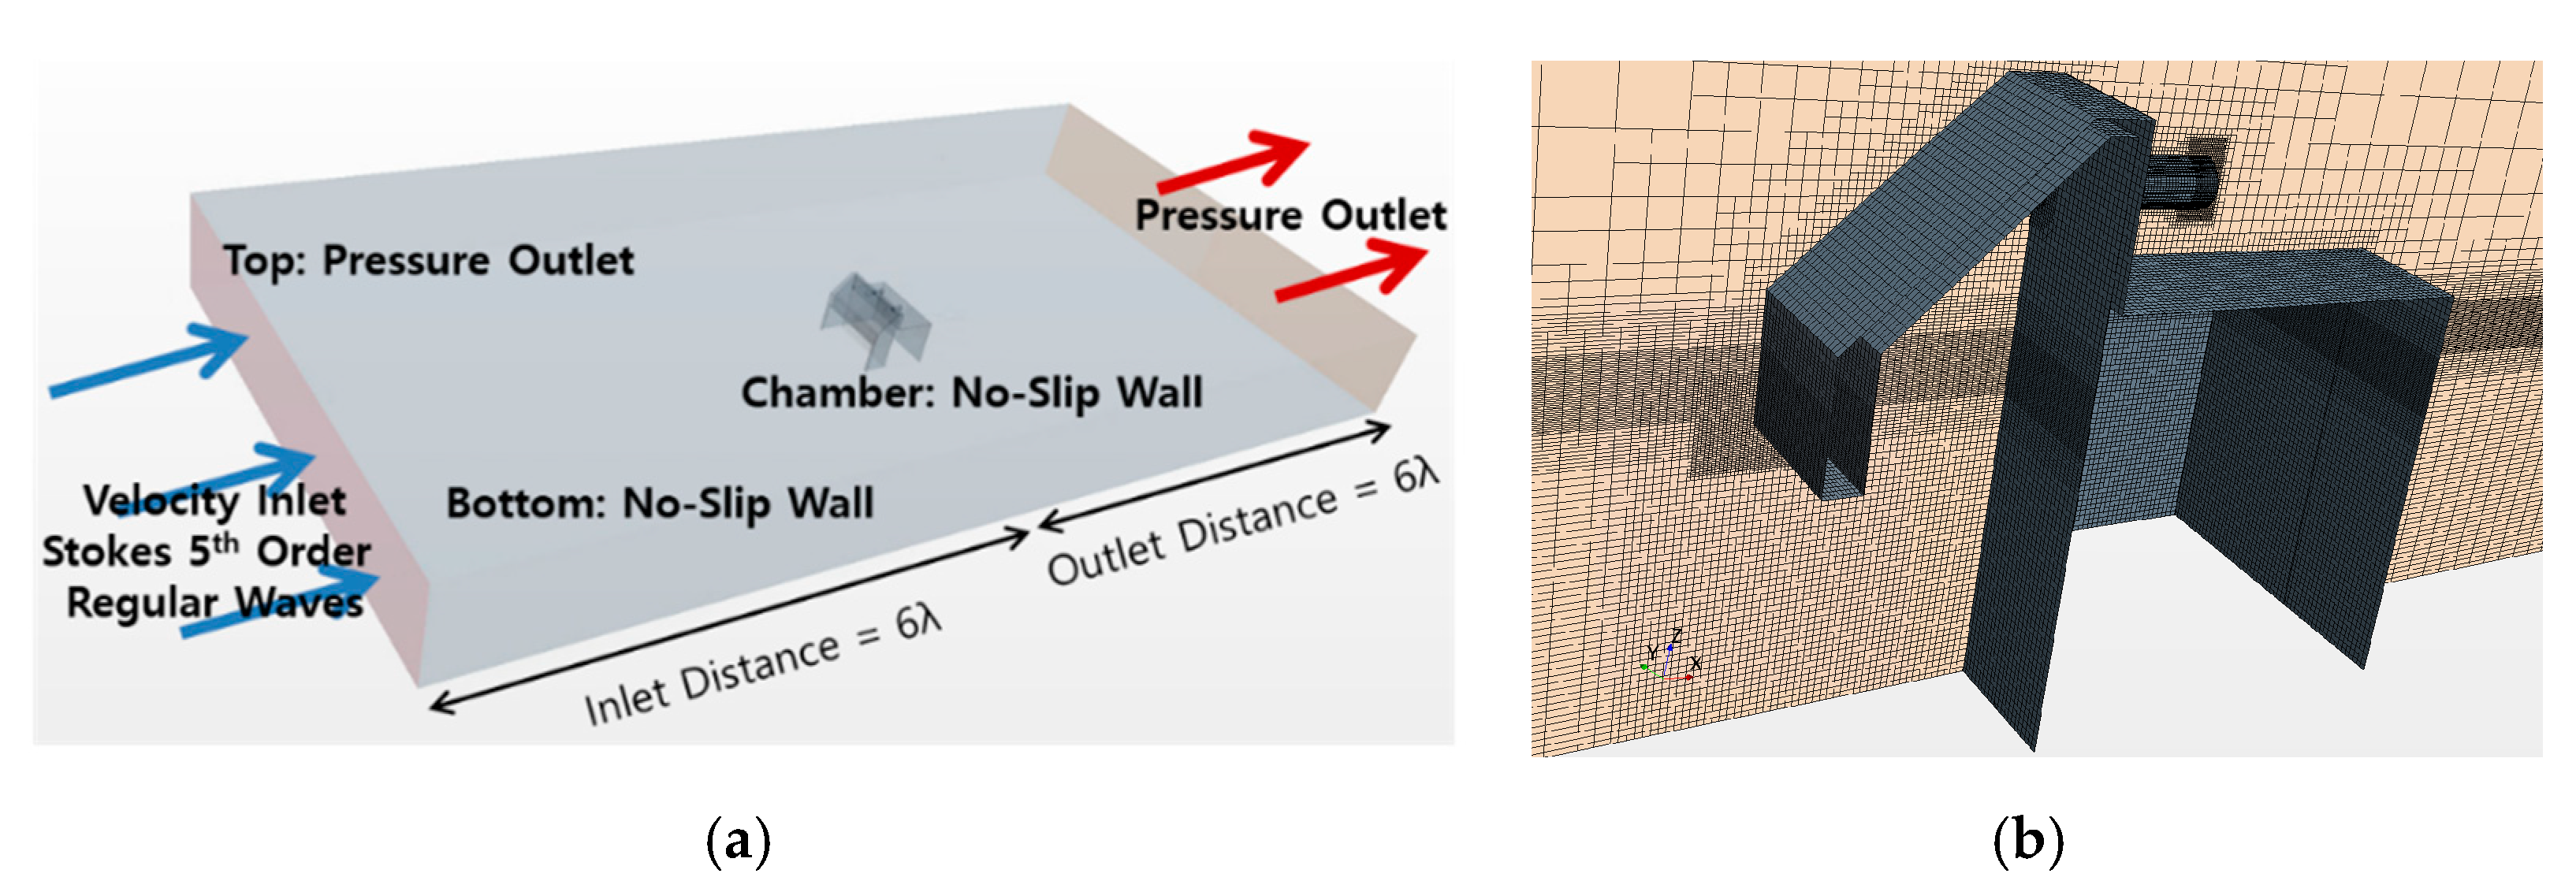