Article

Study of Heavy Gas Pollutants’ Dispersion in Street Canyon Terrain

1
School of Chemical Engineering and Technology, Tianjin University, Tianjin 300072, China
2
Tianjin Key Laboratory of Chemical Process Safety and Equipment Technology, Tianjin 300072, China
3
Zhejiang Institute of Tianjin University, Ningbo 315201, China
*
Authors to whom correspondence should be addressed.
Processes 2021, 9(10), 1754; https://doi.org/10.3390/pr9101754
Submission received: 22 August 2021 / Revised: 19 September 2021 / Accepted: 25 September 2021 / Published: 30 September 2021
(This article belongs to the Special Issue Recent Advances in Chemical Process Safety)

Abstract

:
This study focused on heavy gas dispersion under the terrain conditions of street canyons. The effects of street aspect ratio and height ratio were investigated, and the influence of environmental wind speed in the typical ideal street canyon terrain was explored. The results indicated that the surrounding flow field distributions in street terrains were dominated by higher buildings. In addition, when the building height was held constant, the flow field was affected by the joint influence of the two isolated buildings. The interception effect of the street canyon on upstream pollutants declined with the decrease in the street canyon’s aspect ratio. In addition, when the height ratios were different, a large quantity of upstream pollutants accumulated on the windward side of higher buildings. The relative concentration per unit area inside the canyon was affected by the air circulation inside and outside the canyon and the size of the dispersion space. The increase in the environmental wind speed promotes the entry of pollutants into the street while aggravating the overall dispersion of the pollutants. Therefore, the emergence of the most unsafe wind speeds caused most of the pollutants to gather in the street canyons.

1. Introduction

The fluorine chemical industry has expanded with the development of the military industry since the 1930s, and fluorine chemical products are now widely used in the military industry, aerospace, electronics, light industry, and agriculture [1]. With the increase in demand for fluorine chemical products, the production process and scale of fluorine chemicals have also been continuously developed and expanded, and the related safety issues have also attracted widespread attention.
The leakage of toxic gases is the focus of attention in numerous fields, including that of fluorine chemicals. Chlorine and hydrogen fluoride, as raw materials and products in the fluorine chemical process, exist in multiple links of the production process. Due to the extremely high toxicity of the two gases, leakage has the potential to cause significant harm [2,3,4]. Most toxic gases readily combine and react with water molecules in the air to form heavy gases, due to their excessive molecular mass or relatively active physical and chemical properties. Therefore, the study of heavy gas dispersion is a popular research topic [5,6,7]. In addition, researchers tend to use safe and reliable gases in experiments and simulations of the dispersion of heavy gases. Tan et al. [8,9] conducted a series of wind tunnel experiments using CO2 gas to simulate the cross block, and observed the accumulation and collapse of heavy gas inside the block. Xin et al. [10] constructed a numerical simulation model for chlorine dispersion, and analyzed the individual and social risks under various leakage conditions. Mao et al. [11] built an experimental system to explore the changes in the concentration field of indoor heavy gas leakage and dispersion, and influencing factors, and found that the gas concentration fluctuations at different locations are different, which makes it difficult to estimate the risk of pollutants.
The street canyon terrain is a kind of architectural layout widely used in production and living areas. The complex wind field around it can easily intercept nearby pollutants and pose a threat to internal personnel. Marucci et al. [12] studied the influence of heating different walls in a two-dimensional street on the surrounding flow field and the dispersion of internal pollutants. The results indicated that the heating of the windward walls had a greater impact on various parameters. Yang et al. [13] used a fire dynamics simulator to simulate the dispersion of chlorine horizontally leaking outside the two-dimensional street canyon, and used the LES method to restore the vortex shape and pollutant flow state in several street canyon configurations. Xu et al. [14] proposed a computational fluid dynamics (CFD) method for simulating gas dispersion in urban environments, explored the emission and dispersion process of line-source heavy gas pollutants in extremely long street canyons, and compared concentrations of pollutants near the canyon walls. Most research on street canyons has adopted the infinite two-dimensional canyon model, which can represent some topographical features of street canyons, but ignores the horizontal airflow exchange between street canyons and the external airflow. In many studies on the leakage of pollutants from cities or factory buildings [15,16,17], short street canyons are common, and pollutants spread significantly along street canyons. Therefore, investigating the terrain of three-dimensional short street canyons is crucial. Many scholars have undertaken efforts to improve the accuracy of numerical simulation. Ferreira et al. [18] proposed a novel jet model, DESQr (Diameter of Equivalent Simulation for Quick Run), which was implemented in the framework of FDS (Fire Dynamics Simulator) and able to capture turbulent eddies in a simulation. Vianna et al. [19] modified the classic porosity distributed resistance formulation, and suggested a new model that represented the part of the filtered geometry from the original model through the porosity values of the unstructured tetrahedral mesh. Ferreira and Tatiele et al. [20] combined the Gilbert–Johnson–Keerthi distance algorithm and the finite volume to obtain refined porosity values and processed complex geometries within a feasible calculation time.
In the present work, the distributions of the flow field around street canyon terrains and the effects on the dispersion of heavy gas pollutants were investigated. This paper is divided into five sections. Section 2 describes the wind tunnel experimental devices, concentration display system, and three experimental programs. Section 3 introduces the conditions of three-dimensional numerical simulation. Wind tunnel experiments and numerical simulations were carried out on different street canyons. The impacts of different aspect ratios and height ratios on streets are discussed in Section 4. In addition, the existence of the most unsafe wind speed under the typical ideal street canyon terrain was explored. In this study, the dispersion of pollutants was restored by adopting the laser particle tracking technology, which realized the overall display of the concentration rather than providing only the results of individual points and assisted with CFD simulation to explore the manner in which pollutants enter the street canyon.

2. Wind Tunnel Experiments

Wind tunnel experiments were performed to explore the properties of heavy gas dispersion. The overall devices consisted of a DC wind tunnel and a concentration display system (a laser source fixed on the top of the wind tunnel to illuminate the observation section, and a high-speed camera for taking cross-section images from the side of the wind tunnel) erected around it. Laser particle tracing technology was adopted to display the gas concentration.

2.1. Experimental Devices

Experiments were performed in the TULTWT direct-flow wind tunnel with a wooden structure in the Fluid Mechanics Laboratory of Tianjin University, as shown in Figure 1. The leakage source (CO2) with a diameter of 0.005 m was located at the centerline 1 m from the entrance of the experimental section, of which the cross-section was 0.35 × 0.45 m. The size ratio of the wind tunnel experimental model to the actual street was 1:400. The front end of the experimental section was equipped with wedges and rough elements to simulate the real urban wind profile, and the IFA300 constant temperature hot wire anemometer was used to measure the wind speed. The final measurement of the set ambient wind conformed to the power law with the reference point height, z0, being 0.1 m, and the characteristic wind speed, u0, being 1.3731 m/s:
u = u 0 z z 0 α
where α is the wind profile index, and its fitted value was 0.243. The wind profile index is related to atmospheric stability and terrain conditions. “Technical Methods for Establishing Local Air Pollutant Emission Standards (GB/T 3840-1991)” [21] provides a series of index reference values under different atmospheric stability and terrain conditions, as shown in Table 1. The fitting result accorded with the distribution law of the urban boundary layer, and the atmospheric stability was between C and D. Atmospheric stability varies from A to F from strong to stable, and when the stability is between C and D, it is close to neutral. The experimental wind speed and fitting curve are shown in Figure 2. In this work, the density Froude number, Fr, and the building Reynolds number, ReH, were selected as the similarity criterion:
Fr = u 0 2 g 0 L
Re H = ( u H H ν )
where:
u0 represents the characteristic velocity,
g0’ represents the relative acceleration (=g(ρs − ρa)/ρa, ρs is the density of the leaking gas, ρa is the air density),
L represents the characteristic length,
ν represents the air kinematic viscosity,
uH represents the wind speed at the height of the building,
H represents the building height.
During the experiment, the Froude numbers remained consistent and the Reynolds number was independent. The building Reynolds number was 2112.16, which was greater than its critical value of 2.1 × 10³ [22,23].

2.2. Concentration Display System

The purified water was atomized into tracer particles with a diameter of less than 9 μm using a Konsung 408B ultrasonic atomizer. The observation section was taken by a Nano Sense MKIII high-speed camera with a shooting frequency of 10 Hz and continuous shooting for 20 s. Figure 3 shows the instantaneous concentration field grayscale pictures taken by the camera and the average concentration field grayscale pictures obtained by processing. The red arrow indicates the direction of the leakage and the yellow arrow signifies the direction of the ambient wind. The experiment satisfied the far-field scattering condition, that is, the intensity of light scattered by particles at a certain position was proportional to the particle concentration [24]. As shown in the figure, the concentration at 0.005 m above the source was selected as the reference C0 for the volume concentration of carbon dioxide, and the concentration of carbon dioxide at other positions was subjected to dimensionless processing, namely:
C ¯ = C C 0 = I I 0
where:
C ¯ is the dimensionless carbon dioxide concentration,
C0 is the carbon dioxide concentration near the selected source location,
I0 is the light intensity near the selected source location.
The reliability of the numerical simulation results was verified by carrying out the building terrain experiment, as shown in Figure 3. The numerical simulation software was Fluent 16.0, and the turbulence model was RNG k-ε, which is well adapted to heavy gas dispersion simulation [25,26]. Turbulent intensity (5%) and turbulent viscosity ratio (10) were selected as the specification method. The geometric mean deviation (MG), geometric mean variance (VG), and the fraction of predictions within a factor of two observations (FAC2) were selected as the evaluation criteria, and the results are shown in Figure 3c. The statistical performance should meet the requirements of 0.7 < MG < 1.3, VG < 4, 0.5 < FAC2 < 1 [27].

2.3. Setup of Wind Tunnel Experiments

In the experiments, the street canyon terrains were modeled with a single group of buildings made of plexiglass. To facilitate the analysis of experimental results, all distances during the experiment were normalized based on the height, H, of the normal building (3 cm). The carbon dioxide release rate was maintained at 1.5 L/min during the experiments. The effects of the aspect ratio of the street canyons and the height ratio of the constituent buildings on the wind field around the buildings, and the dispersion of pollutants were studied. In addition, the influence of the wind speed change on the dispersion of pollutants in the typical ideal street canyon was investigated. The specific plan was as follows:
(1) To study the influence of street aspect ratio, a set of architectural models was set up to reflect street canyons. The building size (L × W × H) was 9 × 3 × 3 cm, and the street width was 1.5, 3, and 6 cm. Therefore, the street aspect ratio Rw was 2.0, 1.0, and 0.5, reflecting a deep street canyon, typical ideal street canyon, and shallow street canyon, respectively.
(2) To study the influence of the height ratio of buildings, a set of building models with different heights was set up to reflect street canyons, and the building size (L × W × H) was 9 × 3 × 3 cm (lower) and 9 × 3 × 6 cm (higher). The height ratio RH (upstream/downstream) of the formed street canyon was 0.5, 1.0, and 2.0, reflecting a step-up street canyon, a typical ideal street canyon, and a step-down street canyon, respectively.
(3) To study the influence of wind speed on the street canyon, under the typical ideal street canyon condition, four sets of experiments with characteristic wind speeds of 0.9217, 1.0947, 1.3731, and 1.5244 m/s and wind profile indexes of 0.243 under power law environmental winds were set up.

3. Numerical Simulation

A simulation model was established according to the size of the wind tunnel experiments. The typical ideal street canyon configuration with street aspect ratio Rw and height ratio RH of 1.0 is shown in Figure 4a. The building height was H, and the upstream building model was located at the midline 2 H downstream of the leakage source. The width of the street formed by the two buildings was H. The ICEM non-structural tetrahedral grid was used to mesh the model. In addition to refining the grids of ground, buildings, and the vicinity of the leak source, the independence of the mesh was also verified. Three kinds of grids were set up for comparison, and the number of grid cells was 1,603,409, 2,528,821, and 6,740,591, as shown in Figure 4b. Finally, the grid with 2,528,821 cells was selected. Under the same conditions, the number of grid cells in the model under each configuration condition in the simulation process exceeded 2.5 million. The numerical simulations were performed with all parameters set according to the wind tunnel experiment, and the user-defined function (UDF) was used to input the inlet wind speed to fit the environmental result. The ambient wind and the leakage source inlet were set as the velocity inlet, and the wind tunnel outlet was set as the outflow outlet. In addition, the buildings and the ground were prescribed non-slip walls, and other boundary conditions were kept symmetrical. The roughness was the default value on the standard wall condition. In addition, the solution method was the Simple mode, and the residual error control was 10−4.

4. Results and Discussion

4.1. Effects of Street Canyon Aspect Ratio on Pollutant Dispersion

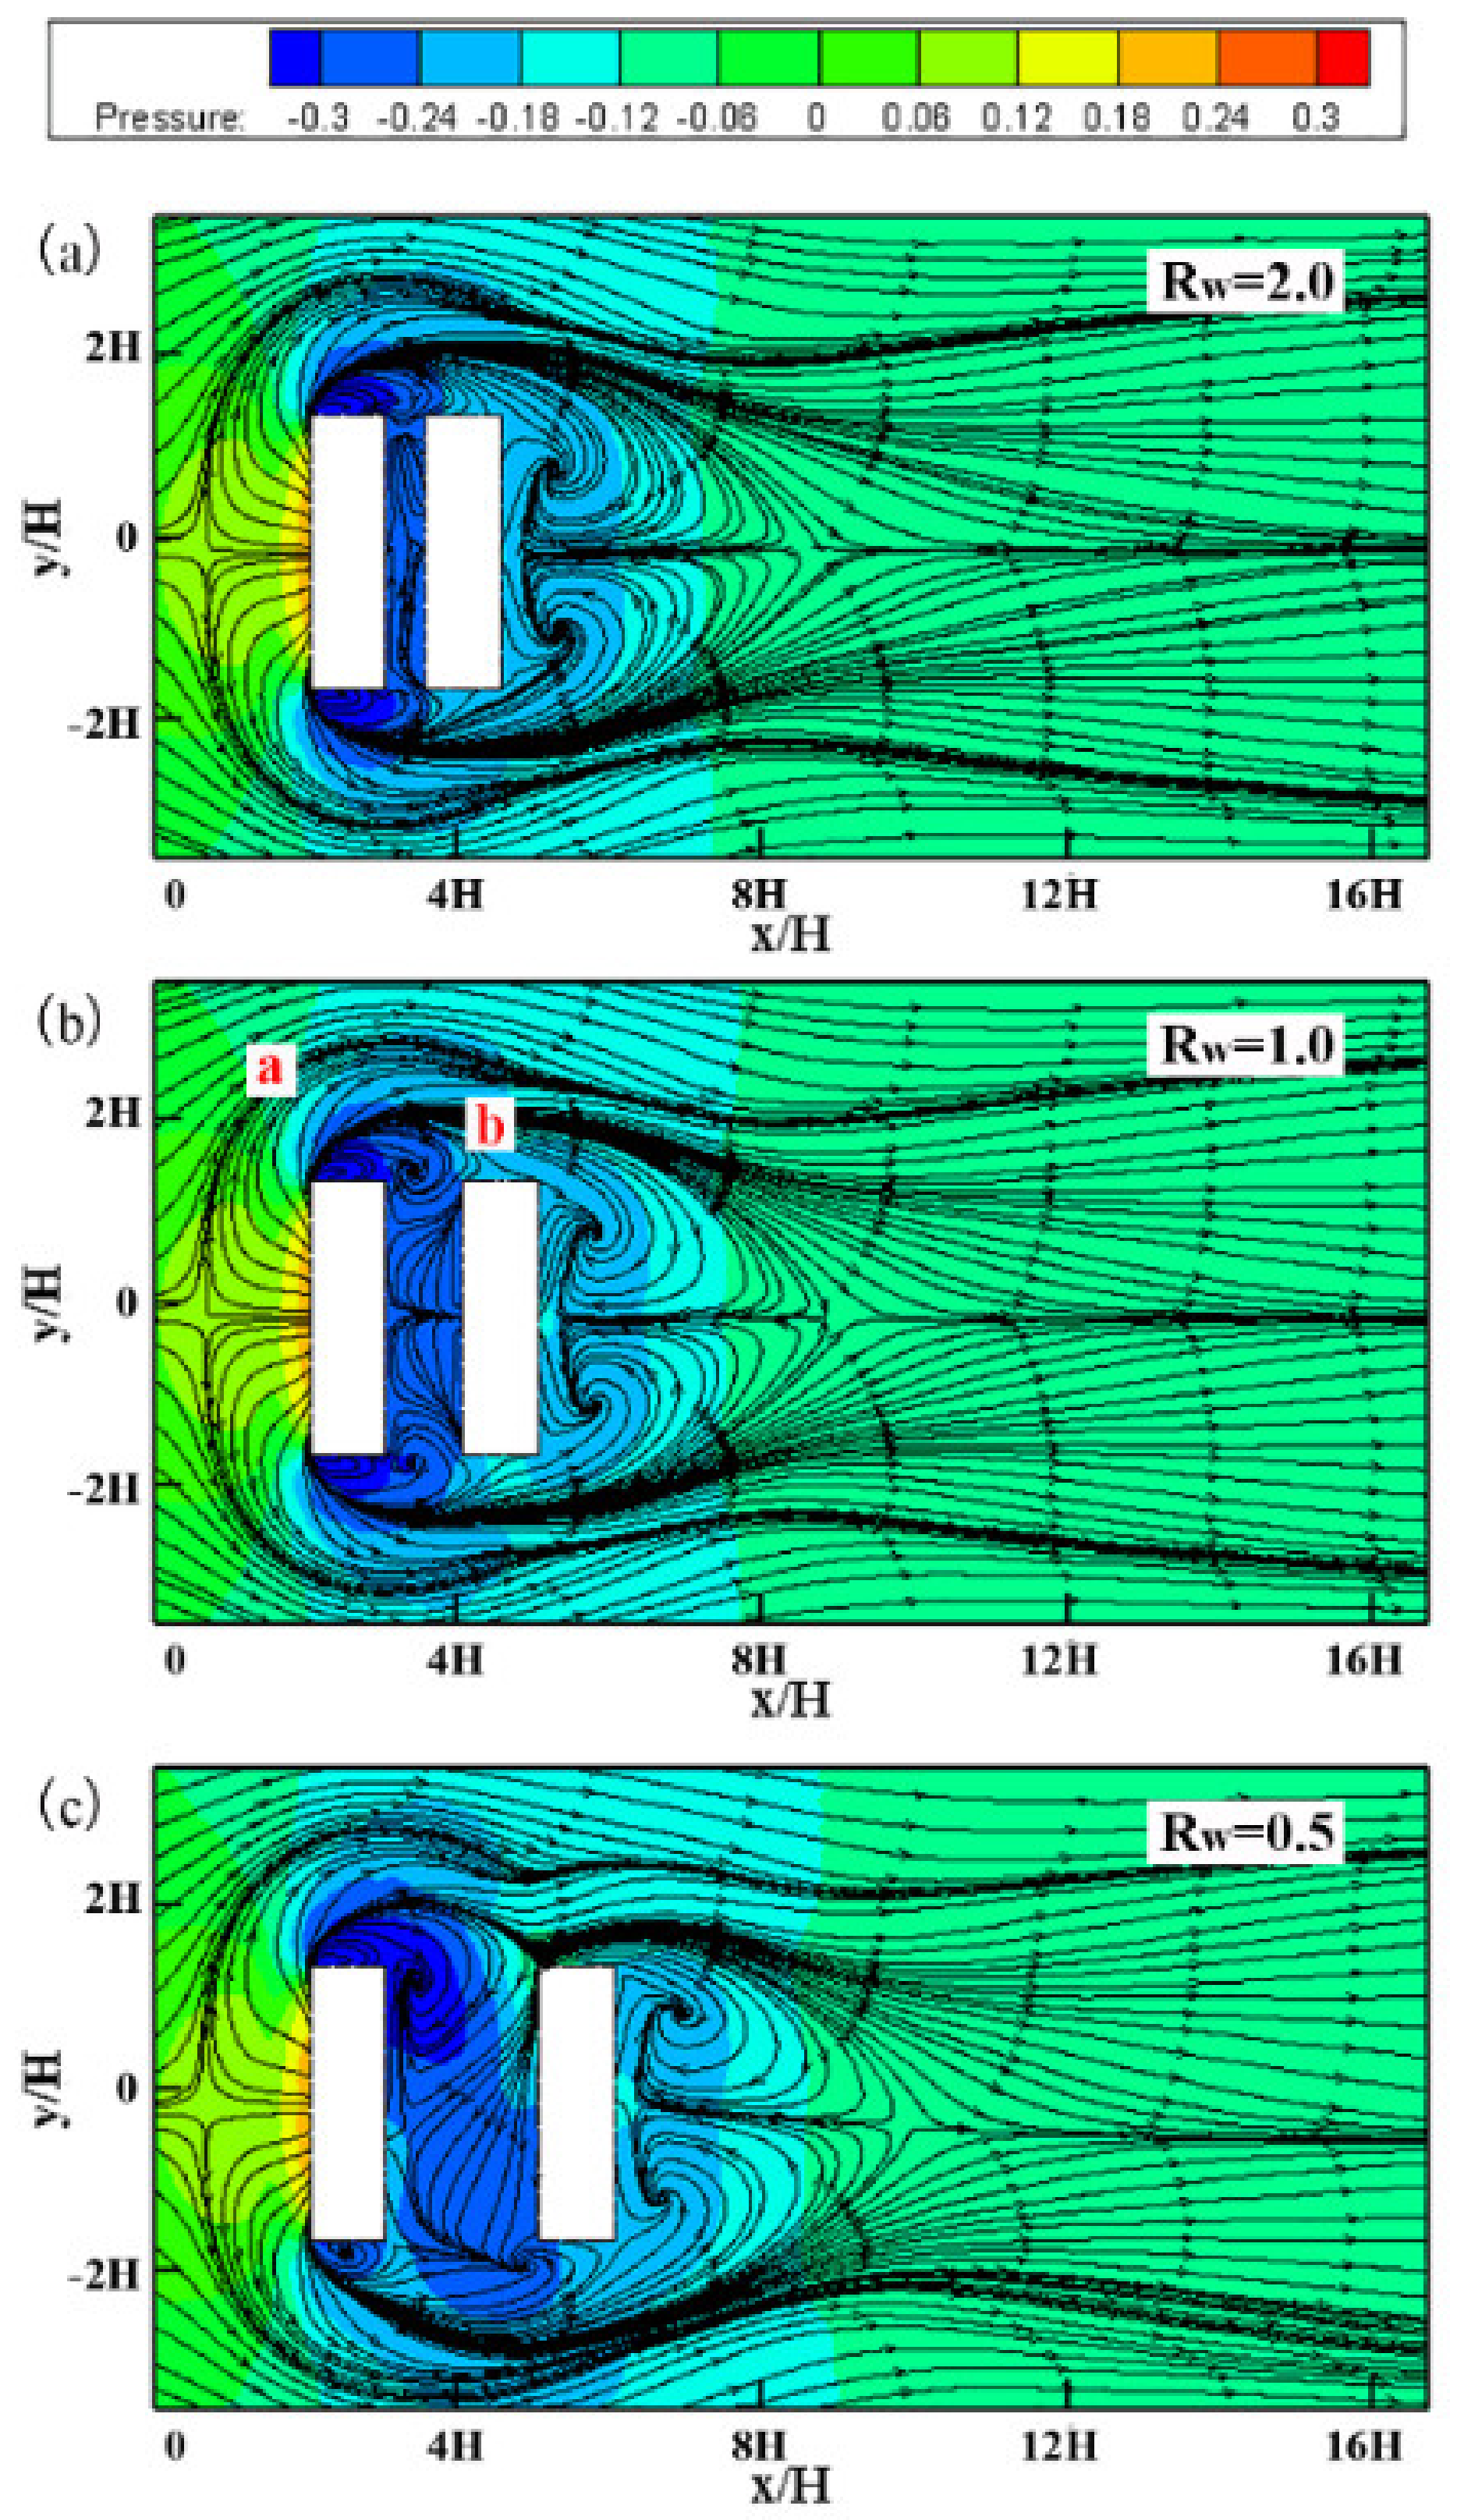
Figure 5 shows the time-averaged streamlines and pressure contours of the horizontal plane at street ground position (z/H = 0.01) with different aspect ratios. The overall pressure contours of streets under different configurations remain similar. The high-pressure areas are located on the windward side of the upstream buildings, and low-pressure areas are concentrated in street canyons and the wake recirculation areas. The low-pressure position corresponds to the vortex position in the flow field, which proves that the area with reduced air density attracts the surrounding wind flow, forming the vortex with complex manifolds. When the street aspect ratio Rw is 2 and 1, the wind flow around the buildings is distributed symmetrically. Among these buildings, the streamlines are perfectly symmetrical under the typical ideal street canyon (Rw = 1). As shown in Figure 5b, the main separation curve a and the curve b around the recirculation zone are marked in the typical ideal street canyon flow chart. Clearly, the two curves caused by the upstream building are complete, whereas the main separation curve of the downstream building is confined to the street canyon. In addition, the recirculation areas caused by the two buildings overlap to form a complete curve b. Therefore, the overall streamline distribution is similar to that of the isolated building terrain [28]. The comparison of the results in Figure 5a,b shows that the differences are concentrated in the interior and both ends of the street canyons. Two symmetrical vortices are formed at the ends of the typical ideal street canyon. Nearly half of their coverage is in the street canyon, which promotes the air exchange inside and outside the street canyon. Due to the absence of a complete vortex at the end of the deep street canyon (Rw = 2), the degree of air exchange is less than in the former case. The near-surface streamline contours of the shallow street canyon (Rw = 0.5) are different from the previous two, as shown in Figure 5c. As the distance between the buildings increases, the vortex at both ends of the street canyon has more space for development, and its coverage almost covers the entire street canyon, forming two huge vortices in opposite directions. When the width of the street canyon is narrow, the interior is filled by the airflow from the top, and the volume of vortex at both ends remains small, thus forming a symmetrical structure. However, when the width of the street canyon is wide, the airflow entering the street canyon from both ends is fully staggered and mixes to fill the middle part of the street canyon, forming two vortices in opposite directions and resulting in the asymmetry of the flow field. The asymmetric flow field in the street canyon extends to the surrounding flow field, and huge vortices undoubtedly increase the air exchange.
Figure 6 shows the time-averaged streamlines and flow velocity contours of street buildings with different aspect ratios in the middle horizontal plane (z/H = 0.5). None of the main separation curve a exists, curve b remains, and the entire streamlines are in a state of contraction. The distribution of vortices in the flow field in the middle of the buildings is consistent with the flow field on the ground. By comparing the pressure contours in Figure 5, the extremely low pressure around the buildings is concentrated on the center of each vortex, whereas the extremely low velocity is focused on the position where the vortex intersects.
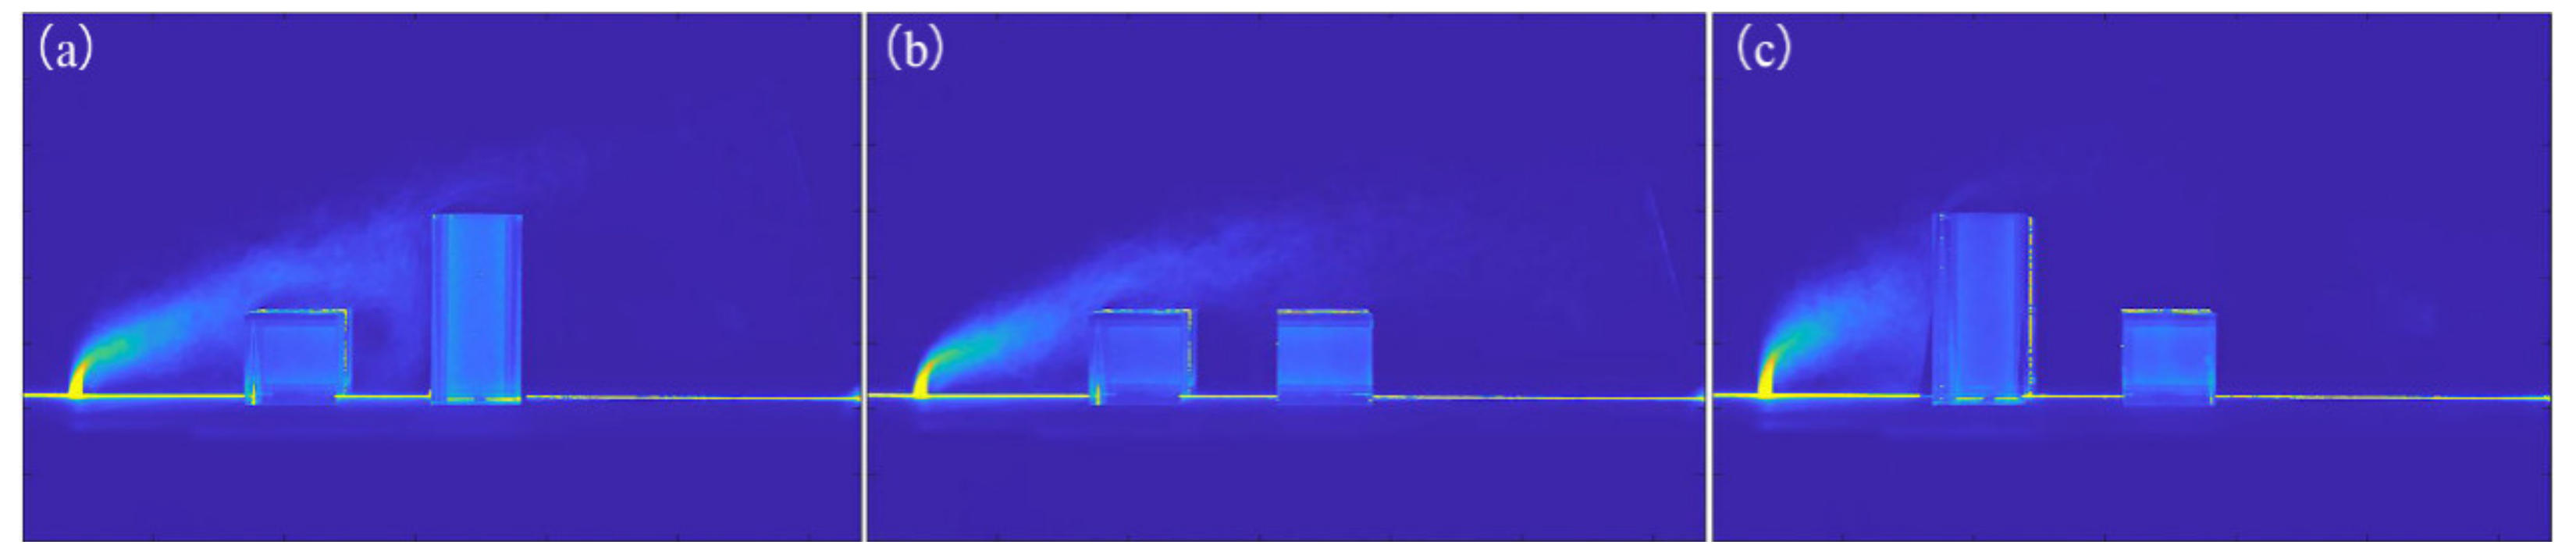
Figure 7 shows the time-averaged streamlines and flow velocity contours of the vertical plane in the middle of street buildings (y = 0) with different aspect ratios. The longitudinal streamlines of the three street canyons are similar, and the vortex centers are close to the top of the downstream buildings. As the street aspect ratio decreases, the vortex shape on the vertical section tends to be complete. The air generally flows in near the windward side of the downstream buildings and flows out near the leeward side of the upstream buildings.
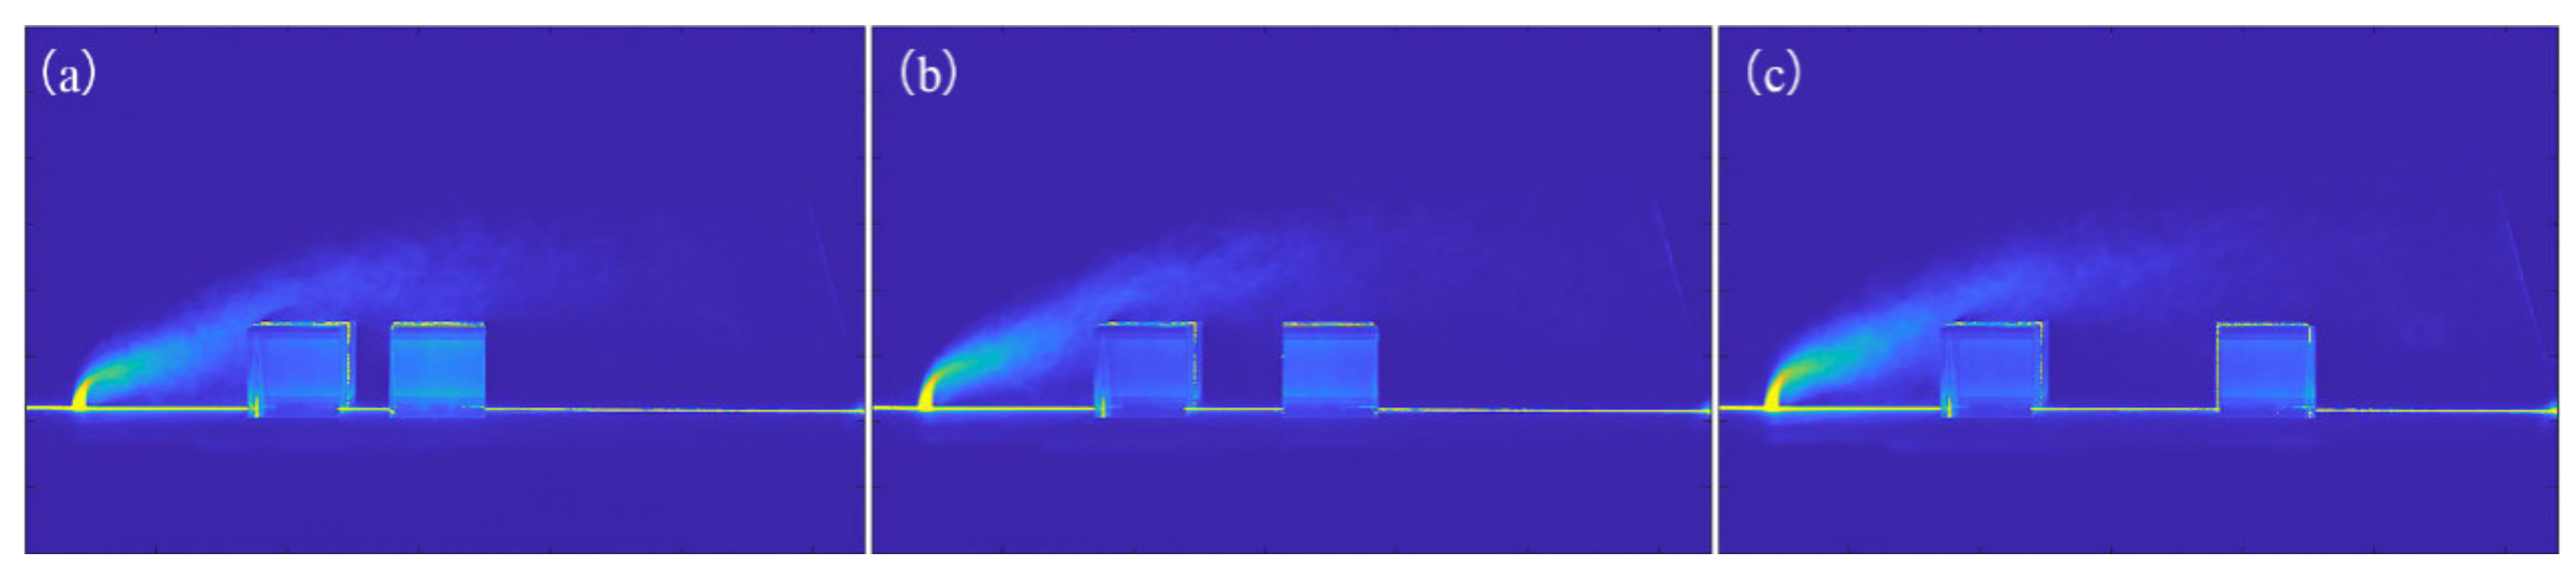
Figure 8 shows the instantaneous concentration fields of the wind tunnel experiment on the middle vertical plane of street buildings (y = 0) with different aspect ratios. Results show that the gas released during the experiment is dispersed in agglomerates. During the dispersion process, the air mass expands, and the diameter of the pollutant plume continues to increase. Buildings aggravate the turbulence of the surrounding airflow, thereby intensifying the dispersion of air masses. After passing through the buildings, the thick air masses disperse into flocs and continue to spread. As shown in Figure 8, when pollutants enter street canyons from the top of the windward side of the downstream buildings, it is consistent with the longitudinal vortex distributions in Figure 7. Due to the different widths of street canyons, the dispersion spaces of pollutants after entering each street canyon are also different. During the experiment, it was observed that most of the pollutants were concentrated on the top of the deep street canyon, and flowed in a circular shape, and were not easily dispersed to the bottom, whereas pollutants easily spread to the ground in the typical ideal street canyon, and the degree of air mass agglomeration was also lower than in the deep street canyon.
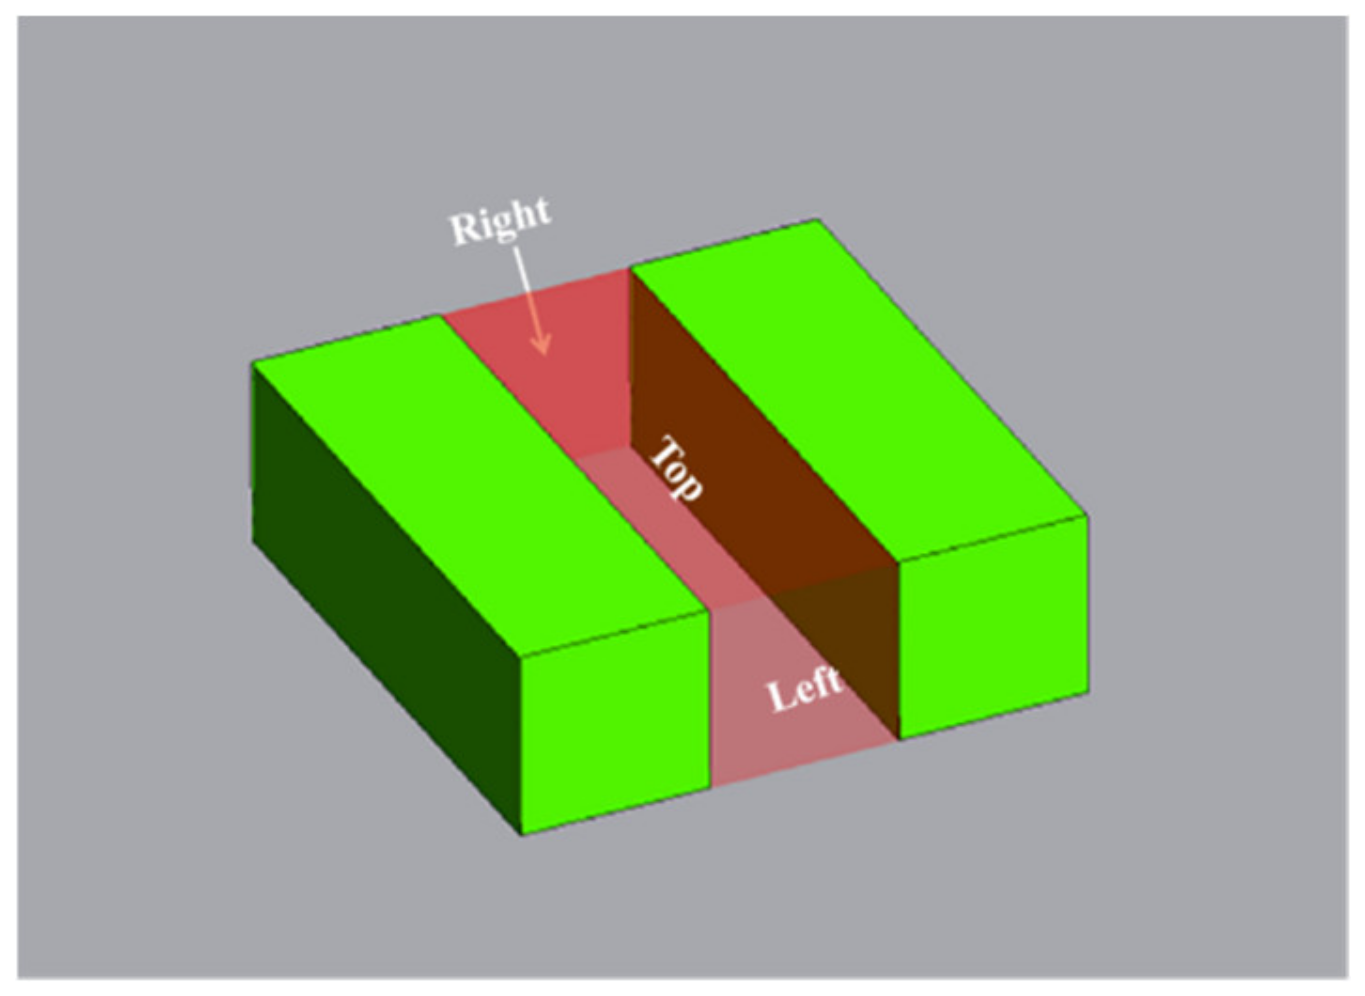
Figure 9 shows a schematic illustration of three ventilation surfaces in street canyons obtained by simulation. The interior of the street exchanges air with the surrounding environment through these ventilation surfaces. 
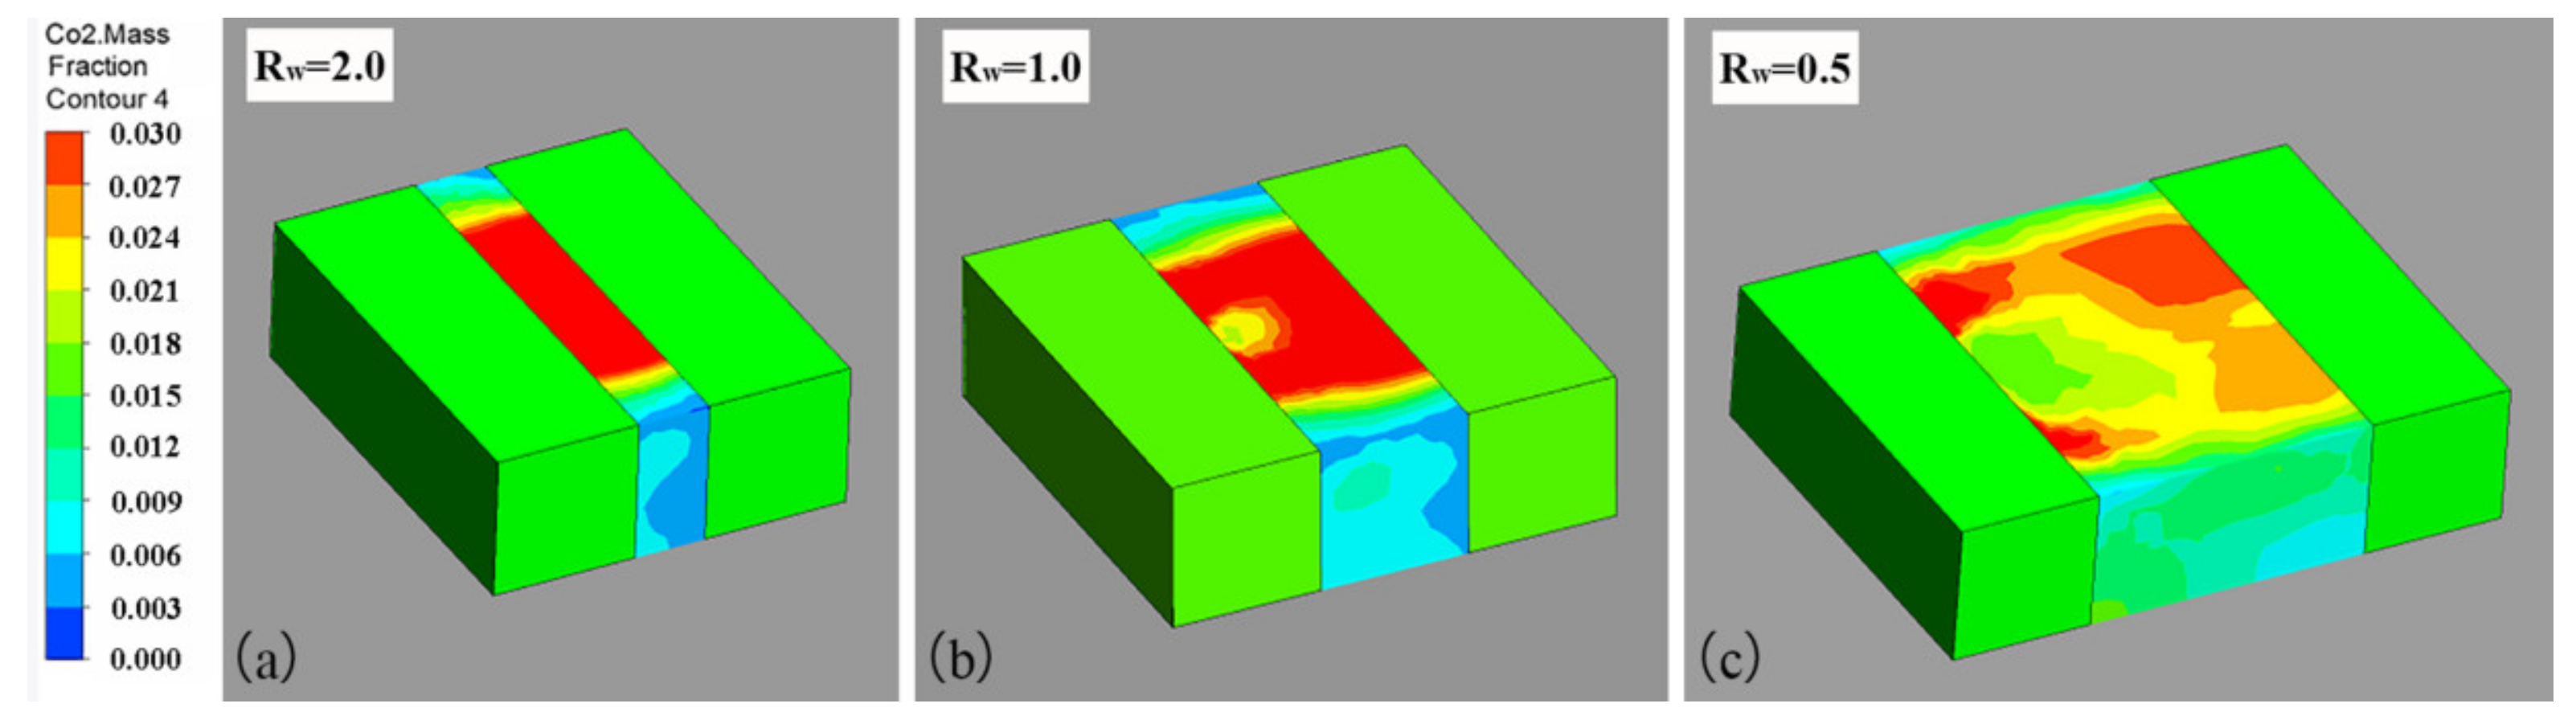
Figure 10 shows contours of the street ventilation surface concentration with different aspect ratios. Because the distribution on the left and right sides is almost symmetrical, only the left side is displayed. When Rw is different, the distributions of pollutants on the street ventilation surfaces are similar, as shown in Figure 10. The pollutants on the top surface are focused on the middle of the street, where the concentration is higher than that of the side, indicating that when the leakage source is located outside buildings, the movement of pollutants following the horizontal flow is weakened, and most of the pollutants enter through the top of the street canyon. In addition, the climbing effect of pollutants is enhanced. With the decrease in Rw, the concentration gradient on the top surface becomes more obvious, and the high concentration area is close to the downstream building wall. This may be due to the Coanda effect [29,30] and because pollutants are more likely to accumulate in the center of the vortex in the street canyon. A low concentration area exists near the center of the upstream building on the leeward side due to the fact that this area is the exit for the upward escape after the airflow circulates inside the street. External pollutants cannot easily enter, and the internal airflow carries fewer pollutants. Two high concentration areas exist on the street side ventilation surface. One is located near the middle of the top surface, and the other is located at the angle between the upstream building and the ground. This indicates that some of the pollutants entering the street from the side come from the vortex at the top and both ends of the street, and the remainder are mainly carried in by the surrounding airflow.
Figure 11 shows the percentage of pollutant flux per unit area of street ventilation surfaces with different aspect ratios. As the street aspect ratio Rw declines, the proportion of pollutant flux entering the street canyon through both ends of the street increases, whereas that from the top decreases, and the gap between the two declines as Rw decreases. Results show pollutants entering the canyons through the top account for a larger proportion of the streets in different configurations. As shown in Figure 5 and Figure 6, as the street aspect ratio Rw decreases, the development space of the vortex formed at the ends of the street increases, and the vortex shape is complete on the horizontal plane. When Rw =0.5, the distribution range of these two vortices almost occupies the entire street canyon. In addition, this part of the flow carries more pollutants into the street canyon, increasing the proportion of the street canyon lateral flux.
Figure 12 shows the time-averaged concentration fields of the wind tunnel experiment on the vertical plane in the middle of street buildings (y = 0) with different aspect ratios. Most of the pollutants are intercepted by upstream buildings or continue to spread above, and the pollutant concentrations in the street canyons are very low. The relative concentration per unit area C* of the street canyon was analyzed, as shown in Figure 13. It can be seen that, as the aspect ratio of street canyon increases, the relative concentration per unit area C* of the vertical plane in the middle of the street canyon also increases, which is possibly related to the size of the dispersion space. Due to the blocking effect of the buildings, the quantity of pollutants that can enter the canyons is limited. Therefore, the larger the dispersion space in the canyon, the more the pollutants are dispersed, and C* is relatively low.

4.2. Effects of Street Canyon Height Ratio on Pollutant Dispersion

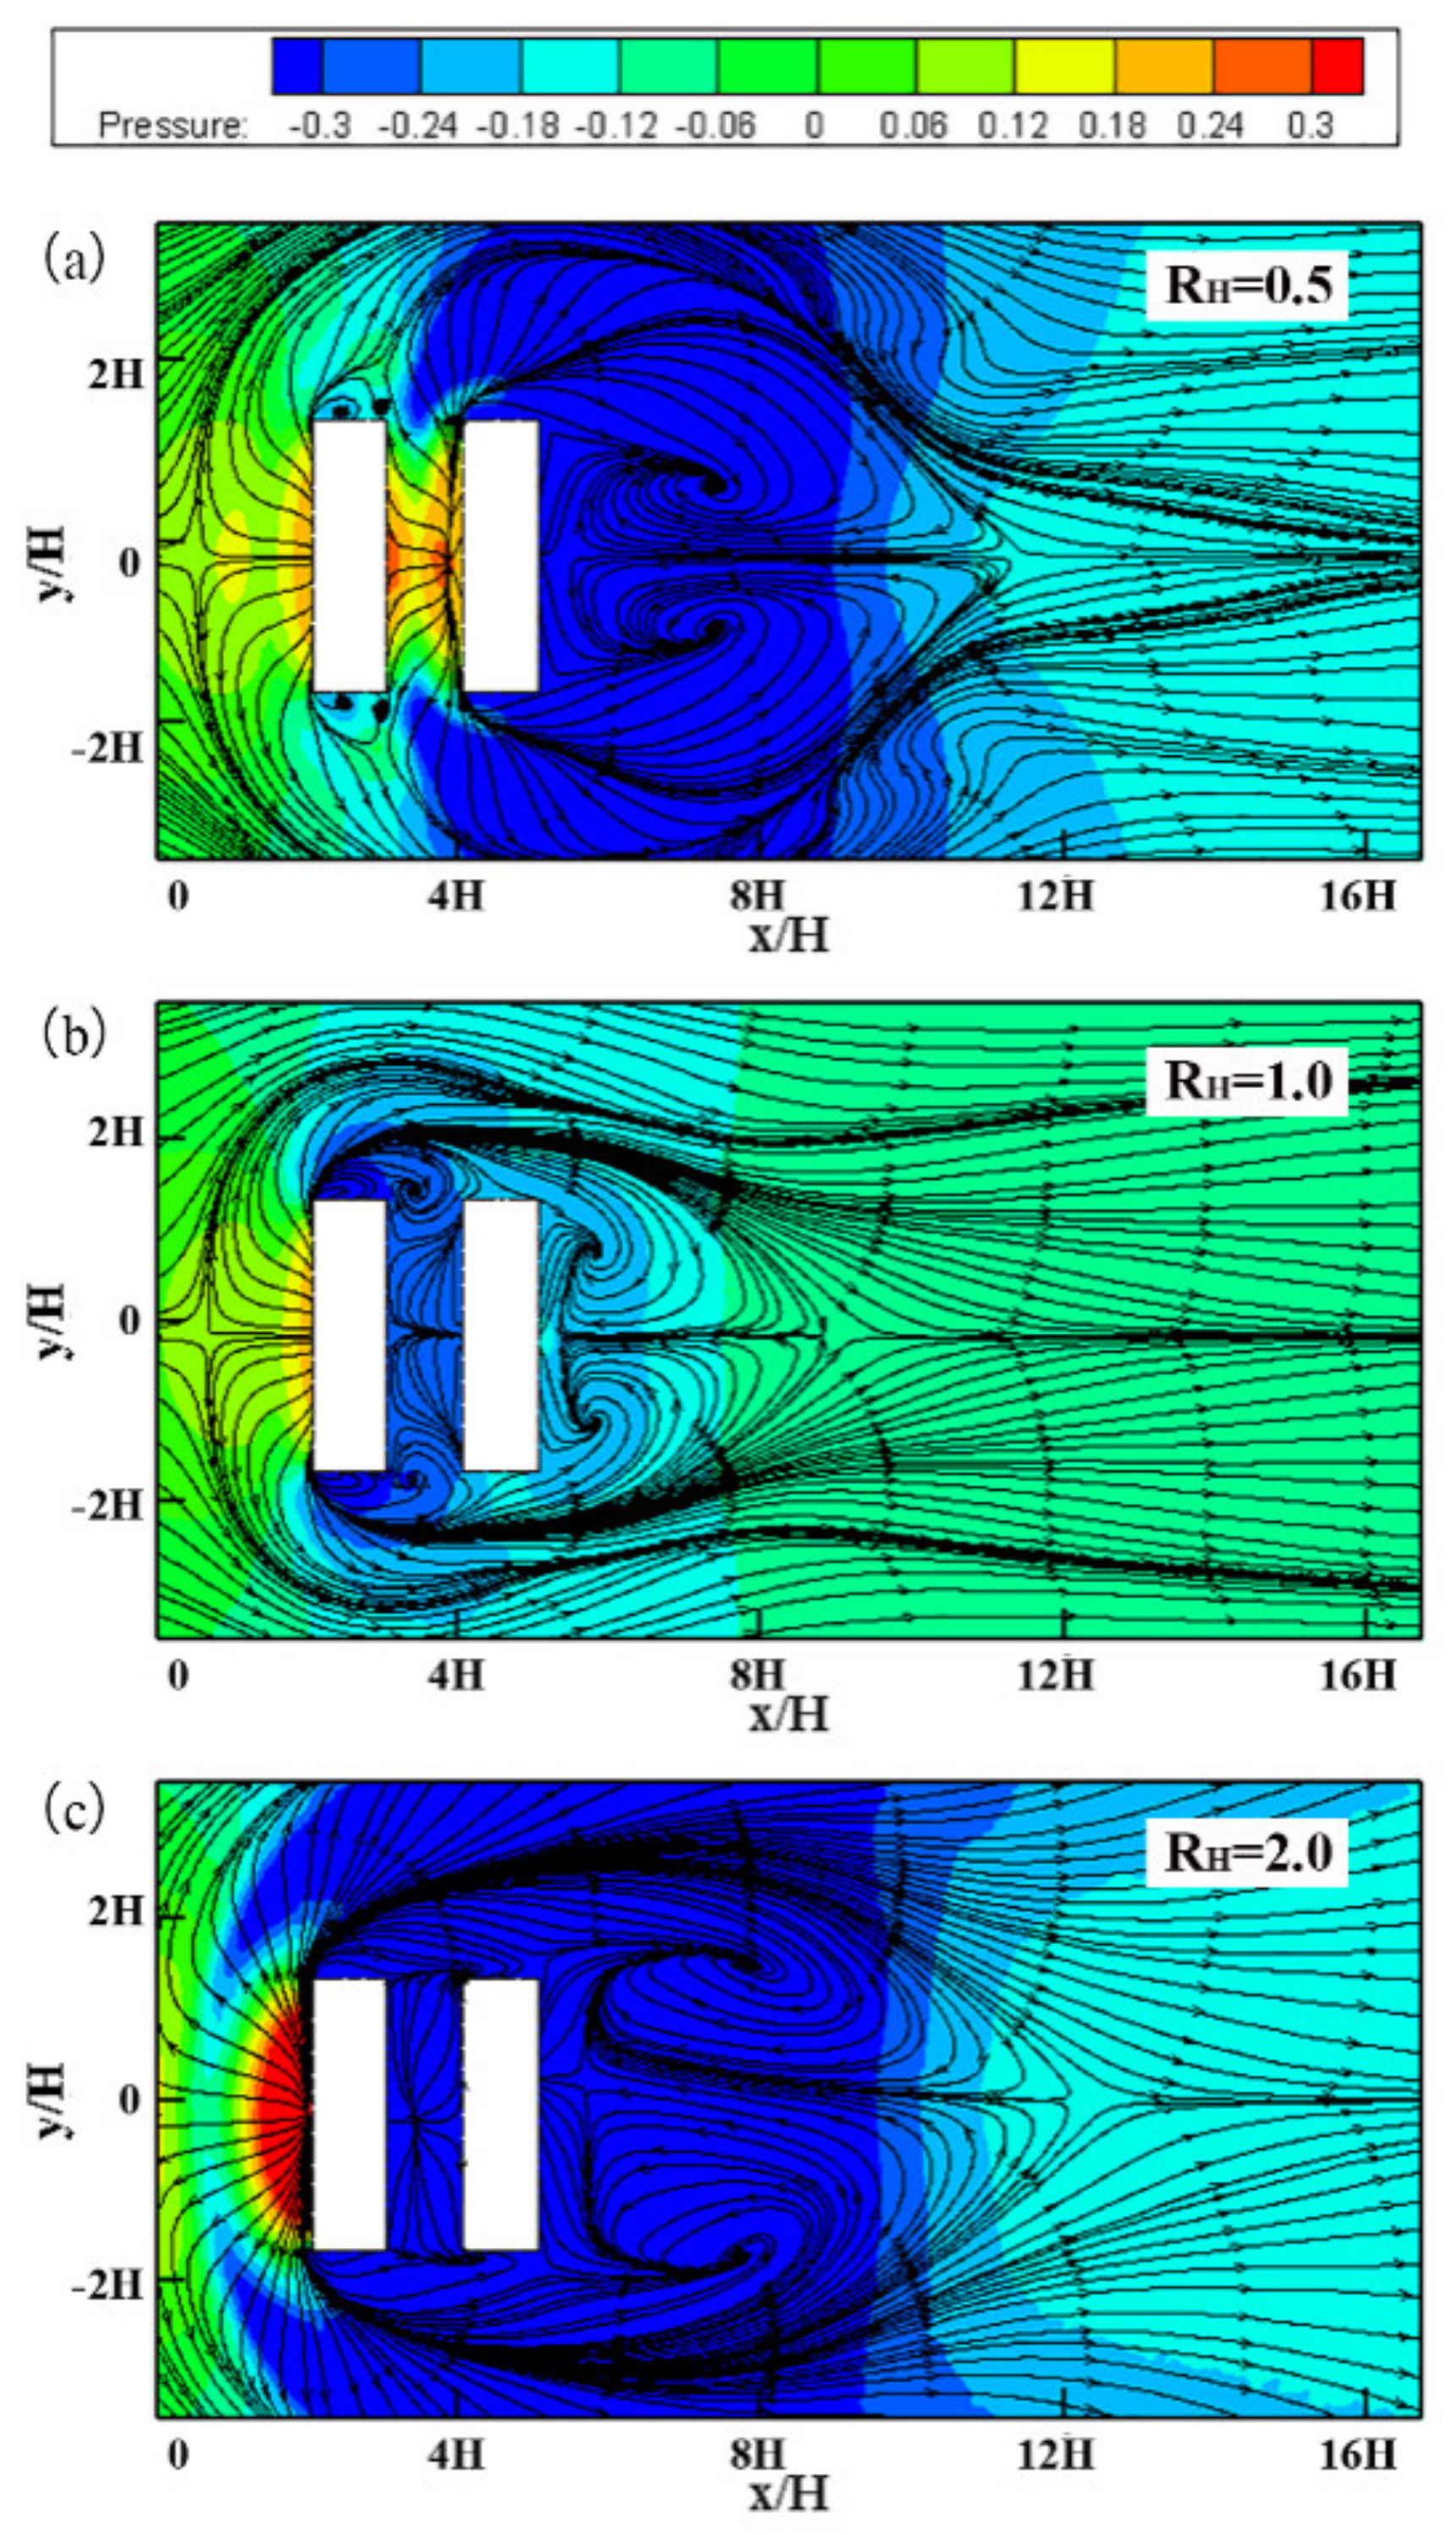
Figure 14 shows the time-averaged streamlines and pressure contours on the horizontal plane at street ground position (z/H = 0.01) with different height ratios. Clearly, higher buildings (RH = 0.5, 2.0) significantly increase the pressure gradient around them, and the low-pressure areas are distributed near the higher buildings. Simultaneously, high buildings have clear impacts on the surrounding flow fields, and regardless of whether they are located upstream or downstream, the flows affected by them are dominant. Figure 14a shows the distribution of streamlines around the topography of the step-up street canyon. The main separation curve caused by the downstream high building escapes from the inside of the street canyon and merges with curve b of the lower upstream building. Therefore, vortices do not exist at both ends of the street canyon. In the distribution of streamlines around the step-down street canyon, as shown in Figure 14c, the main separation curve caused by the upstream high building is incompletely presented, whereas the recirculation area surrounded by curve b completely covers the area affected by the downstream lower building. The main separation curve of the lower building is restricted to the street canyon. The recirculation curve does not appear, and the vortex is not formed at both ends of the street canyon. Comparing the streamline distributions of three terrains, when high buildings exist, the extension of all separation curves increases significantly. 
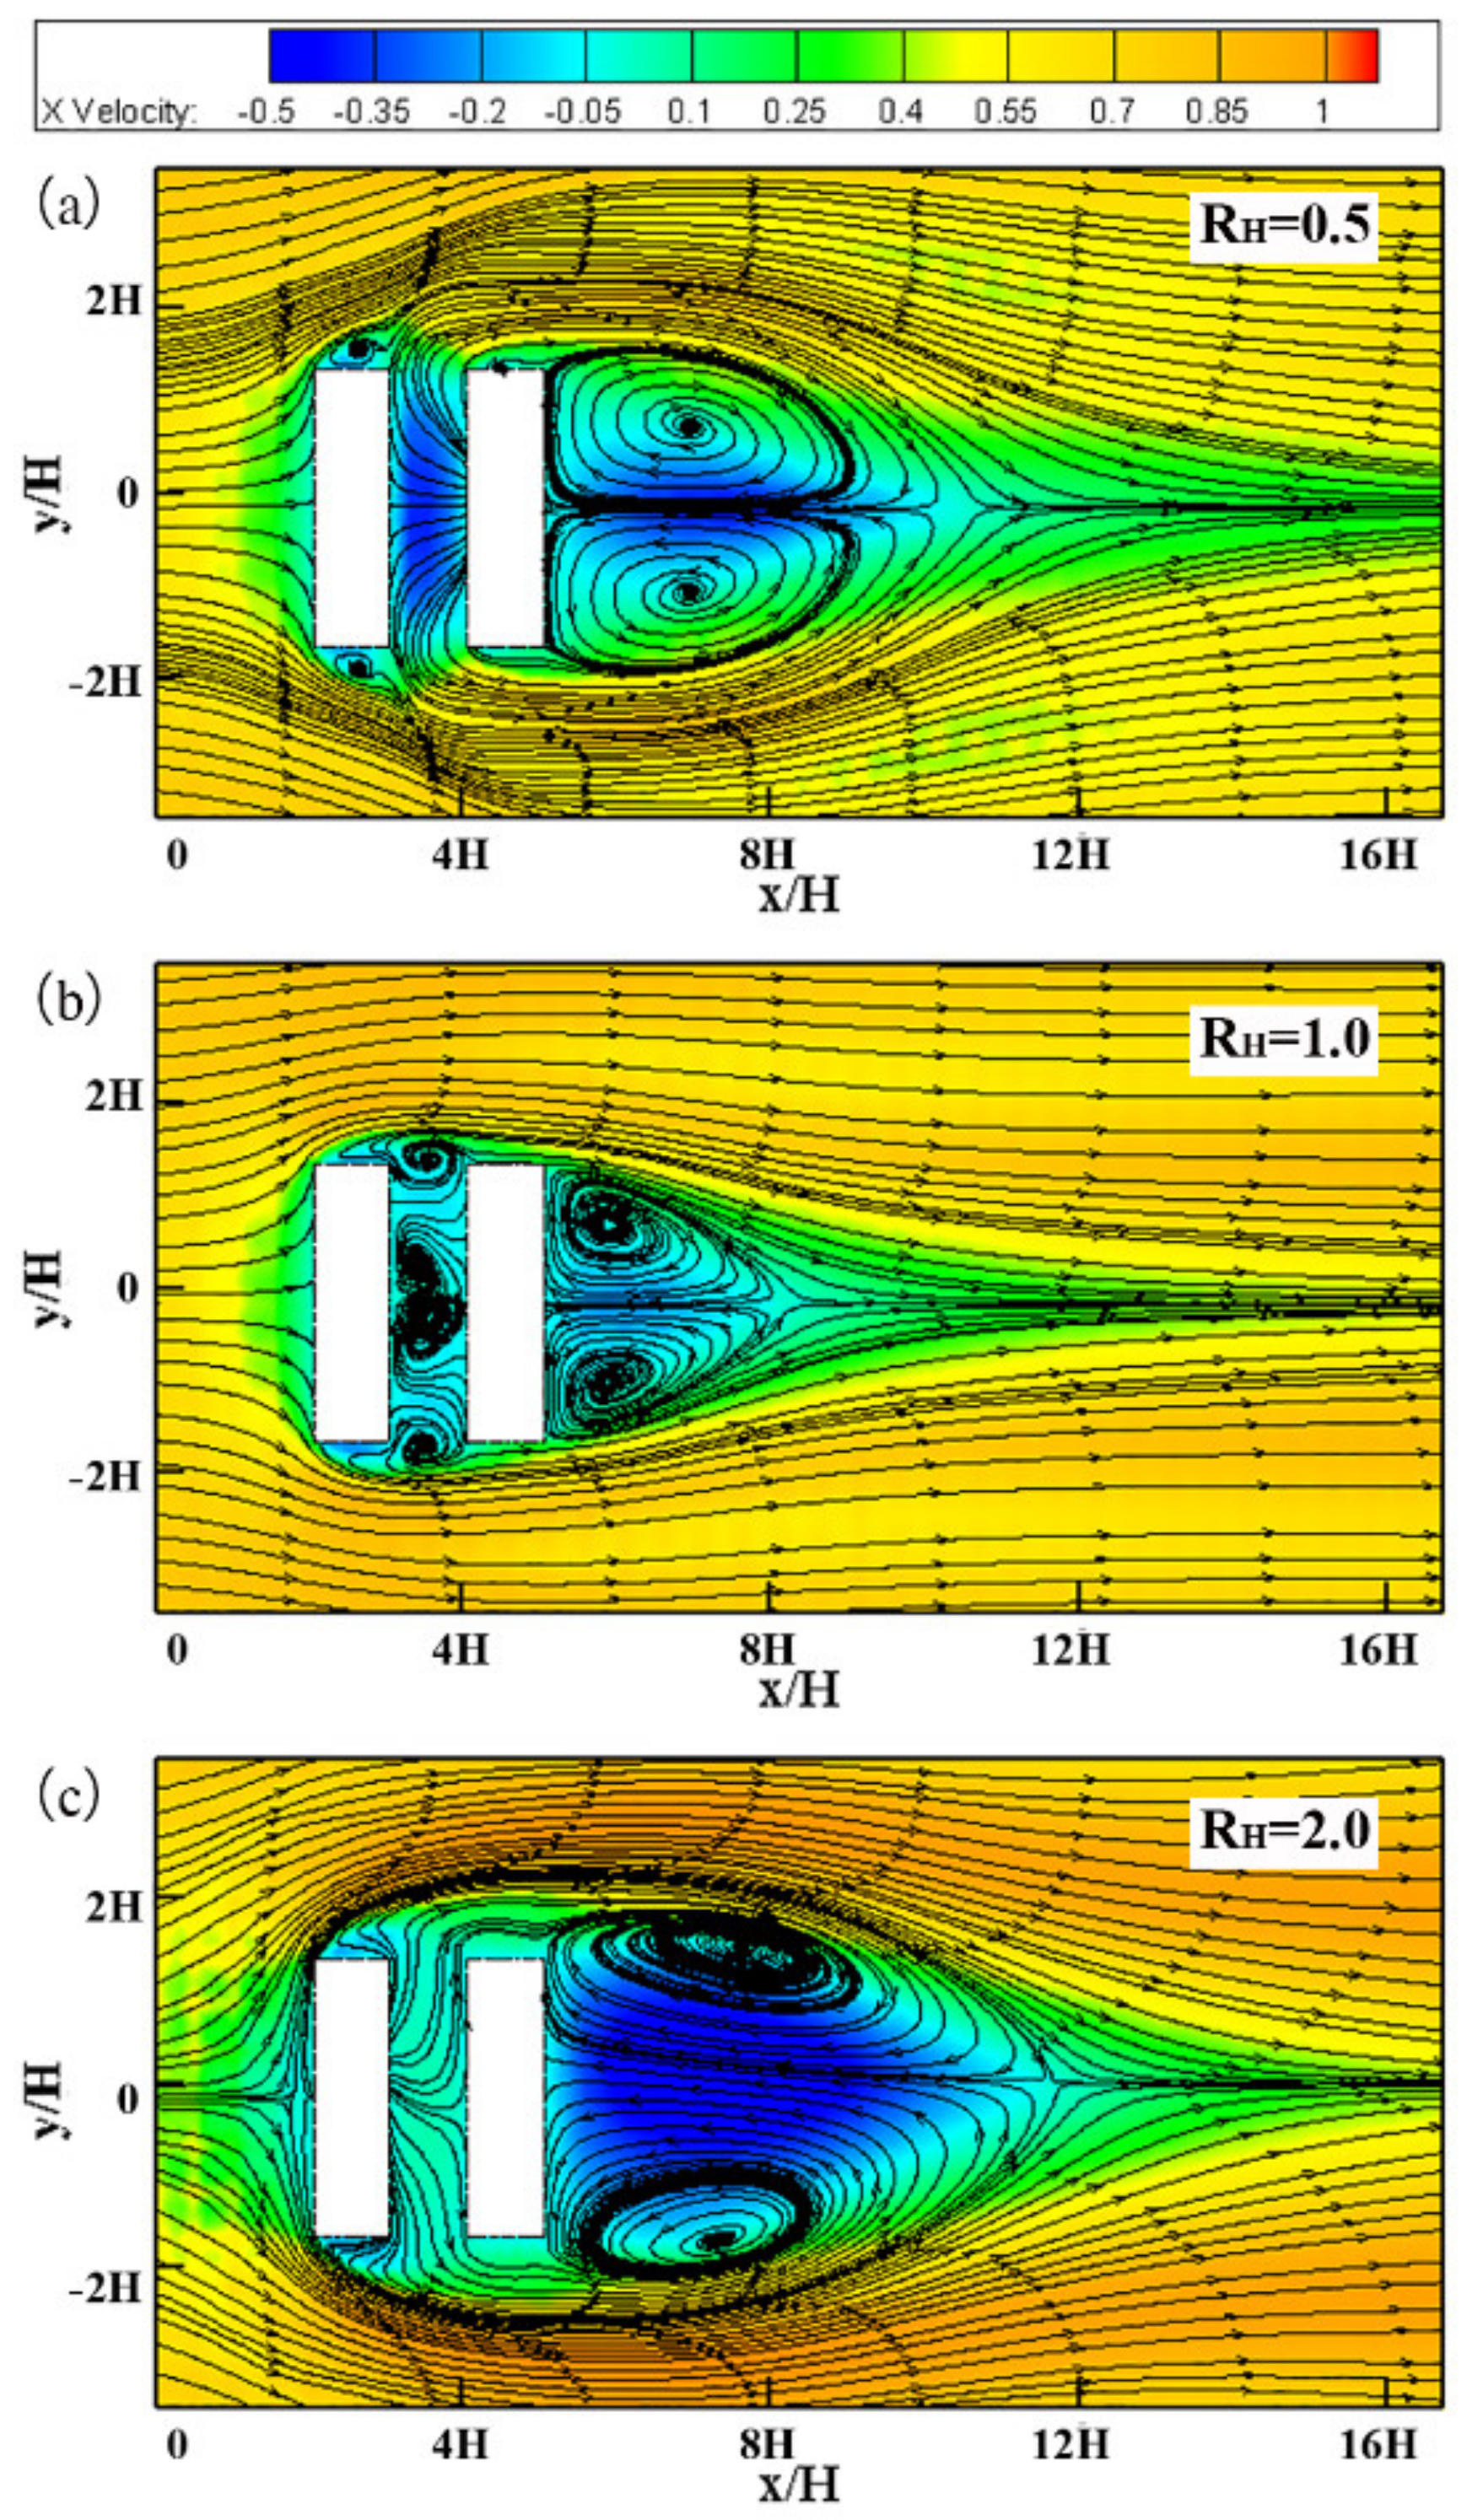
Figure 15 shows the time-averaged streamlines and flow velocity distributions of the middle horizontal plane of street buildings (z/H = 0.5) with different height ratios. After eliminating the influence of the ground, all of the flow fields are mainly affected by high buildings, with fewer vortices and simpler distributions.
Comparing Figure 15a and c of the internal flow fields of the street canyons, it can be seen that the streamlines are emitted from the side of the higher buildings, which proves that the directions of airflow flowing into the street canyons are not consistent, as shown in Figure 16. Figure 16 shows the time-averaged streamlines and flow velocity contours of the middle vertical plane of street buildings (y = 0) with different height ratios. Clearly, high buildings dominate the distribution of the surrounding flow fields. In the step-up street canyon, displayed in Figure 16a, the vortex formed in the street canyon is more complete than the vortex in Figure 16b due to the greater interception of the high building, and the center of the vortex (see Figure 16a) moves upstream. In the step-down street canyon, the main vortex formed by the high building is located at the top of the wake recirculation cavity, as shown in Figure 16c. The deformation vortex having a direction opposite to that of the normal wake vortex inside the street canyon is formed by the interaction of the buildings on both sides. According to Figure 15 and Figure 16, the step-up street canyon is located inside the recirculation area of the upstream low building, and the downstream high building more strongly intercepts the wind flow. Therefore, the internal airflow velocity of the step-up street is lower than that of the other two situations, which is likely to affect the circulation and dispersion of pollutants.
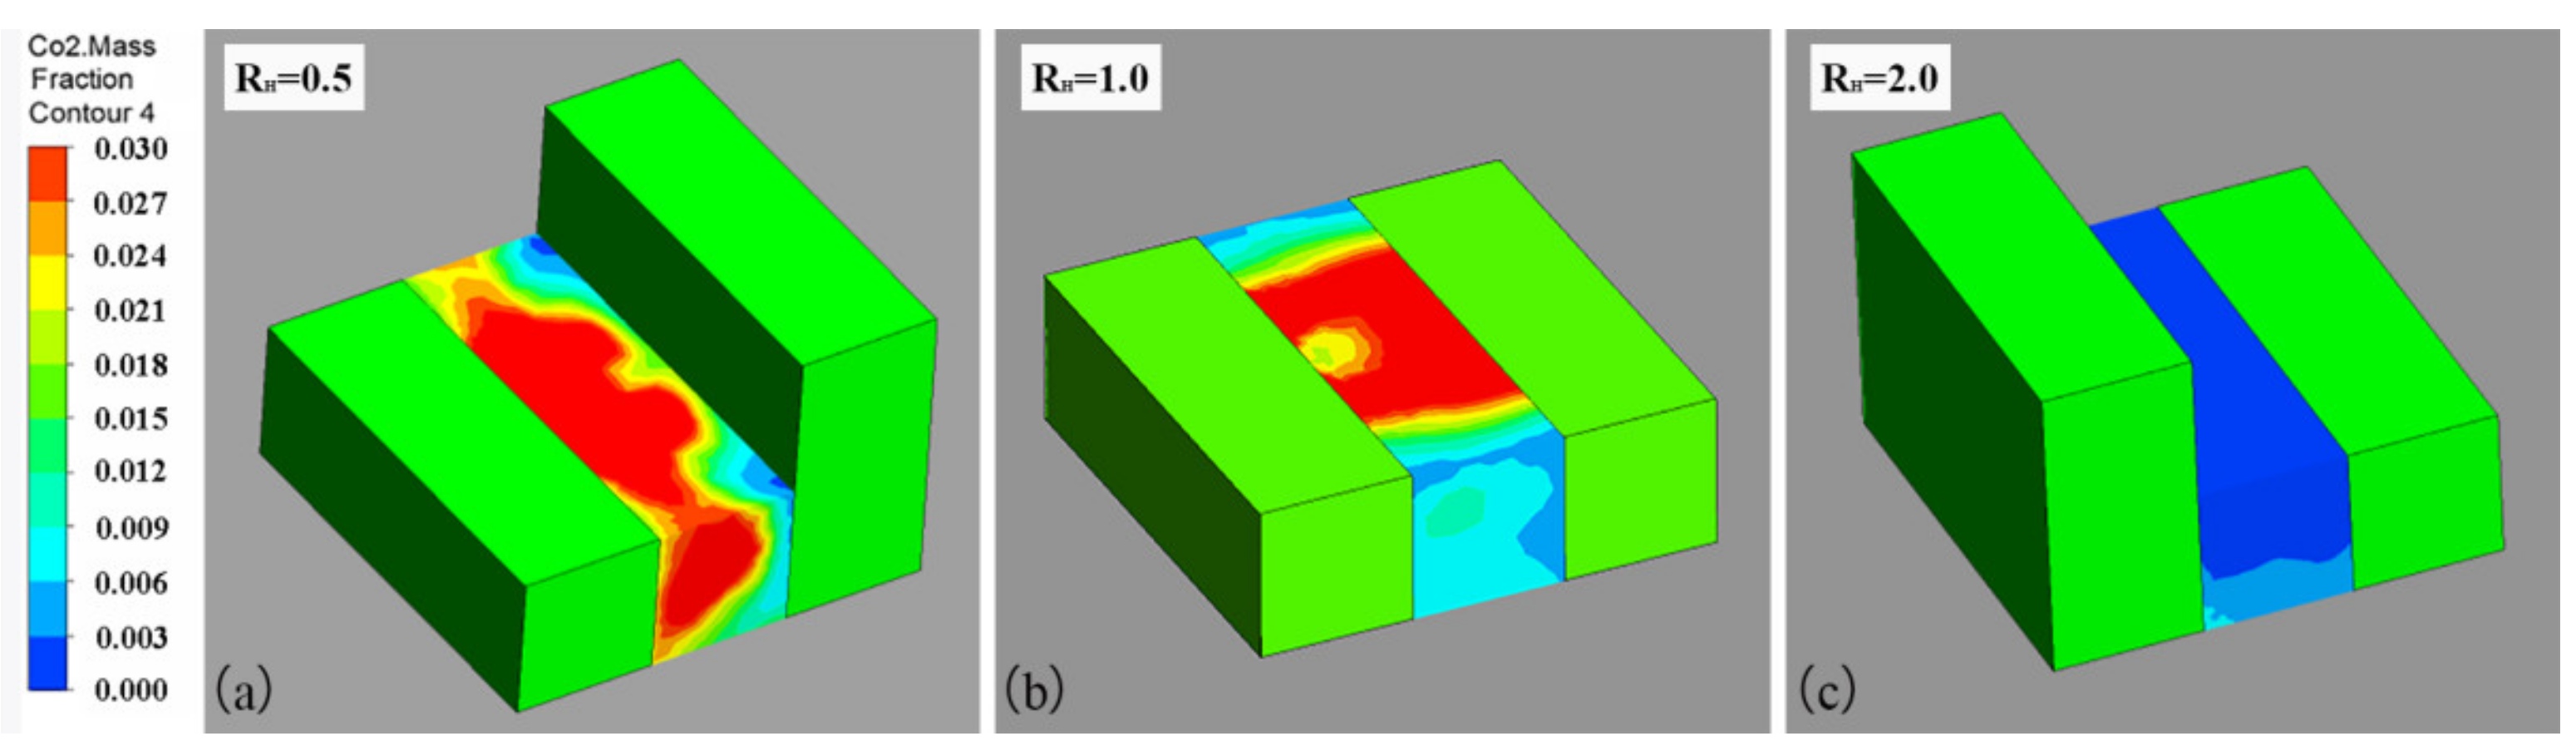
Figure 17 shows the concentration contours of street ventilation surfaces with different height ratios. The larger the windward area, the stronger the interception effect on pollutants. High buildings intercept most of the pollutants because the pollutants accumulate on their windward side. As shown in Figure 17a, the concentration of pollutants in the street canyon is relatively high. However, as shown in Figure 17c, only a small quantity of pollutants enters the flow from both ends of the street canyon through the bypass, and very few pollutants can enter from the top of the street canyon over the high building. In addition, the high concentration of pollutants at the top of the street canyon shifts from near the downstream building to the vicinity of the upstream building, which is consistent with the movement of the inner vortex center, as shown in Figure 17a.
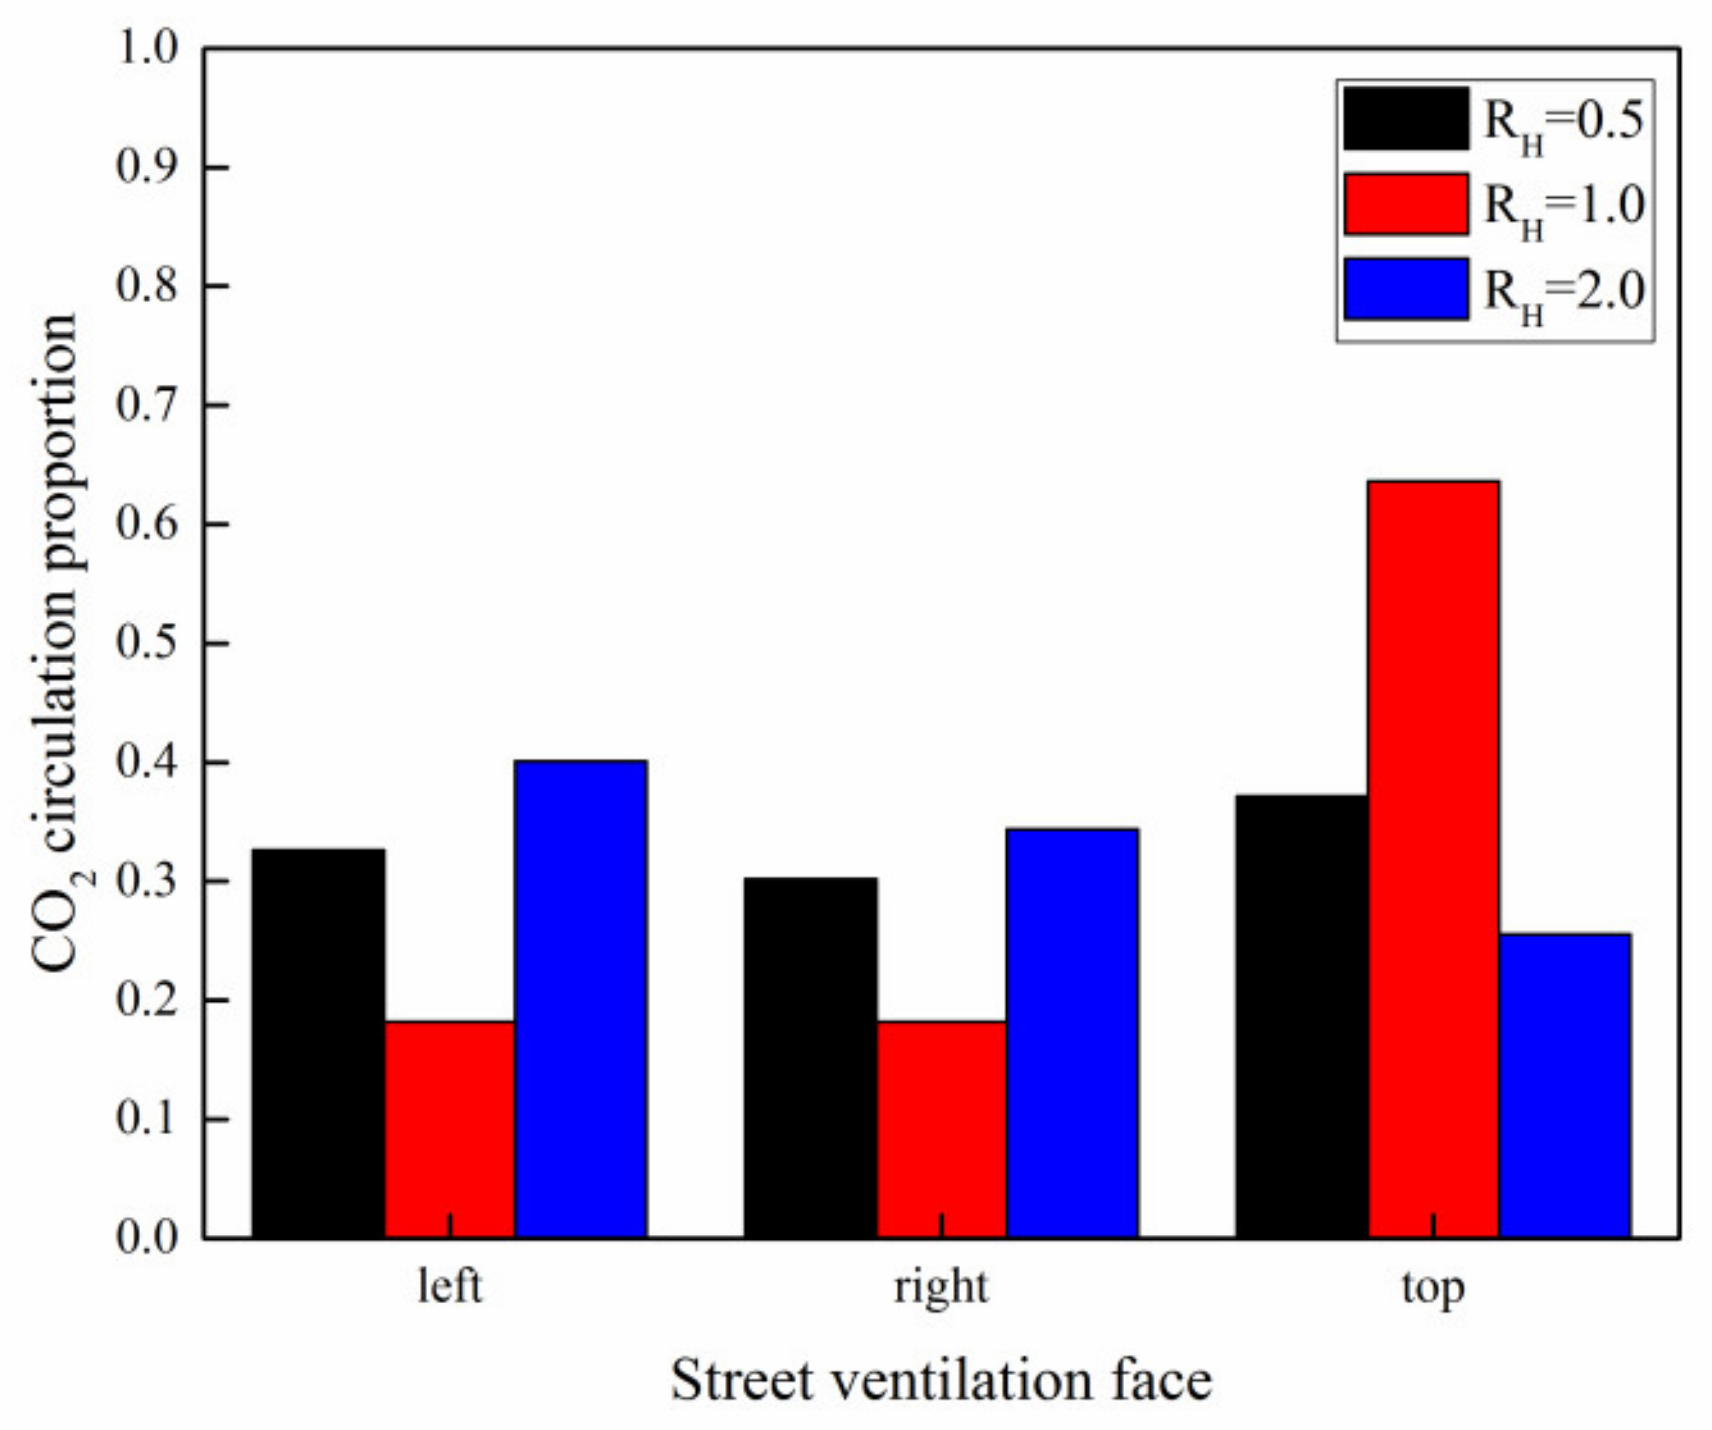
Figure 18 shows the flux proportion of pollutants per unit area of street ventilation surfaces with different height ratios. In contrast to the typical ideal street canyon, the pollutant flux ratios of each ventilation surface in the step-up or step-down street canyon are similar. However, as shown in Figure 17, a significant difference exists between the net pollutant flux of different terrains. Regarding the step-up street canyon, the pollutant flux ratio still conforms to the rule that the top is greater than the two ends, but the difference between the flux ratios is very small, indicating that the downstream higher building plays a leading role in intercepting pollutants. In addition, pollutants accumulate and circulate throughout the entire street canyon. On the contrary, for the step-down street canyon, pollutants are intercepted outside the upstream high building, and the net flux from each ventilation surface into the street canyon is very low, resulting in a similar phenomenon.
Figure 19 shows the time-averaged concentration fields of the wind tunnel experiment on the vertical plane in the middle of street buildings (y = 0) with different height ratios. 
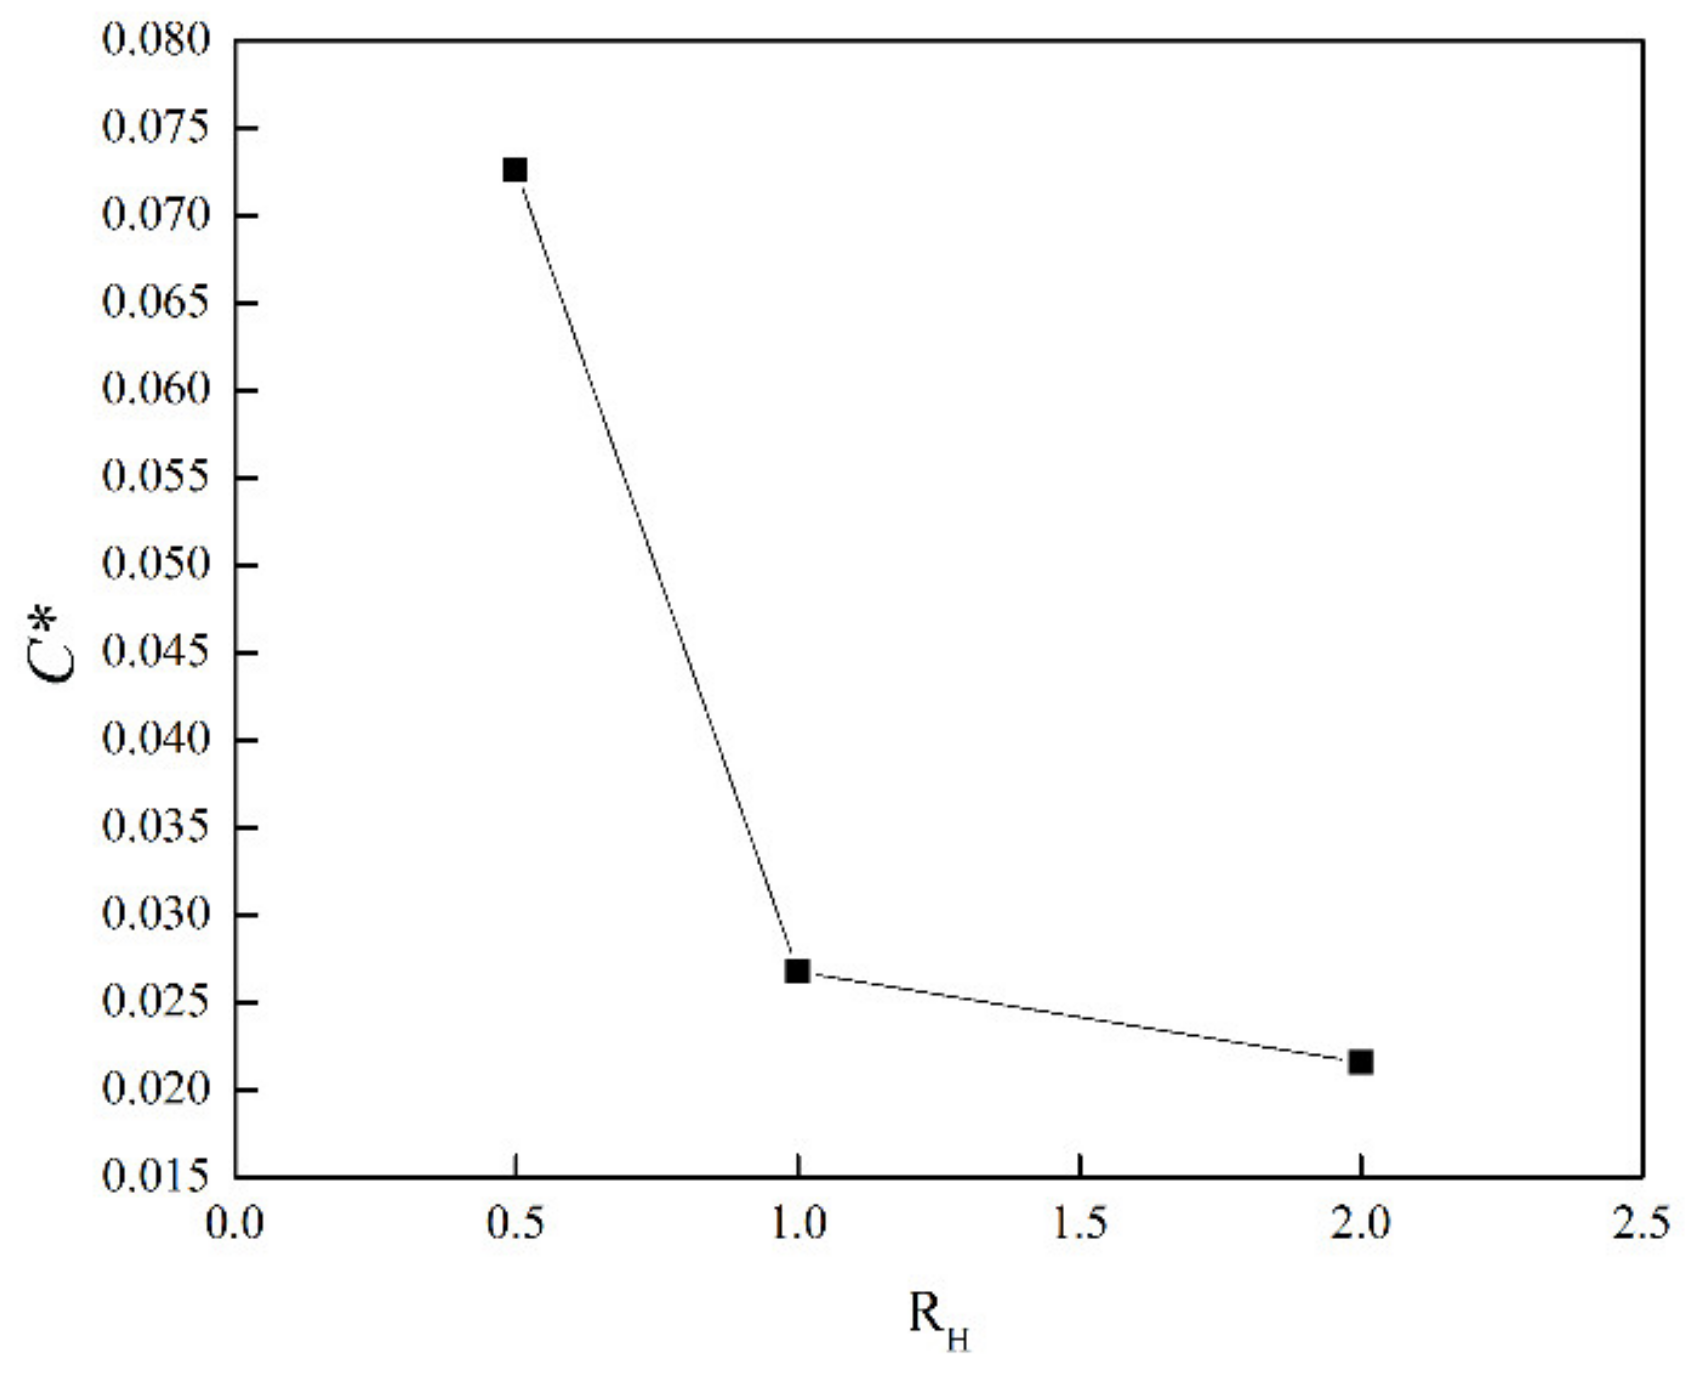
Figure 20 shows the relative concentration per unit area C* of the average concentration in the street canyon. The step-up street canyon can easily retain upstream pollutants because the internal concentration is significantly higher than that of the other two street canyons. In addition, the step-down street can effectively prevent the spread of pollutants, and its internal pollutant concentration is the lowest among the three configured street canyons.

4.3. Effects of Environmental Wind Speed of Street Canyon on Pollutant Dispersion

As the environmental wind speed changes, the flow fields around the street canyons do not change significantly. Therefore, no additional analysis was undertaken of the wind fields, and here we only discuss and study the dispersion of pollutants.
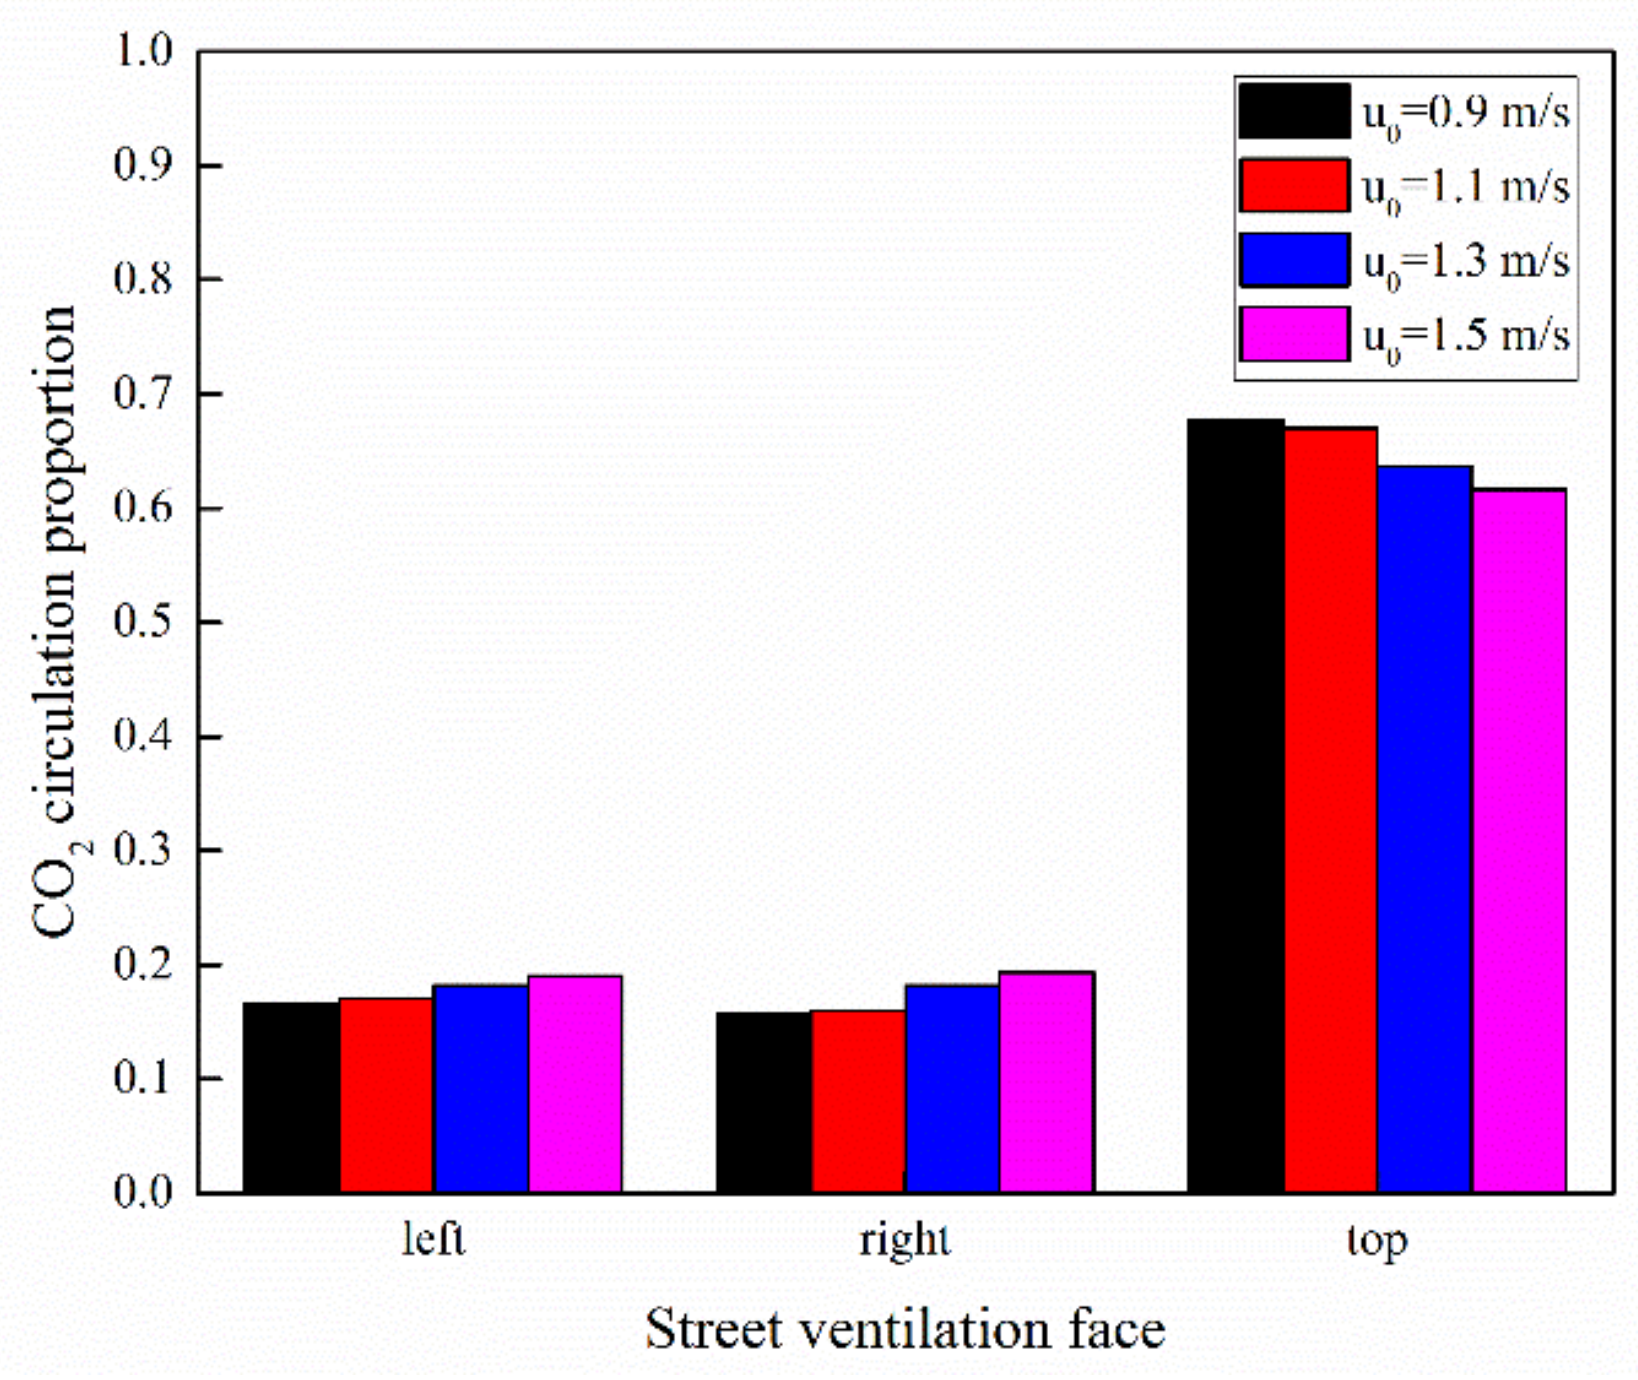
Figure 21 shows the flux proportion of pollutants per unit area of street ventilation surfaces under different characteristic wind speeds. In the case of changing environmental wind speed, the pollutant flux ratio on each ventilation surface in the street canyon changes regularly with the variation in the wind speed. The proportion of pollutants entering the street canyon from both ends grows with the increase in wind speed, whereas from the top, it decreases. Heavy-gas pollutants tend to bypass the buildings and diffuse laterally. However, when the building is long, the pollutants are forced to climb above it. Clearly, in the terrain of street canyons, pollutants are more likely to climb and spread. Therefore, the flux ratios on the top are dominant in almost all street canyons with different terrains. The climb and spread of pollutants are affected by many factors, including wind speed. In view of the upward release of pollutants, the initial momentum direction largely determines the height of the heavy gas pollutant plume. The growth in wind speed restrains the plume from rising, that is, reducing the height of the parabolic plume near the leakage source, making it more difficult for pollutants to climb over the buildings. As a result, the proportion of pollutants entering from the top of the street canyon is correspondingly reduced.
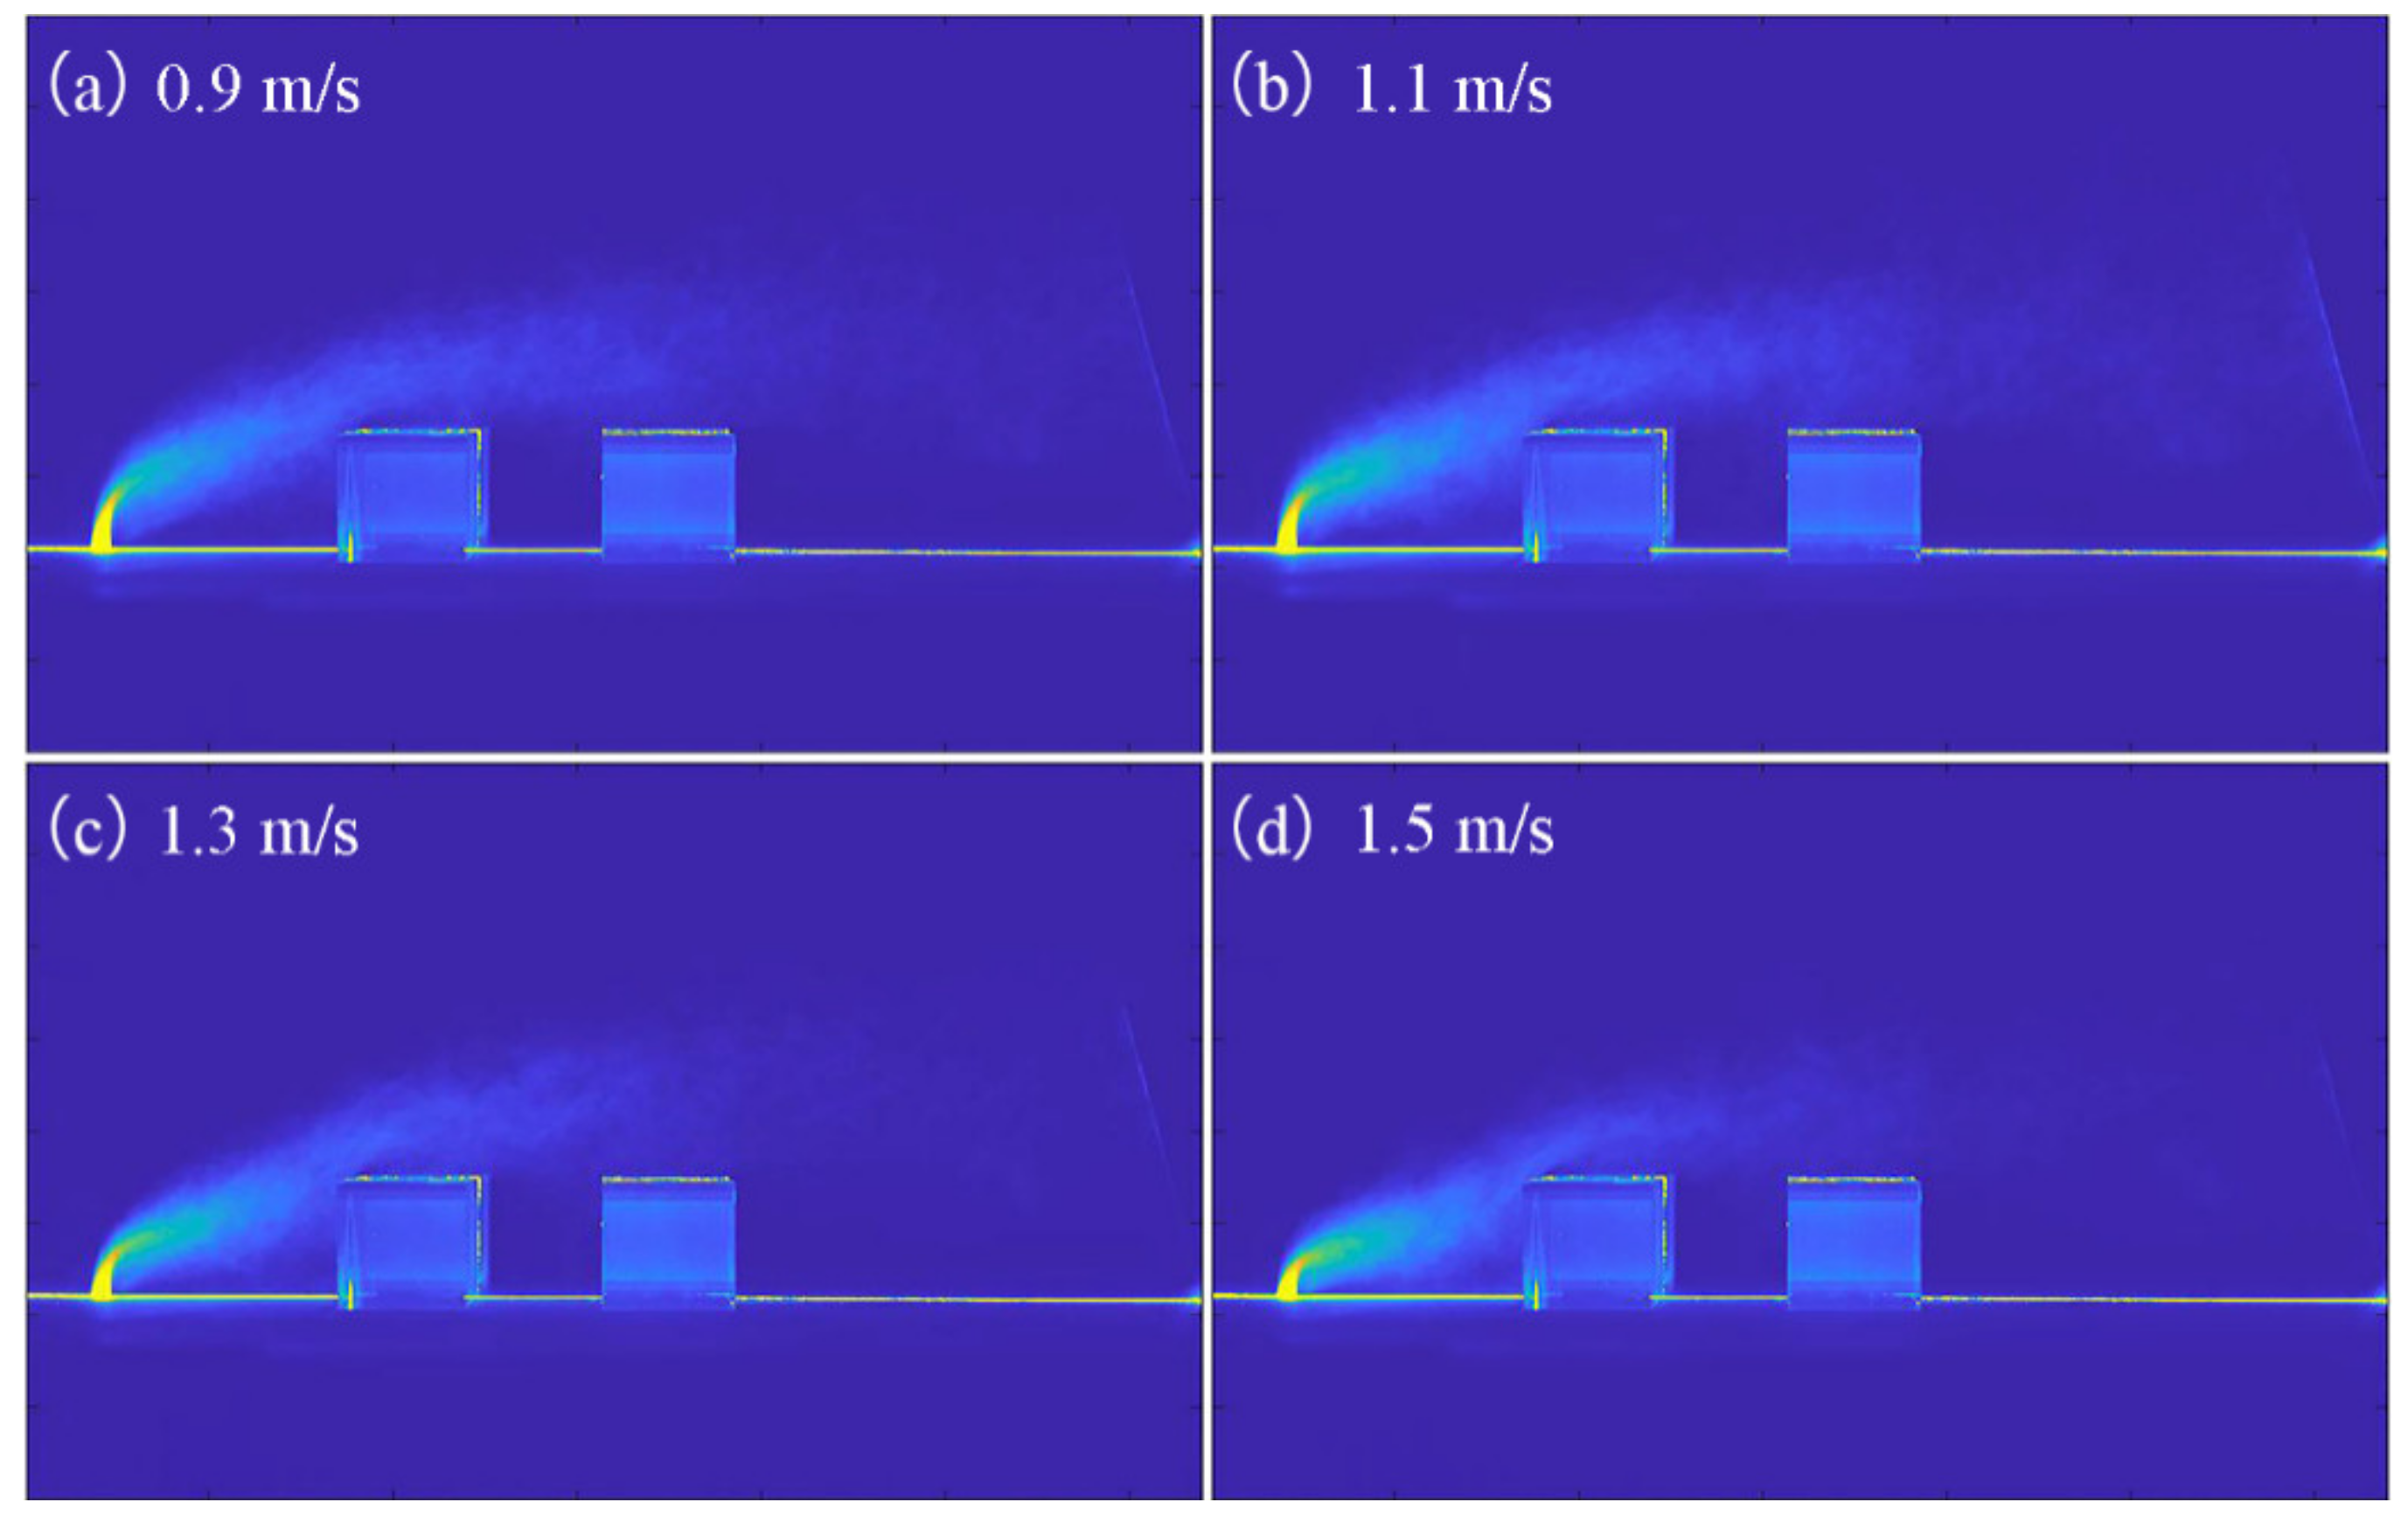
Figure 22 shows the time-averaged concentration fields of the wind tunnel experiment on the middle vertical plane of the typical ideal street canyon (y = 0) under different wind speeds. The distribution of pollutants under the four configurations is similar overall. The difference is that, as the environmental wind speed increases, the pollutant plume height declines, the pollutant dispersion speed increases, and the concentration at the plume tail decreases. The relative concentration per unit area C* in the street canyon first rises and then decreases with the increase in environmental wind speed, as shown in Figure 23. The impacts of increased environmental wind speed on the dispersion of pollutants are mainly reflected in two aspects. The increase in wind speed improves the pressure gap between the inside and outside of the street canyon, which intensifies air exchange and promotes the entry of pollutants. However, the dispersion of pollutants is also aggravated, making it difficult for pollutants to accumulate. The overall concentration of the plume within a certain volume is reduced, and the pollutants that can enter the canyon also decrease. Thus, the most unsafe wind speed exists when the leakage source is outside the street canyon, thereby maximizing the possible accumulation of pollutants in the street canyon. In this experiment, this unsafe wind speed was about 1.1 m/s.

5. Conclusions

This paper focused on the effect of street canyon terrain on the surrounding flow field and the dispersion of heavy gas pollutants, focusing on the impacts of various aspect and height ratios and different wind speeds in the typical ideal street canyon. Wind tunnel experiments and laser particle tracking technology were adopted to visualize the dispersion of pollutants, in combination with CFD simulation, to explore the manner in which pollutants enter street canyons. The following conclusions can be drawn:
(1) When the heights of the street buildings are equal, and only the aspect ratio changes, the impacts of buildings on both sides of the street on the wind field can be clearly expressed. However, when the building heights of the street are different, the effect of higher buildings on the surrounding flow field dominates, and determines the distribution of the vortex in the street canyon.
(2) Pollutants disperse mainly through the top of the street into the canyon inside. However, this proportion decreases with a lower street aspect ratio or a higher height ratio. In addition, the interception effect of the street canyon on the upstream pollutants then weakens, and the relative concentration per unit area C* also decreases.
(3) The growth of the environmental wind speed inhibits the initial upward momentum of pollutants, resulting in a decrease in the proportion of pollutants entering the street canyon from the top. Furthermore, the increase in environmental wind speed increases the pressure difference between the street canyon and outside, promoting the airflow circulation. However, it also aggravates the dispersion of pollutants and reduces the overall concentration of the plume. Therefore, the combined influence of positive and negative effects generates an unsafe wind speed that results in the highest concentration of pollutants inside the street canyon.

Author Contributions

Conceptualization, Data curation, Writing—original draft, Writing—review & editing, X.N. and Y.F.; Super-vision, Funding acquisition, Writing—review & editing, H.G. and Q.L. All authors have read and agreed to the published version of the manuscript.

Funding

The work was financially supported by the National Key R&D Program of China (No.2018YFC0808600).

Institutional Review Board Statement

Not applicable.

Informed Consent Statement

Not applicable.

Data Availability Statement

The data presented in this study are available on request from the corresponding author.

Conflicts of Interest

The authors declare no conflict of interest.

References

  1. Hu, W. Production Technology of Fluorine Chemical Industry(I); Science Press: Beijing, China, 2010; p. 1. (In Chinese) [Google Scholar]
  2. Law, W.P.; Erain, N.; Ramli, N.I.; Gimbun, J. Assessment of chlorine leak dispersion around Gebeng industrial area and potential evacuation route. Atmos. Res. 2019, 216, 117–129. [Google Scholar] [CrossRef]
  3. Li, J.; Zhang, B.; Tang, S.; Tong, R. Application of FLUENT in simulating outcomes from chlorine leakage accidents in a typical chemical factory. Toxicol. Ind. Health 2013, 32, 919–935. [Google Scholar] [CrossRef] [PubMed]
  4. Yang, S.; Jeon, K.; Kang, D.; Han, C. Accident analysis of the Gumi hydrogen fluoride gas leak using CFD and comparison with post-accidental environmental impacts. J. Loss Prevent. Proc. 2017, 48, 207–215. [Google Scholar] [CrossRef]
  5. Deaves, D.M. Dense gas dispersion modelling. J. Loss Prevent. Proc. 1992, 5, 219–227. [Google Scholar] [CrossRef]
  6. Rauchegger, C.; Bayley, S.; Schröder, V.; Thevenin, D. Dispersion of heavy gases-experimental results and numerical simulations. Process Saf. Prog. 2015, 34, 280–285. [Google Scholar] [CrossRef]
  7. Sklavounos, S.; Rigas, F. Validation of turbulence models in heavy gas dispersion over obstacles. J. Hazard. Mater. 2004, 108, 9–20. [Google Scholar] [CrossRef] [PubMed]
  8. Tan, W.; Wang, K.; Li, C.; Liu, L.; Wang, Y.; Zhu, G. Experimental and numerical study on the dispersion of heavy gases in urban environments. Process Saf. Environ. 2018, 116, 640–653. [Google Scholar] [CrossRef]
  9. Tan, W.; Li, C.; Wang, K.; Zhu, G.; Wang, Y.; Liu, L. Dispersion of carbon dioxide plume in street canyons. Process Saf. Environ. 2018, 116, 235–242. [Google Scholar] [CrossRef]
  10. Xin, B.; Wan, L.; Dang, W. Dynamic Simulation and Quantitative Risk Assessment of Indoor Heavy Gas Diffusion. J. Phys. Conf. Ser. 2020, 1549, 042080. [Google Scholar] [CrossRef]
  11. Mao, N.; Wang, Z.; Zhou, C.; Tong, X. Qualitative and Quantitative Investigation on Concentration of Indoor Dense Gas Caused by Leakage and Diffusion. Environ. Prog. Sustain. 2019, 38, 424–434. [Google Scholar] [CrossRef]
  12. Marucci, D.; Carpentieri, M. Effect of local and upwind stratification on flow and dispersion inside and above a bi-dimensional street canyon. Build. Environ. 2019, 156, 74–88. [Google Scholar] [CrossRef]
  13. Yang, R.; Zhang, J.; Shen, S.; Li, X.; Chen, J. Numerical Investigation of the Impact of Different Configurations and Aspect Ratios on Dense Gas Dispersion in Urban Street Canyons. Tsinghua Sci. Technol. 2007, 12, 345–351. [Google Scholar] [CrossRef]
  14. George, X.; Lim, A.; Gopalan, H.; Jing, L.; Poh, H.J. CFD Simulation of Chemical Gas Dispersion Under Atmospheric Boundary Conditions. Int. J. Comp. Meth. 2019, 16, 1940011. [Google Scholar]
  15. Fiates, J.; Santos, R.; Neto, F.F.; Francesconi, A.Z.; Simoes, V.; Vianna, S.S.V. An alternative CFD tool for gas dispersion modelling of heavy gas. J. Loss Prevent. Proc. 2016, 44, 583–593. [Google Scholar] [CrossRef]
  16. Garcia-Sanchez, C.; Tendeloo, G.V.; Gorle, C. Quantifying inflow uncertainties in RANS simulations of urban pollutant dispersion. Atmos. Environ. 2017, 161, 263–273. [Google Scholar] [CrossRef]
  17. Pontiggia, M.; Derudi, M.; Alba, M.; Scaioni, M.; Rota, R. Hazardous gas releases in urban areas: Assessment of consequences through CFD modelling. J. Hazard. Mater. 2010, 176, 589–596. [Google Scholar] [CrossRef]
  18. Ferreira, E.S.; Vianna, S. Large Eddy Simulation Combined with Equivalent Diameter for Turbulent Jet Modelling and Gas Dispersion. Braz. J. Chem. Eng. 2016, 33, 525–540. [Google Scholar] [CrossRef]
  19. Sávio, S.V.; Vianna, R. Stewart Cant. Modified porosity approach and laminar flamelet modelling for advanced simulation of accidental explosions. J. Loss Prev. Process. Ind. 2010, 23, 3–14. [Google Scholar]
  20. Ferreira, T.D.; Santos, R.G.; Vianna, S.S. A coupled finite volume method and Gilbert–Johnson–Keerthi distance algorithm for computational fluid dynamics modelling. Comput. Methods Appl. Mech. Eng. 2019, 352, 417–436. [Google Scholar] [CrossRef]
  21. GB/T 3840-1991. Technical Methods for Establishing Local Air Pollutant Emission Standards, National Standard of China. 1991. Available online: http://openstd.samr.gov.cn/bzgk/gb/newGbInfo?hcno=D308374668604004F828200717A3DB5C (accessed on 24 September 2021).
  22. Cui, P.Y.; Li, Z.; Tao, W.Q. Numerical investigations on Re-independence for the turbulent flow and pollutant dispersion under the urban boundary layer with some experimental validations. Int. J. Heat Mass Transf. 2017, 106, 422–436. [Google Scholar] [CrossRef] [Green Version]
  23. Ohba, M. Experimental studies for effects of separated flow on gaseous diffusion around two model buildings: Effects of flow conditions of oncoming flow. J. Archit. Plan. Environ. Eng. (Trans. AIJ) 1989, 406, 21–30. [Google Scholar]
  24. Luo, Q. Wind Tunnel Experimental Study on Air Pollutant Transportation and Dispersion for Hilly Terrain. Ph.D. Thesis, Tianjin University, Tianjin, China, 2008. [Google Scholar]
  25. Chan, T.L.; Dong, G.; Leung, C.W. Validation of a two-dimensional pollutant dispersion model in an isolated street canyon. Atmos. Environ. 2002, 36, 861–872. [Google Scholar] [CrossRef]
  26. Shi, T.; Ming, T.; Wu, Y.; Peng, C.; Richter, R.D. The effect of exhaust emissions from a group of moving vehicles on pollutant dispersion in the street canyons. Build. Environ. 2020, 181, 107120. [Google Scholar] [CrossRef]
  27. Chang, J.C.; Hanna, S.R. Technical Description and User’s Guide for the BOOT Statistical Model Evaluation Software Package, Version 2.0.; George Mason University and Harvard School of Public Health: Fairfax, VA, USA, 2005. [Google Scholar]
  28. Jiang, G.; Yoshie, R. Side ratio effects on flow and pollutant dispersion around an isolated high-rise building in a turbulent boundary layer. Build. Environ. 2020, 180, 107078. [Google Scholar] [CrossRef]
  29. Barros, D.; Borée, J.; Noack, B.R.; Spohn, A.; Ruiz, T. Bluff Body Drag Manipulation Using Pulsed Jets and Coanda Effect. J. Fluid Mech. 2016, 805, 422. [Google Scholar] [CrossRef] [Green Version]
  30. Posa, A.; Oresta, P.; Lippolis, A. Analysis of a directional hydraulic valve by a Direct Numerical Simulation using an immersed-boundary method. Energy Convers. Manag. 2013, 65, 497–506. [Google Scholar] [CrossRef]
Figure 1. TULTWT DC wind tunnel.
Processes 09 01754 g001
Figure 2. Experimental wind speed and fitting result.
Processes 09 01754 g002
Figure 3. (a) Grayscale picture of instantaneous concentration field, (b) grayscale picture of average concentration field, (c) comparison of numerical simulations and experimental results.
Processes 09 01754 g003
Figure 4. (a) Typical ideal street canyon model; (b) grid independent verification.
Processes 09 01754 g004
Figure 5. Time-averaged streamlines and pressure contours on the horizontal plane (z/H = 0.01) of streets with different aspect ratios: (a) Rw = 2.0; (b) Rw = 1.0; (c) Rw = 0.5.
Processes 09 01754 g005
Figure 6. Time-averaged streamlines and flow velocity contours on the horizontal plane (z/H = 0.5) of streets with different aspect ratios: (a) Rw = 2.0; (b) Rw = 1.0; (c) Rw = 0.5.
Processes 09 01754 g006
Figure 7. Time-averaged streamlines and flow velocity contours on the vertical plane (y = 0) of streets with different aspect ratios: (a) Rw = 2.0; (b) Rw = 1.0; (c) Rw = 0.5.
Processes 09 01754 g007
Figure 8. Instantaneous concentration fields on the vertical plane (y = 0) of streets with different aspect ratio: (a) Rw = 2.0; (b) Rw = 1.0; (c) Rw = 0.5.
Processes 09 01754 g008
Figure 9. Street canyon ventilation (red translucent).
Processes 09 01754 g009
Figure 10. Contours of street ventilation surfaces with different aspect ratios: (a) Rw = 2.0; (b) Rw = 1.0; (c) Rw = 0.5.
Processes 09 01754 g010
Figure 11. Flux proportion of pollutant per unit area of street ventilation surfaces with different aspect ratios.
Processes 09 01754 g011
Figure 12. Time-averaged concentration fields on the vertical plane (y = 0) with different aspect ratio streets: (a) Rw = 2.0; (b) Rw = 1.0; (c) Rw = 0.5.
Processes 09 01754 g012
Figure 13. Relative concentration per unit area C* on the vertical plane (y = 0) with different aspect ratio streets.
Processes 09 01754 g013
Figure 14. Time-averaged streamlines and flow velocity contours on the horizontal plane (z = 0) of streets with different height ratios: (a) RH = 0.5; (b) RH = 1.0; (c) RH = 2.0.
Processes 09 01754 g014
Figure 15. Time-averaged streamlines and flow velocity contours on the horizontal plane (z/H = 0.5) of streets with different height ratios: (a) RH = 0.5; (b) RH = 1.0; (c) RH = 2.0.
Processes 09 01754 g015
Figure 16. Time-averaged streamlines and pressure contours on the vertical plane (y = 0) of streets with different height ratios: (a) RH = 0.5; (b) RH = 1.0; (c) RH = 2.0.
Processes 09 01754 g016
Figure 17. Contours of street ventilation surfaces with different height ratios: (a) RH = 0.5; (b) RH = 1.0; (c) RH = 2.0.
Processes 09 01754 g017
Figure 18. Flux proportion of pollutants per unit area of street ventilation surfaces with different height ratios.
Processes 09 01754 g018
Figure 19. Time-averaged concentration fields on the vertical plane (y = 0) with different height ratios streets: (a) RH = 2.0; (b) RH = 1.0; (c) RH = 0.5.
Processes 09 01754 g019
Figure 20. Relative concentration per unit area C* on the vertical plane (y = 0) of streets with different height ratios.
Processes 09 01754 g020
Figure 21. Flux proportion of pollutants per unit area of street ventilation surfaces with different characteristic wind speeds.
Processes 09 01754 g021
Figure 22. Time-averaged concentration fields on the vertical plane (y = 0) of a typical ideal street with different characteristic wind speeds: (a) u0 = 0.9 m/s; (b) u0 = 1.1 m/s; (c) u0 = 1.3 m/s; (d) u0 = 1.5 m/s.
Processes 09 01754 g022
Figure 23. Relative concentration per unit area C* on the vertical plane (y = 0) of the typical ideal street with different characteristic wind speeds.
Processes 09 01754 g023
Table 1. Wind profile index α under different atmospheric stability conditions.
ABCDE, F
City0.100.150.200.250.30
Rural0.070.070.100.150.25
Publisher’s Note: MDPI stays neutral with regard to jurisdictional claims in published maps and institutional affiliations.

